
Relationship of Anthropometric Indicators of General and Abdominal Obesity with Hypertension and Their Predictive Performance among Albanians: A Nationwide Cross-Sectional Study

 ,
,  ,
,
Abstract
:1. Introduction
2. Materials and Methods
2.1. Study Population
2.2. BP Measurement and Definition of Hypertension
2.3. Anthropometric Assessment and Calculation of Indicators
2.4. Assessment of Covariates
2.5. Statistical Analysis
2.6. Ethics Statement
3. Results
4. Discussion
5. Conclusions
Supplementary Materials
Author Contributions
Funding
Institutional Review Board Statement
Informed Consent Statement
Data Availability Statement
Conflicts of Interest
References
- Murray, C.J.L.; Aravkin, A.Y.; Zheng, P.; Abbafati, C.; Abbas, K.M.; Abbasi-Kangevari, M.; Abd-Allah, F.; Abdelalim, A.; Abdollahi, M.; Abdollahpour, I.; et al. Global Burden of 87 Risk Factors in 204 Countries and Territories, 1990–2019: A Systematic Analysis for the Global Burden of Disease Study 2019. Lancet 2020, 396, 1223–1249. [Google Scholar] [CrossRef]
- Kearney, P.M.; Whelton, M.; Reynolds, K.; Muntner, P.; Whelton, P.K.; He, J. Global Burden of Hypertension: Analysis of Worldwide Data. Lancet 2005, 365, 217–223. [Google Scholar] [CrossRef]
- Mills, K.T.; Bundy, J.D.; Kelly, T.N.; Reed, J.E.; Kearney, P.M.; Reynolds, K.; Chen, J.; He, J. Global Disparities of Hypertension Prevalence and Control: A Systematic Analysis of Population-Based Studies From 90 Countries. Circulation 2016, 134, 441–450. [Google Scholar] [CrossRef] [PubMed]
- Stanaway, J.D.; Afshin, A.; Gakidou, E.; Lim, S.S.; Abate, D.; Abate, K.H.; Abbafati, C.; Abbasi, N.; Abbastabar, H.; Abd-Allah, F.; et al. Global, Regional, and National Comparative Risk Assessment of 84 Behavioural, Environmental and Occupational, and Metabolic Risks or Clusters of Risks for 195 Countries and Territories, 1990–2017: A Systematic Analysis for the Global Burden of Disease Study 2017. Lancet 2018, 392, 1923–1994. [Google Scholar] [CrossRef] [Green Version]
- Forouzanfar, M.H.; Afshin, A.; Alexander, L.T.; Anderson, H.R.; Bhutta, Z.A.; Biryukov, S.; Brauer, M.; Burnett, R.; Cercy, K.; Charlson, F.J.; et al. Global, Regional, and National Comparative Risk Assessment of 79 Behavioural, Environmental and Occupational, and Metabolic Risks or Clusters of Risks, 1990–2015: A Systematic Analysis for the Global Burden of Disease Study 2015. Lancet 2016, 388, 1659–1724. [Google Scholar] [CrossRef] [Green Version]
- Jayedi, A.; Rashidy-Pour, A.; Khorshidi, M.; Shab-Bidar, S. Body Mass Index, Abdominal Adiposity, Weight Gain and Risk of Developing Hypertension: A Systematic Review and Dose-Response Meta-Analysis of More than 2.3 Million Participants: Adiposity and Risk of Hypertensione. Obes. Rev. 2018, 19, 654–667. [Google Scholar] [CrossRef]
- Rush, E.C.; Freitas, I.; Plank, L.D. Body Size, Body Composition and Fat Distribution: Comparative Analysis of European, Maori, Pacific Island and Asian Indian Adults. Br. J. Nutr. 2009, 102, 632–641. [Google Scholar] [CrossRef]
- Okorodudu, D.; Jumean, M.; Montori, V.; Romero-Corral, A.; Somers, V.; Erwin, P.; Lopez-Jimenez, F. Diagnostic Performance of Body Mass Index to Identify Obesity as Defined by Body Adiposity: A Systematic Review and Meta-Analysis. Int. J. Obes. 2010, 34, 791–799. [Google Scholar] [CrossRef] [Green Version]
- Ashwell, M.; Gunn, P.; Gibson, S. Waist-to-Height Ratio Is a Better Screening Tool than Waist Circumference and BMI for Adult Cardiometabolic Risk Factors: Systematic Review and Meta-Analysis. Obes. Rev. 2012, 13, 275–286. [Google Scholar] [CrossRef]
- Valdez, R. A Simple Model-Based Index of Abdominal Adiposity. J. Clin. Epidemiol. 1991, 44, 955–956. [Google Scholar] [CrossRef]
- Rossi, L.; Freiberg, C.K. Prevalence of High Coronary Risk by the Conicity Index in Economically Active Individuals in São Paulo. Rev. Bras. Nutr. Clin. 2012, 27, 106–111. [Google Scholar]
- Hernández-Vásquez, A.; Azañedo, D.; Vargas-Fernández, R.; Aparco, J.P.; Chaparro, R.M.; Santero, M. Cut-off Points of Anthropometric Markers Associated with Hypertension and Diabetes in Peru: Demographic and Health Survey 2018. Public Health Nutr. 2020, 24, 611–621. [Google Scholar] [CrossRef] [PubMed]
- Motamed, N.; Perumal, D.; Zamani, F.; Ashrafi, H.; Haghjoo, M.; Saeedian, F.S.; Maadi, M.; Akhavan-Niaki, H.; Rabiee, B.; Asouri, M. Conicity Index and Waist-to-Hip Ratio Are Superior Obesity Indices in Predicting 10-Year Cardiovascular Risk Among Men and Women: Obesity Indices and 10-Year CV Risk. Clin. Cardiol. 2015, 38, 527–534. [Google Scholar] [CrossRef] [PubMed]
- Burazeri, G.; Qirjako, G.; Beaney, T.; Ster, A.C.; Xia, X.; Ylli, A.; Muja, H.; Cumashi, R.; Dika, Q.; Roshi, E.; et al. May Measurement Month 2018: An Analysis of Blood Pressure Screening Results from Albania. Eur. Heart J. Suppl. 2020, 22, H5–H7. [Google Scholar] [CrossRef]
- Institute of Statistics, Institute of Public Health, and ICF. Albania Demographic and Health Survey 2017–2018; Institute of Statistics, Institute of Public Health, and ICF: Tirana, Albania; Rockville, ML, USA, 2018; p. i448. [Google Scholar]
- Mancia, G.; Rosei, E.A.; Azizi, M.; Burnier, M.; Clement, D.L.; Coca, A.; de Simone, G.; Dominiczak, A.; Kahan, T.; Mahfoud, F.; et al. 2018 ESC/ESH Guidelines for the Management of Arterial Hypertension. Eur. Heart J. 2018, 39, 3021–3104. [Google Scholar] [CrossRef]
- World Health Organization. Obesity: Preventing and Managing the Global Epidemic: Report of a WHO Consultation; WHO Technical Report Series; WHO: Switzerland, Geneva, 2000; ISBN 978-92-4-120894-9. [Google Scholar]
- Cleveland, W.S. Robust Locally Weighted Regression and Smoothing Scatterplots. J. Am. Stat. Assoc. 1979, 74, 829–836. [Google Scholar] [CrossRef]
- DeLong, E.R.; DeLong, D.M.; Clarke-Pearson, D.L. Comparing the Areas under Two or More Correlated Receiver Operating Characteristic Curves: A Nonparametric Approach. Biometrics 1988, 44, 837–845. [Google Scholar] [CrossRef] [PubMed]
- Fluss, R.; Faraggi, D.; Reiser, B. Estimation of the Youden Index and Its Associated Cutoff Point. Biom. J. 2005, 47, 458–472. [Google Scholar] [CrossRef] [Green Version]
- Panagiotakos, D.B.; Chrysohoou, C.; Pitsavos, C.; Skoumas, J.; Lentzas, Y.; Katinioti, A.; Stefanadis, C. Hierarchical Analysis of Anthropometric Indices in the Prediction of 5-Year Incidence of Hypertension in Apparently Healthy Adults: The ATTICA Study. Atherosclerosis 2009, 206, 314–320. [Google Scholar] [CrossRef]
- Landi, F.; Calvani, R.; Picca, A.; Tosato, M.; Martone, A.M.; Ortolani, E.; Sisto, A.; D’Angelo, E.; Serafini, E.; Desideri, G.; et al. Body Mass Index Is Strongly Associated with Hypertension: Results from the Longevity Check-up 7+ Study. Nutrients 2018, 10, 1976. [Google Scholar] [CrossRef] [Green Version]
- Janghorbani, M.; Aminorroaya, A.; Amini, M. Comparison of Different Obesity Indices for Predicting Incident Hypertension. High. Blood Press. Cardiovasc. Prev. 2017, 24, 157–166. [Google Scholar] [CrossRef]
- Kuwabara, M.; Kuwabara, R.; Niwa, K.; Hisatome, I.; Smits, G.; Roncal-Jimenez, C.; MacLean, P.; Yracheta, J.; Ohno, M.; Lanaspa, M.; et al. Different Risk for Hypertension, Diabetes, Dyslipidemia, and Hyperuricemia According to Level of Body Mass Index in Japanese and American Subjects. Nutrients 2018, 10, 1011. [Google Scholar] [CrossRef] [PubMed] [Green Version]
- Hossain, F.B.; Adhikary, G.; Chowdhury, A.B.; Shawon, M.S.R. Association between Body Mass Index (BMI) and Hypertension in South Asian Population: Evidence from Nationally-Representative Surveys. Clin. Hypertens. 2019, 25, 28. [Google Scholar] [CrossRef] [PubMed] [Green Version]
- Maenhaut, N.; Van de Voorde, J. Regulation of Vascular Tone by Adipocytes. BMC Med. 2011, 9, 25. [Google Scholar] [CrossRef] [PubMed] [Green Version]
- Dorresteijn, J.A.N.; Visseren, F.L.J.; Spiering, W. Mechanisms Linking Obesity to Hypertension: Obesity-Related Hypertension. Obes. Rev. 2012, 13, 17–26. [Google Scholar] [CrossRef] [PubMed]
- Dalton, M.; Cameron, A.J.; Zimmet, P.Z.; Shaw, J.E.; Jolley, D.; Dunstan, D.W.; Welborn, T.A.; AusDiab Steering Committee. Waist Circumference, Waist-Hip Ratio and Body Mass Index and Their Correlation with Cardiovascular Disease Risk Factors in Australian Adults. J. Intern. Med. 2003, 254, 555–563. [Google Scholar] [CrossRef]
- Sakurai, M.; Miura, K.; Takamura, T.; Ota, T.; Ishizaki, M.; Morikawa, Y.; Kido, T.; Naruse, Y.; Nakagawa, H. Gender Differences in the Association between Anthropometric Indices of Obesity and Blood Pressure in Japanese. Hypertens. Res. 2006, 29, 75–80. [Google Scholar] [CrossRef] [Green Version]
- Chen, Z.; Smith, M.; Du, H.; Guo, Y.; Clarke, R.; Bian, Z.; Collins, R.; Chen, J.; Qian, Y.; Wang, X.; et al. Blood Pressure in Relation to General and Central Adiposity among 500,000 Adult Chinese Men and Women. Int. J. Epidemiol. 2015, 44, 1305–1319. [Google Scholar] [CrossRef] [Green Version]
- Velez, M.P.; Rosendaal, N.; Alvarado, B.; da Câmara, S.; Belanger, E.; Pirkle, C. Age at Natural Menopause and Physical Function in Older Women from Albania, Brazil, Colombia and Canada: A Life-Course Perspective. Maturitas 2019, 122, 22–30. [Google Scholar] [CrossRef] [Green Version]
- Santoro, N. Perimenopause: From Research to Practice. J. Women’s Health 2016, 25, 332–339. [Google Scholar] [CrossRef] [Green Version]
- Burger, H.G.; Dudley, E.C.; Cui, J.; Dennerstein, L.; Hopper, J.L. A Prospective Longitudinal Study of Serum Testosterone, Dehydroepiandrosterone Sulfate, and Sex Hormone-Binding Globulin Levels through the Menopause Transition. J. Clin. Endocrinol. Metab. 2000, 85, 2832–2838. [Google Scholar] [CrossRef]
- Freeman, E.W.; Sammel, M.D.; Lin, H.; Gracia, C.R. Obesity and Reproductive Hormone Levels in the Transition to Menopause. Menopause 2010, 17, 718–726. [Google Scholar] [CrossRef] [Green Version]
- Janssen, I.; Powell, L.H.; Jasielec, M.S.; Kazlauskaite, R. Covariation of Change in Bioavailable Testosterone and Adiposity in Midlife Women: Testosterone and Adiposity. Obesity 2015, 23, 488–494. [Google Scholar] [CrossRef]
- Abdulnour, J.; Doucet, É.; Brochu, M.; Lavoie, J.-M.; Strychar, I.; Rabasa-Lhoret, R.; Prud’homme, D. The Effect of the Menopausal Transition on Body Composition and Cardiometabolic Risk Factors: A Montreal-Ottawa New Emerging Team Group Study. Menopause 2012, 19, 760–767. [Google Scholar] [CrossRef]
- Chen, Y.; Zhang, Z.; Wang, J.; Sun, H.; Zhao, X.; Cheng, X.; Zhao, Q. Sex Differences in the Association of Abdominal Adipose Tissue and Anthropometric Data with Untreated Hypertension in a Chinese Population. Biol. Sex. Differ. 2020, 11, 38. [Google Scholar] [CrossRef]
- Seven, E.; Thuesen, B.H.; Linneberg, A.; Jeppesen, J.L. Abdominal Adiposity Distribution Quantified by Ultrasound Imaging and Incident Hypertension in a General Population. Hypertension 2016, 68, 1115–1122. [Google Scholar] [CrossRef] [Green Version]
- Ambikairajah, A.; Walsh, E.; Tabatabaei-Jafari, H.; Cherbuin, N. Fat Mass Changes during Menopause: A Metaanalysis. Am. J. Obstet. Gynecol. 2019, 221, 393–409. [Google Scholar] [CrossRef] [PubMed]
- Cochran, J.M.; Siebert, V.R.; Bates, J.; Butulija, D.; Kolpakchi, A.; Kadiyala, H.; Taylor, A.; Jneid, H. The Relationship between Adult Height and Blood Pressure. Cardiology 2021, 146, 345–350. [Google Scholar] [CrossRef] [PubMed]
- Decoda Study Group; Nyamdorj, R. BMI Compared with Central Obesity Indicators in Relation to Diabetes and Hypertension in Asians. Obesity 2008, 16, 1622–1635. [Google Scholar] [CrossRef] [PubMed] [Green Version]
- Deng, G.; Yin, L.; Liu, W.; Liu, X.; Xiang, Q.; Qian, Z.; Ma, J.; Chen, H.; Wang, Y.; Hu, B.; et al. Associations of Anthropometric Adiposity Indexes with Hypertension Risk: A Systematic Review and Meta-Analysis Including PURE-China. Medicine 2018, 97, e13262. [Google Scholar] [CrossRef]
- Silva, D.A.S.; Petroski, E.L.; Peres, M.A. Accuracy and Measures of Association of Anthropometric Indexes of Obesity to Identify the Presence of Hypertension in Adults: A Population-Based Study in Southern Brazil. Eur. J. Nutr. 2013, 52, 237–246. [Google Scholar] [CrossRef]
- Ononamadu, C.J.; Ezekwesili, C.N.; Onyeukwu, O.F.; Umeoguaju, U.F.; Ezeigwe, O.C.; Ihegboro, G.O. Comparative Analysis of Anthropometric Indices of Obesity as Correlates and Potential Predictors of Risk for Hypertension and Prehypertension in a Population in Nigeria. CVJA 2017, 28, 92–99. [Google Scholar] [CrossRef]
- de Oliveira, C.M.; Ulbrich, A.Z.; Neves, F.S.; Dias, F.A.L.; Horimoto, A.R.V.R.; Krieger, J.E.; Alvim, R.d.O.; Pereira, A.d.C. Association between Anthropometric Indicators of Adiposity and Hypertension in a Brazilian Population: Baependi Heart Study. PLoS ONE 2017, 12, e0185225. [Google Scholar] [CrossRef] [Green Version]
- Battie, C.A.; Borja-Hart, N.; Ancheta, I.B.; Flores, R.; Rao, G.; Palaniappan, L. Comparison of Body Mass Index, Waist Circumference, and Waist to Height Ratio in the Prediction of Hypertension and Diabetes Mellitus: Filipino-American Women Cardiovascular Study. Prev. Med. Rep. 2016, 4, 608–613. [Google Scholar] [CrossRef] [Green Version]
- Khader, Y.; Batieha, A.; Jaddou, H.; El-Khateeb, M.; Ajlouni, K. The Performance of Anthropometric Measures to Predict Diabetes Mellitus and Hypertension among Adults in Jordan. BMC Public Health 2019, 19, 1416. [Google Scholar] [CrossRef] [PubMed] [Green Version]
- Lear, S.A.; Humphries, K.H.; Kohli, S.; Chockalingam, A.; Frohlich, J.J.; Birmingham, C.L. Visceral Adipose Tissue Accumulation Differs According to Ethnic Background: Results of the Multicultural Community Health Assessment Trial (M-CHAT). Am. J. Clin. Nutr. 2007, 86, 353–359. [Google Scholar] [CrossRef]
- Nazare, J.-A.; Smith, J.D.; Borel, A.-L.; Haffner, S.M.; Balkau, B.; Ross, R.; Massien, C.; Alméras, N.; Després, J.-P. Ethnic Influences on the Relations between Abdominal Subcutaneous and Visceral Adiposity, Liver Fat, and Cardiometabolic Risk Profile: The International Study of Prediction of Intra-Abdominal Adiposity and Its Relationship with Cardiometabolic Risk/Intra-Abdominal Adiposity. Am. J. Clin. Nutr. 2012, 96, 714–726. [Google Scholar] [CrossRef] [PubMed] [Green Version]
- Zhang, J.; Zhu, W.; Qiu, L.; Huang, L.; Fang, L. Sex- and Age-Specific Optimal Anthropometric Indices as Screening Tools for Metabolic Syndrome in Chinese Adults. Int. J. Endocrinol. 2018, 2018, 1–16. [Google Scholar] [CrossRef] [PubMed]
- Lee, J.-W.; Lim, N.-K.; Baek, T.-H.; Park, S.-H.; Park, H.-Y. Anthropometric Indices as Predictors of Hypertension among Men and Women Aged 40–69 Years in the Korean Population: The Korean Genome and Epidemiology Study. BMC Public Health 2015, 15, 140. [Google Scholar] [CrossRef] [PubMed] [Green Version]
- Alberti, K.G.M.M.; Zimmet, P.; Shaw, J. Metabolic Syndrome-a New World-Wide Definition. A Consensus Statement from the International Diabetes Federation. Diabet. Med. 2006, 23, 469–480. [Google Scholar] [CrossRef]
- Di Angelantonio, E.; Bhupathiraju, S.N.; Wormser, D.; Gao, P.; Kaptoge, S.; de Gonzalez, A.B.; Cairns, B.J.; Huxley, R.; Jackson, C.L.; Joshy, G.; et al. Body-Mass Index and All-Cause Mortality: Individual-Participant-Data Meta-Analysis of 239 Prospective Studies in Four Continents. Lancet 2016, 388, 776–786. [Google Scholar] [CrossRef] [Green Version]
- Rosengren, A.; Smyth, A.; Rangarajan, S.; Ramasundarahettige, C.; Bangdiwala, S.I.; AlHabib, K.F.; Avezum, A.; Bengtsson Boström, K.; Chifamba, J.; Gulec, S.; et al. Socioeconomic Status and Risk of Cardiovascular Disease in 20 Low-Income, Middle-Income, and High-Income Countries: The Prospective Urban Rural Epidemiologic (PURE) Study. Lancet Glob. Health 2019, 7, e748–e760. [Google Scholar] [CrossRef] [Green Version]
- Niaksu, O.; Kodra, P.; Pina, M.; Grabenweger, J. Implementation of Nationwide Electronic Health Record in Albania: A Case Study. Stud. Health Technol. Inf. 2017, 236, 111–120. [Google Scholar]
- Whelton, P.K. The Elusiveness of Population-Wide High Blood Pressure Control. Annu. Rev. Public Health 2015, 36, 109–130. [Google Scholar] [CrossRef] [PubMed]
- Jackson, C.; Herber-Gast, G.-C.; Brown, W. Joint Effects of Physical Activity and BMI on Risk of Hypertension in Women: A Longitudinal Study. J. Obes. 2014, 2014, 1–7. [Google Scholar] [CrossRef] [Green Version]

| Characteristics | Unweighted Frequency | Weighted Frequency | Non-Hypertensive Weighted % (95% CI) or Weighted Mean (SD) | Hypertensive Weighted % (95% CI) or Weighted Mean (SD) |
|---|---|---|---|---|
| Overall | 20,635 | 19,591 | 71.4 (70.8–72.0) | 28.6 (28.0–29.2) |
| Age (years) | ||||
| 15–19 | 2354 | 2253 | 93.4 (92.4–94.5) | 6.6 (5.5–7.6) |
| 20–29 | 4187 | 4318 | 89.3 (88.3–90.2) | 10.7 (9.8–11.7) |
| 30–39 | 3882 | 3645 | 82.8 (81.6–84.1) | 17.2 (15.9–18.4) |
| 40–49 | 4587 | 4215 | 64.7 (63.3–66.2) | 35.3 (33.8–36.7) |
| 50–59 | 5625 | 5160 | 44.1 (42.8–45.5) | 55.9 (54.5–57.2) |
| Sex | ||||
| Female | 14,718 | 10,248 | 71.7 (70.8–72.6) | 28.3 (27.4–29.2) |
| Male | 5917 | 9343 | 71.1 (70.1–72.0) | 29.0 (28.0–29.9) |
| Household wealth | ||||
| Poorest | 6794 | 4753 | 67.7 (66.3–69.0) | 32.3 (31.0–33.7) |
| Middle-status | 6879 | 6029 | 69.2 (68.0–70.3) | 30.8 (29.7–32.0) |
| Richest | 6962 | 8809 | 74.9 (74.0–75.8) | 25.1 (24.2–26.0) |
| Educational status | ||||
| Primary or below | 9675 | 7953 | 65.5 (64.5–66.6) | 34.5 (33.4–35.5) |
| Secondary | 7741 | 7925 | 71.2 (70.2–72.2) | 28.8 (27.8–29.8) |
| Above secondary | 3210 | 3701 | 84.4 (83.2–85.6) | 15.6 (14.4–16.8) |
| Residence | ||||
| Urban | 9479 | 11,249 | 73.2 (72.3–74.0) | 26.8 (26.0–27.7) |
| Rural | 11,156 | 8342 | 69.0 (68.0–70.0) | 31.0 (30.0–32.0) |
| Self-reported Diabetes | ||||
| Yes | 324 | 312 | 27.9 (22.9–32.9) | 72.1 (67.1–77.1) |
| No | 20,311 | 19,279 | 72.1 (71.5–72.7) | 27.9 (27.3–28.5) |
| H/O smoking | ||||
| Smoker | 2479 | 3786 | 69.4 (67.9–70.9) | 30.6 (29.1–32.1) |
| Nonsmoker | 18,156 | 15,805 | 71.9 (71.2–72.6) | 28.1 (27.4–28.8) |
| H/O alcohol consumption | ||||
| Yes | 6559 | 8483 | 70.8 (69.8–71.7) | 29.2 (28.3–30.2) |
| No | 14,076 | 11,108 | 71.8 (71.0–72.7) | 28.2 (27.3–29.0) |
| Body mass index (BMI, kg/m2) | 20,231 | 18,950 | 25.50 (4.58) | 28.84 (5.19) |
| BMI categories | ||||
| Underweight (<18.5) | 499 | 473 | 92.4 (90.0–94.8) | 7.6 (5.2–10.0) |
| Normal (18.5–24.9) | 8164 | 7606 | 84.0 (83.2–84.8) | 16.0 (15.2–16.8) |
| Overweight (25.0–29.9) | 7087 | 6848 | 67.9 (66.8–69.0) | 32.1 (31.0–33.2) |
| Obese (≥30) | 4481 | 4023 | 50.5 (49.0–52.1) | 49.5 (47.9–51.0) |
| Waist circumference (WC, cm) | 20,072 | 18,693 | 85.00 (13.99) | 93.96 (13.46) |
| WC (cm) quartiles | ||||
| Quartile 1 (< 75) | 4454 | 3626 | 89.2 (88.1–90.2) | 10.8 (9.8–11.9) |
| Quartile 2 (75–85) | 4972 | 4380 | 80.6 (79.4–81.8) | 19.4 (18.2–20.6) |
| Quartile 3 (85–96) | 5588 | 5544 | 68.1 (66.9–69.4) | 31.9 (30.6–33.1) |
| Quartile 4 (>96) | 5058 | 5143 | 53.4 (52.1–54.8) | 46.5 (45.2–47.9) |
| Waist-to-height ratio (WHtR) | 20,039 | 18,650 | 0.51 (0.09) | 0.57 (0.09) |
| WHtR quartiles | ||||
| Quartile 1 (<0.46) | 4765 | 4317 | 88.2 (87.2–89.1) | 11.8 (10.9–12.8) |
| Quartile 2 (0.46–0.52) | 5085 | 4872 | 78.9 (77.7–80.0) | 21.1 (20.0–22.3) |
| Quartile 3 (0.52–0.58) | 4596 | 4420 | 67.6 (66.2–68.9) | 32.4 (31.1–33.8) |
| Quartile 4 (>0.58) | 5593 | 5041 | 52.1 (50.7–53.5) | 47.9 (46.5–49.3) |
| Conicity index (CI) | 20,000 | 18,633 | 1.20 (0.13) | 1.25 (0.12) |
| CI quartiles | ||||
| Quartile 1 (<1.12) | 4933 | 4168 | 83.9 (82.9–85.1) | 16.1 (14.9–17.2) |
| Quartile 2 (1.12–1.20) | 4818 | 4277 | 77.3 (76.0–78.6) | 22.7 (21.4–24.0) |
| Quartile 3 (1.20–1.29) | 5341 | 5202 | 67.6 (66.4–68.9) | 32.4 (31.1–33.6) |
| Quartile 4 (>1.29) | 4908 | 4986 | 58.7 (57.4–60.1) | 41.3 (39.9–42.6) |
| Variables | All | Male | Female | |||
|---|---|---|---|---|---|---|
| Crude OR (95% CI) | Adjusted 1 OR (95% CI) | Crude OR (95% CI) | Adjusted 2 OR (95% CI) | Crude OR (95% CI) | Adjusted 2 OR (95% CI) | |
| BMI (kg/m2) categories | ||||||
| Underweight (<18.5) | 0.43(0.26–0.70) * | 0.87 (0.51–1.48) | 0.57 (0.23–1.39) | 1.03 (0.38–2.76) | 0.38 (0.20–0.65) | 0.91 (0.49–1.71) |
| Normal (18.5–24.9) | Ref. | Ref. | Ref. | Ref. | Ref. | Ref. |
| Overweight (25.0–29.9) | 2.59 (2.33–2.87) * | 1.48 (1.30–1.68) * | 2.21 (1.85–2.64) * | 1.50 (1.24–1.81) * | 2.73 (2.41–3.09) * | 1.36 (1.17–1.56) * |
| Obese (≥30) | 5.92 (5.23–6.70) * | 2.37 (2.05–2.74) * | 3.33 (2.65–4.19) * | 1.83 (1.45–2.32) * | 7.18 (6.25–8.25) * | 2.72 (2.32–3.19) * |
| Waist circumference (cm) quartiles | ||||||
| Q1 (<75) | Ref. | Ref. | Ref. | Ref. | Ref. | Ref. |
| Q2 (75–85) | 1.98 (1.69–2.32) * | 1.32 (1.10–1.59) * | 1.42 (1.03–1.94) * | 1.08 (0.78–1.50) | 2.34 (1.96–2.80) * | 1.30 (1.03–1.64) * |
| Q3 (85–96) | 3.84 (3.30–4.47) * | 1.90 (1.56–2.30) * | 2.61 (1.92–3.56) * | 1.54 (1.09–2.18) * | 4.89 (4.14–5.76) * | 1.74 (1.40–2.16) * |
| Q4 (>96) | 7.15 (6.07–8.41) * | 2.69 (2.22–3.26) * | 4.25 (3.12–5.78) * | 1.95 (1.38–2.75) * | 10.88 (9.19–12.88) * | 2.94 (2.36–3.65) * |
| Waist-to-height ratio categories | ||||||
| Q1 (<0.46) | Ref. | Ref. | Ref. | Ref. | Ref. | Ref. |
| Q2 (0.46–0.52) | 2.00 (1.70–2.36) * | 1.30 (1.06–1.59) * | 1.86 (1.44–2.41) * | 1.38 (1.03–1.84) * | 2.03 (1.66–2.47) * | 1.08 (0.84–1.38) |
| Q3 (0.52–0.58) | 3.59 (3.07–4.20) * | 1.63 (1.33–2.01) * | 3.17 (2.47–4.07) * | 1.70 (1.25–2.32) * | 3.98 (3.31–4.78) * | 1.42 (1.10–1.80) * |
| Q4 (>0.58) | 6.87 (5.87–8.03) * | 2.36 (1.95–2.86) * | 4.32 (3.35–5.56) * | 1.91 (1.42–2.57) * | 10.07 (8.46–11.98) * | 2.46 (1.96–3.07) * |
| Conicity index quartiles | ||||||
| Q1 (<1.12) | Ref. | Ref. | Ref. | Ref. | Ref. | Ref. |
| Q2 (1.12–1.20) | 1.54 (1.33–1.78) * | 1.20 (1.02–1.41) * | 1.20 (0.92–1.56) | 1.05 (0.80–1.46) | 1.83 (1.56–2.18) * | 1.24 (1.02–1.50) * |
| Q3 (1.20–1.29) | 2.50 (2.17–2.90) * | 1.43 (1.21–1.69) * | 1.79 (1.40–2.30) * | 1.25 (0.95–1.66) | 3.24 (2.76–3.81) * | 1.44 (1.18–1.76) * |
| Q4 (>1.29) | 3.67 (3.19–4.23) * | 1.62 (1.38–1.89) * | 2.47 (1.93–3.16) * | 1.34 (1.02–1.74) * | 5.25 (4.30–6.13) * | 1.79 (1.48–2.13) * |
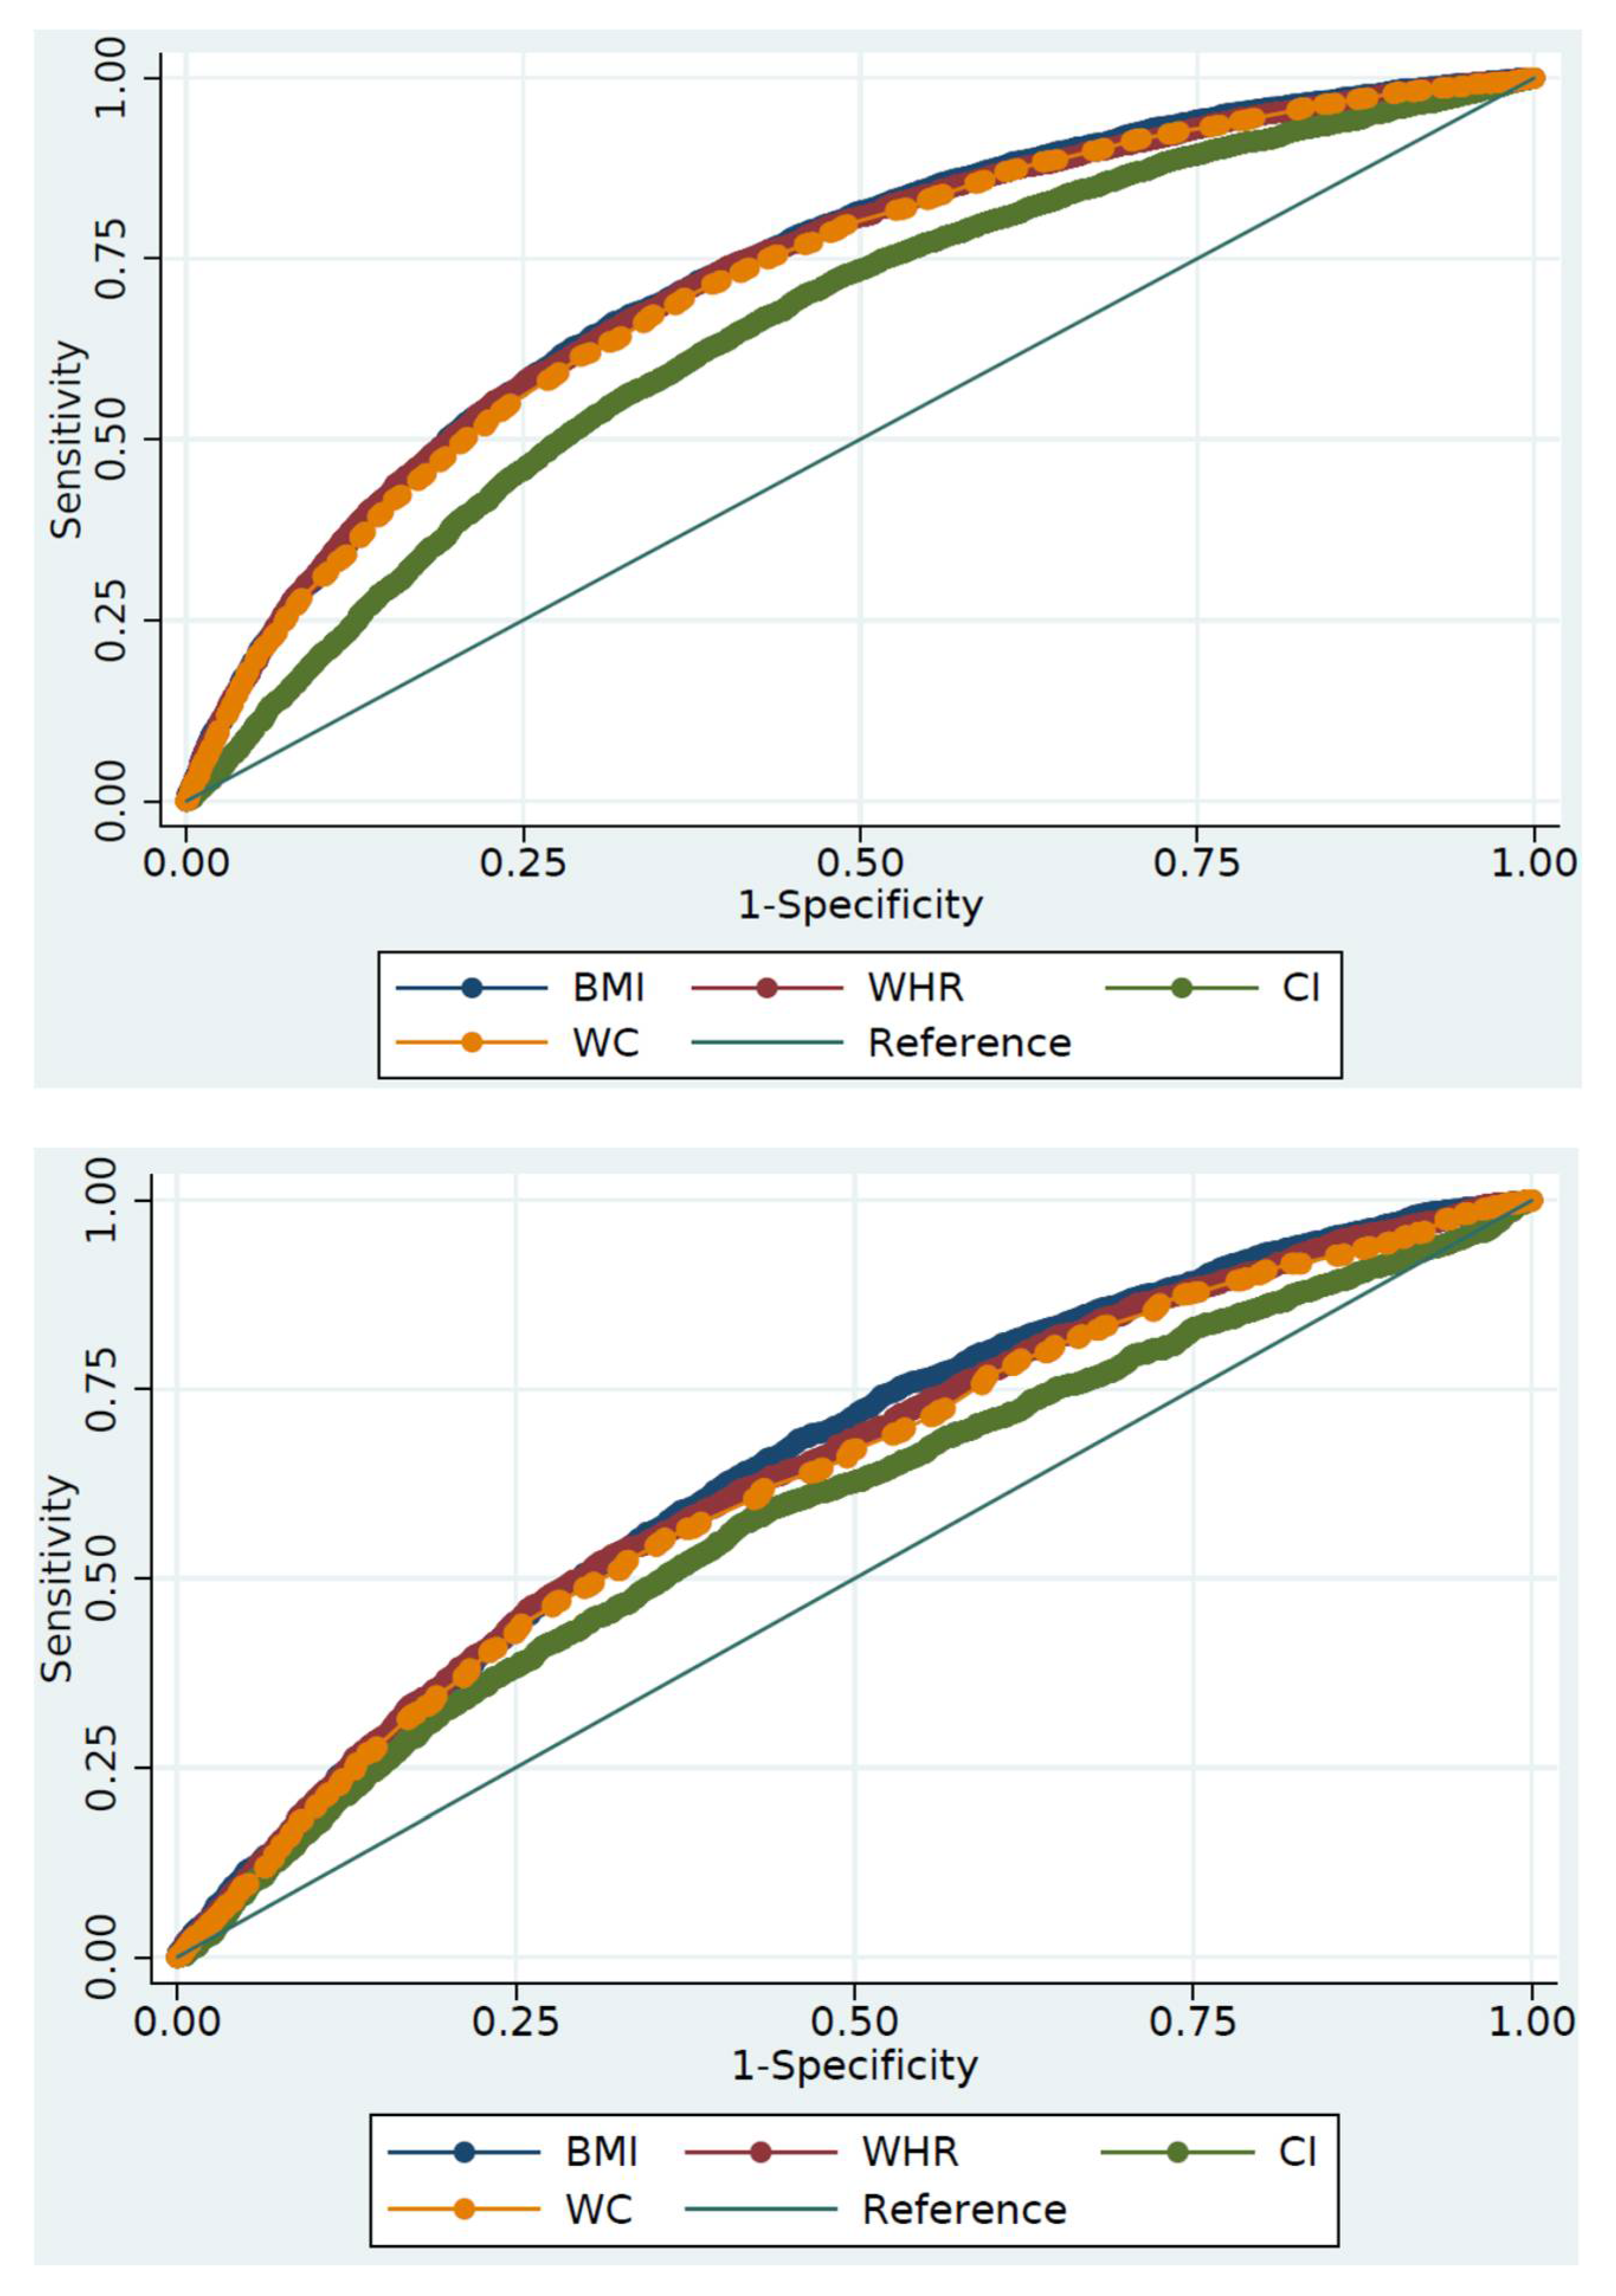
| Indicators | AUC (95% CI) | p-Value 1 | Youden’s Index | Optimal Cut-Off | Sensitivity (%) | Specificity (%) |
|---|---|---|---|---|---|---|
| Females | ||||||
| BMI (kg/m2) | 0.729 (0.720–0.738) | Ref. | 0.343 | 27.01 | 66.1 | 68.2 |
| WC (cm) | 0.718 (0.709–0.727) | <0.001 | 0.327 | 91.05 | 67.1 | 65.6 |
| WHtR | 0.725 (0.716–0.734) | 0.279 | 0.338 | 0.53 | 74.0 | 59.9 |
| CI | 0.653 (0.643–0.663) | <0.001 | 0.242 | 1.24 | 70.1 | 54.0 |
| Males | ||||||
| BMI (kg/m2) | 0.648 (0.633–0.663) | Ref. | 0.223 | 25.64 | 68.4 | 53.9 |
| WC (cm) | 0.626 (0.611–0.642) | 0.002 | 0.192 | 86.25 | 55.3 | 64.0 |
| WHtR | 0.637 (0.622–0.652) | 0.227 | 0.209 | 0.54 | 52.2 | 68.8 |
| CI | 0.589 (0.573–0.605) | <0.001 | 0.156 | 1.19 | 57.9 | 57.7 |
Publisher’s Note: MDPI stays neutral with regard to jurisdictional claims in published maps and institutional affiliations. |
© 2021 by the authors. Licensee MDPI, Basel, Switzerland. This article is an open access article distributed under the terms and conditions of the Creative Commons Attribution (CC BY) license (https://creativecommons.org/licenses/by/4.0/).
Share and Cite
Islam, M.R.; Moinuddin, M.; Saqib, S.M.; Rahman, S.M. Relationship of Anthropometric Indicators of General and Abdominal Obesity with Hypertension and Their Predictive Performance among Albanians: A Nationwide Cross-Sectional Study. Nutrients 2021, 13, 3373. https://doi.org/10.3390/nu13103373
Islam MR, Moinuddin M, Saqib SM, Rahman SM. Relationship of Anthropometric Indicators of General and Abdominal Obesity with Hypertension and Their Predictive Performance among Albanians: A Nationwide Cross-Sectional Study. Nutrients. 2021; 13(10):3373. https://doi.org/10.3390/nu13103373
Chicago/Turabian StyleIslam, Mohammad Redwanul, Md Moinuddin, Samaha Masroor Saqib, and Syed Moshfiqur Rahman. 2021. "Relationship of Anthropometric Indicators of General and Abdominal Obesity with Hypertension and Their Predictive Performance among Albanians: A Nationwide Cross-Sectional Study" Nutrients 13, no. 10: 3373. https://doi.org/10.3390/nu13103373