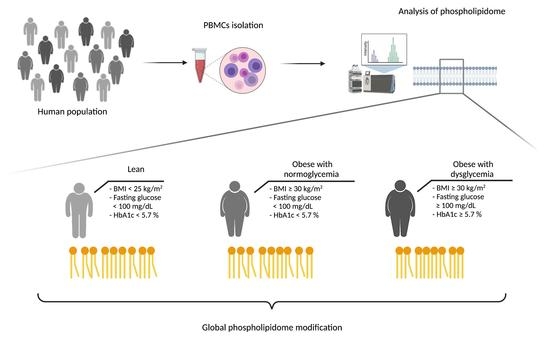
New Insights on the PBMCs Phospholipidome in Obesity Demonstrate Modulations Associated with Insulin Resistance and Glycemic Status
Abstract
:1. Introduction
2. Materials and Methods
2.1. Participants
2.2. Sample Preparation
2.3. Lipid Extraction
2.4. Mass Spectrometry
2.5. Lipidomic Statistical Analysis
3. Results
3.1. Anthropometric, Clinical and Biological Characteristics of the Study Population
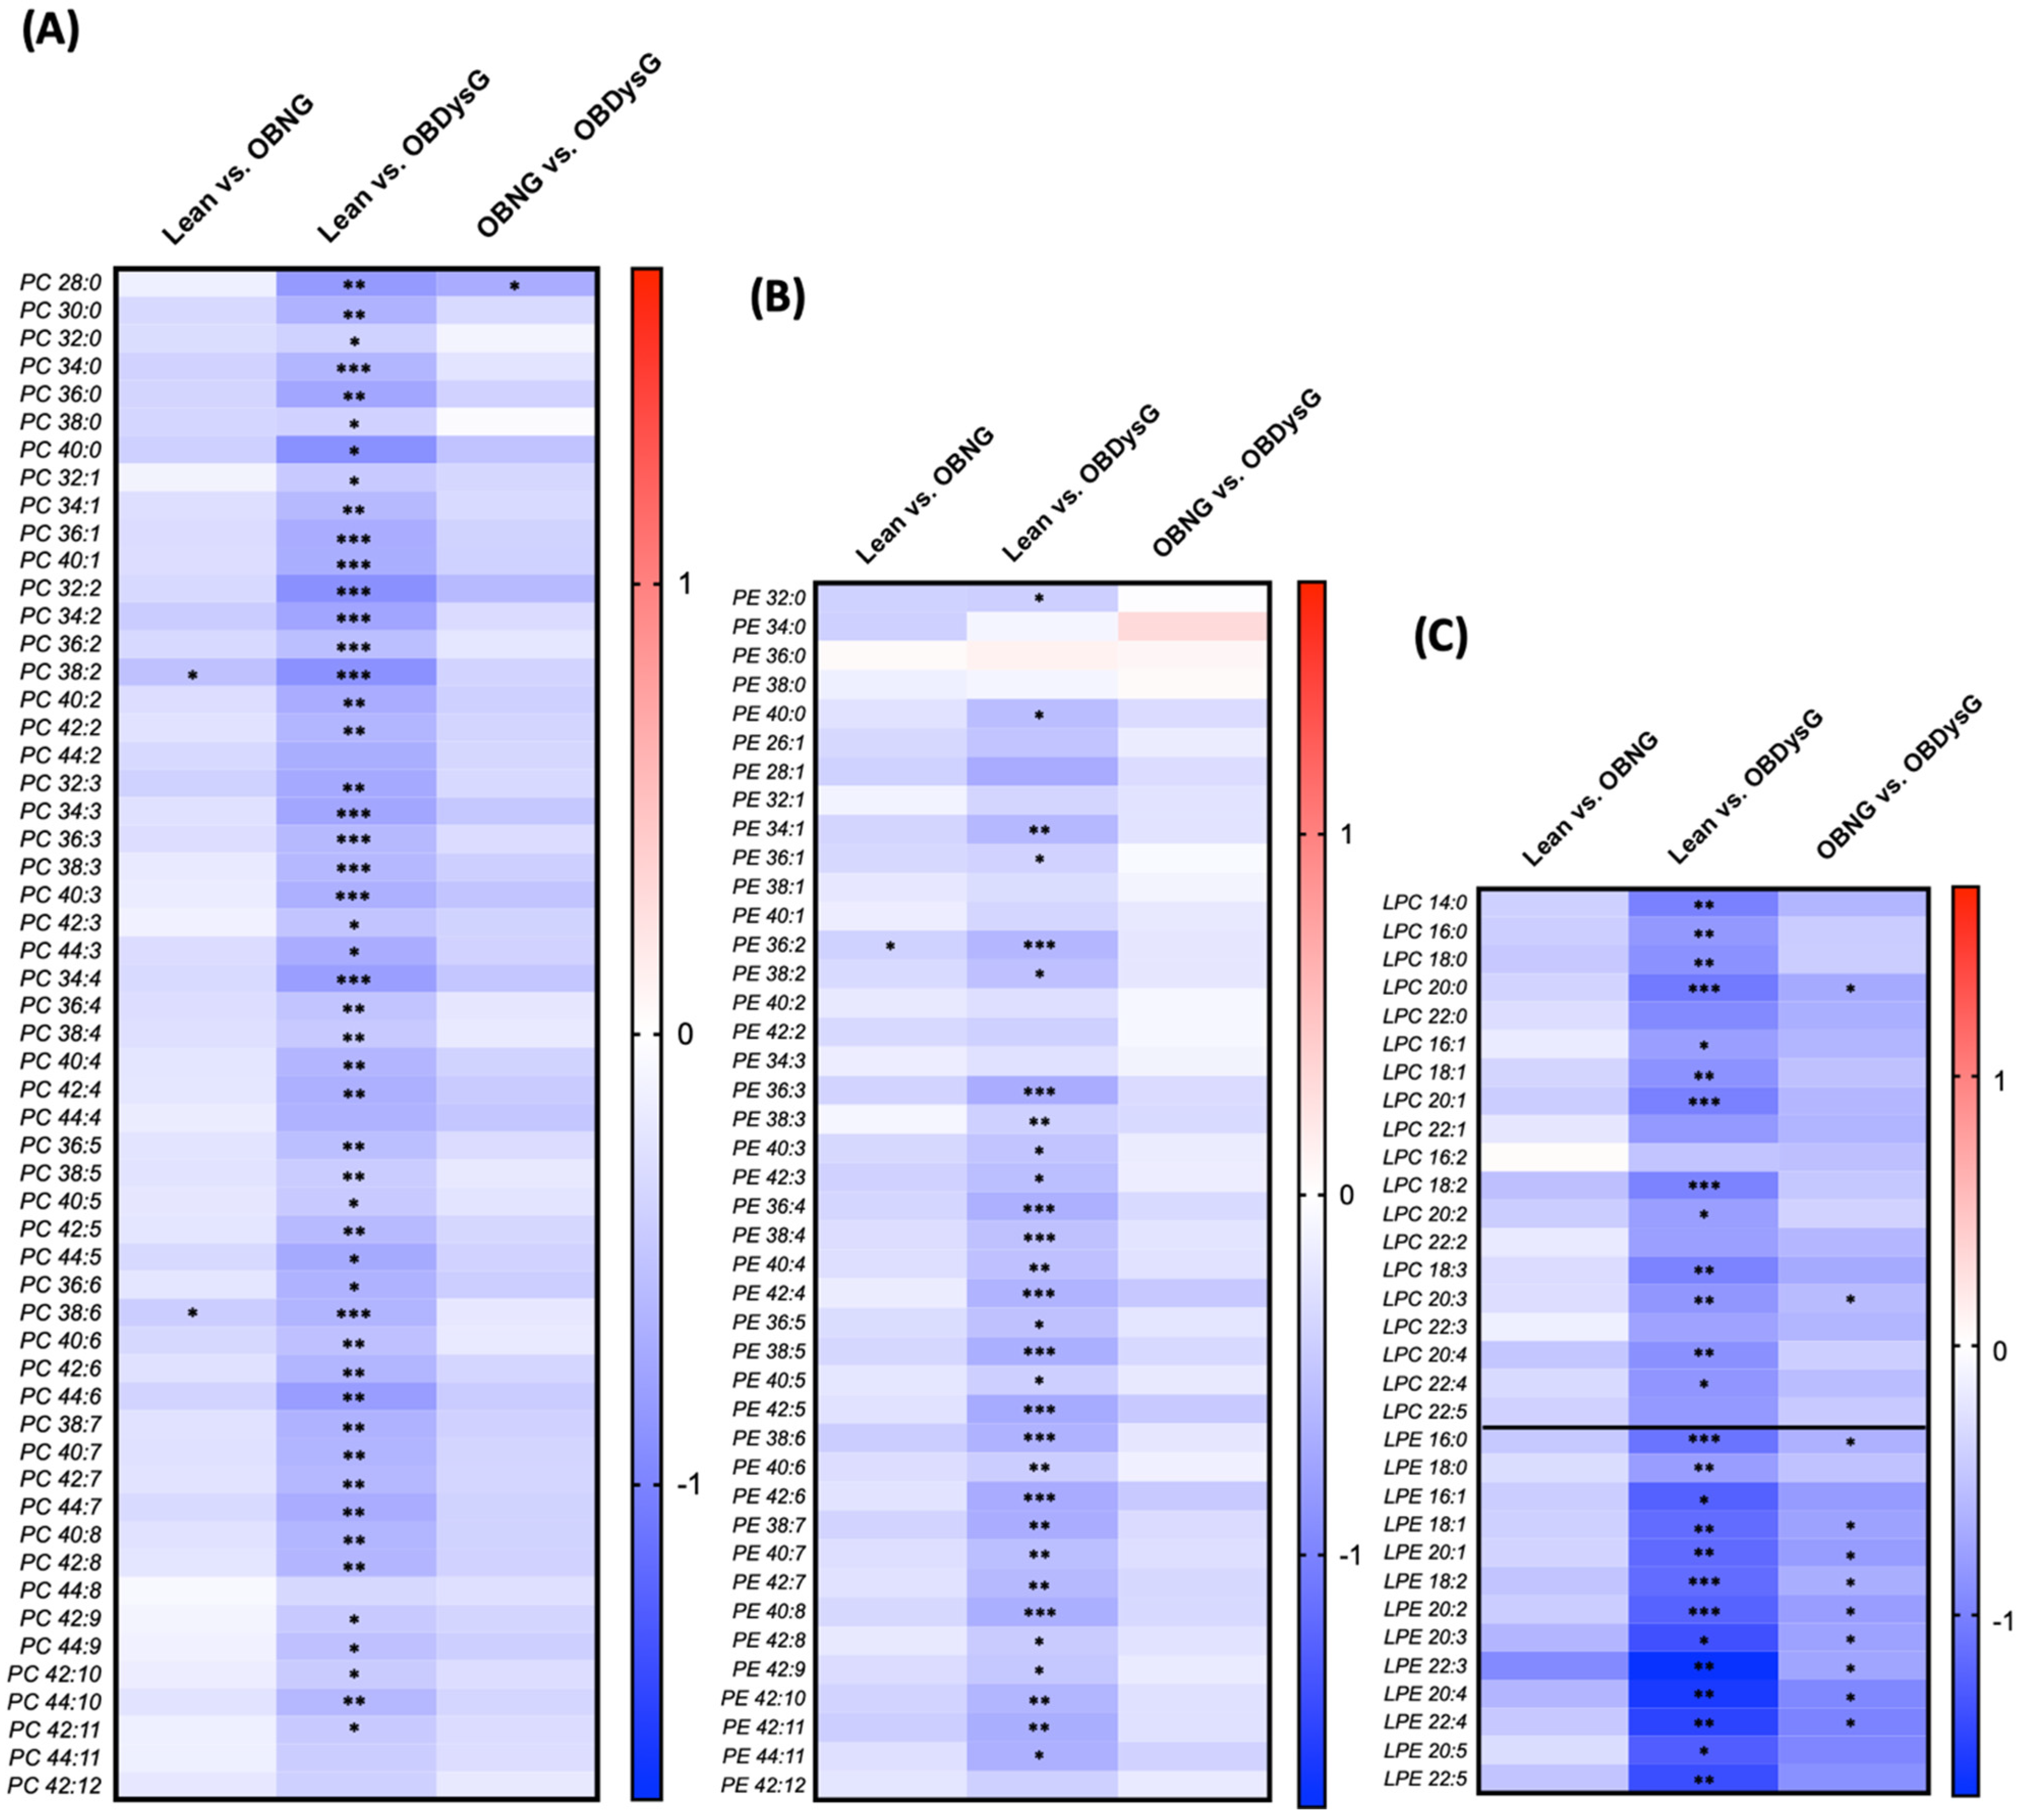
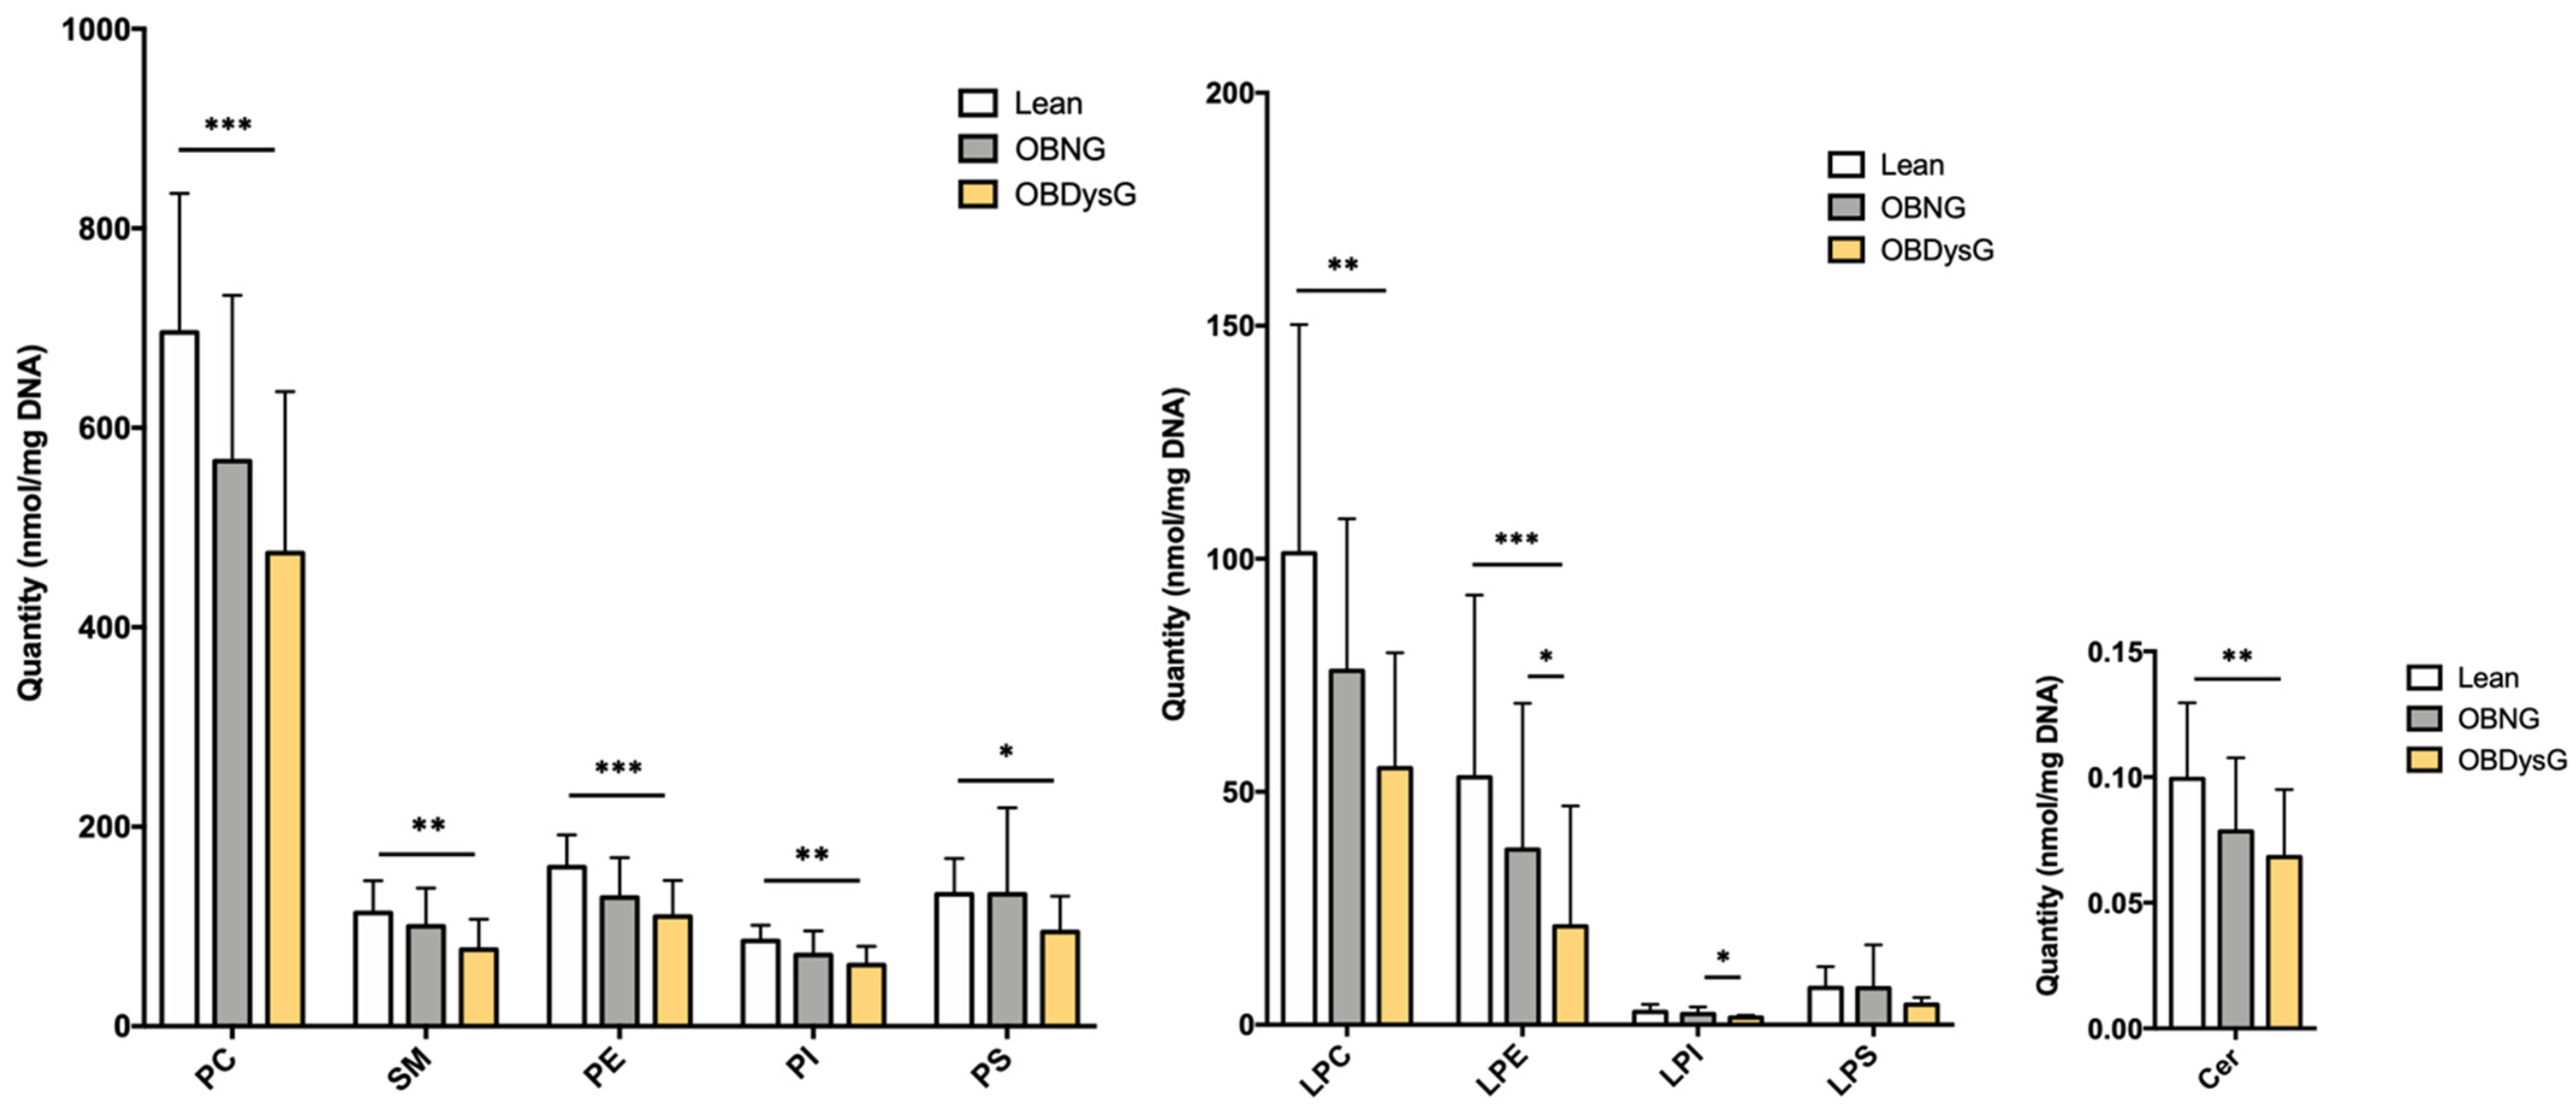
3.2. The Global PBMCs Phospholipidome Is Inversely Associated with Insulin Resistance in Obesity
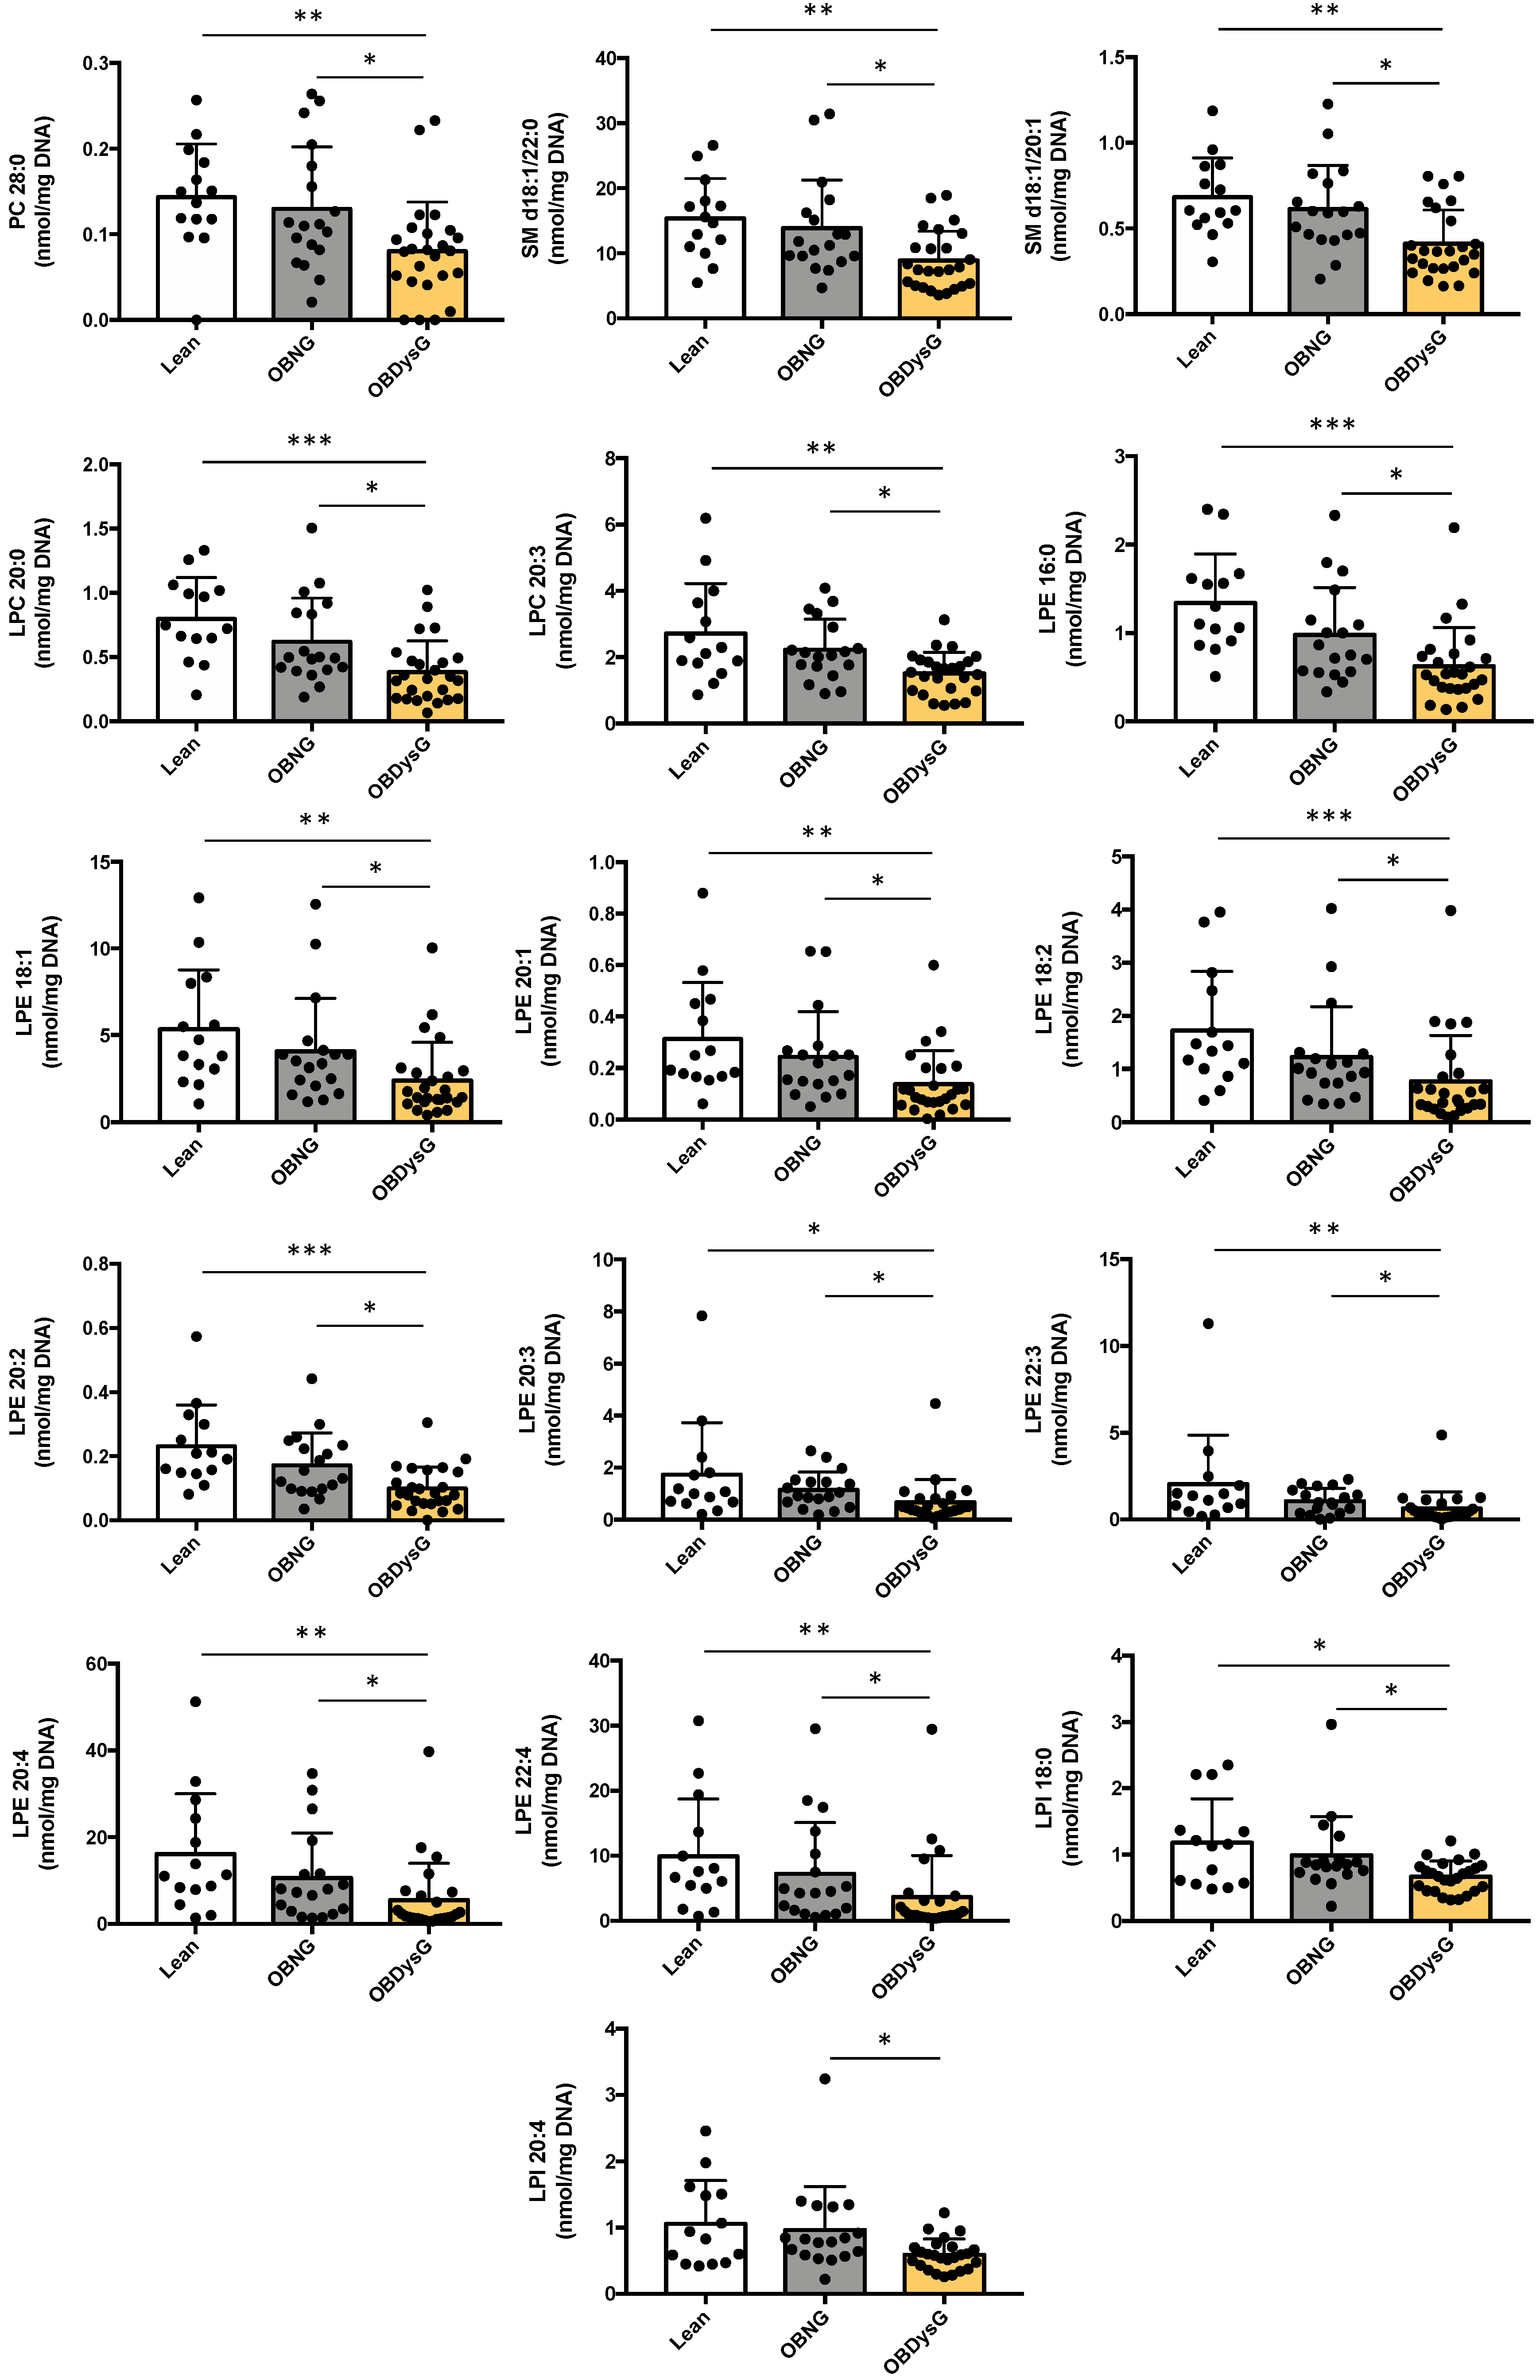
3.3. A Few Individual Phospholipidic Species Allow to Distinguish Obese Patients with Dysglycemia from Normoglycemic Obese Individuals
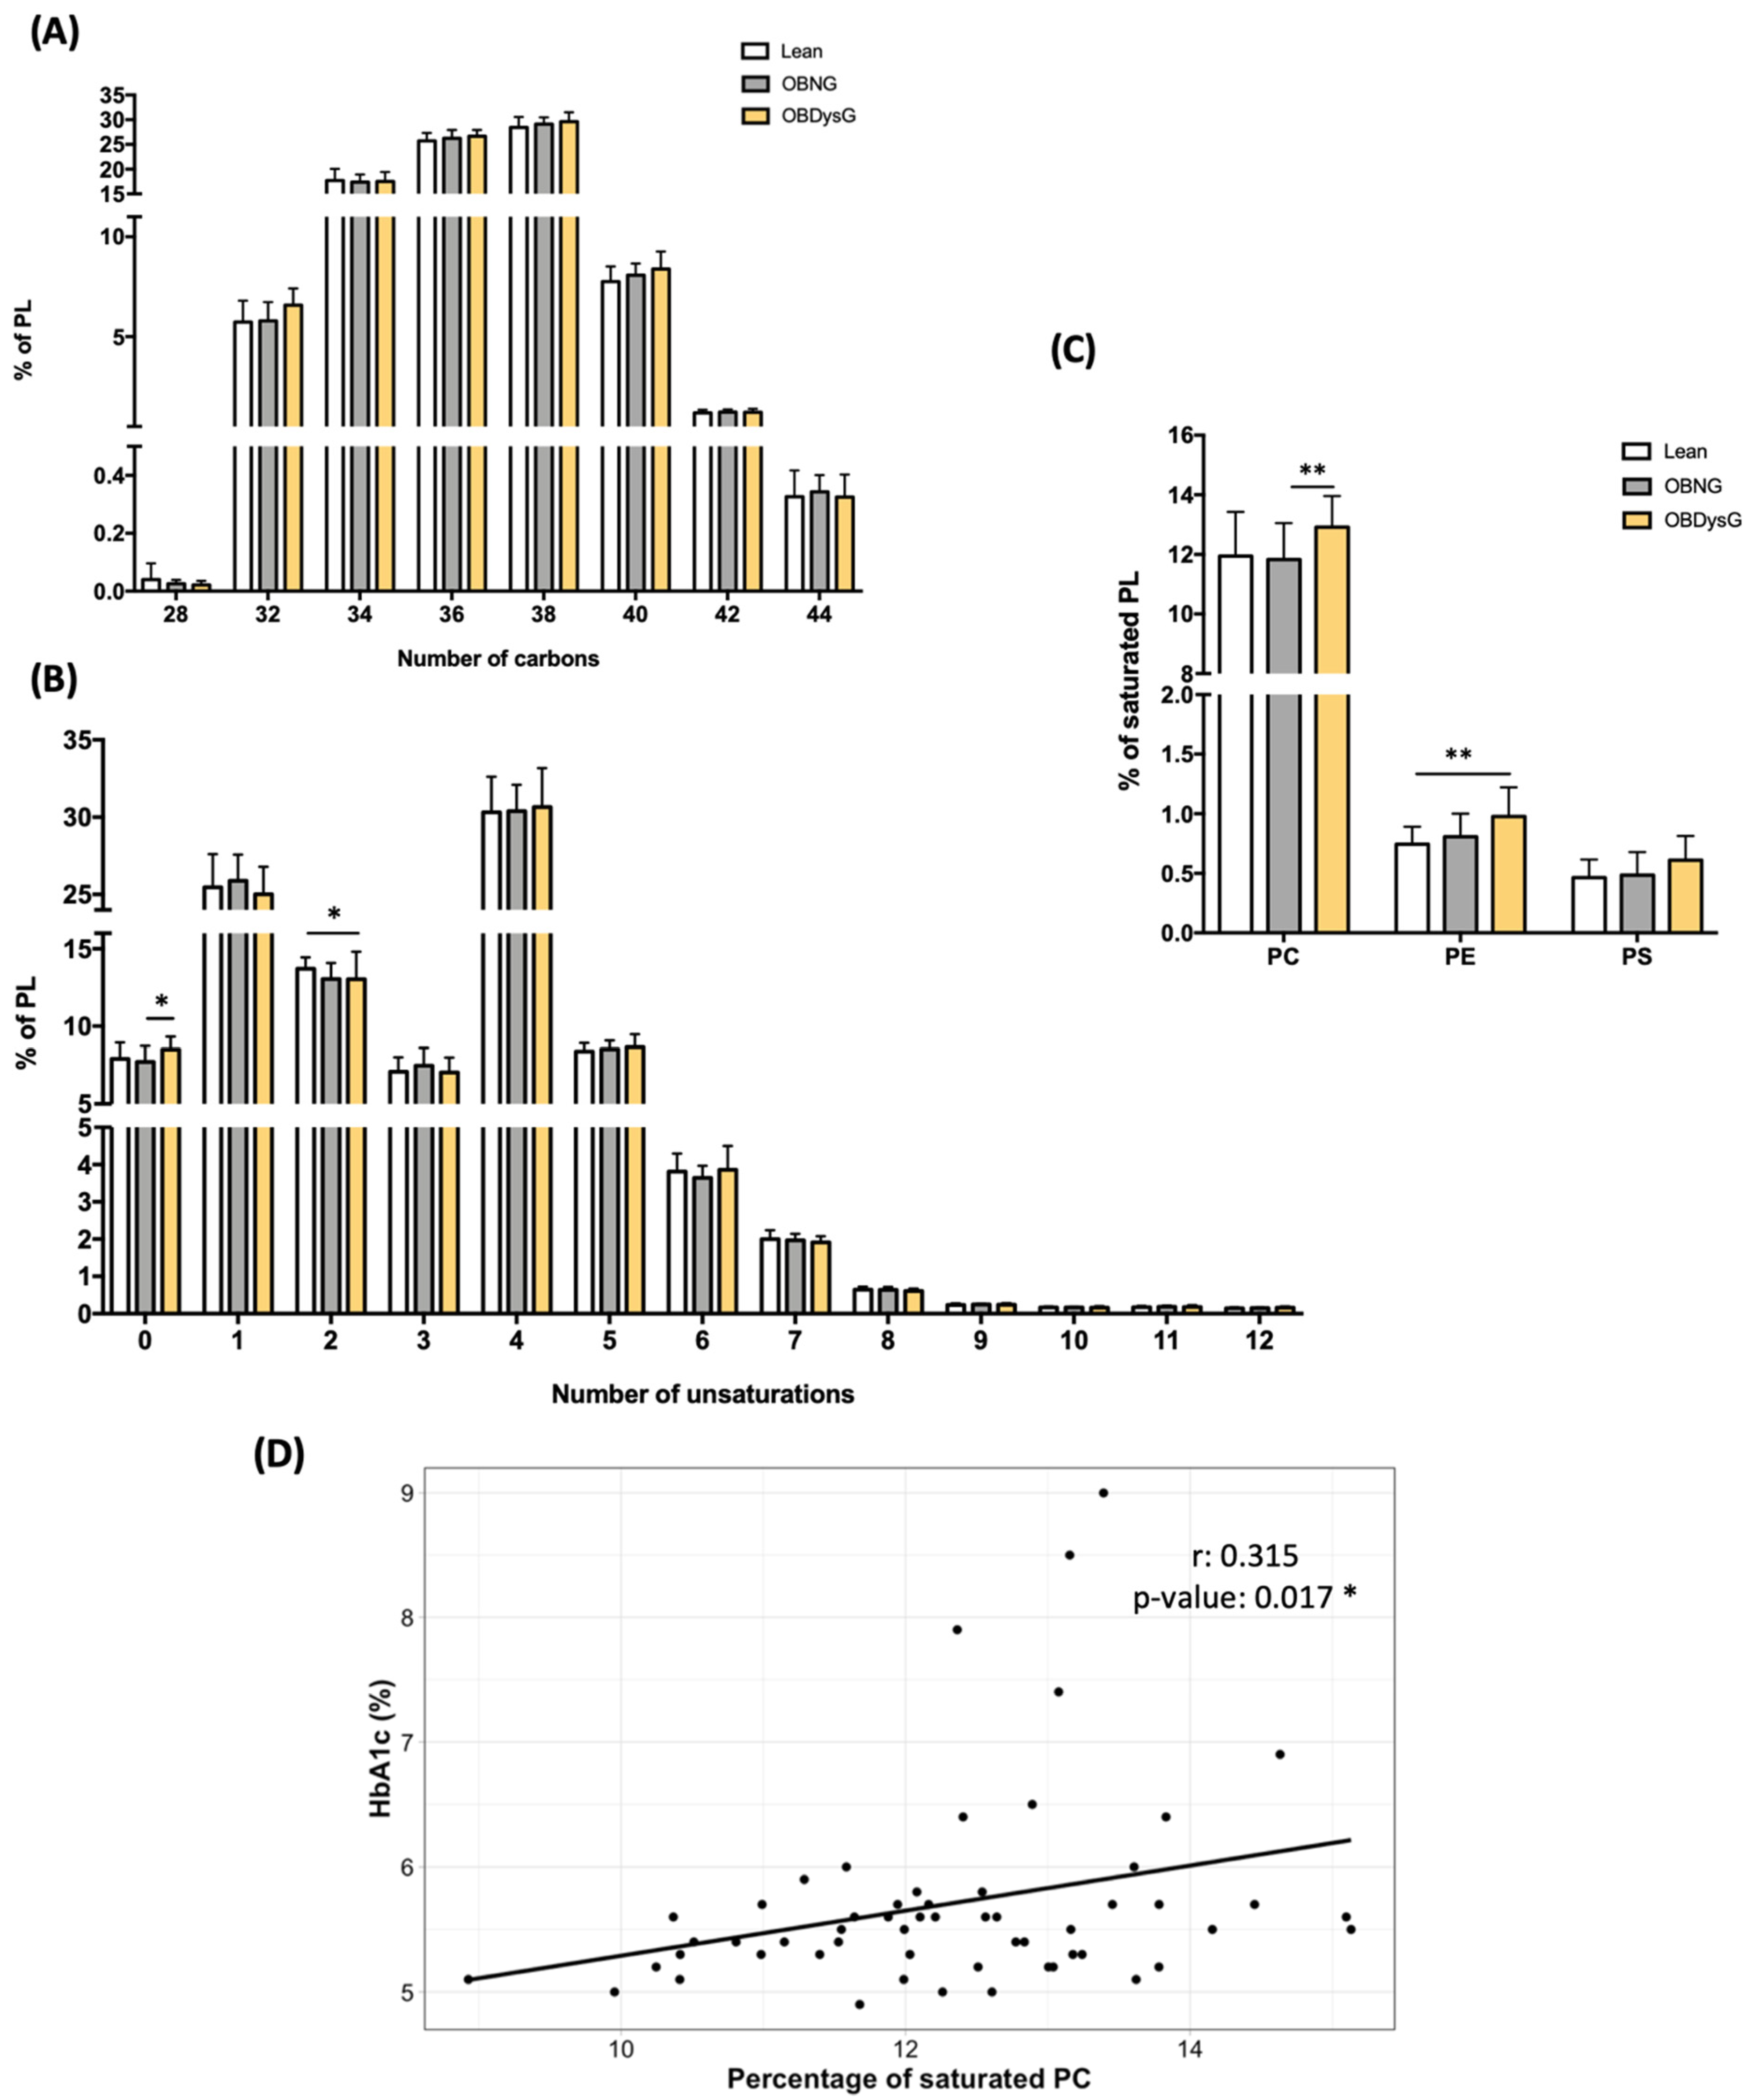
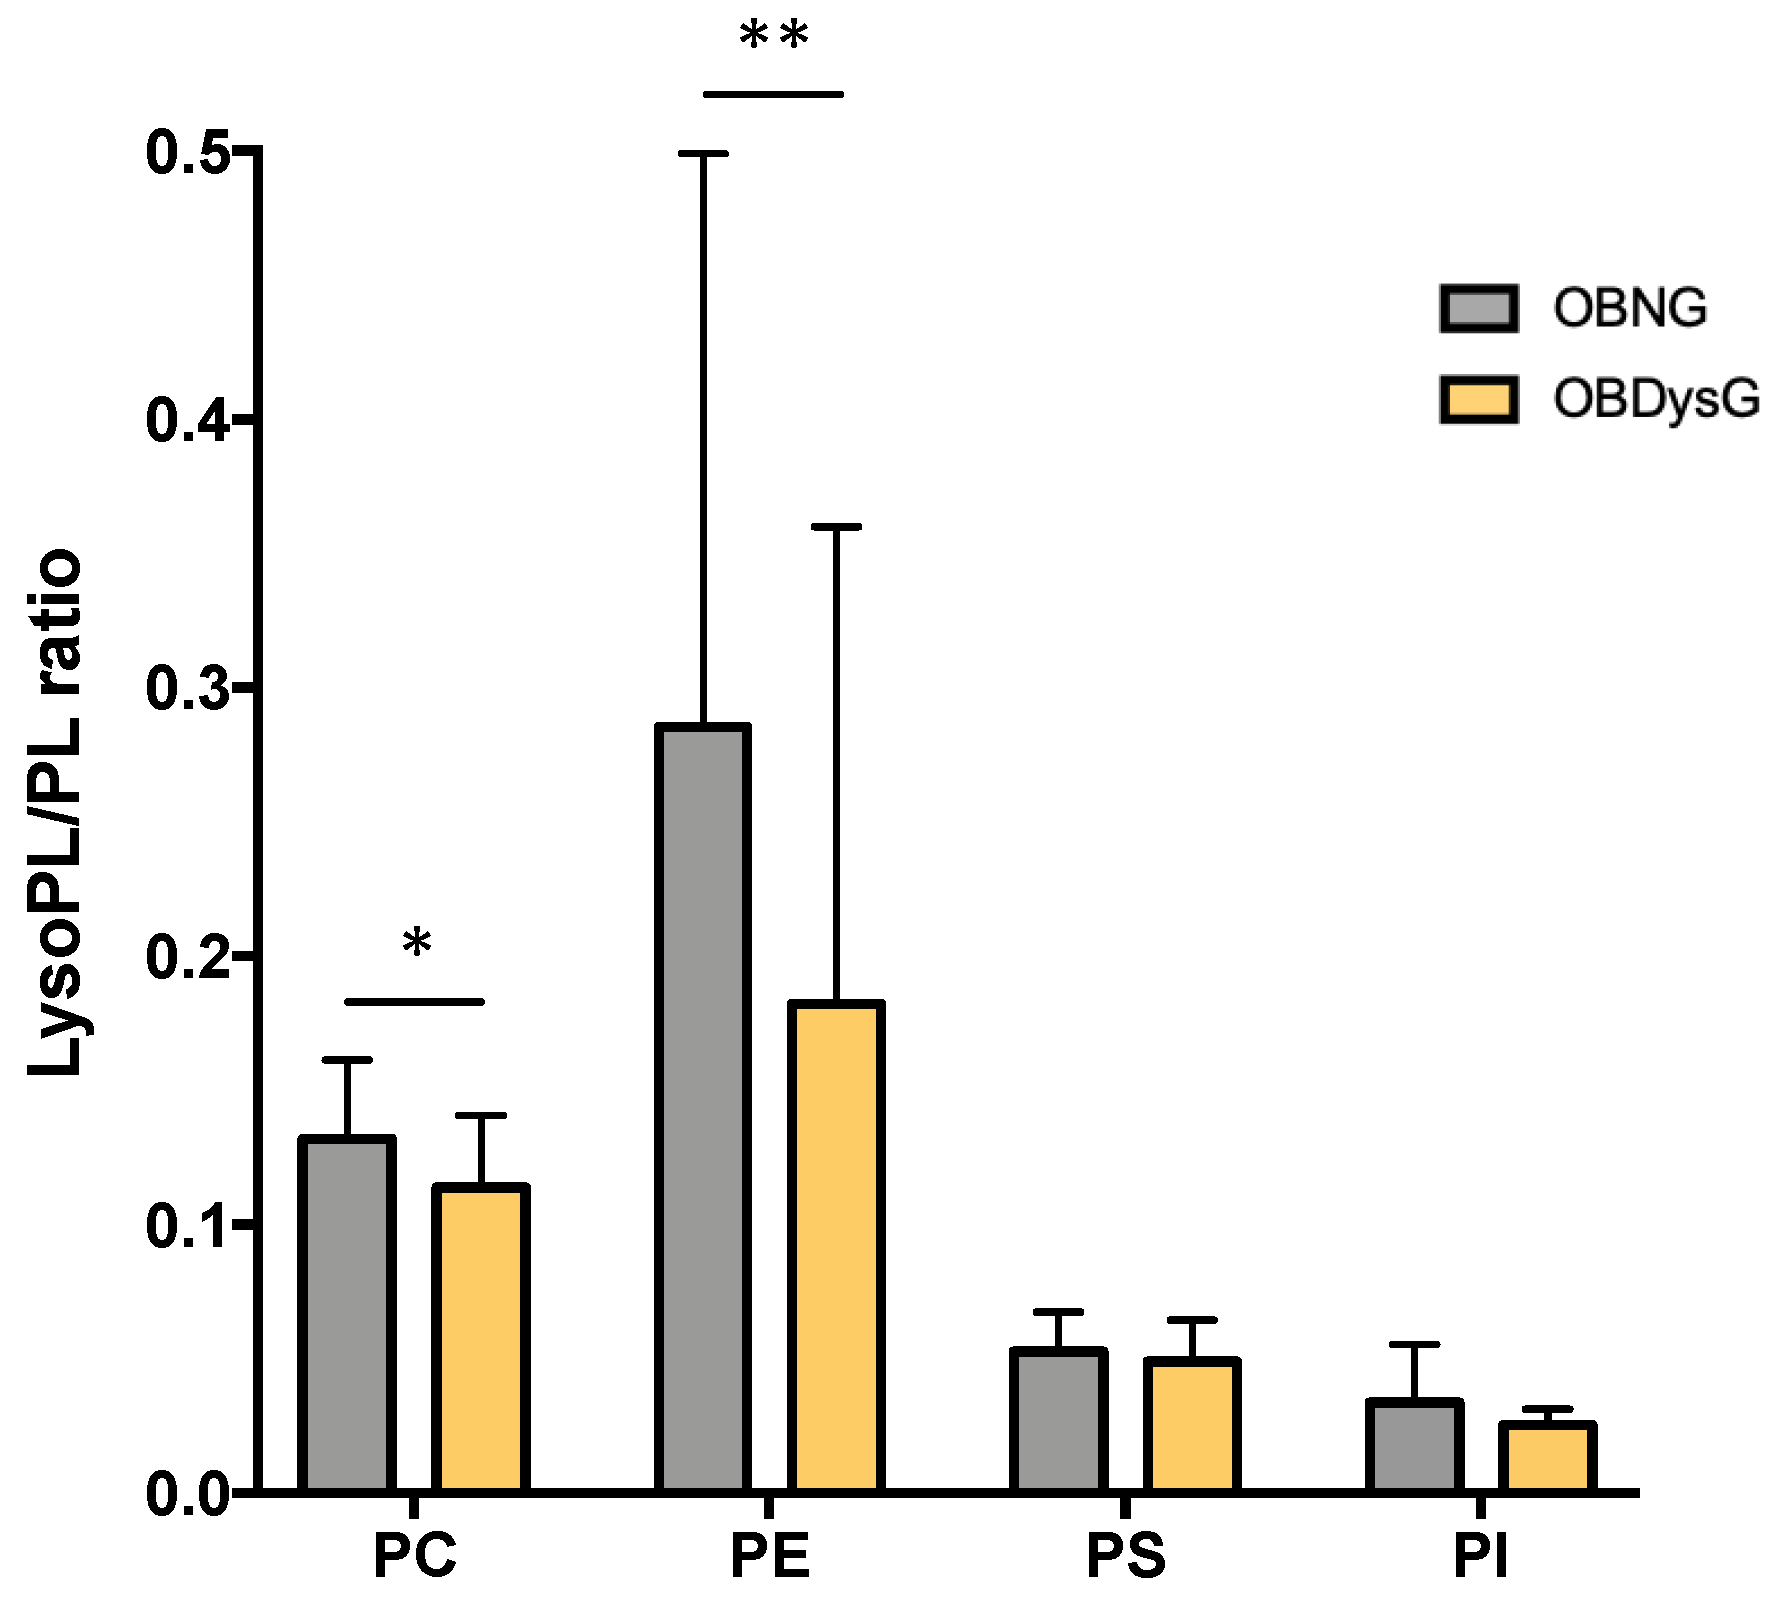
3.4. The Relative Abundance of Saturated PC Is Increased and the Lyso-PC/PC Ratio Is Decreased in PBMCs from OBDysG Versus OBNG Patients
4. Discussion
Limitations
5. Conclusions
Supplementary Materials
Author Contributions
Funding
Institutional Review Board Statement
Informed Consent Statement
Data Availability Statement
Acknowledgments
Conflicts of Interest
References
- Esser, N.; L’homme, L.; De Roover, A.; Kohnen, L.; Scheen, A.J.; Moutschen, M.; Piette, J.; Legrand-Poels, S.; Paquot, N. Obesity phenotype is related to NLRP3 inflammasome activityand immunological profile of visceral adipose tissue. Diabetologia 2013, 56, 2487–2497. [Google Scholar] [CrossRef] [Green Version]
- Hildreth, A.D.; Ma, F.; Wong, Y.Y.; Sun, R.; Pellegrini, M.; O’Sullivan, T.E. Single-cell sequencing of human white adipose tissue identifies new cell states in health and obesity. Nat. Immunol. 2021, 22, 639–653. [Google Scholar] [CrossRef] [PubMed]
- Andersen, C.J.; Murphy, K.E.; Fernandez, M.L. Impact of Obesity and Metabolic Syndrome on Immunity. Adv. Nutr. 2016, 7, 66–75. [Google Scholar] [CrossRef] [PubMed] [Green Version]
- Kanneganti, T.D.; Dixit, V.D. Immunological complications of obesity. Nat. Immunol. 2021, 13, 707–712. [Google Scholar] [CrossRef]
- Bandaru, P.; Rajkumar, H.; Nappanveettil, G. Altered or impaired immune response upon vaccination in WNIN/Ob rats. Vaccine 2011, 29, 3038–3042. [Google Scholar] [CrossRef] [PubMed]
- Sheridan, P.A.; Paich, H.A.; Handy, J.; Karlsson, E.A.; Hudgens, M.G.; Sammon, A.B.; Holland, L.A.; Weir, S.; Noah, L.; Beck, M.A. Obesity is associated with impaired immune response to influenza vaccination in humans. Int. J. Obes. 2012, 36, 1072–1077. [Google Scholar] [CrossRef] [Green Version]
- Calle, E.E.; Kaaks, R. Overweight, obesity and cancer: Epidemiological evidence and proposed mechanisms. Nat. Rev. Cancer 2004, 4, 579–591. [Google Scholar] [CrossRef]
- Renehan, A.G.; Tyson, M.; Egger, M.; Heller, R.F.; Zwahlen, M. Body-mass index and incidence of cancer: A systematic review and meta-analysis of prospective observational studies. Lancet 2008, 371, 569–578. [Google Scholar] [CrossRef]
- Falagas, M.E.; Kompoti, M. Obesity and infection. Lancet. Infect. Dis. 2006, 6, 438–446. [Google Scholar] [CrossRef]
- O’Neill, L.A.J.; Kishton, R.J.; Rathmell, J. A guide to immunometabolism for immunologists. Nat. Rev. Immunol. 2016, 16, 553–565. [Google Scholar] [CrossRef] [PubMed] [Green Version]
- Buck, M.D.; Sowell, R.T.; Kaech, S.M.; Pearce, E.L. Metabolic Instruction of Immunity. Cell 2017, 169, 570–586. [Google Scholar] [CrossRef] [PubMed]
- Michelet, X.; Dyck, L.; Hogan, A.; Loftus, R.M.; Duquette, D.; Wei1, K.; Beyaz, S.; Tavakkoli, A.; Foley, C.; Donnelly, R.; et al. Metabolic reprogramming of natural killer cells in obesity limits antitumor responses. Nat. Immunol. 2018, 19, 1330–1340. [Google Scholar] [CrossRef] [PubMed]
- Freemerman, A.J.; Johnson, A.R.; Sacks, G.N.; Milner, J.J.; Kirk, E.L.; Troester, M.A.; Macintyre, A.N.; Goraksha-Hicks, P.; Rathmell, J.C.; Makowski, L. Metabolic reprogramming of macrophages: Glucose transporter 1 (GLUT1)-mediated glucose metabolism drives a proinflammatory phenotype. J. Biol. Chem. 2014, 289, 7884–7896. [Google Scholar] [CrossRef] [Green Version]
- Thiem, K.; Stienstra, R.; Riksen, N.P.; Keating, S.T. Trained immunity and diabetic vascular disease. Clin. Sci. 2019, 133, 195–203. [Google Scholar] [CrossRef] [PubMed]
- Castoldi, A.; Monteiro, L.B.; van Teijlingen Bakker, N.; Sanin, D.E.; Nisha Rana, N.; Corrado, M.; Cameron, A.M.; Hässler, F.; Matsushita, M.; Caputa, G.; et al. Triacylglycerol synthesis enhances macrophage inflammatory function. Nat. Commun. 2020, 11, 4107. [Google Scholar] [CrossRef]
- Nathan, L.; Wonhwa, C. Phosphatidylserine binding is essential for plasma membrane recruitment and signaling function of 3-phosphoinositide-dependent kinase-1. J. Biol. Chem. 2011, 286, 41265–41272. [Google Scholar]
- Grzelczyk, A.; Gendaszewska-Darmach, E. Novel bioactive glycerol-based lysophospholipids: New data—New insight into their function. Biochimie 2013, 95, 667–679. [Google Scholar] [CrossRef]
- Sen, P.; Dickens, A.M.; López-Bascón, M.A.; Lindeman, T.; Kemppainen, E.; Lamichhane, S.; Rönkkö, T.; Ilonen, J.; Toppari, J.; Veijola, R.; et al. Metabolic alterations in immune cells associate with progression to type 1 diabetes. Diabetologia 2020, 63, 1017–1031. [Google Scholar] [CrossRef] [Green Version]
- Weir, J.M.; Wong, G.; Barlow, C.K.; Greeve, M.A.; Kowalczyk, A.; Almasy, L.; Comuzzie, A.G.; Mahaney, M.C.; Jowett, J.B.M.; Shaw, J.; et al. Plasma lipid profiling in a large population-based cohort. J. Lipid Res. 2013, 54, 2898–2908. [Google Scholar] [CrossRef] [Green Version]
- Meikle, P.J.; Wong, G.; Barlow, C.K.; Weir, J.M.; Greeve, M.A.; MacIntosh, G.L.; Almasy, L.; Comuzzie, A.G.; Mahaney, M.C.; Kowalczyk, A.; et al. Plasma lipid profiling shows similar associations with prediabetes and type 2 diabetes. PLoS ONE 2013, 8, e74341. [Google Scholar] [CrossRef] [Green Version]
- Razquin, C.; Toledo, E.; Clish, C.B.; Ruiz-Canela, M.; Dennis, C.; Corella, D.; Papandreou, C.; Ros, E.; Estruch, R.; Guasch-Ferré, M.; et al. Plasma Lipidomic Profiling and Risk of Type 2 Diabetes in the PREDIMED Trial. Diabetes Care 2018, 41, 2617–2624. [Google Scholar] [CrossRef] [PubMed] [Green Version]
- American Diabetes Association. Classification and Diagnosis of Diabetes: Standards of Medical Care in Diabetes. Diabetes Care 2020, 43, S14–S31. [Google Scholar] [CrossRef] [PubMed] [Green Version]
- Liebisch, G.; Lieser, B.; Rathenberg, J.; Drobnik, W.; Schmitz, G. High-throughput quantification of phosphatidylcholine and sphingomyelin by electrospray ionization tandem mass spectrometry coupled with isotope correction algorithm. Biochim. Biophys. Acta Mol. Cell Biol. Lipids 2004, 1686, 108–117. [Google Scholar] [CrossRef] [PubMed]
- Huynh, K.; Barlow, C.K.; Jayawardana, K.S.; Weir, J.M.; Mellett, N.A.; Cinel, M.; Magliano, D.J.; Shaw, J.E.; Drew, B.G.; Meikle, P.J. High-Throughput Plasma Lipidomics: Detailed Mapping of the Associations with Cardiometabolic Risk Factors. Cell Chem. Biol. 2019, 26, 71–84. [Google Scholar] [CrossRef] [PubMed]
- Ferrara, P.J.; Rong, X.; Maschek, J.A.; Verkerke, A.R.P.; Siripoksup, P.; Song, H.; Green, T.D.; Krishnan, K.C.; Johnson, J.M.; Turk, J.; et al. Lysophospholipid acylation modulates plasma membrane lipid organization and insulin sensitivity in skeletal muscle. J. Clin. Investig. 2021, 131, e135963. [Google Scholar] [CrossRef]
- Gianfrancesco, M.A.; Paquot, N.; Piette, J.; Legrand-Poels, S. Lipid bilayer stress in obesity-linked inflammatory and metabolic disorders. Biochem. Pharmacol. 2018, 153, 168–183. [Google Scholar] [CrossRef] [Green Version]
- Fu, S.; Yang, L.; Li, P.; Hofmann, O.; Dicker, L.; Hide, W.; Lin, X.; Watkins, S.M.; Ivanov, A.R.; Hotamisligil, G.S. Aberrant lipid metabolism disrupts calcium homeostasis causing liver endoplasmic reticulum stress in obesity. Nature 2011, 473, 528–531. [Google Scholar] [CrossRef] [Green Version]
- Gianfrancesco, M.A.; Dehairs, J.; L’homme, L.; Herinckx, G.; Esser, N.; Jansen, O.; Habraken, Y.; Lassence, C.; Swinnen, J.V.; Rider, M.H.; et al. Saturated fatty acids induce NLRP3 activation in human macrophages through K+ efflux resulting from phospholipid saturation and Na, K-ATPase disruption. Biochim. Biophys. Acta Mol. Cell Biol. Lipids 2019, 1864, 1017–1030. [Google Scholar] [CrossRef]
- Pilon, M. Revisiting the membrane-centric view of diabetes. Lipids Health Dis. 2016, 15, 167. [Google Scholar] [CrossRef] [Green Version]
- Varshney, P.; Yadav, V.; Saini, N. Lipid rafts in immune signalling: Current progress and future perspective. Immunology 2016, 149, 13–24. [Google Scholar] [CrossRef] [Green Version]
- Soriguer, F.; García-Serrano, S.; García-Almeida, J.M.; Garrido-Sánchez, L.; García-Arnés, J.; Tinahones, F.J.; Cardona, I.; Rivas-Marín, J.; Gallego-Perales, J.L.; García-Fuentes, E. Changes in the serum composition of free-fatty acids during an intravenous glucose tolerance test. Obesity 2009, 17, 10–15. [Google Scholar] [CrossRef] [PubMed]
- Foretz, M.; Guigas, B.; Viollet, B. Understanding the glucoregulatory mechanisms of metformin in type 2 diabetes mellitus. Nat. Rev. Endocrinol. 2019, 15, 569–589. [Google Scholar] [CrossRef] [PubMed] [Green Version]
- Boudaba, N.; Marion, A.; Huet, C.; Pierre, R.; Viollet, B.; Foretz, M. AMPK Re-Activation Suppresses Hepatic Steatosis but its Downregulation Does Not Promote Fatty Liver Development. EBioMedicine 2018, 28, 194–209. [Google Scholar] [CrossRef] [PubMed] [Green Version]


| Overall p-Value | Lean | OBNG | OBDysG | |
|---|---|---|---|---|
| n (f/m) | NA | 14 (9/5) | 18 (12/6) | 25 (12/13) |
| Age (years) | >0.001 | 33.9 ± 9.7 | 39.1 ± 8.9 | 47.9 ± 11.3 ***;† |
| Body Weight (kg) | >0.001 | 65.5 ± 10.5 | 112.7 ± 22.1 *** | 120.6 ± 25.4 *** |
| BMI (kg/m2) | >0.001 | 22.1 ± 1.9 | 40.3 ± 4.4 *** | 40.6 ± 6.6 *** |
| Waist (cm) | >0.001 | 76.2 ± 8.1 | 121.0 ± 13.9 *** | 124.5 ± 14.9 *** |
| Systolic BP (mmHg) | 0.003 | 122.3 ± 9.2 | 129.8 ± 13.9 | 140.9 ± 17.3 ** |
| Diastolic BP (mmHg) | 0.024 | 74.0 ± 9.2 | 83.2 ± 10.4 | 87.6 ± 16.1 * |
| Fasting glucose (mg/dL) | >0.001 | 84.6 ± 5.3 | 90.2 ± 5.4 | 112.0 ± 32.5 ***;† |
| Fasting insulin (mU/L) | >0.001 | 7.1 ± 3.3 | 22.9 ± 10.7 *** | 32.6 ± 22.2 *** |
| HOMA-IR | >0.001 | 1.48 ± 0.68 | 5.14 ± 2.43 *** | 9.67 ± 8.79 *** |
| HbA1c (%) | >0.001 | 5.27 ± 0.23 | 5.37 ± 0.20 | 6.20 ± 1.00 ***;††† |
| Type 2 diabetes | NA | 0/14 | 0/18 | 8/25 |
| Triglycerides (g/L) | >0.001 | 0.81 ± 0.35 | 1.49 ± 0.50 ** | 1.87 ± 1.77 *** |
| Total cholesterol (g/L) | 0.570 | 1.94 ± 0.31 | 2.05 ± 0.30 | 2.05 ± 0.41 |
| HDL cholesterol (g/L) | >0.001 | 0.76 ± 0.16 | 0.49 ± 0.10 *** | 0.45 ± 0.10 *** |
| LDL cholesterol (g/L) | 0.015 | 1.02 ± 0.31 | 1.29 ± 0.30 * | 1.29 ± 0.35 * |
| C-reactive protein (mg/L) | 0.001 | 2.12 ± 2.09 | 6.17 ± 5.88 * | 7.33 ± 6.05 *** |
| Age | |||
|---|---|---|---|
| Lipid class | Unadjusted β (95% CI) | p | R2 (p-value) |
| PC | −0.411 (−0.70, −0.13) | 0.051 | 0.111 (0.007) |
| PE | −0.386 (−0.67, −0.10) | 0.051 | 0.097 (0.010) |
| PI | −0.350 (−0.64, −0.06) | 0.059 | 0.078 (0.020) |
| PS | −0.246 (−0.64, 0.15) | 0.291 | 0.008 (0.230) |
| SM | −0.467 (−0.81, −0.12) | 0.051 | 0.098 (0.010) |
| Cer | −0.367 (−0.71, −0.03) | 0.081 | 0.058 (0.040) |
| LPC | −0.534 (−0.97, −0.09) | 0.059 | 0.077 (0.021) |
| LPE | −1.238 (−2.00, −0.47) | 0.046 | 0.139 (0.002) |
| LPI | −0.320 (−0.78, 0.14) | 0.238 | 0.015 (0.177) |
| LPS | −0.168 (−0.69, 0.36) | 0.581 | −0.011 (0.531) |
| Lipid species | Unadjusted β (95% CI) | p | R2 (p-value) |
| PC 28:0 | −0.445 (0.11, −1.00) | 0.183 | 0.028 (0.122) |
| SM d18:1/20:1 | −0.445 (−0.86, −0.03) | 0.082 | 0.056 (0.042) |
| SM d18:1/22:0 | −0.548 (−1.00, −0.09) | 0.059 | 0.075 (0.022) |
| LPC 20:0 | −0.623 (−0.05, −1.19) | 0.076 | 0.060 (0.036) |
| LPC 20:3 | −0.410 (0.05, −0.87) | 0.135 | 0.036 (0.084) |
| LPE 16:0 | −0.913 (−0.38, −1.45) | 0.046 | 0.155 (0.001) |
| LPE 18:1 | −1.098 (−0.45, −1.74) | 0.046 | 0.154 (0.002) |
| LPE 20:1 | −1.201 (−0.44, −1.96) | 0.046 | 0.133 (0.003) |
| LPE 18:2 | −1.199 (−0.49, −1.91) | 0.046 | 0.150 (0.002) |
| LPE 20:2 | −1.013 (−0.25, −1.77) | 0.052 | 0.094 (0.011) |
| LPE 20:3 | −1.192 (−0.43, −1.96) | 0.046 | 0.129 (0.004) |
| LPE 22:3 | −1.329 (−0.45, −2.21) | 0.046 | 0.125 (0.005) |
| LPE 20:4 | −1.445 (−0.45, −2.44) | 0.051 | 0.111 (0.006) |
| LPE 22:4 | −1.625 (−0.55, −2.71) | 0.046 | 0.121 (0.005) |
| LPI 18:0 | −0.264 (0.18, −0.71) | 0.309 | 0.006 (0.252) |
| LPI 20:4 | −0.385 (0.09, −0.86) | 0.178 | 0.027 (0.118) |
Publisher’s Note: MDPI stays neutral with regard to jurisdictional claims in published maps and institutional affiliations. |
© 2021 by the authors. Licensee MDPI, Basel, Switzerland. This article is an open access article distributed under the terms and conditions of the Creative Commons Attribution (CC BY) license (https://creativecommons.org/licenses/by/4.0/).
Share and Cite
Wilkin, C.; Colonval, M.; Dehairs, J.; Esser, N.; Iovino, M.; Gianfrancesco, M.A.; Fadeur, M.; Swinnen, J.V.; Paquot, N.; Piette, J.; et al. New Insights on the PBMCs Phospholipidome in Obesity Demonstrate Modulations Associated with Insulin Resistance and Glycemic Status. Nutrients 2021, 13, 3461. https://doi.org/10.3390/nu13103461
Wilkin C, Colonval M, Dehairs J, Esser N, Iovino M, Gianfrancesco MA, Fadeur M, Swinnen JV, Paquot N, Piette J, et al. New Insights on the PBMCs Phospholipidome in Obesity Demonstrate Modulations Associated with Insulin Resistance and Glycemic Status. Nutrients. 2021; 13(10):3461. https://doi.org/10.3390/nu13103461
Chicago/Turabian StyleWilkin, Chloé, Megan Colonval, Jonas Dehairs, Nathalie Esser, Margaud Iovino, Marco A. Gianfrancesco, Marjorie Fadeur, Johan V. Swinnen, Nicolas Paquot, Jacques Piette, and et al. 2021. "New Insights on the PBMCs Phospholipidome in Obesity Demonstrate Modulations Associated with Insulin Resistance and Glycemic Status" Nutrients 13, no. 10: 3461. https://doi.org/10.3390/nu13103461
APA StyleWilkin, C., Colonval, M., Dehairs, J., Esser, N., Iovino, M., Gianfrancesco, M. A., Fadeur, M., Swinnen, J. V., Paquot, N., Piette, J., & Legrand-Poels, S. (2021). New Insights on the PBMCs Phospholipidome in Obesity Demonstrate Modulations Associated with Insulin Resistance and Glycemic Status. Nutrients, 13(10), 3461. https://doi.org/10.3390/nu13103461


