
Dietary Intake in the Lifelines Cohort Study: Baseline Results from the Flower Food Frequency Questionnaire among 59,982 Participants

 , , and
Abstract
:1. Introduction
2. Methods
2.1. Study Population
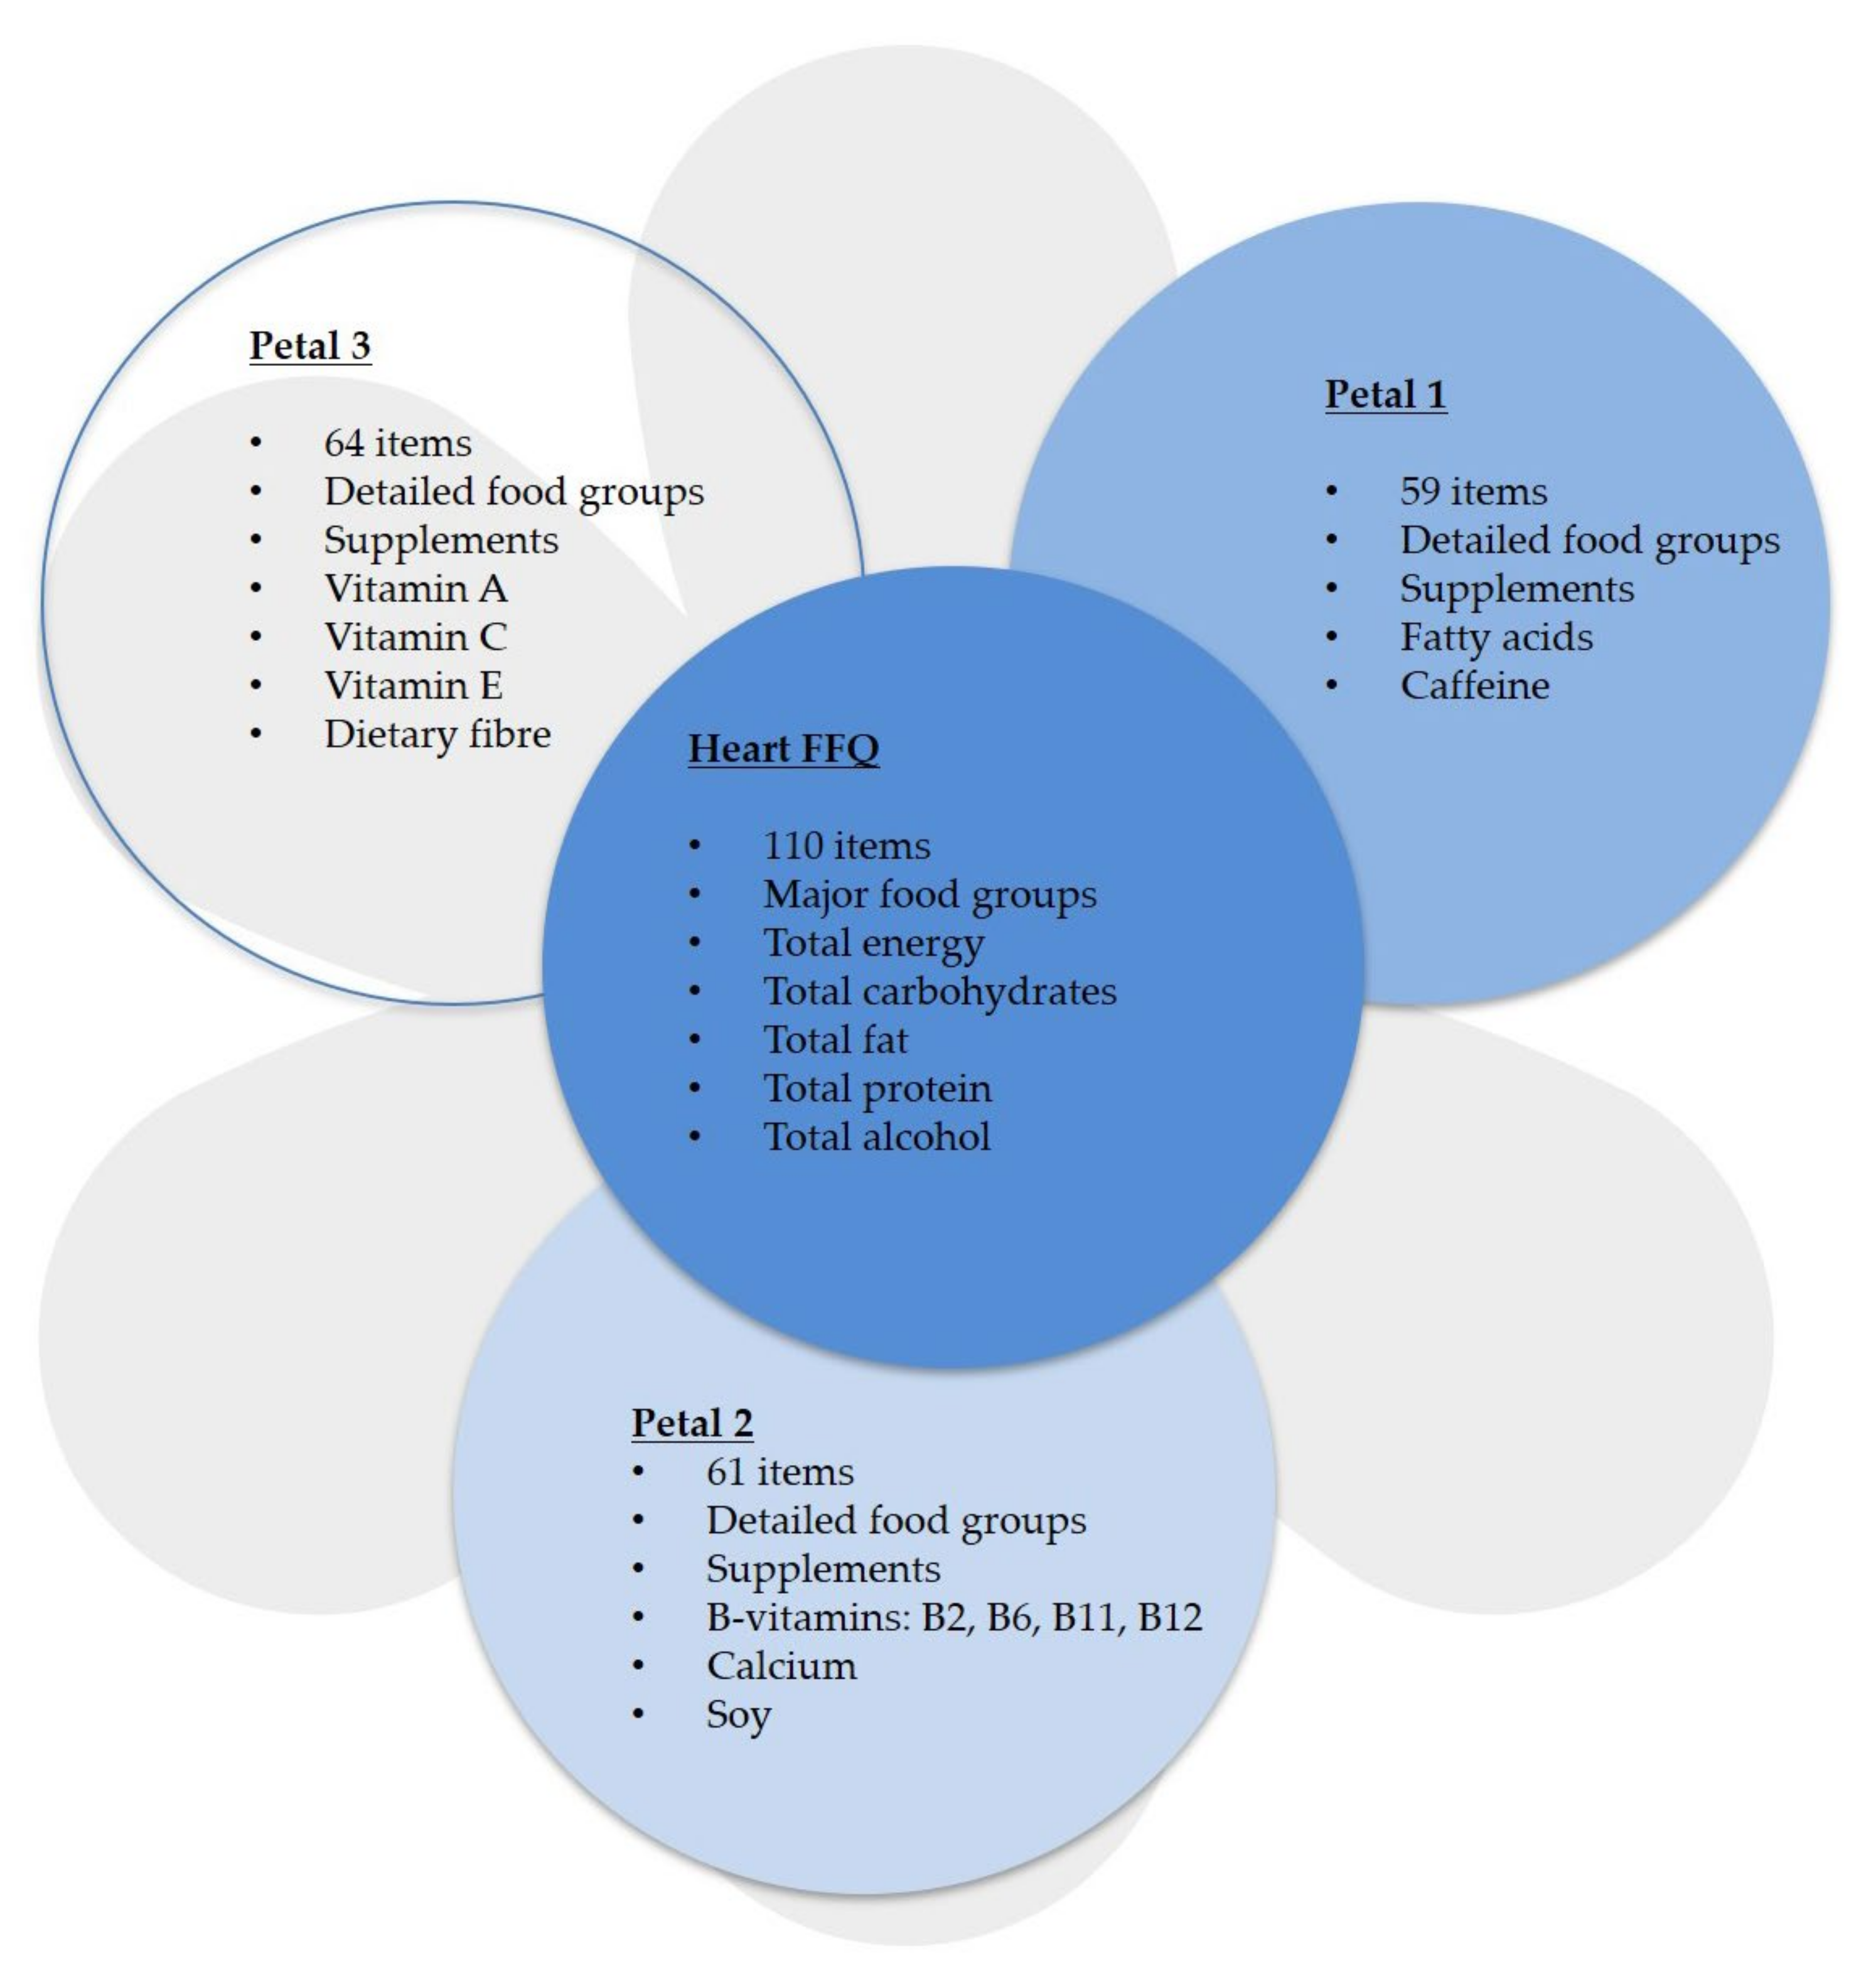
2.2. Assessment of Dietary Intake
2.3. Assessment of Other Characteristics
2.4. Statistical Analyses
3. Results
3.1. Participant Characteristics
3.2. Energy and Nutrient Intake

| Men (n = 23,703) | Women (n = 36,279) | ||||
|---|---|---|---|---|---|
| Median | 25th–75th Percentile | Median | 25th–75th Percentile | ||
| Energy (kcal) | 2368 | 1974–2812 | 1848 | 1551–2179 | *** |
| Total carbohydrates (g) | 255 | 209–308 | 203 | 167–242 | *** |
| (En%) | 45.3 | 41.6–49.2 | 45.6 | 41.9–49.4 | *** |
| Mono- and disaccharides (g) | 108 | 83–138 | 89 | 69–112 | *** |
| Polysaccharides (g) | 144 | 117–175 | 112 | 91–133 | *** |
| Total fat (g) | 95 | 76–120 | 73 | 58–91 | *** |
| (En%) | 36.7 | 32.5–41.5 | 35.7 | 31.6–40.0 | *** |
| Saturated fatty acids (g) | 33 | 26–41 | 26 | 20–32 | *** |
| Monounsaturated fatty acids (g) | 34 | 26–42 | 25 | 20–32 | *** |
| Polyunsaturated fatty acids (g) | 20 | 15–27 | 14 | 11–19 | *** |
| Eicosapentaenoic acid (EPA) (g) | 0.04 | 0.01–0.09 | 0.04 | 0.01–0.09 | *** |
| Docosahexaenoic acid (DHA) (g) | 0.06 | 0.02–0.13 | 0.06 | 0.02–0.12 | *** |
| Total protein (g) | 84 | 71–98 | 71 | 60–81 | *** |
| (En%) | 14.9 | 13.6–16.4 | 15.8 | 14.3–17.4 | *** |
| Vegetable protein (g) | 37 | 30–44 | 29 | 24–35 | *** |
| Animal protein (g) | 47 | 38–56 | 41 | 34–49 | *** |
| Alcohol (g) | 6.8 | 2.6–15.3 | 2.6 | 0.4–6.9 | *** |
| (En%) | 2.2 | 0.8–4.4 | 0.9 | 0.1–2.8 | *** |
| Fibre (g) | 25 | 20–30 | 21 | 17–25 | *** |
| (En%) | 2.0 | 1.7–2.3 | 2.2 | 1.9–2.5 | *** |
| Retinol equivalents (µg) | 1146 | 868–1542 | 960 | 744–1232 | *** |
| Vitamin B2 (mg) | 1.5 | 1.2–1.8 | 1.3 | 1.1–1.6 | *** |
| Vitamin B6 (mg) | 1.5 | 1.3–1.8 | 1.3 | 1.1–1.5 | *** |
| Folate (present in food by nature) (µg) | 253 | 210–303 | 229 | 190–272 | *** |
| Folate equivalents (µg) | 261 | 214–317 | 234 | 193–282 | *** |
| Vitamin B12 (µg) | 4.0 | 3.1–5.4 | 3.4 | 2.6–4.5 | *** |
| Vitamin C (mg) | 92 | 66–123 | 96 | 69–127 | *** |
| Vitamin E (mg) | 13 | 10–17 | 11 | 9–14 | *** |
| Calcium (mg) | 986 | 786–1236 | 920 | 731–1134 | *** |
| Men (n = 23,703) | Women (n = 36,279) | |||||||||||||
|---|---|---|---|---|---|---|---|---|---|---|---|---|---|---|
| 18–50 Years (n = 14,890) | 51–70 Years (n = 8144) | >70 Years (n = 669) | 18–50 Years (n = 24,361) | 51–70 Years (n = 11,185) | >70 Years (n = 733) | |||||||||
| Median | 25th–75th Percentile | Median | 25th–75th Percentile | Median | 25th–75th Percentile | Median | 25th–75th Percentile | Median | 25th–75th Percentile | Median | 25th–75th Percentile | |||
| Energy (kcal) | 2476 | 2071–2921 | 2215 | 1856–2633 | 2014 | 1704–2368 | ***abc | 1892 | 1584–2222 | 1777 | 1494–2084 | 1679 | 1418–1956 | ***abc |
| Total carbohydrates (g) | 271 | 224–324 | 232 | 192–279 | 213 | 178–251 | ***abc | 210 | 174–249 | 190 | 157–226 | 183 | 153–212 | ***abc |
| (En%) | 46.1 | 42.4–49.8 | 44.1 | 40.3–48.0 | 44.0 | 39.7–47.7 | ***ab | 46.2 | 42.6–49.9 | 44.4 | 40.5–48.1 | 44.7 | 40.4–48.5 | ***ab |
| Mono- and disaccharides (g) | 113 | 87–145 | 99 | 76–127 | 99 | 79–124 | ***ab | 91 | 71–115 | 85 | 67–106 | 88 | 71–108 | ***ac |
| Polysaccharides (g) | 154 | 127–185 | 131 | 108–158 | 111 | 93–133 | ***abc | 116 | 96–138 | 103 | 85–123 | 93 | 76–109 | ***abc |
| Total fat (g) | 99 | 79–123 | 89 | 71–113 | 82 | 64–105 | ***abc | 75 | 59–93 | 69 | 55–86 | 65 | 51–81 | ***abc |
| (En%) | 36.7 | 32.6–41.3 | 36.8 | 32.3–42.1 | 36.2 | 32.0–41.6 | - | 36.9 | 32.0–40.2 | 35.1 | 30.9–39.7 | 34.4 | 30.0–39.1 | ***abc |
| Saturated fatty acids (g) | 34 | 27–42 | 31 | 24–39 | 29 | 23–37 | ***abc | 26 | 21–33 | 25 | 20–31 | 24 | 19–31 | ***ab |
| Monounsaturated fatty acids (g) | 35 | 28–44 | 31 | 24–40 | 28 | 22–36 | ***abc | 26 | 21–33 | 24 | 19–30 | 21 | 17–27 | ***abc |
| Polyunsaturated fatty acids (g) | 21 | 16–27 | 19 | 14–25 | 17 | 13–24 | ***abc | 15 | 11–19 | 14 | 10–18 | 13 | 9–17 | ***abc |
| Eicosapentaenoic acid (EPA) (g) | 0.04 | 0.01–0.08 | 0.06 | 0.02–0.10 | 0.05 | 0.03–0.09 | ***ab | 0.03 | 0.01–0.08 | 0.06 | 0.02–0.10 | 0.05 | 0.01–0.09 | ***abc |
| Docosahexaenoic acid (DHA) (g) | 0.05 | 0.02–0.11 | 0.08 | 0.03–0.15 | 0.08 | 0.04–0.13 | ***ab | 0.05 | 0.01–0.11 | 0.08 | 0.03–0.15 | 0.05 | 0.01–0.09 | ***abc |
| Total protein (g) | 86 | 73–100 | 81 | 69–94 | 74 | 64–86 | ***abc | 71 | 60–81 | 71 | 60–82 | 65 | 57–77 | ***bc |
| (En%) | 14.7 | 13.3–16.1 | 15.3 | 14.0–16.8 | 15.3 | 13.9–16.5 | ***ab | 15.5 | 14.0–17.1 | 16.4 | 14.9–18.1 | 16.1 | 14.6–17.8 | ***abc |
| Vegetable protein (g) | 38 | 31–46 | 34 | 28–41 | 29 | 24–36 | ***abc | 29 | 24–35 | 28 | 23–33 | 25 | 21–30 | ***abc |
| Animal protein (g) | 47 | 39–57 | 46 | 38–55 | 45 | 37–52 | ***abc | 41 | 33–49 | 42 | 35–51 | 40 | 33–48 | ***ac |
| Alcohol (g) | 6.6 | 2.5–13.3 | 8.5 | 2.8–16.8 | 6.3 | 1.6–12.5 | ***abc | 2.5 | 0.3–6.7 | 3.3 | 0.7–9.3 | 1.4 | 0.0–6.4 | ***abc |
| (En%) | 2 | 0.7–4.1 | 2.7 | 1.0–5.1 | 2.1 | 0.6–4.6 | ***ac | 0.9 | 0.1–2.5 | 1.4 | 0.2–3.7 | 0.6 | 0.0–2.7 | ***abc |
| Fibre (g) | 25 | 21–31 | 24 | 19–29 | 22 | 18–26 | ***abc | 21 | 17–25 | 21 | 18–25 | 20 | 17–24 | ***abc |
| (En%) | 2 | 1.7–2.3 | 2.1 | 1.8–2.4 | 2.1 | 1.8–2.4 | ***ab | 2.1 | 1.8–2.4 | 2.3 | 2.0–2.6 | 2.3 | 2.0–2.6 | ***ab |
| Retinol equivalents (µg) | 1126 | 853–1504 | 1182 | 894–1597 | 1181 | 902–1612 | ***ab | 941 | 724–1197 | 1002 | 785–1301 | 995 | 788–1295 | ***ab |
| Vitamin B2 (mg) | 1.5 | 1.2–1.8 | 1.5 | 1.2–1.8 | 1.4 | 1.2–1.6 | ***abc | 1.3 | 1.0–1.5 | 1.3 | 1.1–1.6 | 1.3 | 1.1–1.6 | ***ab |
| Vitamin B6 (mg) | 1.6 | 1.3–1.8 | 1.4 | 1.2–1.7 | 1.3 | 1.1–1.6 | ***abc | 1.3 | 1.1–1.6 | 1.3 | 1.1–1.5 | 1.2 | 1.0–1.5 | ***abc |
| Folate (present in food by nature) (µg) | 254 | 209–303 | 254 | 210–303 | 247 | 210–290 | *abc | 223 | 185–265 | 241 | 202–285 | 239 | 202–282 | ***ab |
| Folate equivalents (µg) | 260 | 213–315 | 263 | 216–322 | 253 | 216–308 | ***a | 227 | 188–273 | 247 | 206–299 | 246 | 206–302 | ***ab |
| Vitamin B12 (µg) | 3.9 | 3.0–5.2 | 4.1 | 3.2–5.6 | 4.0 | 3.2–5.5 | ***a | 3.3 | 2.5–4.3 | 3.6 | 2.8–4.9 | 3.5 | 2.7–4.6 | ***ab |
| Vitamin C (mg) | 89 | 64–120 | 95 | 68–128 | 104 | 76–134 | ***abc | 90 | 65–120 | 108 | 79–138 | 115 | 89–147 | ***abc |
| Vitamin E (mg) | 14 | 11–18 | 13 | 10–17 | 12 | 9–16 | ***abc | 11 | 9–14 | 11 | 9–14 | 10 | 10 8–13 | ***abc |
| Calcium (mg) | 978 | 775–1231 | 1001 | 798–1247 | 1003 | 817–1211 | ***a | 890 | 707–1100 | 974 | 788–1199 | 994 | 814–1196 | ***ab |
| Men (n = 23,296) | Women (n = 35,675) | |||||||||||||
|---|---|---|---|---|---|---|---|---|---|---|---|---|---|---|
| Low SES (n = 6590) | Moderate SES (n = 8563) | High SES (n = 8143) | Low SES (n = 10,500) | Moderate SES (n = 14,314) | High SES (n = 10,861) | |||||||||
| Median | 25th–75th Percentile | Median | 25th–75th Percentile | Median | 25th–75th Percentile | Median | 25th–75th Percentile | Median | 25th–75th Percentile | Median | 25th–75th Percentile | |||
| Energy (kcal) | 2355 | 1957–2834 | 2432 | 2013–2892 | 2319 | 1949–2725 | ***abc | 1801 | 1512–2135 | 1868 | 1564–2199 | 1868 | 1576–2188 | ***ab |
| Total carbohydrates (g) | 253 | 207–309 | 264 | 214–317 | 249 | 206–299 | ***abc | 195 | 161–235 | 206 | 170–245 | 206 | 170–244 | ***ab |
| (En%) | 45.1 | 41.2–49.0 | 45.5 | 41.8–49.3 | 45.4 | 41.8–49.1 | ***ab | 45 | 41.1–48.9 | 45.8 | 42.1–49.5 | 45.9 | 42.4–49.6 | ***abc |
| Mono- and disaccharides (g) | 109 | 82–141 | 111 | 85–143 | 104 | 81–132 | ***abc | 87 | 68–111 | 90 | 71–114 | 88 | 70–110 | ***ac |
| Polysaccharides (g) | 141 | 114–174 | 148 | 120–180 | 143 | 118–173 | ***ac | 106 | 87–128 | 113 | 93–135 | 115 | 94–137 | ***abc |
| Total fat (g) | 96 | 75–122 | 98 | 77–124 | 93 | 74–114 | ***abc | 72 | 56–90 | 74 | 58–93 | 73 | 58–90 | ***abc |
| (En%) | 36.9 | 32.3–42.2 | 36.9 | 32.5–41.8 | 36.5 | 32.6–40.8 | ***bc | 35.6 | 31.2–40.3 | 35.9 | 31.9–40.3 | 35.5 | 31.7–39.5 | ***ac |
| Saturated fatty acids (g) | 33 | 26–41 | 33 | 26–42 | 32 | 26–40 | ***abc | 25 | 20–32 | 26 | 21–33 | 26 | 21–32 | ***ab |
| Monounsaturated fatty acids (g) | 33 | 26–43 | 35 | 27–44 | 33 | 26–41 | ***abc | 25 | 19–31 | 26 | 20–33 | 25 | 20–32 | ***abc |
| Polyunsaturated fatty acids (g) | 21 | 15–28 | 21 | 15–27 | 19 | 14–25 | ***bc | 15 | 11–19 | 15 | 11–19 | 14 | 11–18 | ***bc |
| Eicosapentaenoic acid (EPA) (g) | 0.04 | 0.01–0.08 | 0.04 | 0.01–0.08 | 0.06 | 0.02–0.10 | ***bc | 0.04 | 0.01–0.08 | 0.04 | 0.01–0.08 | 0.05 | 0.02–0.10 | ***bc |
| Docosahexaenoic acid (DHA) (g) | 0.06 | 0.02–0.11 | 0.05 | 0.02–0.11 | 0.08 | 0.03–0.15 | ***bc | 0.05 | 0.01–0.11 | 0.05 | 0.01–0.11 | 0.08 | 0.02–0.14 | ***bc |
| Total protein (g) | 82 | 69–97 | 85 | 72–100 | 84 | 72–97 | ***abc | 69 | 59–80 | 71 | 60–81 | 72 | 62–82 | ***abc |
| (En%) | 14.6 | 13.3–16.1 | 14.7 | 13.4–16.2 | 15.3 | 14.0–16.7 | ***abc | 15.8 | 14.2–17.5 | 15.6 | 14.1–17.3 | 16 | 14.5–17.6 | ***abc |
| Vegetable protein (g) | 35 | 28–43 | 37 | 30–45 | 37 | 30–44 | ***ab | 27 | 23–33 | 29 | 24–34 | 30 | 25–36 | ***abc |
| Animal protein (g) | 46 | 38–56 | 47 | 39–57 | 47 | 38–55 | ***ac | 41 | 33–49 | 41 | 34–49 | 41 | 33–49 | *c |
| Alcohol (g) | 6.7 | 2.5–15.4 | 6.7 | 2.5–15.0 | 6.8 | 2.7–15.5 | **b | 2 | 0.0–6.9 | 2.5 | 0.3–6.7 | 3.4 | 0.9–8.3 | ***abc |
| (En%) | 2.2 | 0.7–4.4 | 2.1 | 0.8–4.3 | 2.4 | 0.9–4.5 | ***bc | 0.8 | 0.0–2.8 | 0.9 | 0.1–2.6 | 1.3 | 0.4–3.2 | ***abc |
| Fibre (g) | 24 | 19–29 | 25 | 20–30 | 25 | 21–30 | ***ab | 20 | 17–24 | 21 | 17–25 | 22 | 18–26 | ***abc |
| (En%) | 2 | 1.7–2.3 | 2 | 1.7–2.3 | 2.1 | 1.8–2.4 | ***bc | 2.1 | 1.8–2.5 | 2.1 | 1.8–2.5 | 2.3 | 2.0–2.6 | ***abc |
| Retinol equivalents (µg) | 1194 | 889–1633 | 1147 | 865–1544 | 1118 | 856–1465 | ***abc | 961 | 737–1264 | 945 | 734–1207 | 980 | 764–1234 | ***ac |
| Vitamin B2 (mg) | 1.5 | 1.2–1.8 | 1.5 | 1.2–1.8 | 1.5 | 1.2–1.8 | ***ac | 1.3 | 1.1–1.6 | 1.3 | 1.0–1.6 | 1.3 | 1.1–1.6 | - |
| Vitamin B6 (mg) | 1.5 | 1.2–1.8 | 1.3 | 1.3–1.8 | 1.5 | 1.3–1.8 | ***abc | 1.3 | 1.1–1.5 | 1.3 | 1.1–1.5 | 1.4 | 1.2–1.6 | ***abc |
| Folate (present in food by nature) (µg) | 250 | 203–299 | 252 | 209–303 | 258 | 215–305 | ***abc | 222 | 184–265 | 224 | 186–265 | 241 | 203–286 | ***bc |
| Folate equivalents (µg) | 256 | 208–312 | 259 | 213–316 | 267 | 221–321 | ***abc | 227 | 187–276 | 228 | 189–274 | 247 | 207–297 | ***bc |
| Vitamin B12 (µg) | 4.0 | 3.0–5.4 | 4.0 | 3.0–5.3 | 4.1 | 3.1–5.5 | ***bc | 3.4 | 2.6–4.5 | 3.3 | 2.6–4.4 | 3.5 | 2.7–4.7 | ***abc |
| Vitamin C (mg) | 88 | 62–120 | 90 | 65–122 | 96 | 71–127 | ***abc | 96 | 68–127 | 92 | 66–123 | 101 | 74–131 | ***abc |
| Vitamin E (mg) | 13 | 10–17 | 14 | 11–18 | 13 | 10–17 | ***bc | 11 | 9–14 | 11 | 9–14 | 11 | 9–14 | **ac |
| Calcium (mg) | 977 | 775–1232 | 987 | 785–1241 | 993 | 792–1233 | - | 925 | 735–1137 | 908 | 722–1121 | 929 | 743–1142 | ***ac |
| Men (n = 23,703) | Women (n = 36,278) | |||||||||||||
|---|---|---|---|---|---|---|---|---|---|---|---|---|---|---|
| Normal Weight (n = 8875) | Overweight (n = 11,690) | Obesity (n = 3138) | Normal Weight (n = 18,608) | Overweight (n = 12,198) | Obesity (n = 5472) | |||||||||
| Median | 25th–75th Percentile | Median | 25th–75th Percentile | Median | 25th–75th Percentile | Median | 25th–75th Percentile | Median | 25th–75th Percentile | Median | 25th–75th Percentile | |||
| Energy (kcal) | 2473 | 2081–2910 | 2324 | 1937–2765 | 2218 | 1823–2689 | ***abc | 1898 | 1602–2219 | 1806 | 1519–2139 | 1766 | 1461–2100 | ***abc |
| Total carbohydrates (g) | 272 | 226–326 | 249 | 204–300 | 232 | 188–283 | ***abc | 210 | 175–248 | 196 | 161–234 | 192 | 155–233 | ***abc |
| (En%) | 46.3 | 42.8–50.1 | 45 | 41.3–48.7 | 43.8 | 39.5–47.8 | ***abc | 46.2 | 42.6–49.9 | 45.2 | 41.3–48.8 | 44.8 | 40.8–48.5 | ***bc |
| Mono- and disaccharides (g) | 116 | 90–146 | 105 | 81–135 | 94 | 71–124 | ***abc | 92 | 73–116 | 86 | 67–109 | 83 | 64–106 | ***abc |
| Polysaccharides (g) | 153 | 126–184 | 141 | 114–170 | 134 | 108–165 | ***abc | 115 | 95–137 | 108 | 88–130 | 107 | 86–130 | ***ab |
| Total fat (g) | 98 | 79–122 | 94 | 74–118 | 92 | 71–116 | ***abc | 75 | 59–93 | 71 | 57–90 | 70 | 55–88 | ***abc |
| (En%) | 36.5 | 32.3–41.1 | 36.8 | 32.5–41.6 | 37 | 32.7–42.2 | ***ab | 35.7 | 31.7–40.1 | 35.7 | 31.6–40.0 | 35.4 | 31.4–40.0 | - |
| Saturated fatty acids (g) | 34 | 27–42 | 32 | 26–40 | 31 | 24–40 | ***abc | 27 | 21–33 | 25 | 20–32 | 25 | 19–31 | ***abc |
| Monounsaturated fatty acids (g) | 35 | 28–43 | 33 | 26–42 | 32 | 25–42 | ***abc | 26 | 20–33 | 25 | 20–31 | 25 | 19–31 | ***abc |
| Polyunsaturated fatty acids (g) | 20 | 16–27 | 20 | 15–26 | 19 | 14–26 | ***abc | 15 | 11–19 | 14 | 11–19 | 14 | 10–18 | ***abc |
| Eicosapentaenoic acid (EPA) (g) | 0.04 | 0.01–0.09 | 0.05 | 0.02–0.09 | 0.05 | 0.02–0.09 | ***ab | 0.04 | 0.01–0.09 | 0.04 | 0.01–0.09 | 0.04 | 0.01–0.08 | ***bc |
| Docosahexaenoic acid (DHA) (g) | 0.06 | 0.02–0.12 | 0.06 | 0.02–0.13 | 0.07 | 0.02–0.13 | ***ab | 0.06 | 0.02–0.012 | 0.06 | 0.02–0.13 | 0.06 | 0.02–0.11 | ***bc |
| Total protein (g) | 86 | 73–99 | 83 | 71–97 | 82 | 69–97 | ***ab | 71 | 60–82 | 70 | 60–81 | 70 | 59–81 | * |
| (En%) | 14.6 | 13.3–16.0 | 15 | 13.7–16.5 | 15.5 | 13.9–17.0 | ***abc | 15.5 | 14.0–17.1 | 16 | 14.5–17.7 | 16.2 | 14.6–18.0 | ***abc |
| Vegetable protein (g) | 39 | 32–47 | 36 | 29–43 | 34 | 27–42 | ***abc | 30 | 25–35 | 28 | 23–34 | 27 | 22–33 | ***abc |
| Animal protein (g) | 46 | 38–55 | 47 | 39–56 | 48 | 39–58 | ***abc | 40 | 33–48 | 42 | 34–50 | 42 | 35–50 | ***ab |
| Alcohol (g) | 6.7 | 2.6–13.3 | 6.9 | 2.6–15.9 | 6.7 | 1.9–15.8 | ***ac | 2.9 | 0.7–7.1 | 2.6 | 0.3–7.1 | 1.3 | 0.0–5.2 | ***abc |
| (En%) | 2.1 | 0.7–4.1 | 2.4 | 0.9–4.7 | 2.2 | 0.6–4.8 | ***abc | 1.1 | 0.3–2.9 | 1 | 0.1–3.0 | 0.5 | 0.0–1.9 | ***abc |
| Fibre (g) | 26 | 21–31 | 24 | 20–29 | 23 | 19–28 | ***abc | 21 | 18–26 | 21 | 17–25 | 20 | 16–24 | ***abc |
| (En%) | 2 | 1.7–2.3 | 2 | 1.7–2.3 | 2 | 1.7–2.3 | ***ab | 2.2 | 1.9–2.5 | 2.2 | 1.9–2.5 | 2.2 | 1.9–2.5 | - |
| Retinol equivalents (µg) | 1151 | 879–1519 | 1142 | 865–1548 | 1155 | 844–1589 | - | 955 | 745–1221 | 963 | 745–1233 | 964 | 740–1273 | *b |
| Vitamin B2 (mg) | 1.5 | 1.2–1.8 | 1.5 | 1.2–1.8 | 1.4 | 1.2–1.8 | ***bc | 1.3 | 1.0–1.6 | 1.3 | 1.1–1.6 | 1.3 | 1.0–1.6 | *a |
| Vitamin B6 (mg) | 1.5 | 1.3–1.8 | 1.5 | 1.2–1.8 | 1.4 | 1.2–1.7 | ***abc | 1.3 | 1.1–1.5 | 1.3 | 1.1–1.5 | 1.3 | 1.1–1.5 | ***abc |
| Folate (present in food by nature) (µg) | 261 | 217–313 | 250 | 207–298 | 243 | 200–293 | ***abc | 231 | 192–275 | 227 | 189–270 | 223 | 183–265 | ***abc |
| Folate equivalents (µg) | 269 | 222–327 | 258 | 212–312 | 248 | 204–303 | ***abc | 236 | 195–285 | 233 | 193–280 | 227 | 86–273 | ***abc |
| Vitamin B12 (µg) | 3.9 | 3.0–5.1 | 4.1 | 3.1–5.4 | 4.2 | 3.1–5.8 | ***abc | 3.4 | 2.6–4.4 | 3.4 | 2.7–4.6 | 3.5 | 2.7–4.7 | ***ab |
| Vitamin C (mg) | 93 | 67–125 | 91 | 66–122 | 88 | 63–120 | ***abc | 96 | 70–127 | 97 | 70–127 | 94 | 66–124 | ***bc |
| Vitamin E (mg) | 14 | 11–17 | 13 | 10–17 | 13 | 10–17 | ***abc | 11 | 9–14 | 11 | 9–14 | 11 | 8–14 | ***ab |
| Calcium (mg) | 998 | 797–1250 | 986 | 786–1232 | 957 | 746–1205 | ***bc | 920 | 728–1135 | 924 | 739–1140 | 907 | 726–1120 | **c |
3.3. Food Intake
| Men (n = 23,703) | Women (n = 36,279) | ||||
|---|---|---|---|---|---|
| Median | 25th–75th Percentile | Median | 25th–75th Percentile | ||
| Alcoholic beverages (g) | 107 | 36–215 | 29 | 4–85 | *** |
| Artificially sweetened beverages (g) | 9 | 0–80 | 13 | 0–80 | *** |
| Bread (g) | 163 | 120–208 | 116 | 83–148 | *** |
| Breakfast cereals (g) | 0 | 0–6 | 0 | 0–8 | *** |
| Cake and cookies (g) | 30 | 18–48 | 30 | 18–46 | ** |
| Cheese (g) | 26 | 14–43 | 23 | 13–40 | *** |
| Coffee (g) | 465 | 348–697 | 348 | 161–465 | *** |
| Dairy (g) | 291 | 180–427 | 282 | 170–413 | *** |
| Eggs (g) | 9 | 7–18 | 7 | 4–18 | *** |
| Fat, oils and sauces (g) | 57 | 37–81 | 40 | 26–58 | *** |
| Fish (g) | 13 | 4–22 | 12 | 3–20 | *** |
| Fruits (g) | 105 | 44–203 | 133 | 68–205 | *** |
| Fruit juice (g) | 21 | 0–96 | 21 | 0–54 | *** |
| Legumes (g) | 7 | 0–16 | 4 | 0–11 | *** |
| Meat (g) | 86 | 64–109 | 70 | 46–93 | *** |
| Nuts and seeds (g) | 10 | 5–21 | 7 | 3–14 | *** |
| Pasta (g) | 19 | 12–32 | 19 | 12–26 | *** |
| Potatoes (g) | 95 | 53–138 | 71 | 40–104 | *** |
| Probiotics and drinks lowering cholesterol and blood pressure (g) | 0 | 0–0 | 0 | 0–0 | ** |
| Ready-made products (g) | 31 | 6–51 | 18 | 1–36 | *** |
| Rice (g) | 20 | 8–32 | 16 | 6–25 | *** |
| Savoury snacks (g) | 32 | 16–51 | 22 | 11–39 | *** |
| Soft drinks (g) | 34 | 0–116 | 9 | 0–62 | *** |
| Soup (g) | 36 | 22–89 | 36 | 22–72 | *** |
| Soy products (g) | 0 | 0–0 | 0 | 0–0 | *** |
| Sweets (g) | 34 | 17–57 | 25 | 12–42 | *** |
| Tea (g) | 116 | 11–232 | 232 | 89–465 | *** |
| Vegan products other than soy (g) | 0 | 0–0 | 0 | 0–0 | *** |
| Vegetables (g) | 131 | 89–184 | 148 | 106–205 | *** |
| Water (g) | 279 | 107–482 | 418 | 161–557 | *** |
| Men (n = 23,703) | Women (n = 36,279) | |||||||||||||
|---|---|---|---|---|---|---|---|---|---|---|---|---|---|---|
| 18–50 Years (n = 14,890) | 51–70 Years (n = 8144) | >70 Years (n = 669) | 18–50 Years (n = 24,361) | 51–70 Years (n = 11,185) | >70 Years (n = 733) | |||||||||
| Median | 25th–75th Percentile | Median | 25th–75th Percentile | Median | 25th–75th Percentile | Median | 25th–75th Percentile | Median | 25th–75th Percentile | Median | 25th–75th Percentile | |||
| Alcoholic beverages (g) | 107 | 36–223 | 110 | 38–217 | 64 | 17–139 | ***bc | 27 | 4–72 | 36 | 7–101 | 14 | 0–64 | ***abc |
| Artificially sweetened beverages (g) | 13 | 0–95 | 5 | 0–54 | 0 | 0–27 | ***abc | 18 | 0–96 | 5 | 0–43 | 0 | 0–21 | ***abc |
| Bread (g) | 169 | 129–214 | 149 | 111–198 | 132 | 100–166 | ***abc | 119 | 84–151 | 114 | 82–145 | 108 | 78–137 | ***abc |
| Breakfast cereals (g) | 0 | 0–6 | 0 | 0–6 | 0 | 0–6 | ***a | 0 | 0–9 | 0 | 0–6 | 0 | 0–6 | ***ab |
| Cake and cookies (g) | 30 | 17–47 | 30 | 18–48 | 35 | 23–50 | ***bc | 30 | 18–46 | 30 | 17–47 | 35 | 23–50 | ***bc |
| Cheese (g) | 24 | 12–41 | 29 | 17–46 | 30 | 18–47 | ***ab | 21 | 11–37 | 28 | 17–43 | 29 | 18–42 | ***ab |
| Coffee (g) | 465 | 322–697 | 465 | 348–697 | 465 | 348–523 | ***abc | 348 | 45–465 | 465 | 241–581 | 348 | 232–465 | ***abc |
| Dairy (g) | 290 | 177–430 | 292 | 183–421 | 307 | 204–422 | - | 276 | 164–400 | 293 | 183–422 | 309 | 236–440 | ***abc |
| Eggs (g) | 9 | 7–18 | 14 | 7–18 | 18 | 7–18 | ***abc | 7 | 4–18 | 9 | 7–18 | 18 | 7–18 | ***abc |
| Fat, oils and sauces (g) | 59 | 40–84 | 53 | 34–77 | 47 | 30–70 | ***abc | 42 | 27–61 | 36 | 23–53 | 33 | 21–49 | ***abc |
| Fish (g) | 11 | 3–20 | 16 | 8–25 | 15 | 9–22 | ***ab | 11 | 1–19 | 15 | 6–24 | 13 | 5–20 | ***abc |
| Fruits (g) | 89 | 40–192 | 130 | 69–211 | 197 | 101–231 | ***abc | 104 | 48–199 | 193 | 85–216 | 205 | 141–292 | ***abc |
| Fruit juice (g) | 27 | 0–107 | 21 | 0–54 | 13 | 0–54 | ***ab | 21 | 0–96 | 13 | 0–54 | 11 | 0–54 | ***ab |
| Legumes (g) | 7 | 0–16 | 9 | 0–18 | 9 | 0–16 | ***ab | 4 | 0–11 | 7 | 0–16 | 7 | 0–16 | ***ab |
| Meat (g) | 90 | 66–112 | 80 | 61–103 | 71 | 48–93 | ***abc | 72 | 49–95 | 67 | 41–89 | 62 | 36–75 | ***abc |
| Nuts and seeds (g) | 11 | 5–21 | 10 | 4–21 | 6 | 3–14 | ***bc | 7 | 3–14 | 7 | 3–15 | 4 | 1–10 | ***bc |
| Pasta (g) | 24 | 13–39 | 19 | 8–26 | 12 | 3–18 | ***abc | 19 | 12–32 | 13 | 8–19 | 8 | 3–13 | ***abc |
| Potatoes (g) | 97 | 55–140 | 90 | 50–135 | 90 | 40–135 | ***ab | 72 | 42–105 | 65 | 34–104 | 69 | 27–103 | ***ab |
| Probiotics and drinks lowering cholesterol and blood pressure (g) | 0 | 0–0 | 0 | 0–0 | 0 | 0–0 | - | 0 | 0–0 | 0 | 0–0 | 0 | 0–0 | *a |
| Ready-made products (g) | 33 | 13–53 | 14 | 0–33 | 1 | 0–26 | ***abc | 31 | 12–43 | 13 | 0–32 | 0 | 0–15 | ***abc |
| Rice (g) | 20 | 10–34 | 16 | 6–26 | 10 | 0–20 | ***abc | 16 | 6–26 | 15 | 4–24 | 10 | 0–16 | ***abc |
| Savoury snacks (g) | 39 | 22–59 | 20 | 9–37 | 8 | 2–17 | ***abc | 28 | 15–44 | 14 | 5–25 | 6 | 1–14 | ***abc |
| Soft drinks (g) | 62 | 11–156 | 10 | 0–52 | 0 | 0–31 | ***abc | 21 | 0–94 | 0 | 0–18 | 0 | 0–13 | ***ab |
| Soup (g) | 36 | 22–72 | 36 | 22–89 | 36 | 22–89 | - | 36 | 22–45 | 36 | 22–72 | 36 | 22–72 | ***ab |
| Soy products (g) | 0 | 0–0 | 0 | 0–0 | 0 | 0–0 | ***a | 0 | 0–0 | 0 | 0–0 | 0 | 0–0 | ***ac |
| Sweets (g) | 37 | 19–60 | 30 | 4–50 | 31 | 16–48 | ***ab | 27 | 14–45 | 20 | 10–35 | 21 | 10–34 | ***ab |
| Tea (g) | 89 | 11–232 | 116 | 18–241 | 232 | 116–465 | ***abc | 232 | 89–465 | 232 | 116–465 | 348 | 161–465 | ***abc |
| Vegan products other than soy (g) | 0 | 0–0 | 0 | 0–0 | 0 | 0–0 | * | 0 | 0–0 | 0 | 0–0 | 0 | 0–0 | *c |
| Vegetables (g) | 128 | 87–181 | 136 | 93–190 | 135 | 93–180 | ***a | 143 | 100–199 | 162 | 118–217 | 152 | 109–200 | ***abc |
| Water (g) | 279 | 107–557 | 279 | 107–418 | 279 | 139–418 | ***ab | 386 | 139–579 | 418 | 193–557 | 418 | 161–557 | ***a |
| Men (n = 23,296) | Women (n = 35,675) | |||||||||||||
|---|---|---|---|---|---|---|---|---|---|---|---|---|---|---|
| Low SES (n = 6590) | Moderate SES (n = 8563) | High SES (n = 8143) | Low SES (n = 10,500) | Moderate SES (n = 14,314) | High SES (n = 10,861) | |||||||||
| Median | 25th–75th Percentile | Median | 25th–75th Percentile | Median | 25th–75th Percentile | Median | 25th–75th Percentile | Median | 25th–75th Percentile | Median | 25th–75th Percentile | |||
| Alcoholic beverages (g) | 107 | 33–229 | 107 | 36–227 | 107 | 39–208 | - | 21 | 0–76 | 27 | 4–71 | 27 | 4–71 | ***abc |
| Artificially sweetened beverages (g) | 7 | 0–80 | 11 | 0–92 | 11 | 0–72 | - | 11 | 0–72 | 13 | 0–95 | 13 | 0–95 | ***ac |
| Bread (g) | 165 | 123–213 | 166 | 124–211 | 153 | 113–201 | ***bc | 118 | 85–148 | 117 | 83–149 | 117 | 83–149 | - |
| Breakfast cereals (g) | 0 | 0–3 | 0 | 0–6 | 0 | 0–10 | ***abc | 0 | 0–5 | 0 | 0–6 | 0 | 0–6 | ***abc |
| Cake and cookies (g) | 31 | 18–48 | 31 | 18–48 | 30 | 17–47 | **bc | 31 | 18–47 | 31 | 18–47 | 31 | 18–47 | ***bc |
| Cheese (g) | 26 | 14–44 | 25 | 13–42 | 26 | 14–43 | **ac | 23 | 13–40 | 22 | 12–39 | 22 | 12–39 | ***ac |
| Coffee (g) | 465 | 348–697 | 465 | 348–397 | 465 | 348–697 | *b | 465 | 232–581 | 348 | 116–465 | 348 | 116–465 | ***abc |
| Dairy (g) | 288 | 177–423 | 294 | 185–431 | 291 | 178–426 | ***ac | 288 | 178–418 | 284 | 172–417 | 284 | 172–417 | ***bc |
| Eggs (g) | 14 | 7–18 | 9 | 7–18 | 9 | 7–18 | ***abc | 7 | 4–18 | 7 | 4–18 | 7 | 4–18 | ***ab |
| Fat, oils and sauces (g) | 58 | 38–84 | 59 | 39–84 | 53 | 35–76 | ***bc | 39 | 25–58 | 41 | 27–59 | 41 | 27–59 | ***ac |
| Fish (g) | 11 | 3–20 | 12 | 4–21 | 16 | 6–25 | ***bc | 11 | 2–19 | 11 | 2–19 | 11 | 2–19 | ***bc |
| Fruits (g) | 101 | 41–202 | 100 | 42–201 | 111 | 52–205 | ***bc | 137 | 65–207 | 110 | 52–202 | 110 | 52–202 | ***abc |
| Fruit juice (g) | 13 | 0–54 | 27 | 0–107 | 27 | 5–107 | ***abc | 13 | 0–54 | 21 | 0–64 | 21 | 0–64 | ***abc |
| Legumes (g) | 7 | 0–18 | 7 | 0–16 | 7 | 0–16 | ***ab | 4 | 0–16 | 4 | 0–11 | 4 | 0–11 | ***abc |
| Meat (g) | 86 | 64–110 | 89 | 66–111 | 83 | 62–105 | ***abc | 70 | 46–92 | 72 | 50–95 | 72 | 50–95 | ***abc |
| Nuts and seeds (g) | 9 | 3–19 | 10 | 4–21 | 12 | 5–22 | ***abc | 6 | 2–14 | 7 | 3–14 | 7 | 3–14 | ***abc |
| Pasta (g) | 19 | 11–32 | 19 | 13–32 | 20 | 13–45 | ***abc | 13 | 8–20 | 19 | 12–26 | 19 | 12–26 | ***abc |
| Potatoes (g) | 100 | 55–149 | 97 | 58–147 | 86 | 48–122 | ***bc | 73 | 45–106 | 72 | 45–105 | 72 | 45–105 | ***bc |
| Probiotics and drinks lowering cholesterol and blood pressure (g) | 0 | 0–0 | 0 | 0–0 | 0 | 0–0 | ***abc | 0 | 0–0 | 0 | 0–0 | 0 | 0–0 | ***abc |
| Ready-made products (g) | 14 | 0–36 | 32 | 12–52 | 33 | 12–52 | ***abc | 13 | 0–32 | 26 | 6–36 | 26 | 6–36 | ***abc |
| Rice (g) | 15 | 2–26 | 20 | 8–31 | 21 | 11–39 | ***abc | 15 | 4–21 | 16 | 6–25 | 16 | 6–25 | ***abc |
| Savoury snacks (g) | 26 | 12–46 | 34 | 19–54 | 33 | 17–52 | ***abc | 18 | 8–33 | 25 | 13–42 | 25 | 13–42 | ***abc |
| Soft drinks (g) | 35 | 0–126 | 42 | 3–136 | 26 | 0–94 | ***abc | 0 | 0–47 | 13 | 0–90 | 13 | 0–90 | ***abc |
| Soup (g) | 36 | 22–72 | 36 | 22–72 | 36 | 22–89 | - | 36 | 22–72 | 36 | 22–67 | 36 | 22–67 | - |
| Soy products (g) | 0 | 0–0 | 0 | 0–0 | 0 | 0–0 | ***abc | 0 | 0–0 | 0 | 0–0 | 0 | 0–0 | ***abc |
| Sweets (g) | 34 | 17–58 | 36 | 18–59 | 33 | 17–54 | ***abc | 23 | 11–40 | 26 | 13–43 | 26 | 13–43 | ***abc |
| Tea (g) | 89 | 0–232 | 89 | 11–232 | 134 | 36–348 | ***abc | 232 | 80–348 | 232 | 89–465 | 232 | 89–465 | ***abc |
| Vegan products other than soy (g) | 0 | 0–0 | 0 | 0–0 | 0 | 0–0 | ***abc | 0 | 0–0 | 0 | 0–0 | 0 | 0–0 | ***abc |
| Vegetables (g) | 122 | 81–171 | 126 | 86–178 | 146 | 102–200 | ***abc | 137 | 96–188 | 143 | 101–197 | 143 | 101–197 | ***abc |
| Water (g) | 279 | 107–557 | 279 | 107–557 | 279 | 107–418 | - | 418 | 193–697 | 418 | 161–579 | 418 | 161–579 | ***abc |
| Men (n = 23,703) | Women (n = 36,278) | |||||||||||||
|---|---|---|---|---|---|---|---|---|---|---|---|---|---|---|
| Normal Weight (n = 8875) | Overweight (n = 11,690) | Obesity (n = 3138) | Normal Weight (n = 18,608) | Overweight (n = 12,198) | Obesity (n = 5472) | |||||||||
| Median | 25th–75th Percentile | Median | 25th–75th Percentile | Median | 25th–75th Percentile | Median | 25th–75th Percentile | Median | 25th–75th Percentile | Median | 25th–75th Percentile | |||
| Alcoholic beverages (g) | 105 | 36–214 | 109 | 38–223 | 99 | 27–217 | ***abc | 35 | 7–90 | 29 | 4–87 | 13 | 0–56 | ***abc |
| Artificially sweetened beverages (g) | 0 | 0–54 | 13 | 0–92 | 29 | 0–143 | ***abc | 7 | 0–54 | 13 | 0–93 | 29 | 0–139 | ***abc |
| Bread (g) | 171 | 132–216 | 154 | 114–204 | 149 | 109–200 | ***abc | 119 | 86–151 | 113 | 81–145 | 116 | 82–147 | ***ab |
| Breakfast cereals (g) | 0 | 0–10 | 0 | 0–5 | 0 | 0–1 | ***abc | 1 | 0–9 | 0 | 0–6 | 0 | 0–4 | ***abc |
| Cake and cookies (g) | 32 | 19–50 | 30 | 17–47 | 27 | 15–43 | ***abc | 31 | 18–47 | 30 | 17–46 | 29 | 16–44 | ***ab |
| Cheese (g) | 25 | 13–42 | 26 | 14–43 | 26 | 14–43 | **ab | 23 | 13–40 | 23 | 13–40 | 22 | 13–39 | *c |
| Coffee (g) | 465 | 241–581 | 465 | 348–697 | 465 | 348–697 | ***ab | 348 | 116–465 | 348 | 232–581 | 348 | 161–581 | ***ab |
| Dairy (g) | 295 | 186–431 | 292 | 182–427 | 276 | 162–407 | ***bc | 281 | 166–409 | 285 | 175–418 | 282 | 168–413 | **a |
| Eggs (g) | 9 | 7–18 | 14 | 7–18 | 14 | 7–18 | ***abc | 7 | 4–18 | 7 | 4–18 | 9 | 4–18 | ***ab |
| Fat, oils and sauces (g) | 59 | 40–84 | 56 | 37–80 | 53 | 34–77 | ***abc | 42 | 27–60 | 39 | 25–57 | 37 | 24–54 | ***abc |
| Fish (g) | 12 | 4–21 | 13 | 4–22 | 14 | 4–23 | ***ab | 12 | 3–20 | 12 | 4–21 | 12 | 3–20 | **c |
| Fruits (g) | 106 | 46–203 | 105 | 45–204 | 97 | 39–201 | ***bc | 130 | 69–205 | 137 | 70–206 | 115 | 47–204 | ***bc |
| Fruit juice (g) | 27 | 0–107 | 21 | 0–96 | 21 | 0–96 | ***abc | 21 | 0–96 | 21 | 0–54 | 13 | 0–54 | ***abc |
| Legumes (g) | 7 | 0–16 | 7 | 0–16 | 7 | 0–16 | - | 4 | 0–11 | 4 | 0–11 | 4 | 0–11 | ***bc |
| Meat (g) | 83 | 61–106 | 86 | 65–108 | 92 | 68–115 | ***abc | 68 | 41–92 | 72 | 49–94 | 75 | 55–97 | ***abc |
| Nuts and seeds (g) | 11 | 5–22 | 11 | 5–21 | 8 | 3–18 | ***abc | 7 | 3–15 | 7 | 3–14 | 6 | 2–12 | ***abc |
| Pasta (g) | 20 | 13–39 | 19 | 12–32 | 19 | 11–28 | ***abc | 19 | 12–32 | 16 | 8–26 | 13 | 8–20 | ***abc |
| Potatoes (g) | 97 | 55–143 | 95 | 53–136 | 90 | 47–132 | ***abc | 71 | 40–104 | 72 | 40–104 | 68 | 39–104 | - |
| Probiotics and drinks lowering cholesterol and blood pressure (g) | 0 | 0–0 | 0 | 0–0 | 0 | 0–0 | ***abc | 0 | 0–0 | 0 | 0–0 | 0 | 0–0 | ***ab |
| Ready-made products (g) | 32 | 12–52 | 31 | 2–50 | 30 | 1–50 | ***ab | 23 | 6–36 | 16 | 1–35 | 18 | 1–36 | ***ab |
| Rice (g) | 20 | 9–34 | 17 | 6–31 | 16 | 4–27 | ***abc | 16 | 8–26 | 15 | 5–24 | 15 | 4–24 | ***abc |
| Savoury snacks (g) | 33 | 17–53 | 30 | 15–50 | 29 | 15–50 | ***ab | 23 | 12–40 | 21 | 10–38 | 21 | 10–38 | ***ab |
| Soft drinks (g) | 42 | 5–134 | 28 | 0–104 | 26 | 0–126) | ***ab | 13 | 0–67 | 5 | 0–52 | 0 | 0–57 | ***ab |
| Soup (g) | 36 | 22–89 | 36 | 22–89 | 36 | 22–72 | - | 36 | 22–45 | 36 | 22–72 | 36 | 22–72 | ***ab |
| Soy products (g) | 0 | 0–0 | 0 | 0–0 | 0 | 0–0 | ***abc | 0 | 0–0 | 0 | 0–0 | 0 | 0–0 | ***abc |
| Sweets (g) | 41 | 23–65 | 32 | 16–54 | 23 | 10–43 | ***abc | 28 | 14–45 | 22 | 11–39 | 20 | 9–36 | ***abc |
| Tea (g) | 116 | 18–322 | 116 | 11–232 | 80 | 0–232 | ***abc | 241 | 116–465 | 232 | 89–465 | 232 | 80–465 | ***abc |
| Vegan products other than soy (g) | 0 | 0–0 | 0 | 0–0 | 0 | 0–0 | ***abc | 0 | 0–0 | 0 | 0–0 | 0 | 0–0 | ***abc |
| Vegetables (g) | 134 | 93–189 | 129 | 87–181 | 129 | 86–180 | ***ab | 148 | 106–205 | 149 | 106–205 | 147 | 102–203 | *b |
| Water (g) | 279 | 107–418 | 279 | 107–482 | 289 | 139–557 | ***abc | 289 | 139–557 | 418 | 193–697 | 418 | 193–697 | ***abc |
4. Discussion
4.1. Generalisability
4.2. Opportunities of Lifelines Data and Importance of Stratification
4.3. Strengths and Limitations
5. Conclusions
Supplementary Materials
Author Contributions
Funding
Institutional Review Board Statement
Informed Consent Statement
Acknowledgments
Conflicts of Interest
References
- GBD 2017 Diet Collaborators. Health Effects of Dietary Risks in 195 Countries, 1990–2017: A Systematic Analysis for the Global Burden of Disease Study 2017. Lancet 2019, 393, 1958–1972. [Google Scholar] [CrossRef] [Green Version]
- World Health Organization. Global Health Risks: Mortality and Burden of Disease Attributable to Selected Major Risks; World Health Organization: Geneva, Switzerland, 2009. [Google Scholar]
- Key, T.J.; Bradbury, K.E.; Perez-Cornago, A.; Sinha, R.; Tsilidis, K.K.; Tsugane, S. Diet, nutrition, and cancer risk: What do we know and what is the way forward? BMJ 2020, 368, m511. [Google Scholar] [CrossRef] [PubMed] [Green Version]
- Neuenschwander, M.; Ballon, A.; Weber, K.S.; Norat, T.; Aune, D.; Schwingshackl, L.; Schlesinger, S. Role of diet in type 2 diabetes incidence: Umbrella review of meta-analyses of prospective observational studies. BMJ 2019, 366, l2368. [Google Scholar] [CrossRef] [Green Version]
- Pan, A.; Lin, X.; Hemler, E.; Hu, F.B. Diet and Cardiovascular Disease: Advances and Challenges in Population-Based Studies. Cell Metab. 2018, 27, 489–496. [Google Scholar] [CrossRef] [Green Version]
- Franzago, M.; Santurbano, D.; Vitacolonna, E.; Stuppia, L. Genes and Diet in the Prevention of Chronic Diseases in Future Generations. Int. J. Mol. Sci. 2020, 21, 2633. [Google Scholar] [CrossRef]
- O’Grady, J.; Shanahan, F. Macronutrients, microbiome and precision nutrition. Curr. Opin. Gastroenterol. 2020, 37, 145–151. [Google Scholar] [CrossRef] [PubMed]
- Satija, A.; Yu, E.; Willett, W.C.; Hu, F.B. Understanding nutritional epidemiology and its role in policy. Adv. Nutr. 2015, 6, 5–18. [Google Scholar] [CrossRef] [PubMed] [Green Version]
- Scholtens, S.; Smidt, N.; Swertz, M.A.; Bakker, S.J.L.; Dotinga, A.; Vonk, J.M.; Van Dijk, F.; Van Zon, S.K.R.; Wijmenga, C.; Wolffenbuttel, B.H.; et al. Cohort Profile: LifeLines, a three-generation cohort study and biobank. Int. J. Epidemiol. 2015, 44, 1172–1180. [Google Scholar] [CrossRef] [PubMed] [Green Version]
- Brouwer-Brolsma, E.M.; Perenboom, C.; Sluik, D.; van de Wiel, A.; Geelen, A.; Feskens, E.J.; de Vries, J.H. Development and external validation of the ‘Flower-FFQ’: A food frequency questionnaire designed for the Lifelines Cohort Study. Public Health Nutr. 2021; 1–12, (Online ahead of print.). [Google Scholar]
- Goldbohm, R.A.; van’t Veer, P.; van den Brandt, P.A.; van’t Hof, M.A.; Brants, H.A.; Sturmans, F.; Hermus, R.J. Reproducibility of a food frequency questionnaire and stability of dietary habits determined from five annually repeated measurements. Eur. J. Clin. Nutr. 1995, 49, 420–429. [Google Scholar] [PubMed]
- NEVO-Tabel, Dutch Food Composition Table 2011/Version 3; RIVM: Bilthoven, The Netherlands, 2011.
- Willett, W.C. Nutritional Epidemiology, 3rd ed.; Oxford University Press: New York, NY, USA, 2013. [Google Scholar]
- Rhee, J.J.; Sampson, L.; Cho, E.; Hughes, M.D.; Hu, F.B.; Willett, W.C. Comparison of Methods to Account for Implausible Reporting of Energy Intake in Epidemiologic Studies. Am. J. Epidemiol. 2015, 181, 225–233. [Google Scholar] [CrossRef] [PubMed]
- Available online: www.gezondheidsraad.nl (accessed on 1 September 2021).
- Vart, P.; Gansevoort, R.T.; Coresh, J.; Reijneveld, S.; Bültmann, U. Socioeconomic Measures and CKD in the United States and The Netherlands. Clin. J. Am. Soc. Nephrol. 2013, 8, 1685–1693. [Google Scholar] [CrossRef] [PubMed] [Green Version]
- Wendel-Vos, G.C.; Schuit, A.J.; Saris, W.H.; Kromhout, D. Reproducibility and relative validity of the short questionnaire to assess health-enhancing physical activity. J. Clin. Epidemiol. 2003, 56, 1163–1169. [Google Scholar] [CrossRef] [Green Version]
- Ainsworth, B.E.; Haskell, W.L.; Herrmann, S.D.; Meckes, N.; Bassett, D.R., Jr.; Tudor-Locke, C.; Greer, J.L.; Vezina, J.; Whitt-Glover, M.C.; Leon, A.S.; et al. Compendium of Physical Activities: A second update of codes and MET values. Med. Sci. Sport. Exerc. 2011, 43, 1575–1581. [Google Scholar] [CrossRef] [PubMed] [Green Version]
- World Health Organization. Obesity: Preventing and Managing the Global Epidemic: Report of a WHO Consultation; WHO Technical Report Series; World Health Organization: Geneva, Switzerland, 1999. [Google Scholar]
- Rossum, C.T.M.; Fransen, H.P.; Verkaik-Kloosterman, J.; Buurma-Rethans, E.J.M.; Ocké, M.C. Dutch National Food Consumption Survey 2007–2010: Diet of Children Aged 7 to 69 Years; RIVM: Bilthoven, The Netherlands, 2011. [Google Scholar]
- Brouwer-Brolsma, E.M.; Streppel, M.T.; Van Lee, L.; Geelen, A.; Sluik, D.; van de Wiel, A.M.; De Vries, J.H.; Van’t Veer, P.; Feskens, E.J. A National Dietary Assessment Reference Database (NDARD) for the Dutch Population: Rationale behind the Design. Nutrients 2017, 9, 1136. [Google Scholar] [CrossRef] [PubMed] [Green Version]
- Jager, K.; Zoccali, C.; MacLeod, A.; Dekker, F. Confounding: What it is and how to deal with it. Kidney Int. 2008, 73, 256–260. [Google Scholar] [CrossRef] [PubMed] [Green Version]
- Corraini, P.; Olsen, M.; Pedersen, L.; Dekkers, O.M.; Vandenbroucke, J.P. Effect modification, interaction and mediation: An overview of theoretical insights for clinical investigators. Clin. Epidemiol. 2017, 9, 331–338. [Google Scholar] [CrossRef] [PubMed] [Green Version]
- Trijsburg, L.; Geelen, A.; Hollman, P.C.; Hulshof, P.J.; Feskens, E.J.; Veer, P.V.; Boshuizen, H.C.; de Vries, J.H. BMI was found to be a consistent determinant related to misreporting of energy, protein and potassium intake using self-report and duplicate portion methods. Public Health Nutr. 2017, 20, 598–607. [Google Scholar] [CrossRef] [PubMed] [Green Version]
- Naska, A.; Lagiou, A.; Lagiou, P. Dietary assessment methods in epidemiological research: Current state of the art and future prospects. F1000Research 2017, 6, 926. [Google Scholar] [CrossRef] [PubMed] [Green Version]
- Siebelink, E.; Geelen, A.; de Vries, J.H.M. Self-reported energy intake by FFQ compared with actual energy intake to maintain body weight in 516 adults. Br. J. Nutr. 2011, 106, 274–281. [Google Scholar] [CrossRef] [PubMed] [Green Version]
- Streppel, M.T.; de Vries, J.H.; Meijboom, S.; Beekman, M.; De Craen, A.J.; Slagboom, P.E.; Feskens, E.J. Relative validity of the food frequency questionnaire used to assess dietary intake in the Leiden Longevity Study. Nutr. J. 2013, 12, 75–78. [Google Scholar] [CrossRef] [PubMed] [Green Version]

| Men (n = 53,026) | Women (n = 75,847) | |||||||||
|---|---|---|---|---|---|---|---|---|---|---|
| Completed Total Flower FFQ (n = 23,703) | Did Not Complete Total Flower FFQ (n = 29,323) | Completed Total Flower FFQ (n = 36,279) | Did Not Complete Total Flower FFQ (n = 39,568) | |||||||
| Median/n | 25th–75th Percentile/% | Median/n | 25th–75th Percentile/% | Median/n | 25th–75th Percentile/% | Median/n | 25th–75th Percentile/% | |||
| Age (years) | 47 | 39–56 | 44 | 34–51 | *** *** | 46 | 38–54 | 43 | 33–50 | *** *** |
| Age category | ||||||||||
| 18–50 years | 14,890 | 62.8 | 21,550 | 73.5 | 24,361 | 67.1 | 30,199 | 76.3 | ||
| 51–70 years | 8144 | 34.3 | 6738 | 23.0 | 11,185 | 30.8 | 8344 | 21.1 | ||
| >70 years | 669 | 2.8 | 1035 | 3.5 | 733 | 2.0 | 1025 | 2.6 | ||
| Province | *** | *** | ||||||||
| Friesland | 8743 | 36.9 | 10,847 | 37.0 | 13,562 | 37.4 | 14,683 | 37.1 | ||
| Groningen | 7461 | 31.5 | 8679 | 29.6 | 11,246 | 31.0 | 11,555 | 29.2 | ||
| Drenthe | 6991 | 29.5 | 8820 | 30.1 | 10,641 | 29.3 | 11,978 | 30.3 | ||
| Other | 502 | 2.1 | 725 | 2.5 | 812 | 2.2 | 1055 | 2.7 | ||
| Unknown | 6 | 0.0 | 252 | 0.9 | 15 | 0.0 | 297 | 0.8 | ||
| Ethnicity | *** | *** | ||||||||
| White, East/West European | 23,232 | 98.0 | 20,286 | 69.2 | 35,167 | 96.9 | 28,212 | 71.3 | ||
| Other | 308 | 1.3 | 448 | 1.5 | 628 | 1.7 | 789 | 2.0 | ||
| Unknown | 163 | 0.7 | 8589 | 29.3 | 484 | 1.3 | 10,567 | 26.7 | ||
| SES | *** | *** | ||||||||
| Low | 6590 | 27.8 | 8515 | 29.0 | 10,500 | 28.9 | 11,475 | 29.0 | ||
| Moderate | 8563 | 36.1 | 11,317 | 38.6 | 14,314 | 39.5 | 16,167 | 40.9 | ||
| High | 8143 | 34.4 | 8781 | 29.9 | 10,861 | 29.9 | 11,047 | 27.9 | ||
| Unknown | 407 | 1.7 | 710 | 2.4 | 604 | 1.7 | 879 | 2.2 | ||
| Smoking | *** | *** | ||||||||
| Current smoker | 4468 | 18.8 | 7435 | 25.4 | 5876 | 16.2 | 8718 | 22.0 | ||
| Former smoker | 8722 | 36.8 | 9198 | 31.4 | 2480 | 34.4 | 11,737 | 29.7 | ||
| Never smoker | 10,359 | 43.7 | 12,452 | 42.5 | 17,681 | 48.7 | 18,769 | 47.4 | ||
| Unknown | 154 | 0.6 | 238 | 0.8 | 242 | 0.7 | 344 | 0.9 | ||
| Physical activity: MVPA (minutes per week) | 285 | 120–627 | 280 | 90–630 | ** *** | 245 | 115–520 | 240 | 90–480 | *** *** |
| Physical activity category | ||||||||||
| MVPA performance | 19,562 | 82.5 | 23,179 | 79.0 | 31,361 | 86.4 | 32,707 | 82.7 | ||
| No MVPA performance | 2246 | 9.5 | 3252 | 11.1 | 2743 | 7.6 | 4036 | 10.2 | ||
| Unknown or unreliable | 1895 | 8.0 | 2892 | 9.9 | 2175 | 6.0 | 2825 | 7.1 | ||
| BMI (kg/m2) | 25.9 | 23.9–28.2 | 26.0 | 23.9–28.5 | ** *** | 24.8 | 22.5–27.9 | 25.0 | 22.5–28.4 | *** *** |
| BMI category | ||||||||||
| Normal weight | 8875 | 37.4 | 10,868 | 37.1 | 18,608 | 51.3 | 19,595 | 49.5 | ||
| Overweight | 11,690 | 49.3 | 13,909 | 47.4 | 12,198 | 33.6 | 13,048 | 33.0 | ||
| Obesity | 3138 | 13.2 | 4546 | 5472 | 15.1 | 6925 | 17.5 | |||
| Unknown | 15.5 | 1 | 0.0 | |||||||
Publisher’s Note: MDPI stays neutral with regard to jurisdictional claims in published maps and institutional affiliations. |
© 2021 by the authors. Licensee MDPI, Basel, Switzerland. This article is an open access article distributed under the terms and conditions of the Creative Commons Attribution (CC BY) license (https://creativecommons.org/licenses/by/4.0/).
Share and Cite
Baart, A.M.; Brouwer-Brolsma, E.M.; Perenboom, C.W.M.; de Vries, J.H.M.; Feskens, E.J.M. Dietary Intake in the Lifelines Cohort Study: Baseline Results from the Flower Food Frequency Questionnaire among 59,982 Participants. Nutrients 2022, 14, 48. https://doi.org/10.3390/nu14010048
Baart AM, Brouwer-Brolsma EM, Perenboom CWM, de Vries JHM, Feskens EJM. Dietary Intake in the Lifelines Cohort Study: Baseline Results from the Flower Food Frequency Questionnaire among 59,982 Participants. Nutrients. 2022; 14(1):48. https://doi.org/10.3390/nu14010048
Chicago/Turabian StyleBaart, A. Mireille, Elske M. Brouwer-Brolsma, Corine W. M. Perenboom, Jeanne H. M. de Vries, and Edith J. M. Feskens. 2022. "Dietary Intake in the Lifelines Cohort Study: Baseline Results from the Flower Food Frequency Questionnaire among 59,982 Participants" Nutrients 14, no. 1: 48. https://doi.org/10.3390/nu14010048