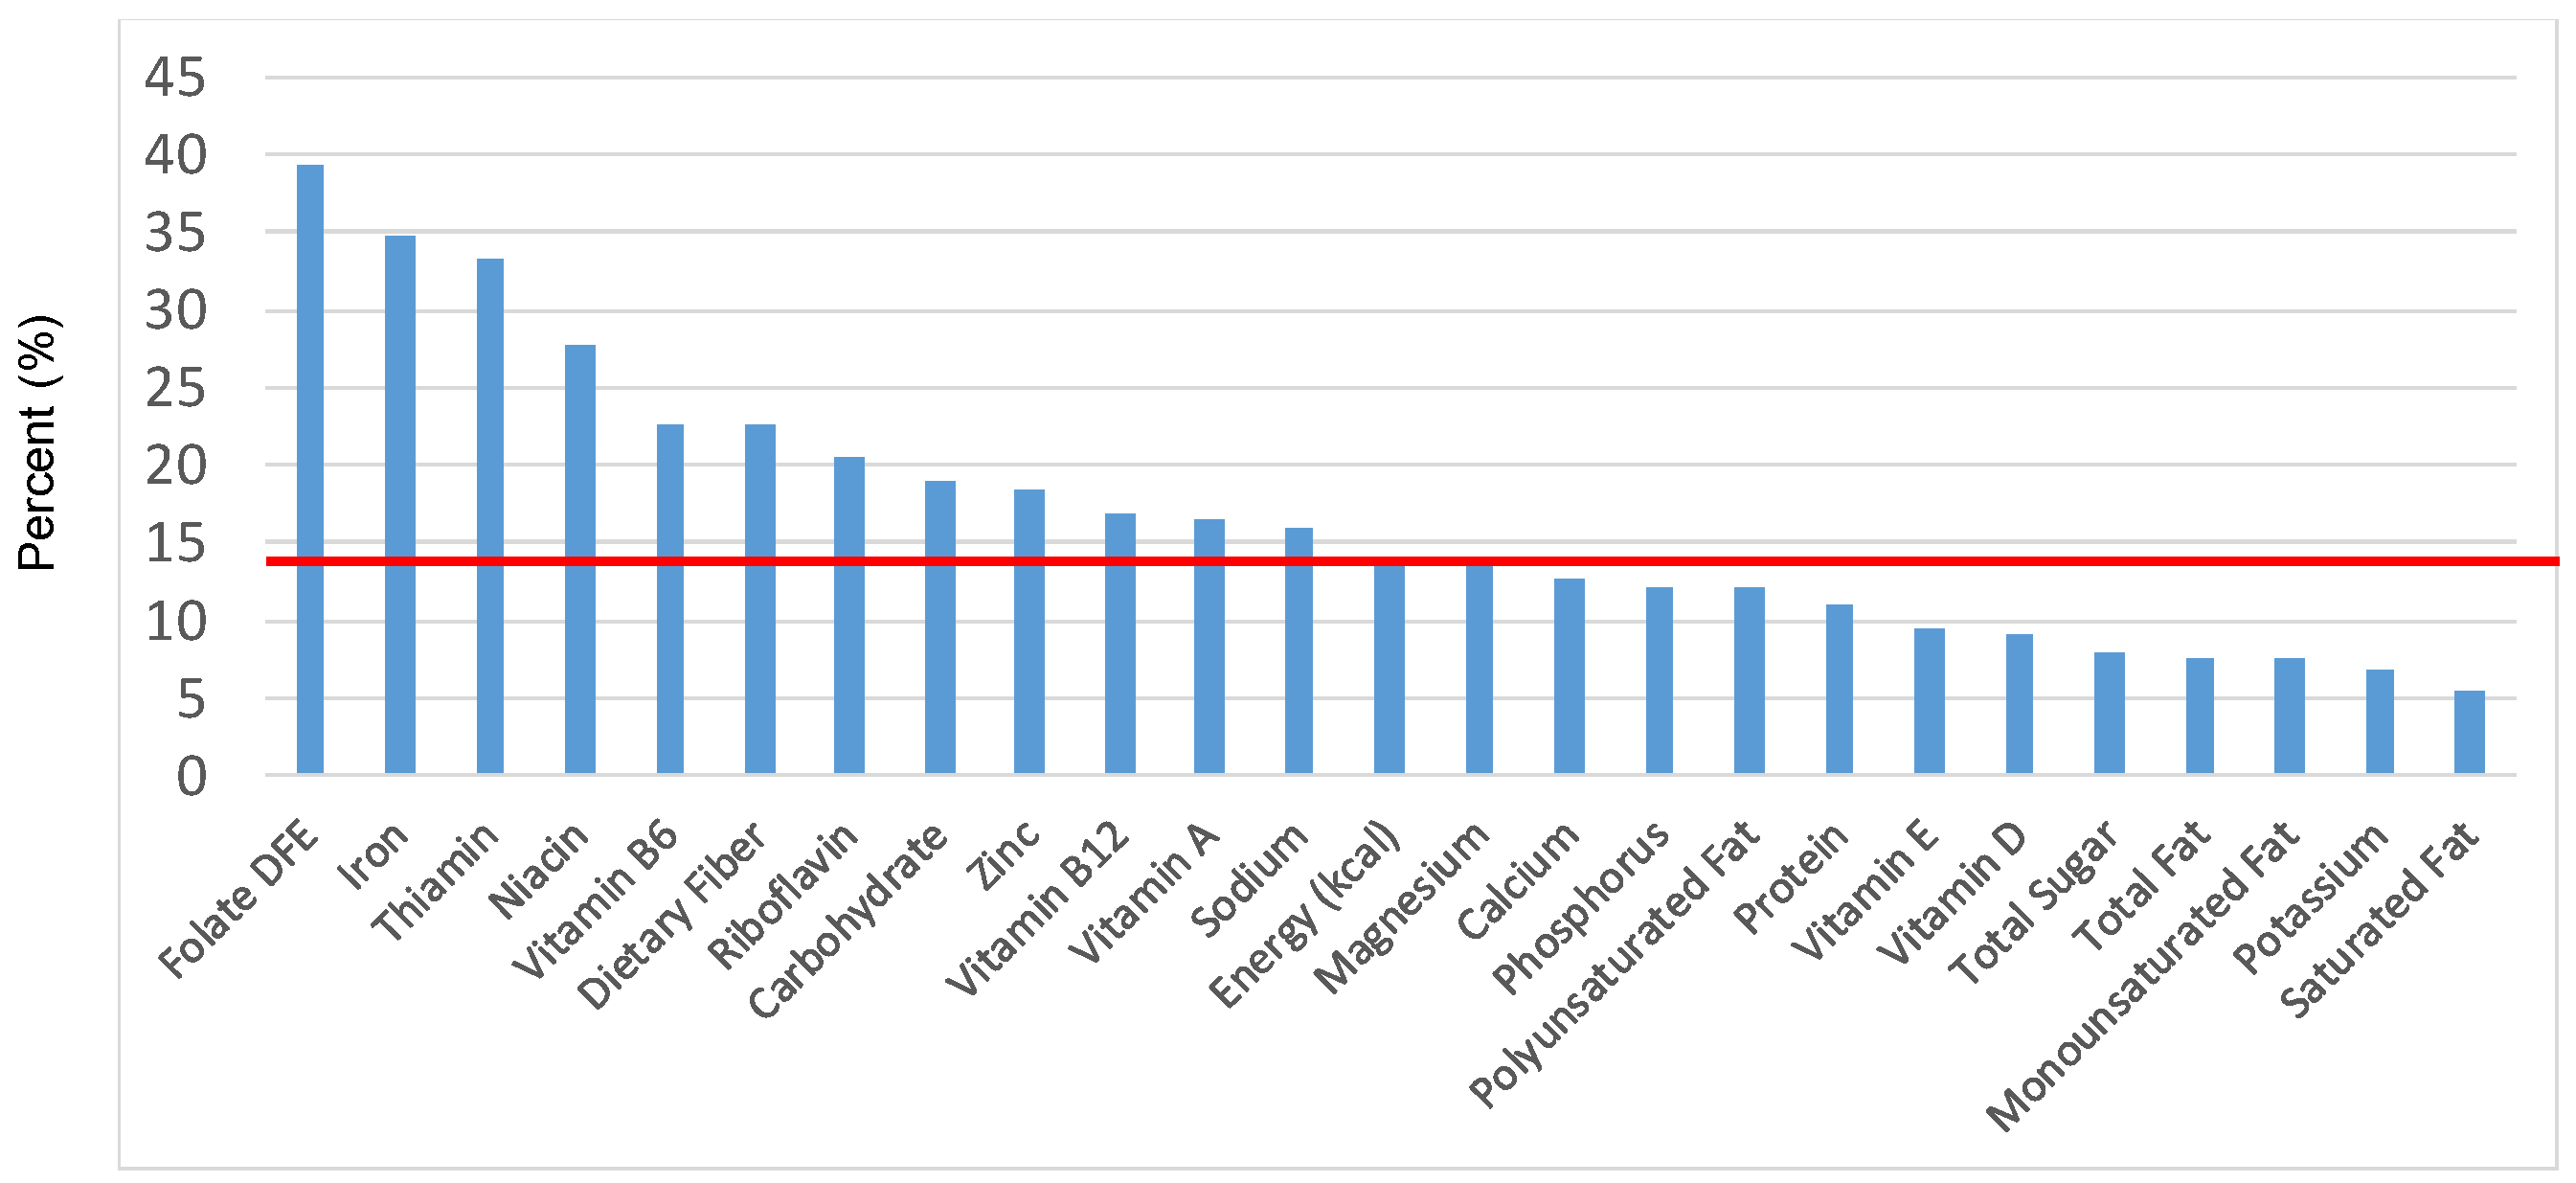
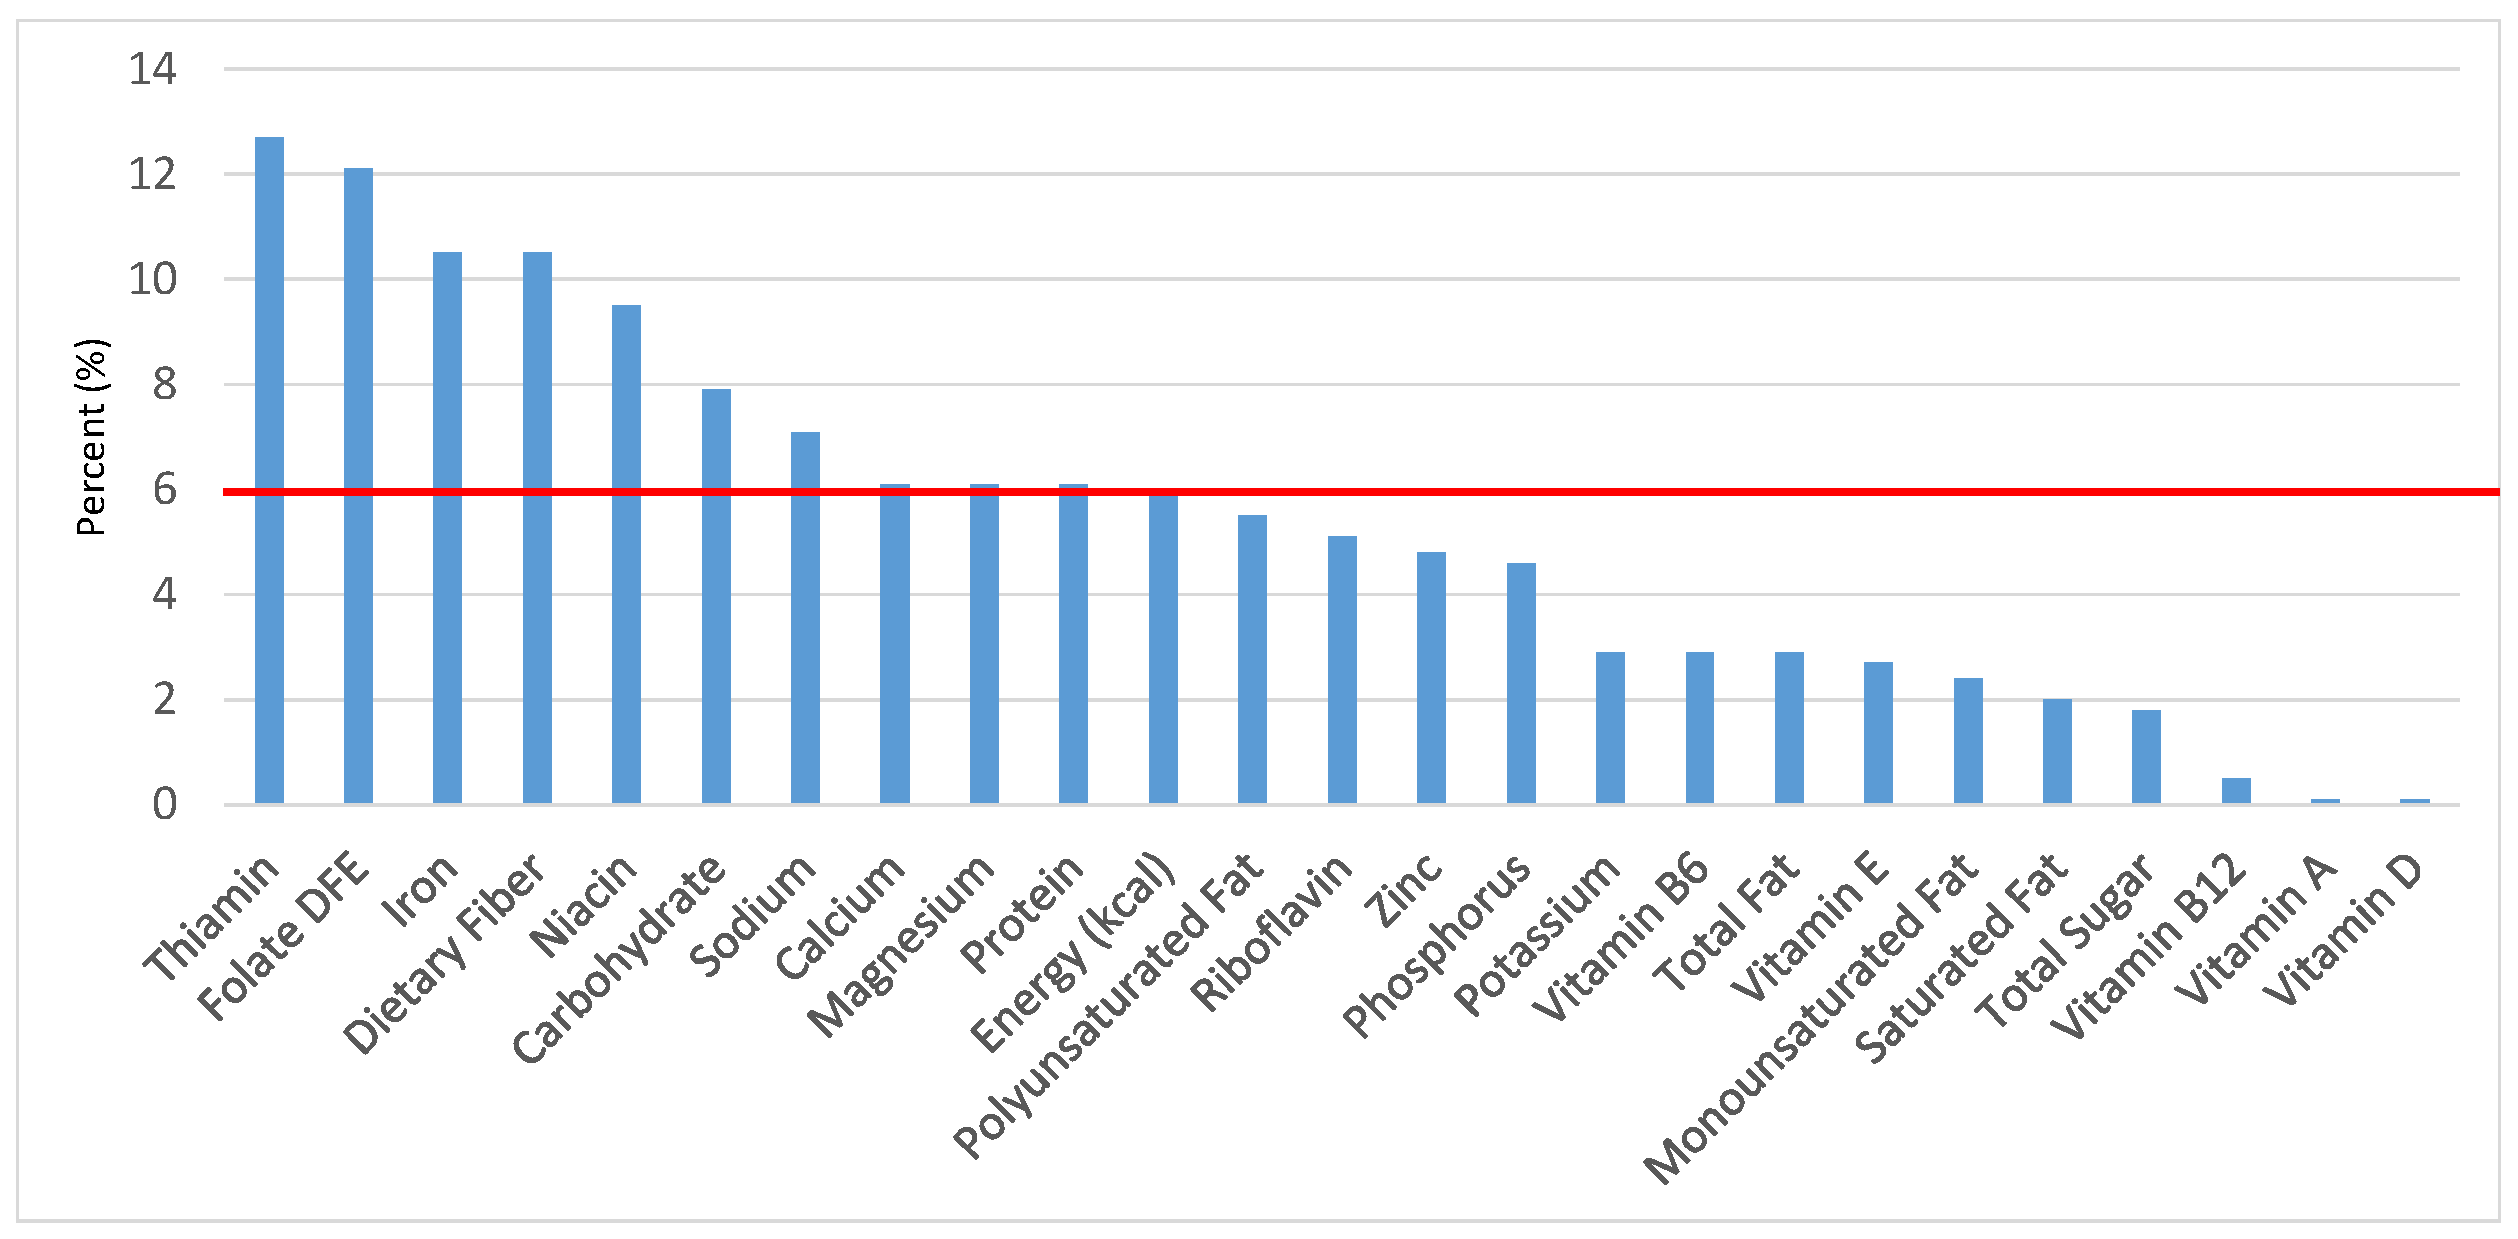
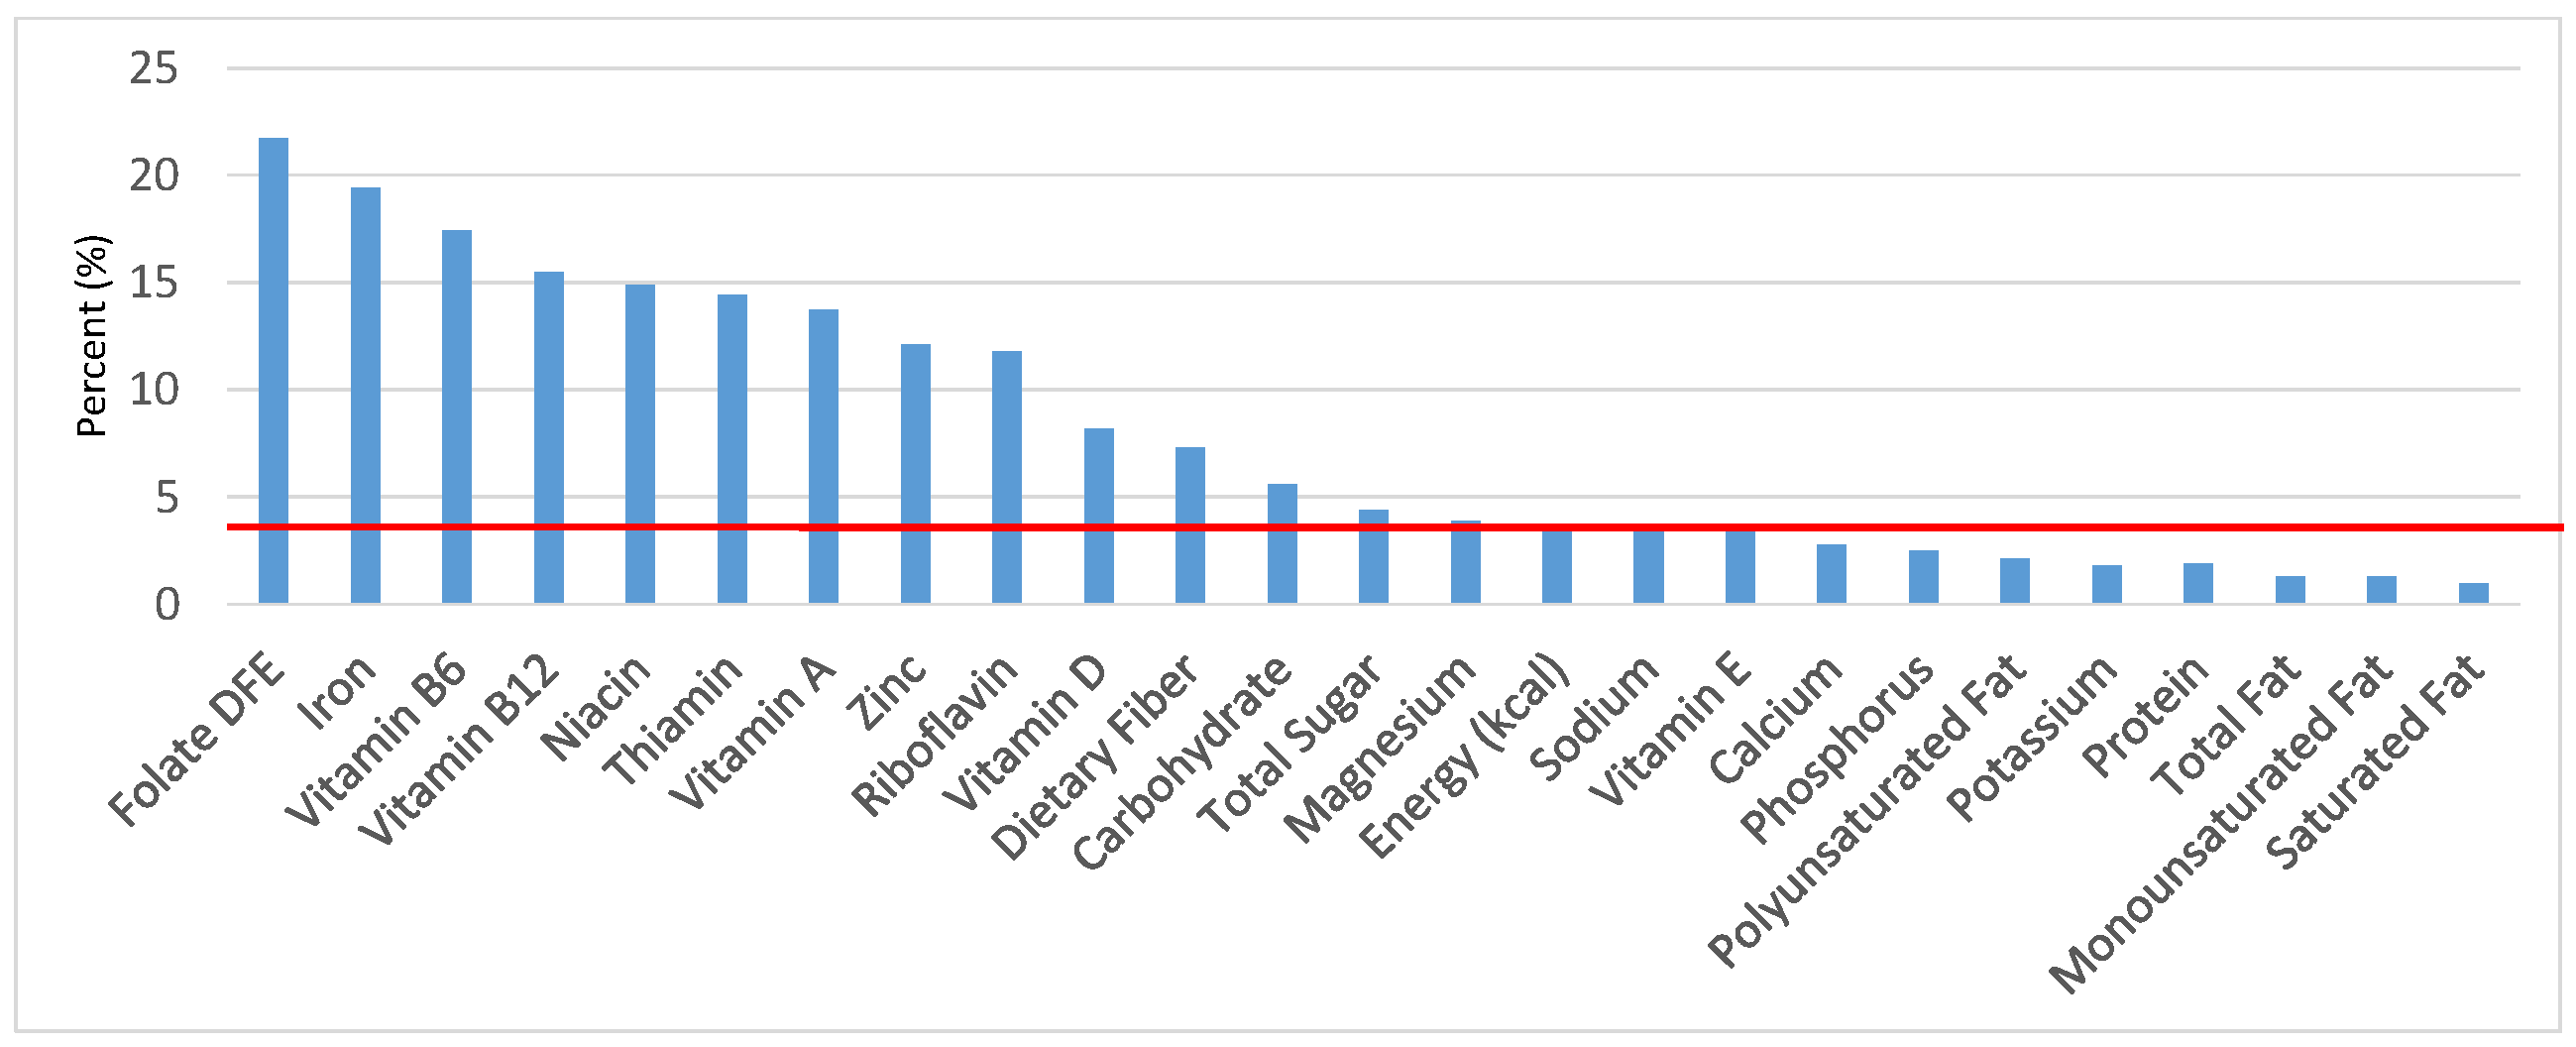
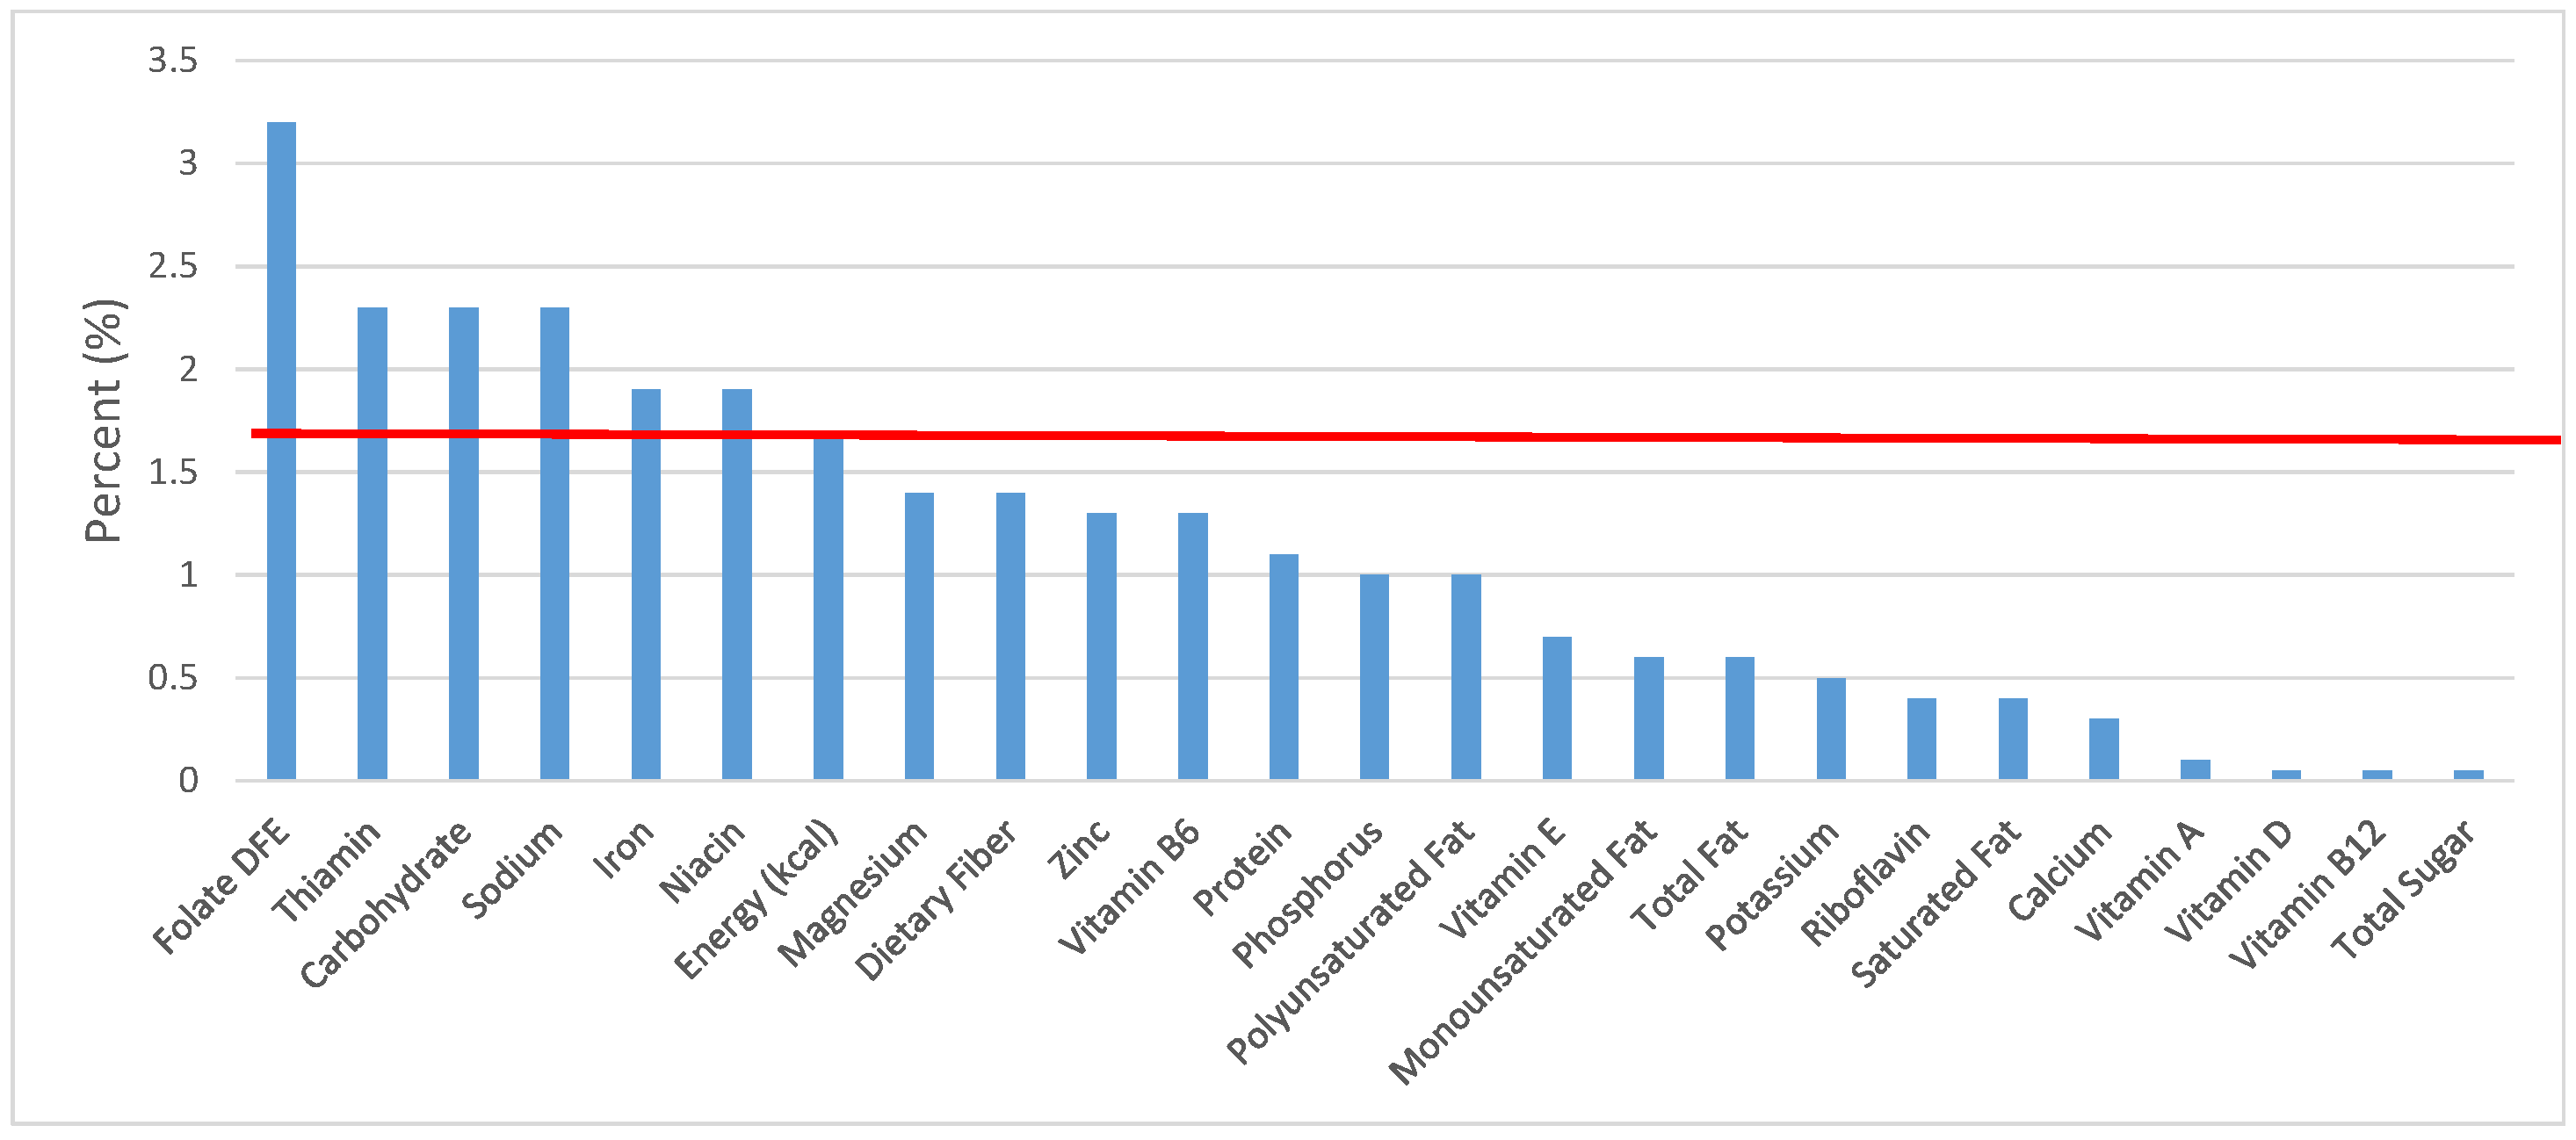
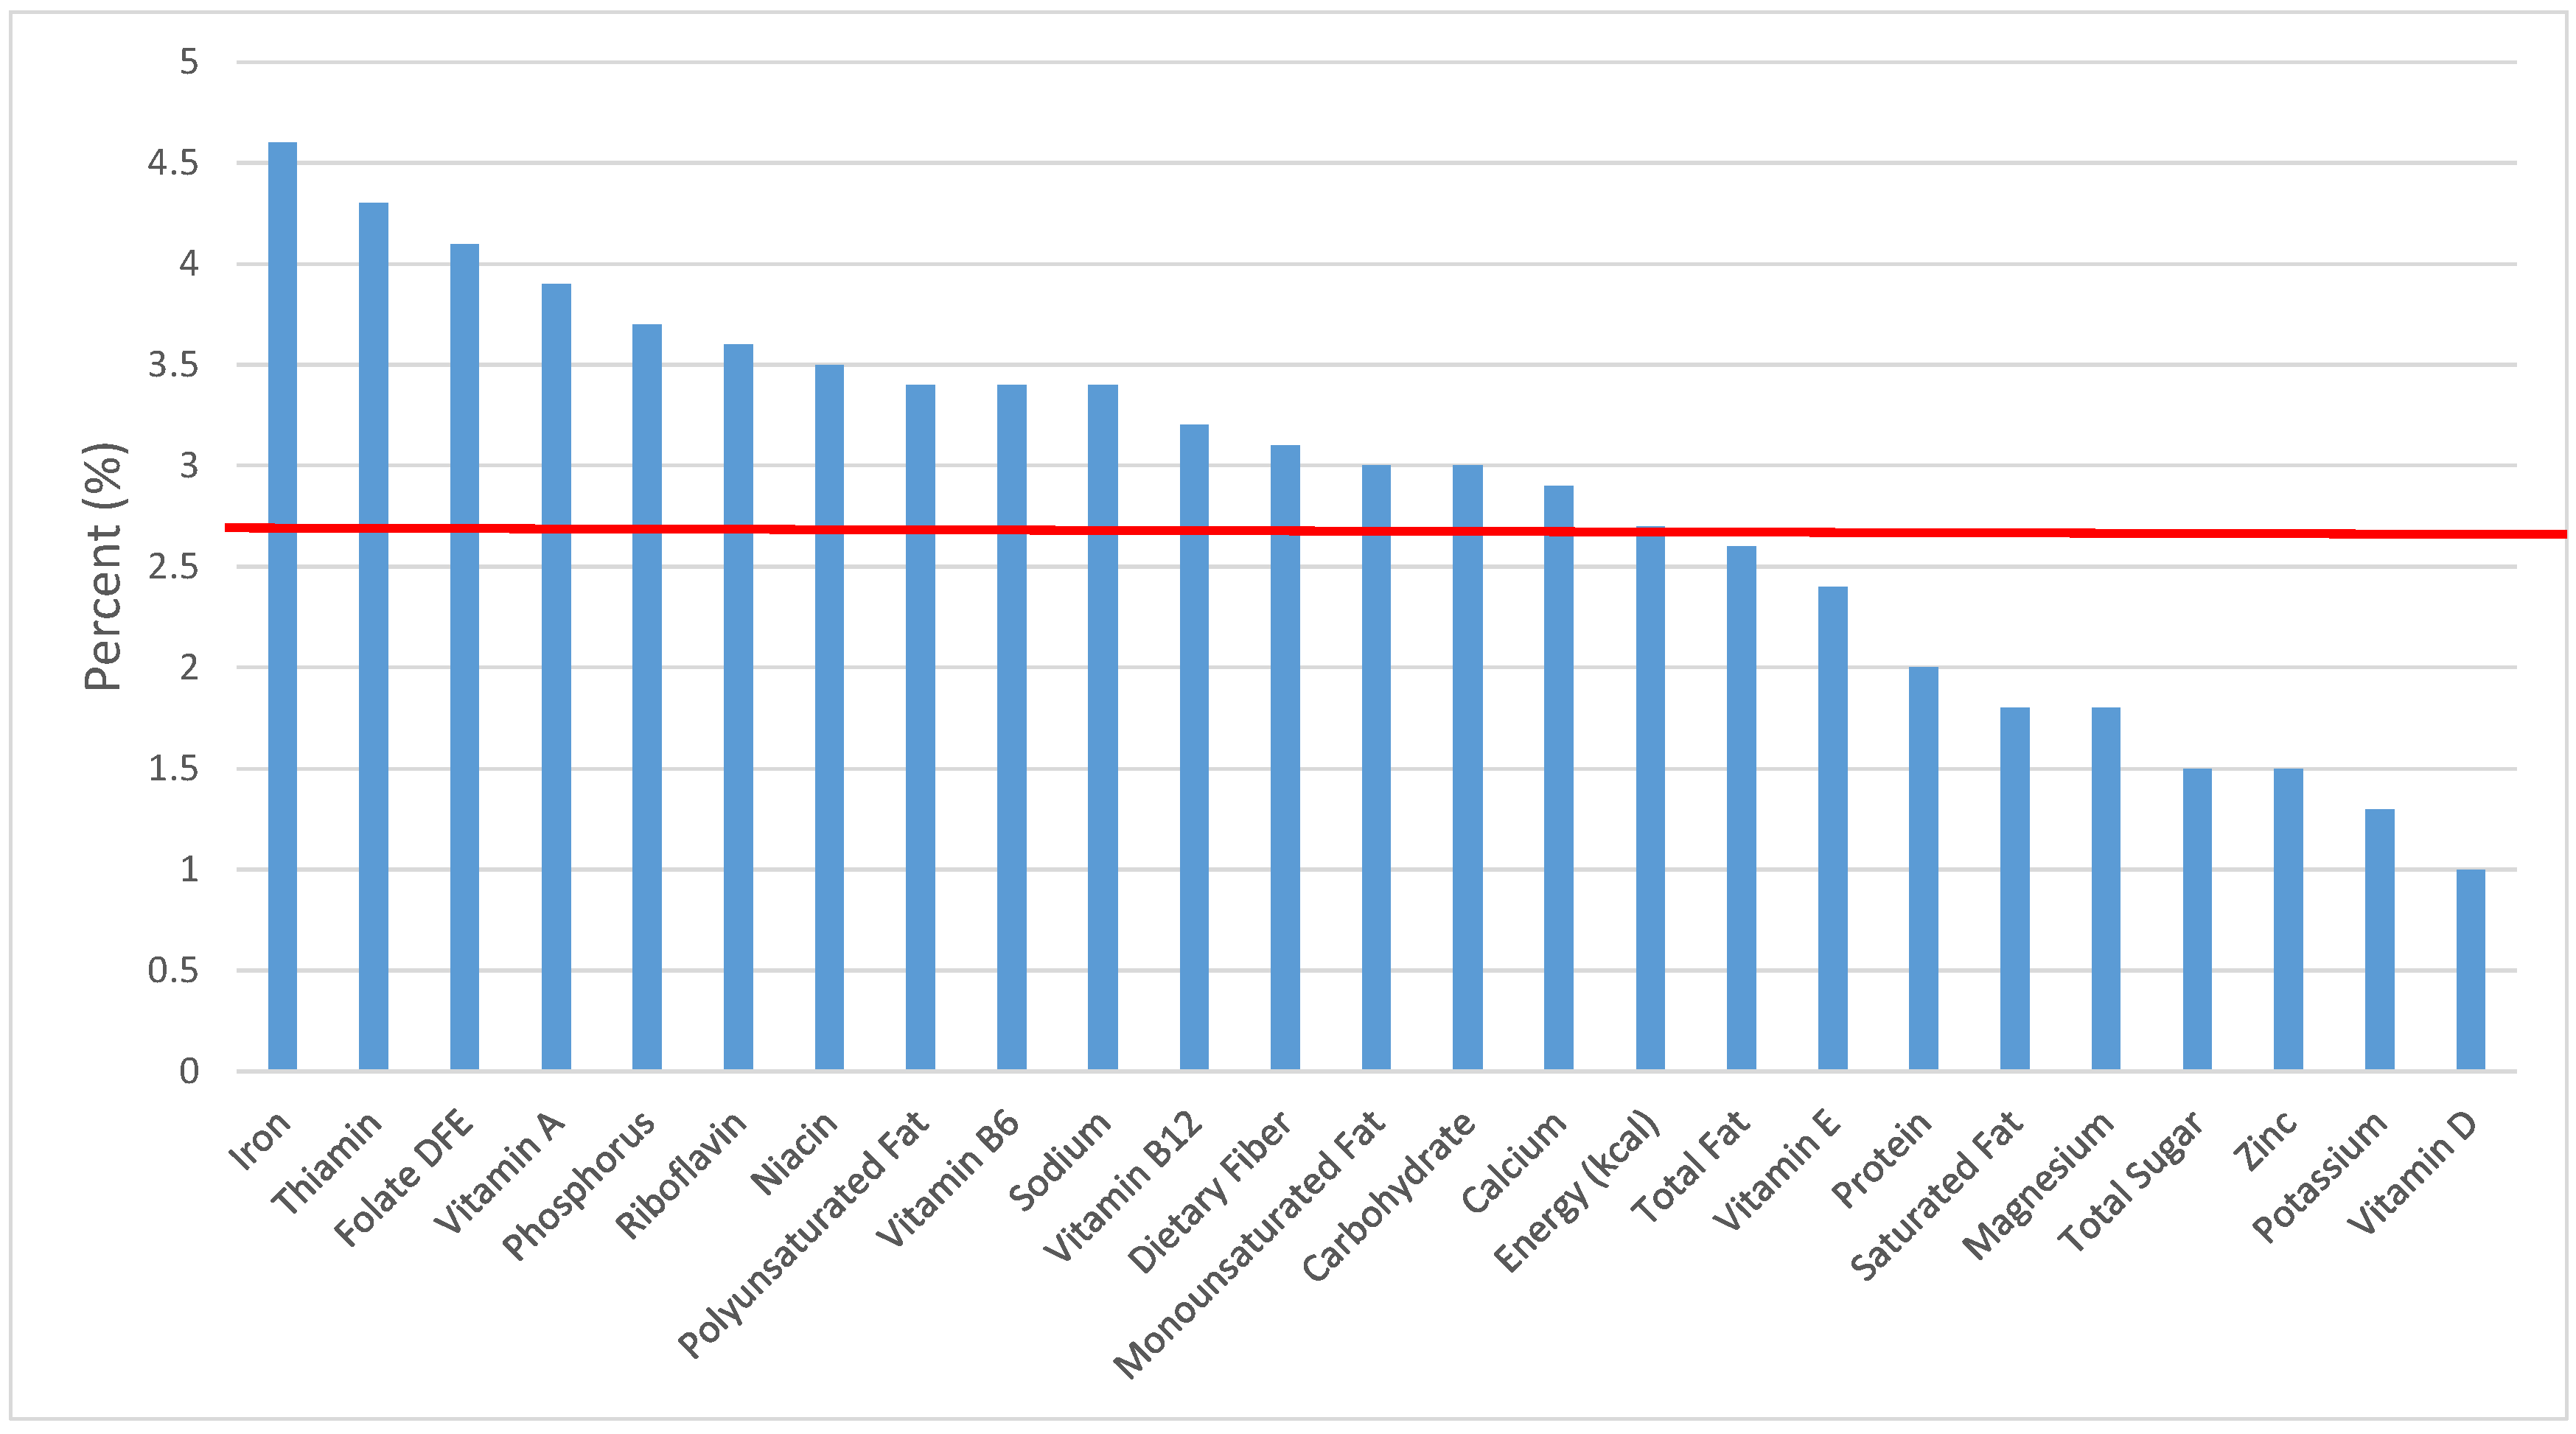
Figure 1.
Grain foods sources of energy and nutrients for children and adolescents, 2–18 years old (N = 6109, daily intake data): DFE = Dietary Folate Equivalents; solid red line represents percentage of energy (kcal) provided in the diet relative to nutrients—nutrients above the red line show the grain food’s contribution to nutrient density.
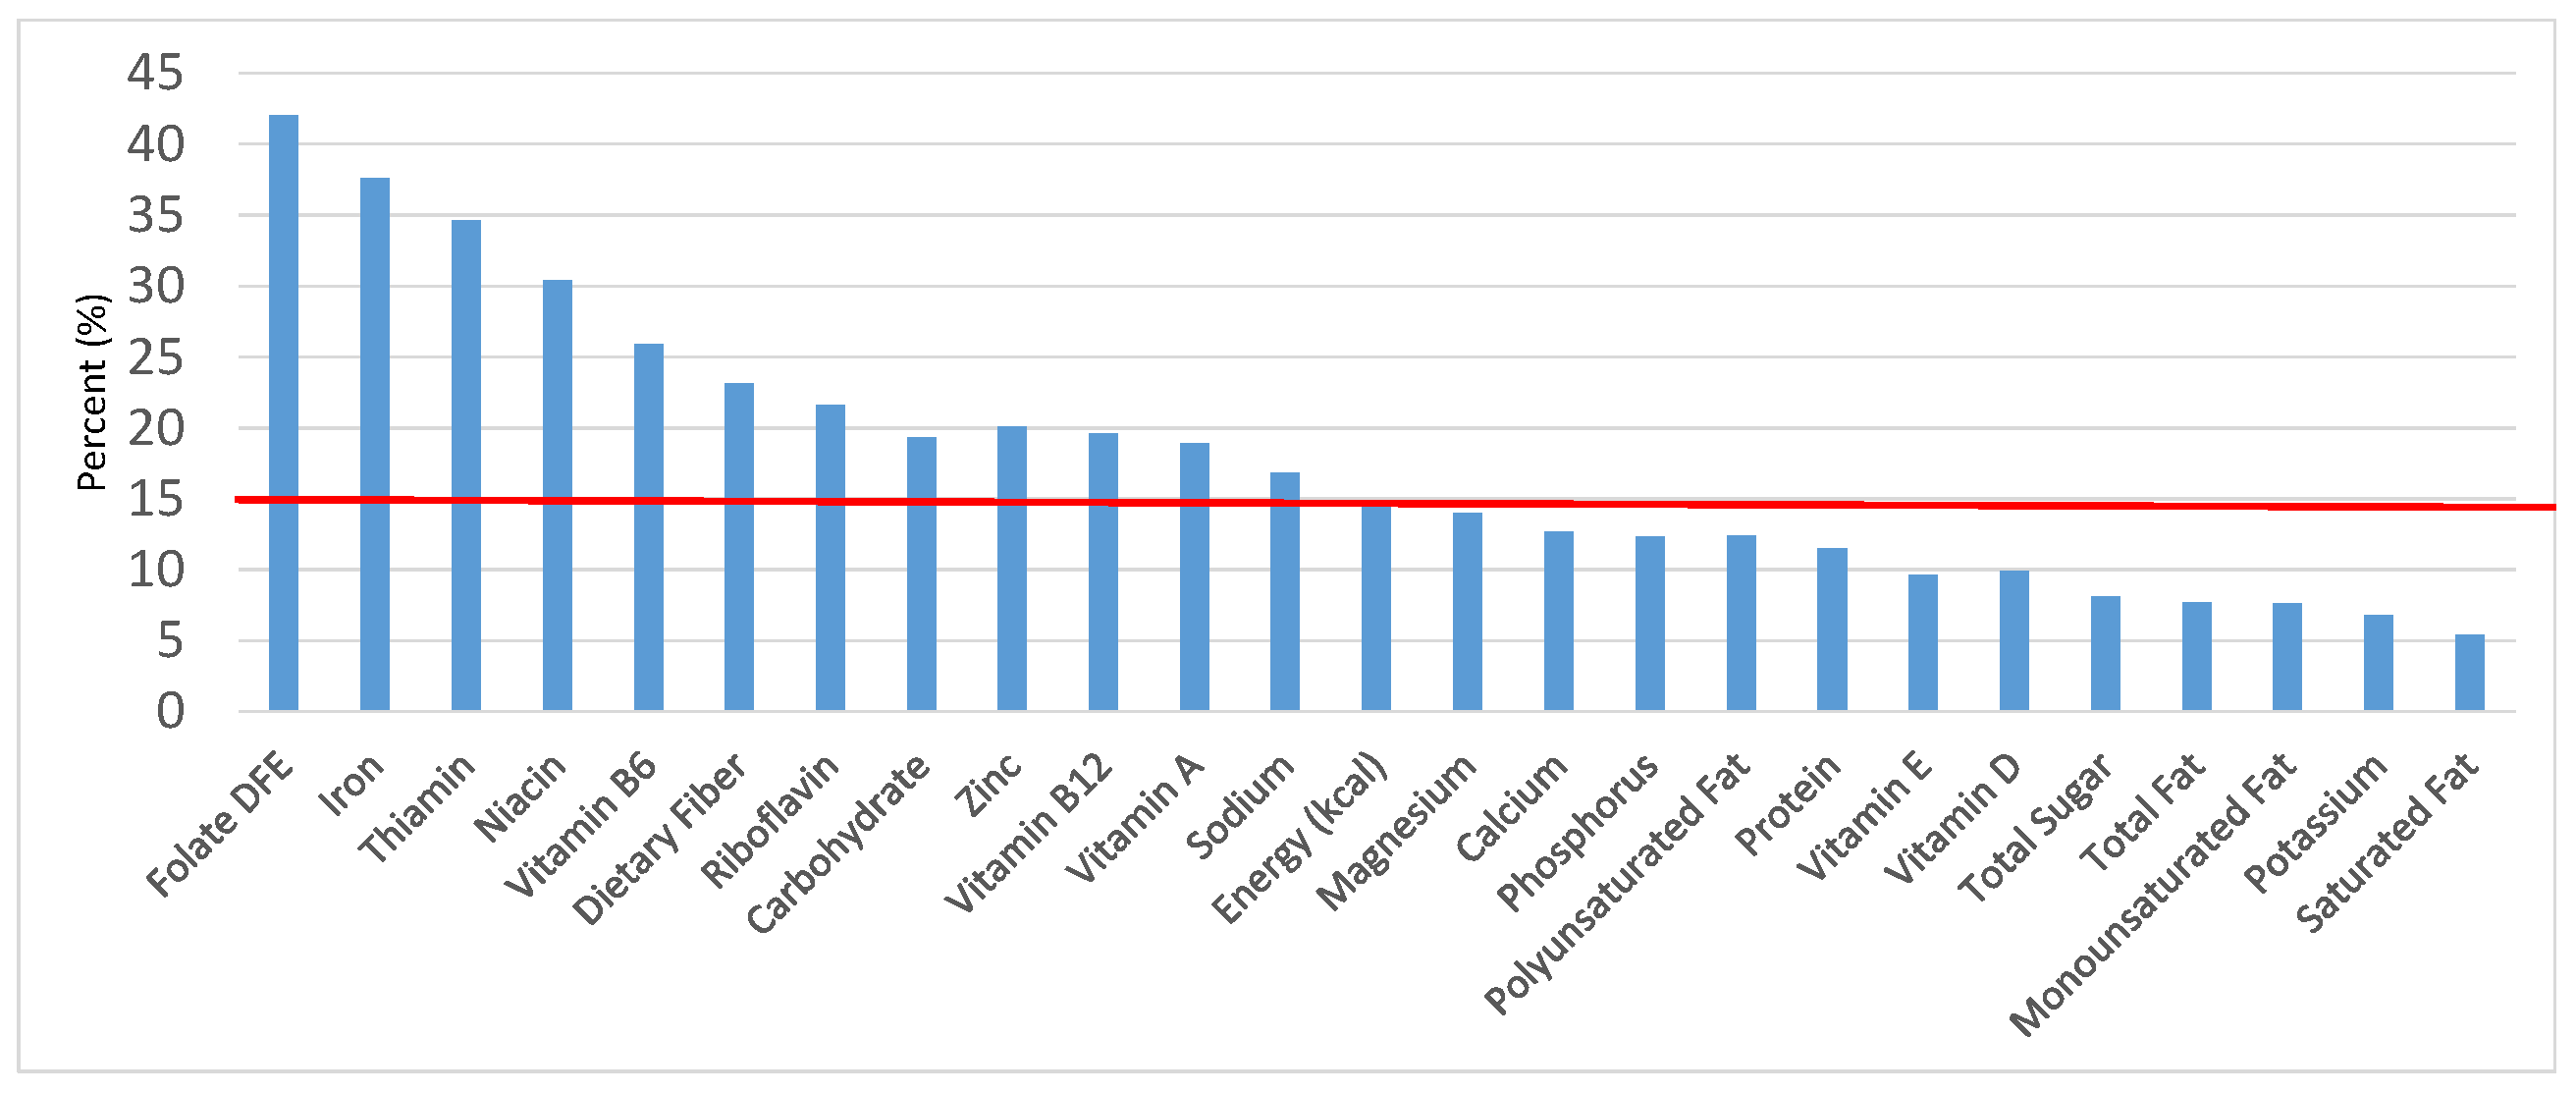
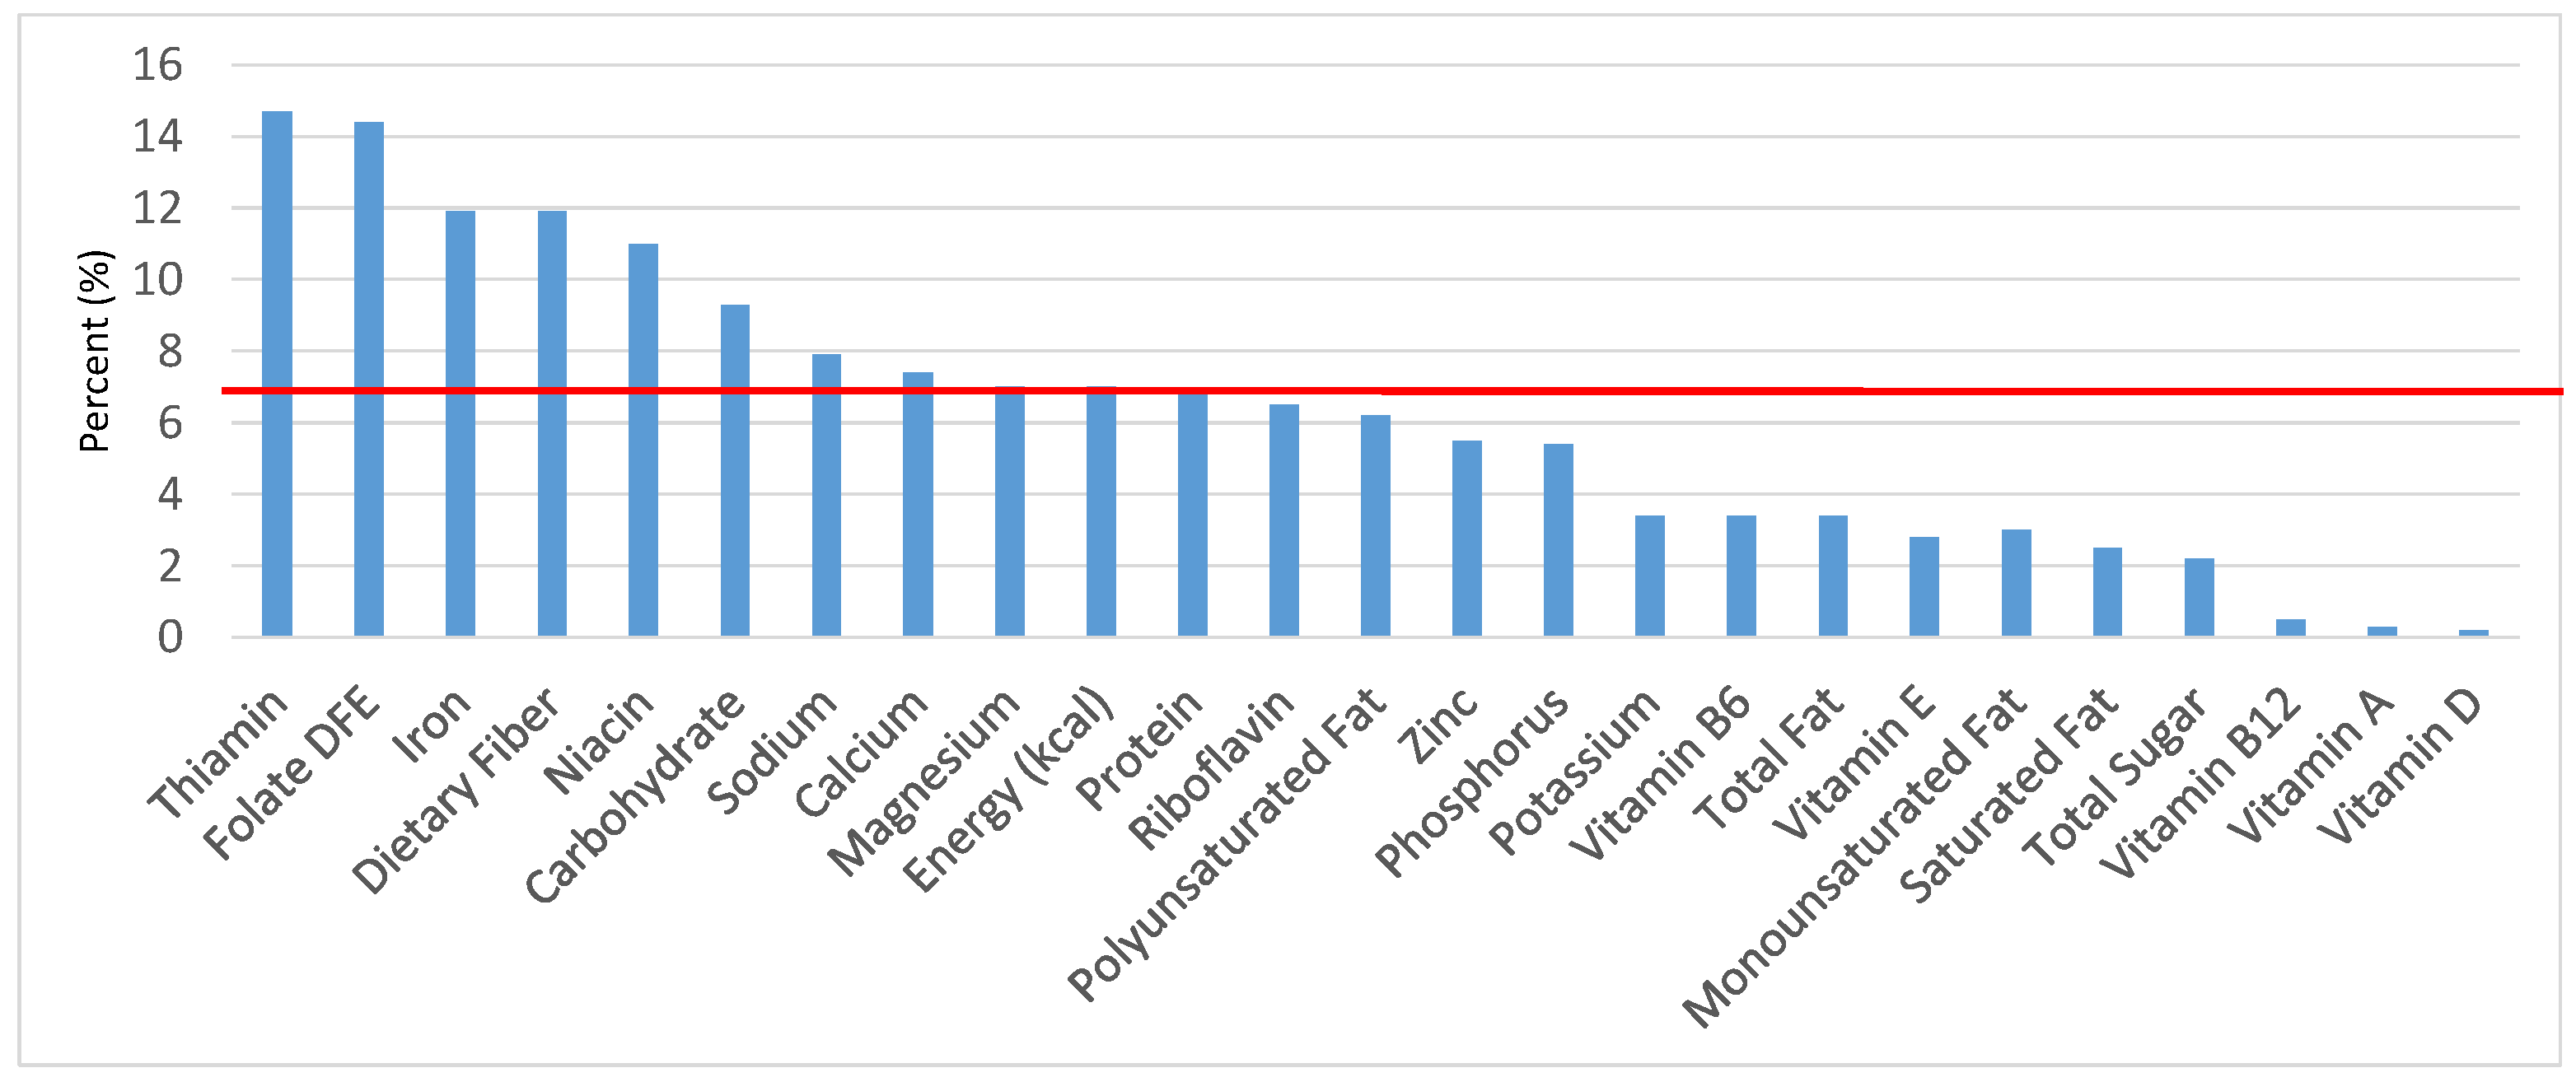
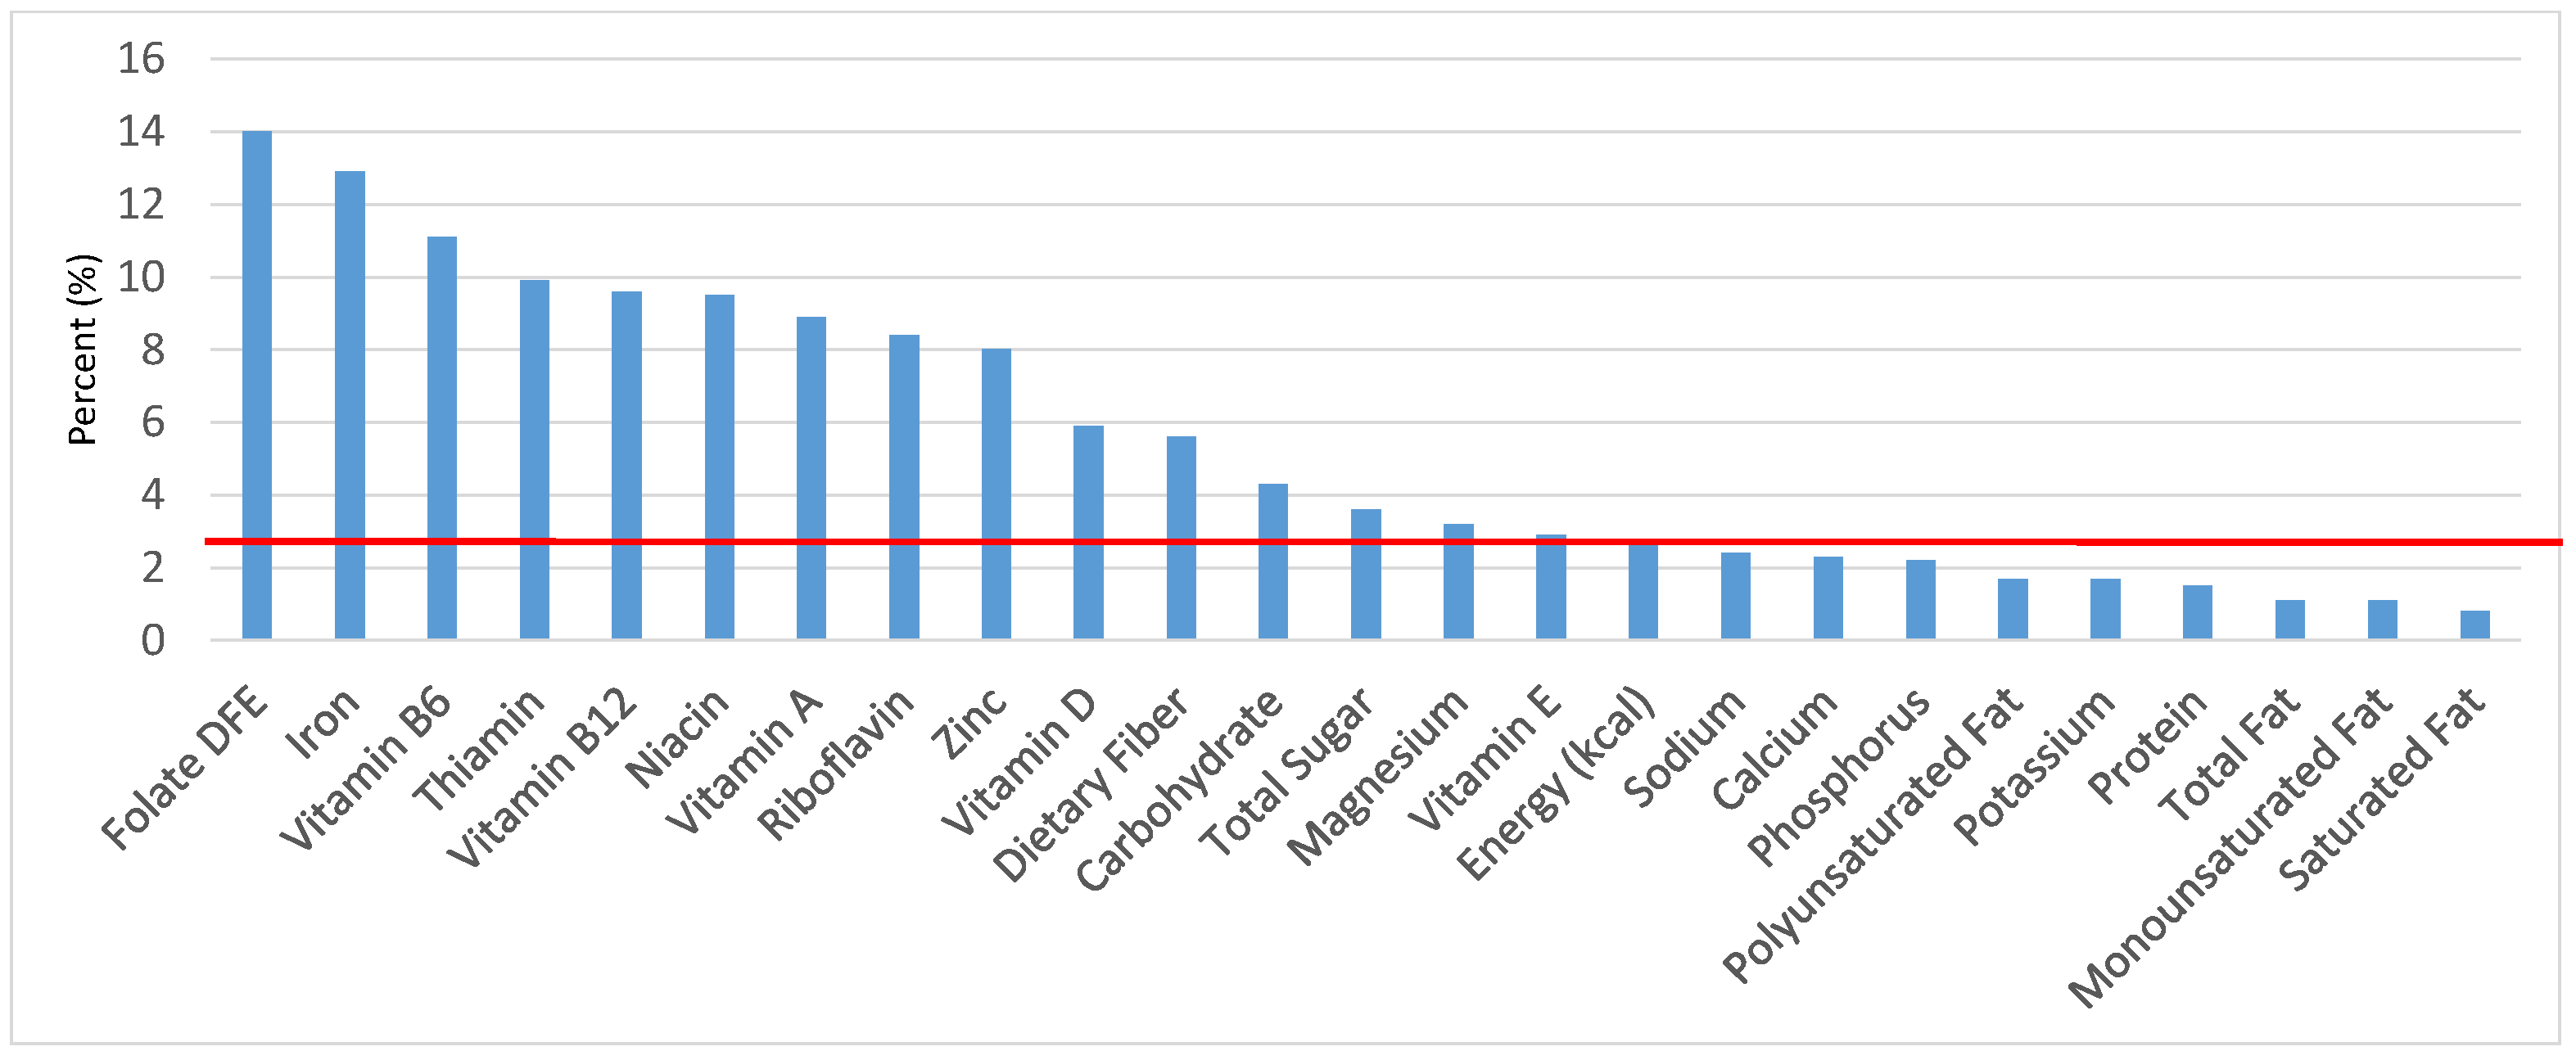
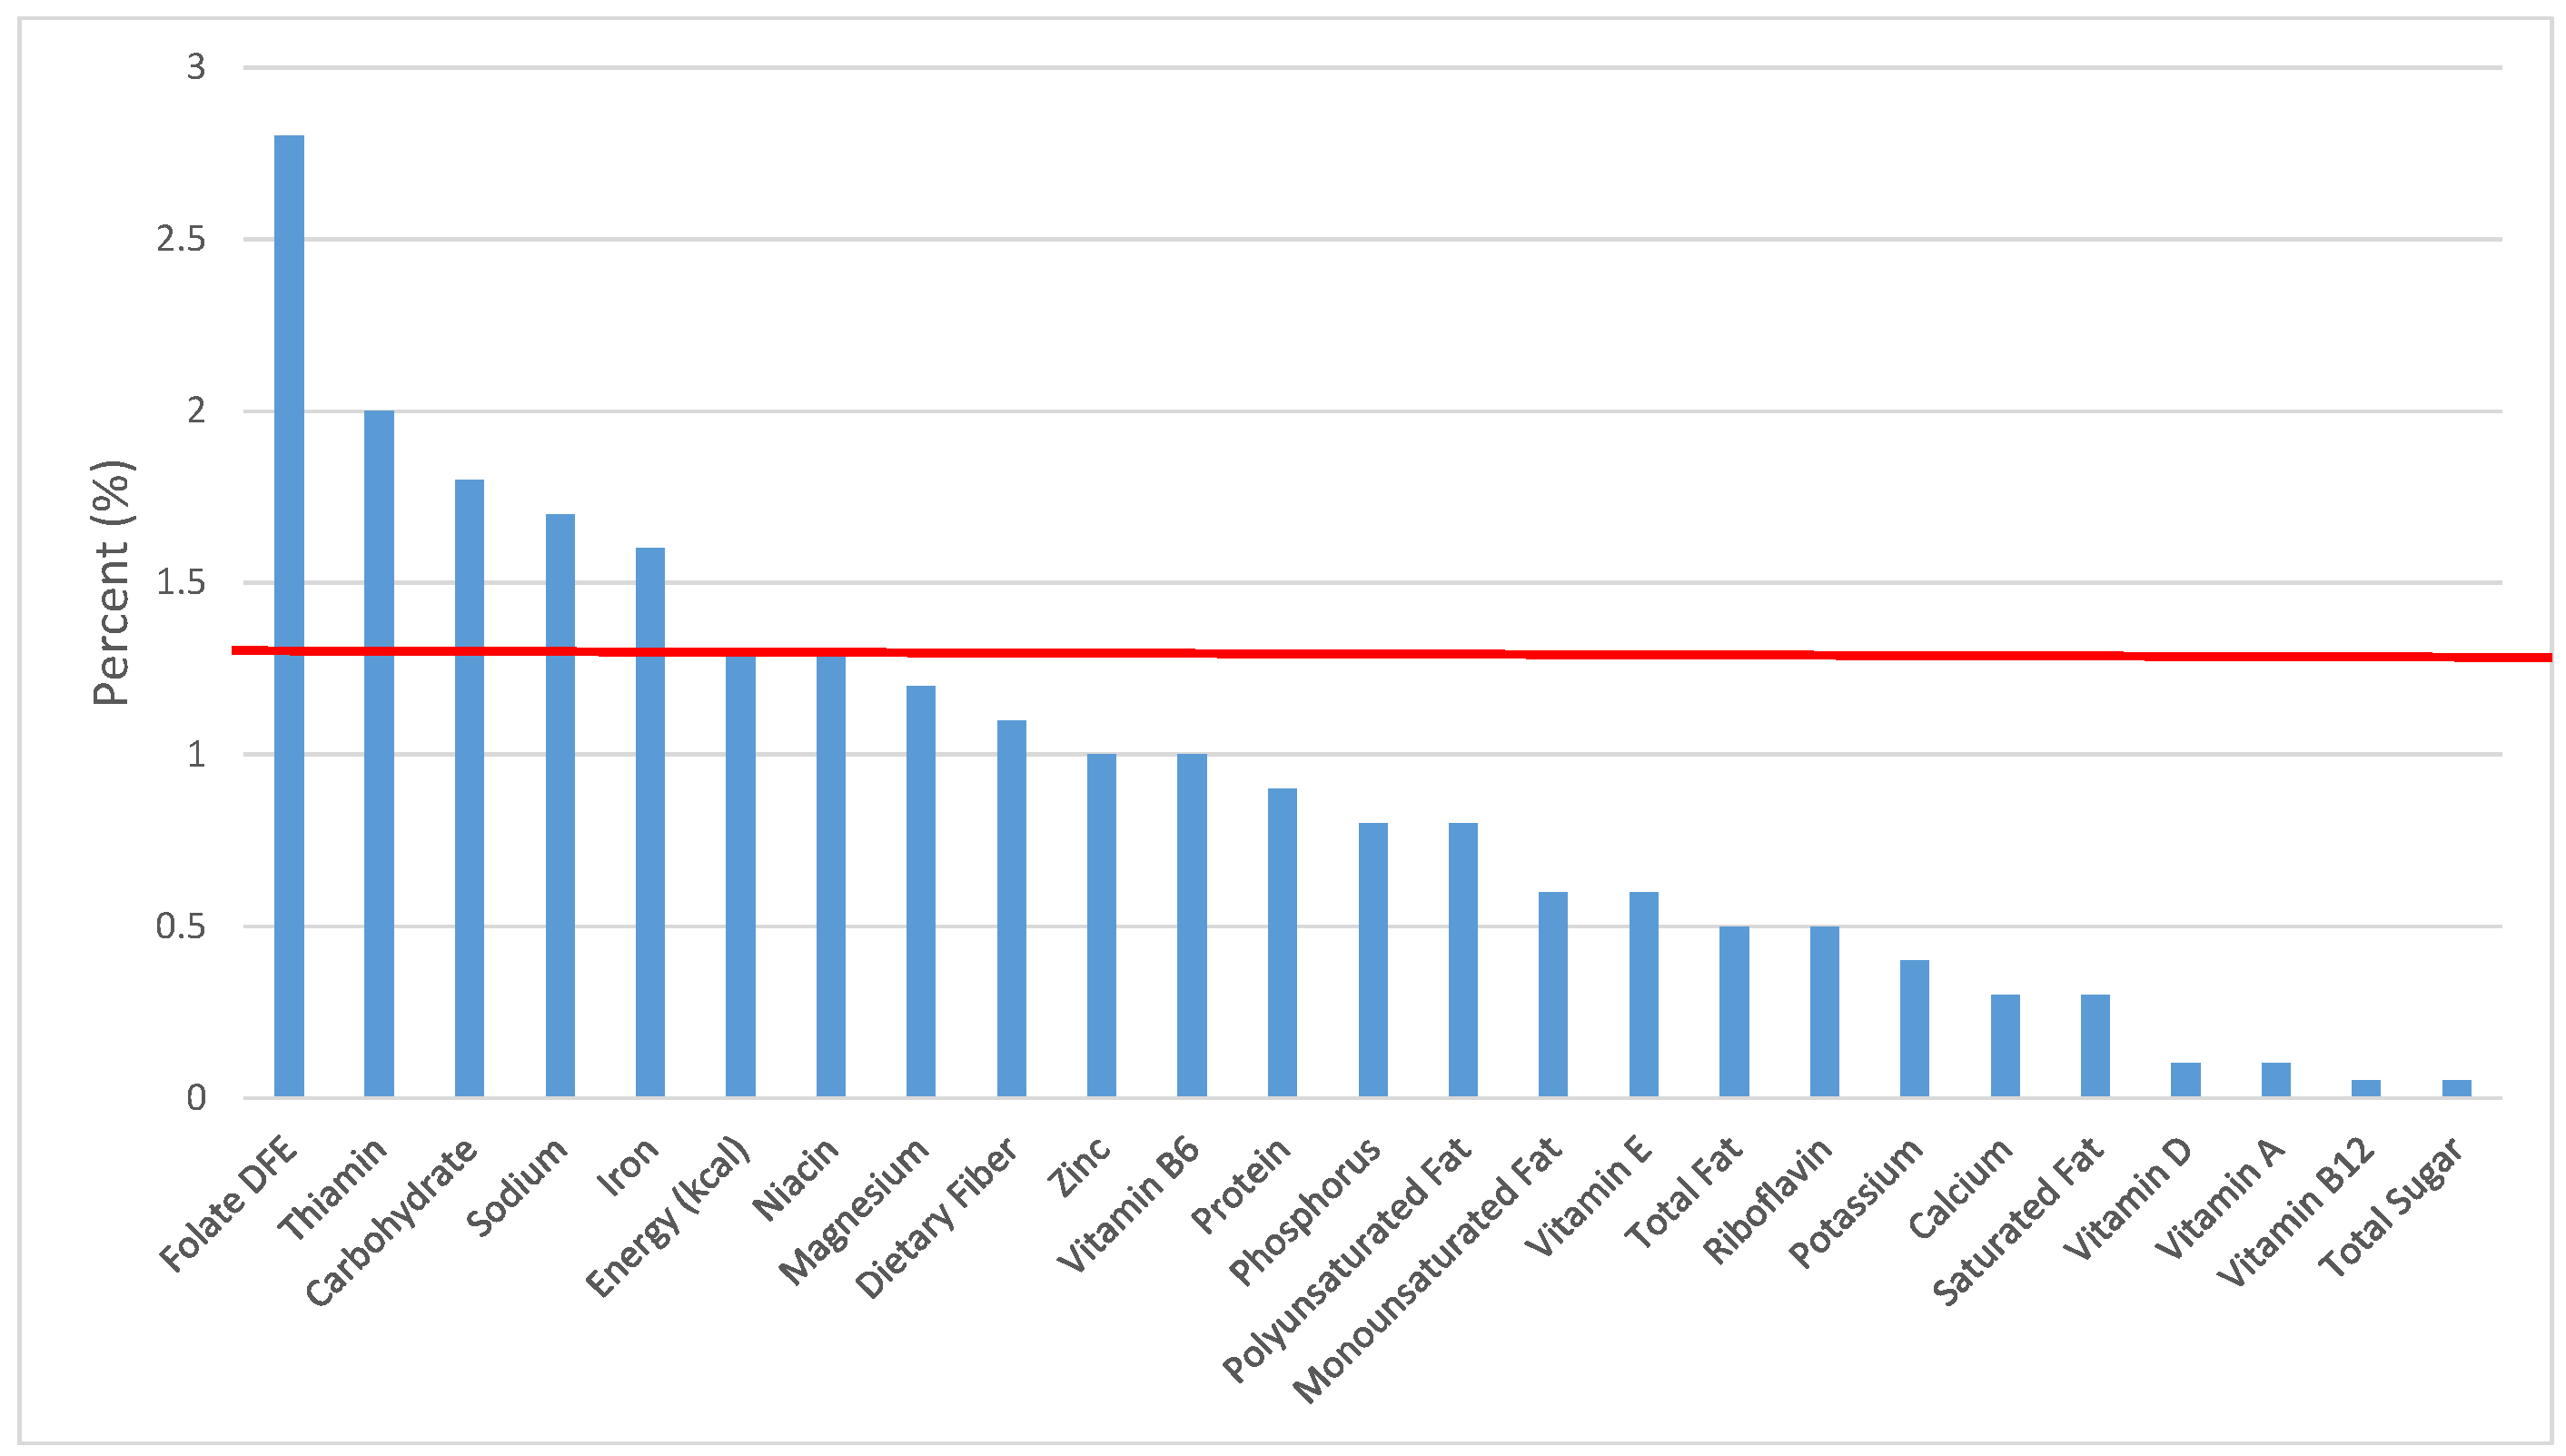
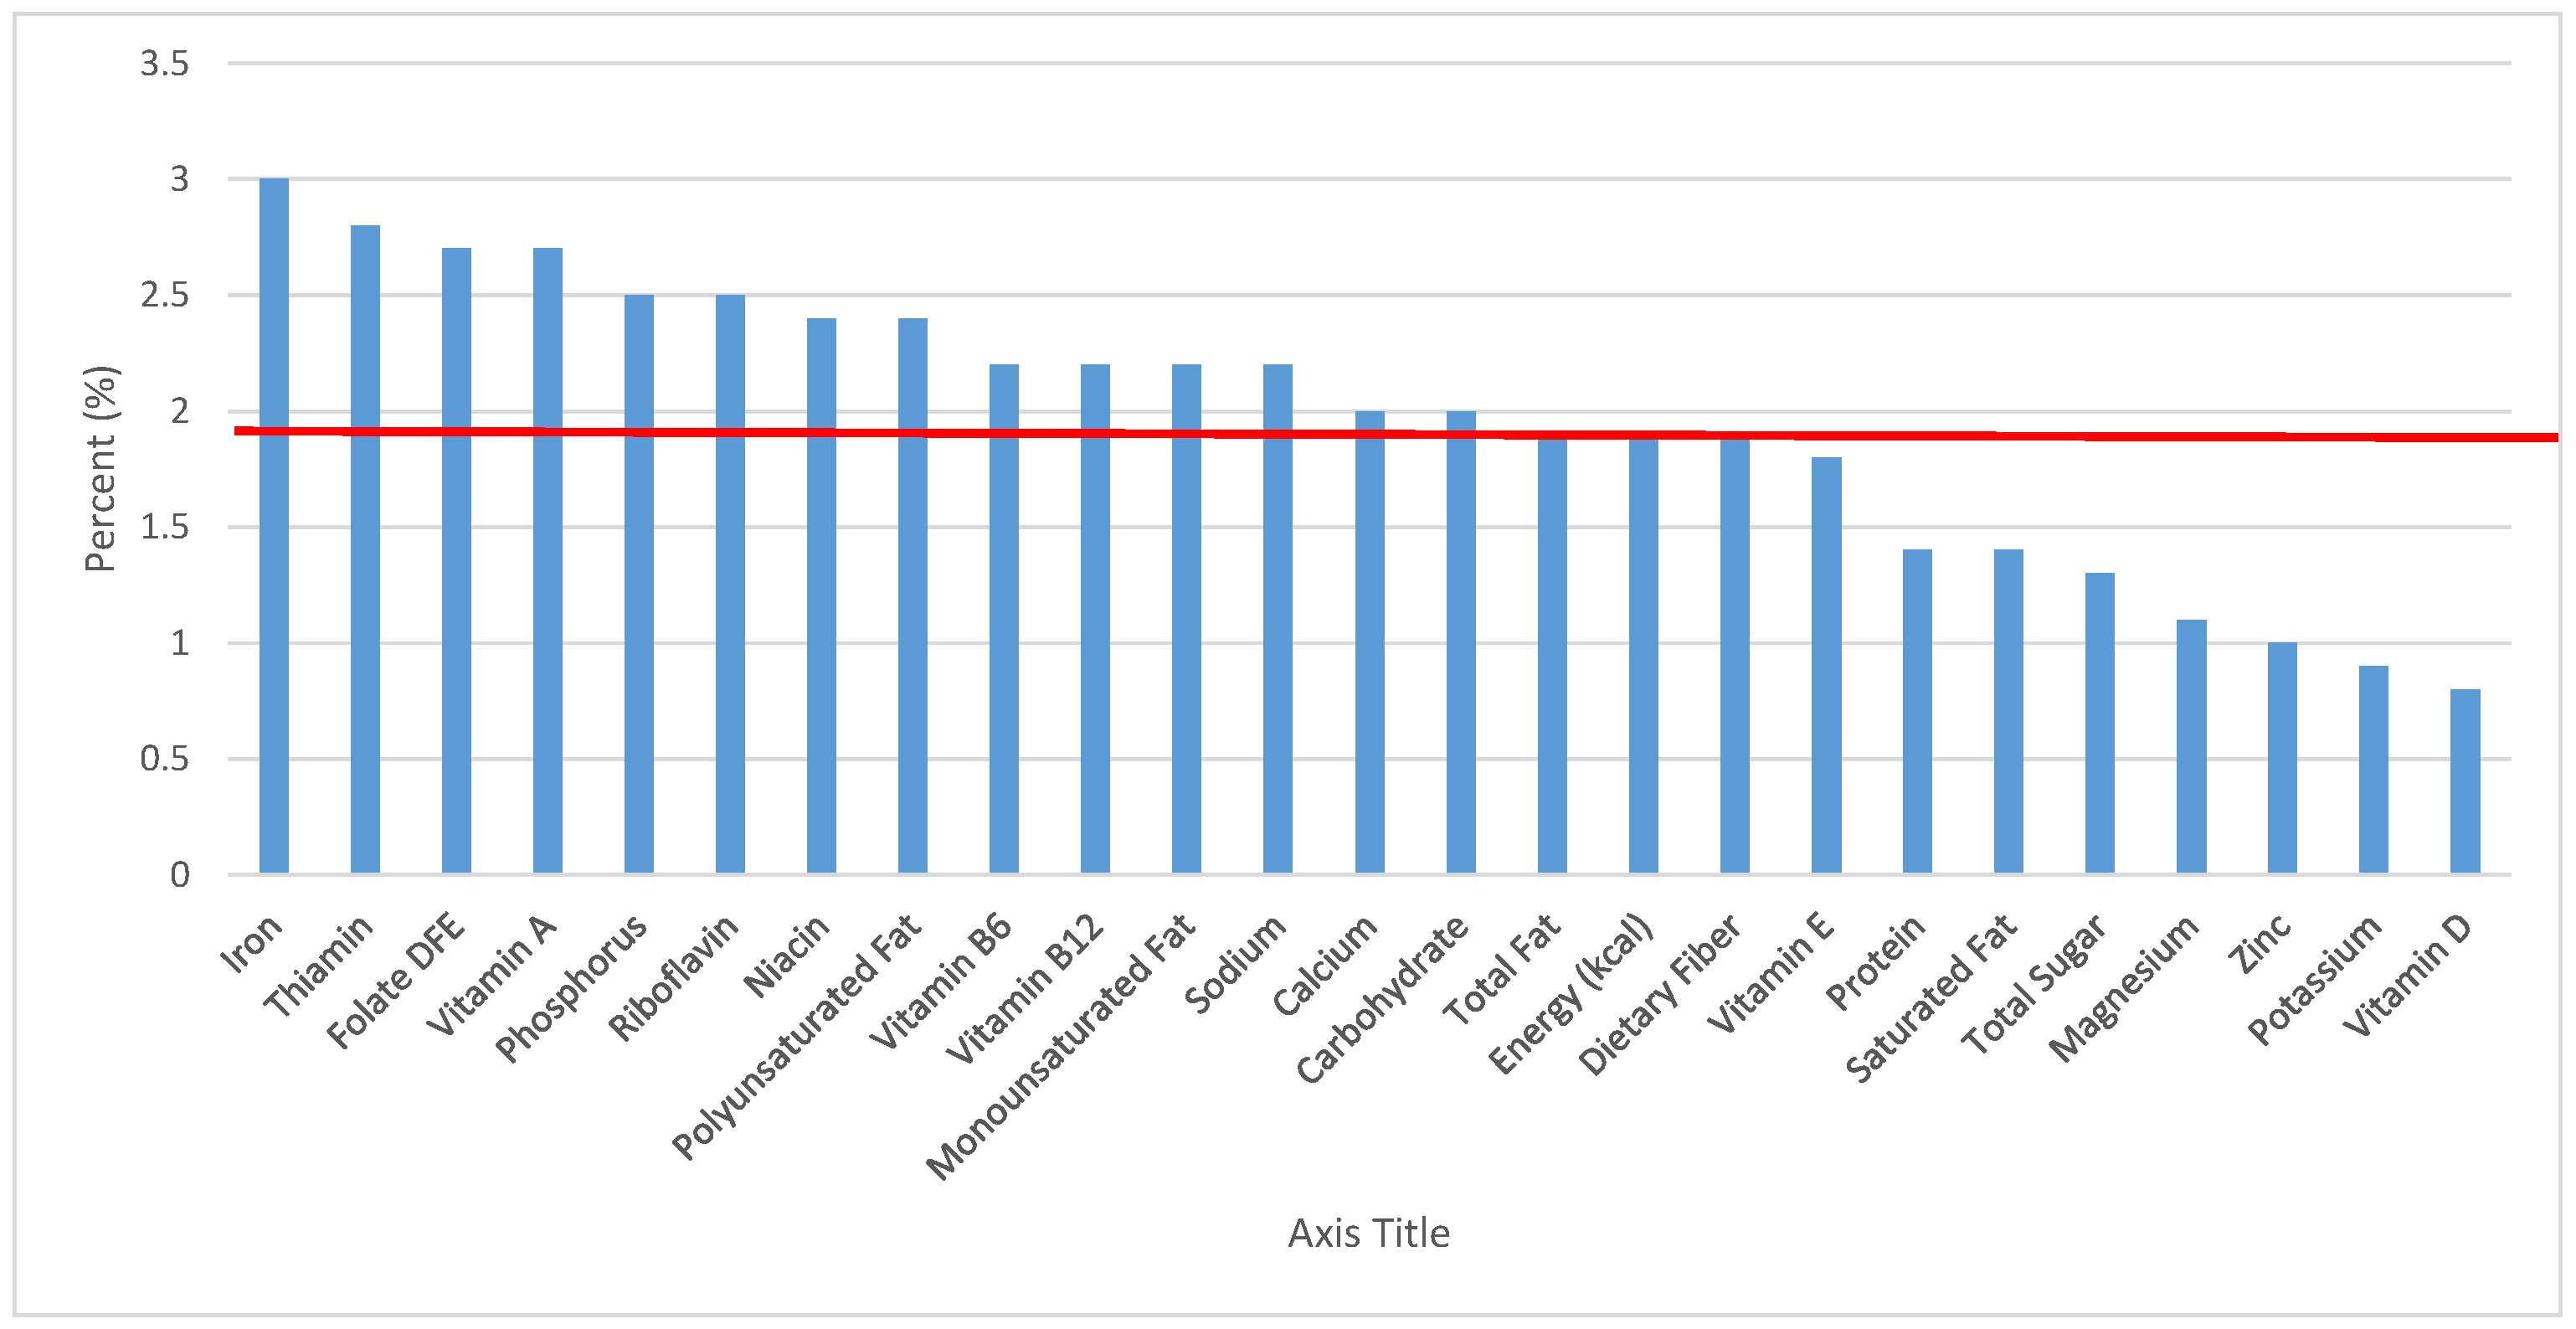
Figure 2.
Grain foods sources of energy and nutrients for children 1–3 years old (N = 1423, daily intake data): DFE = Dietary Folate Equivalents; solid red line represents percentage of energy (kcal) provided in the diet relative to nutrients—nutrients above the red line show the grain food’s contribution to nutrient density.
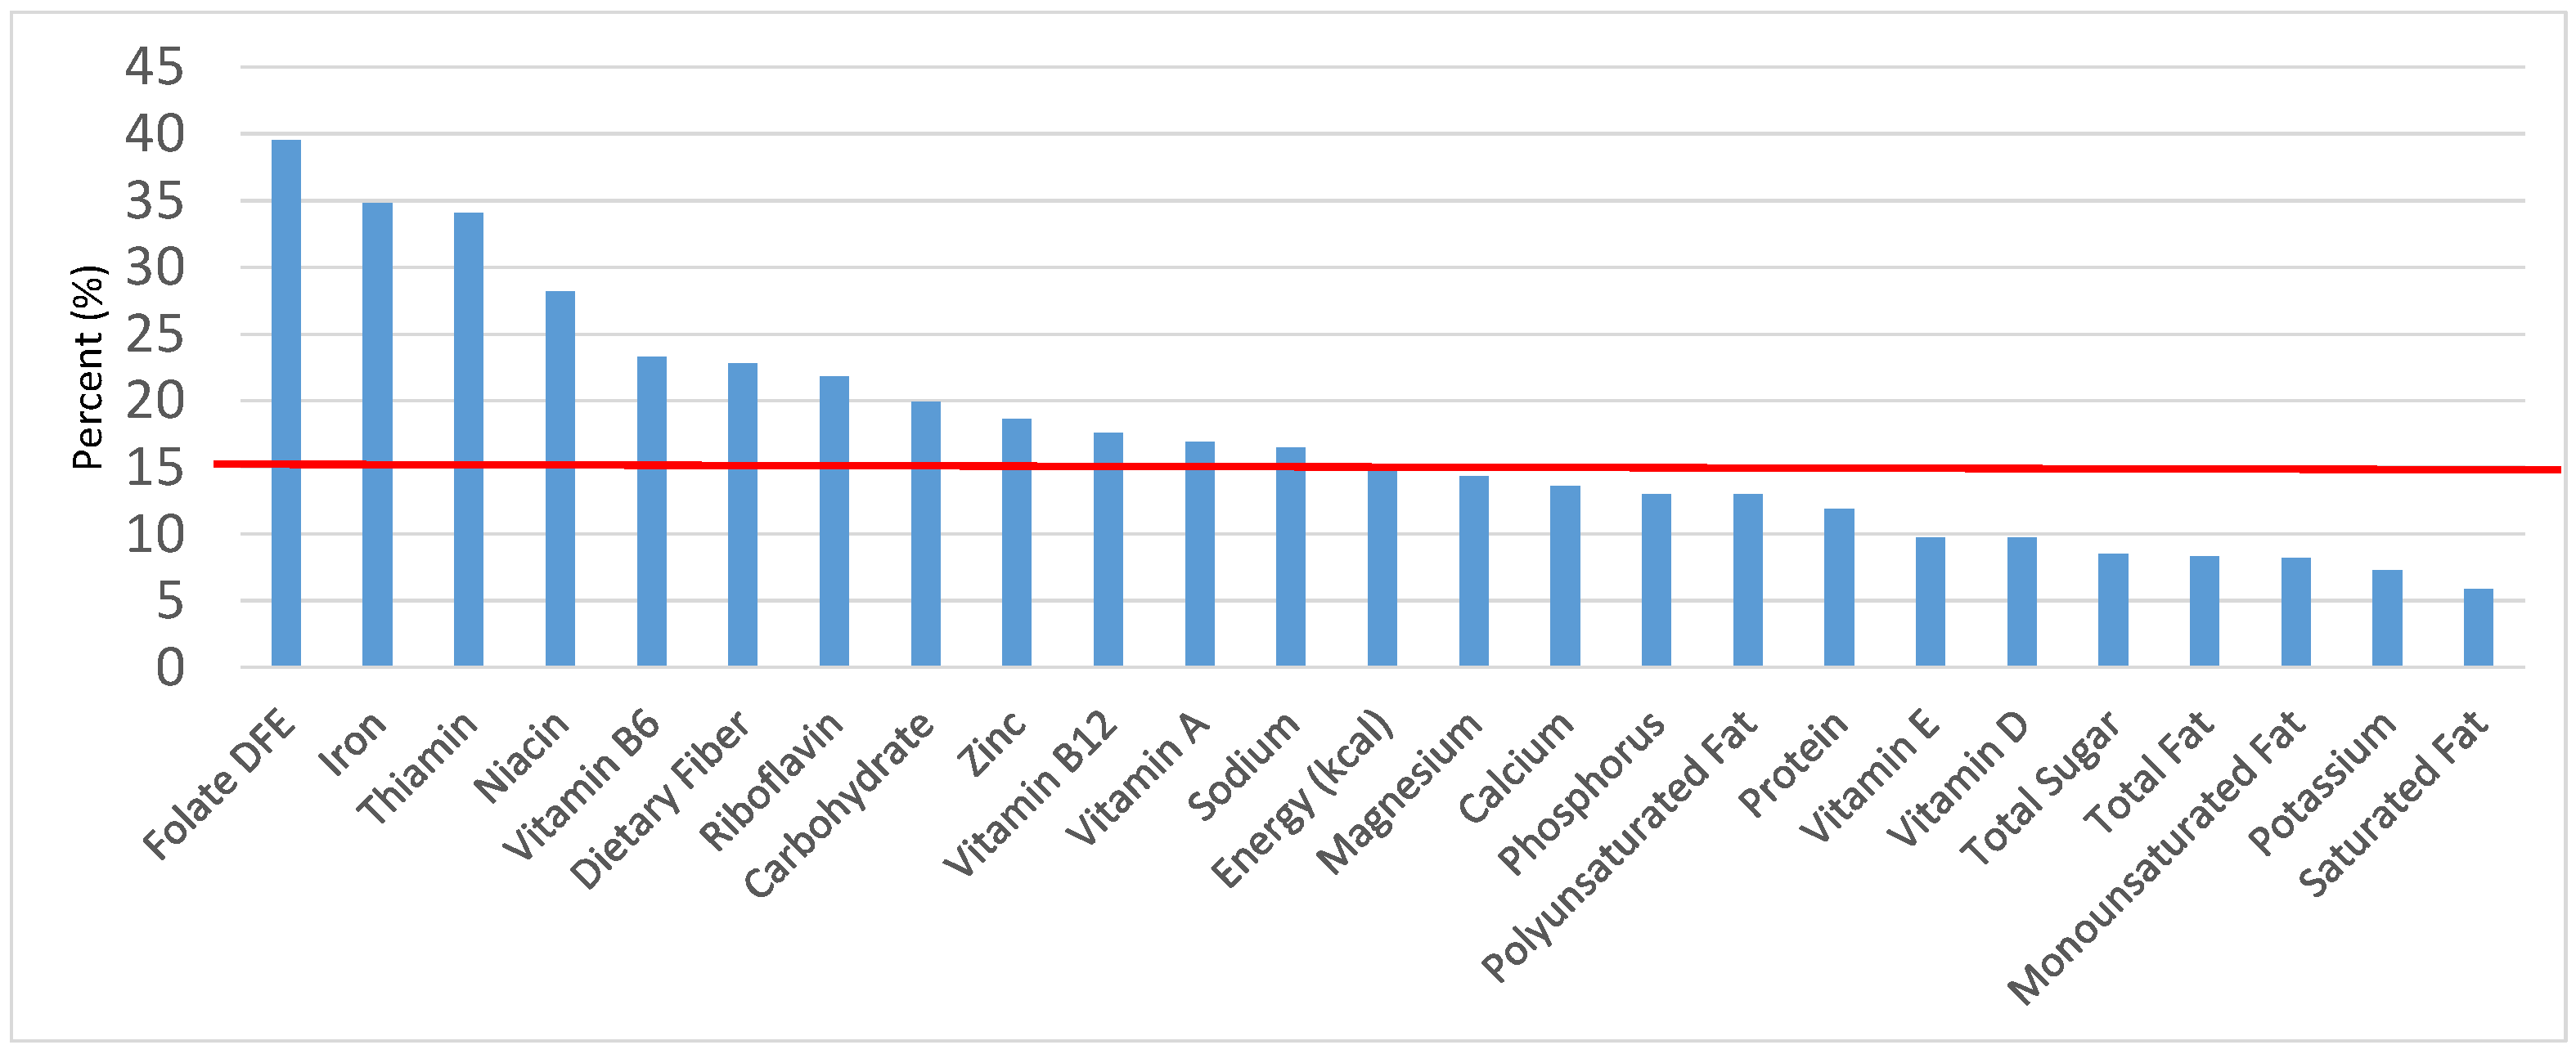
Figure 3.
Grain foods sources of energy and nutrients for children 4–8 years old (N = 1917, daily intake data): DFE = Dietary Folate Equivalents; solid red line represents percentage of energy (kcal) provided in the diet relative to nutrients—nutrients above the red line show the grain food’s contribution to nutrient density.
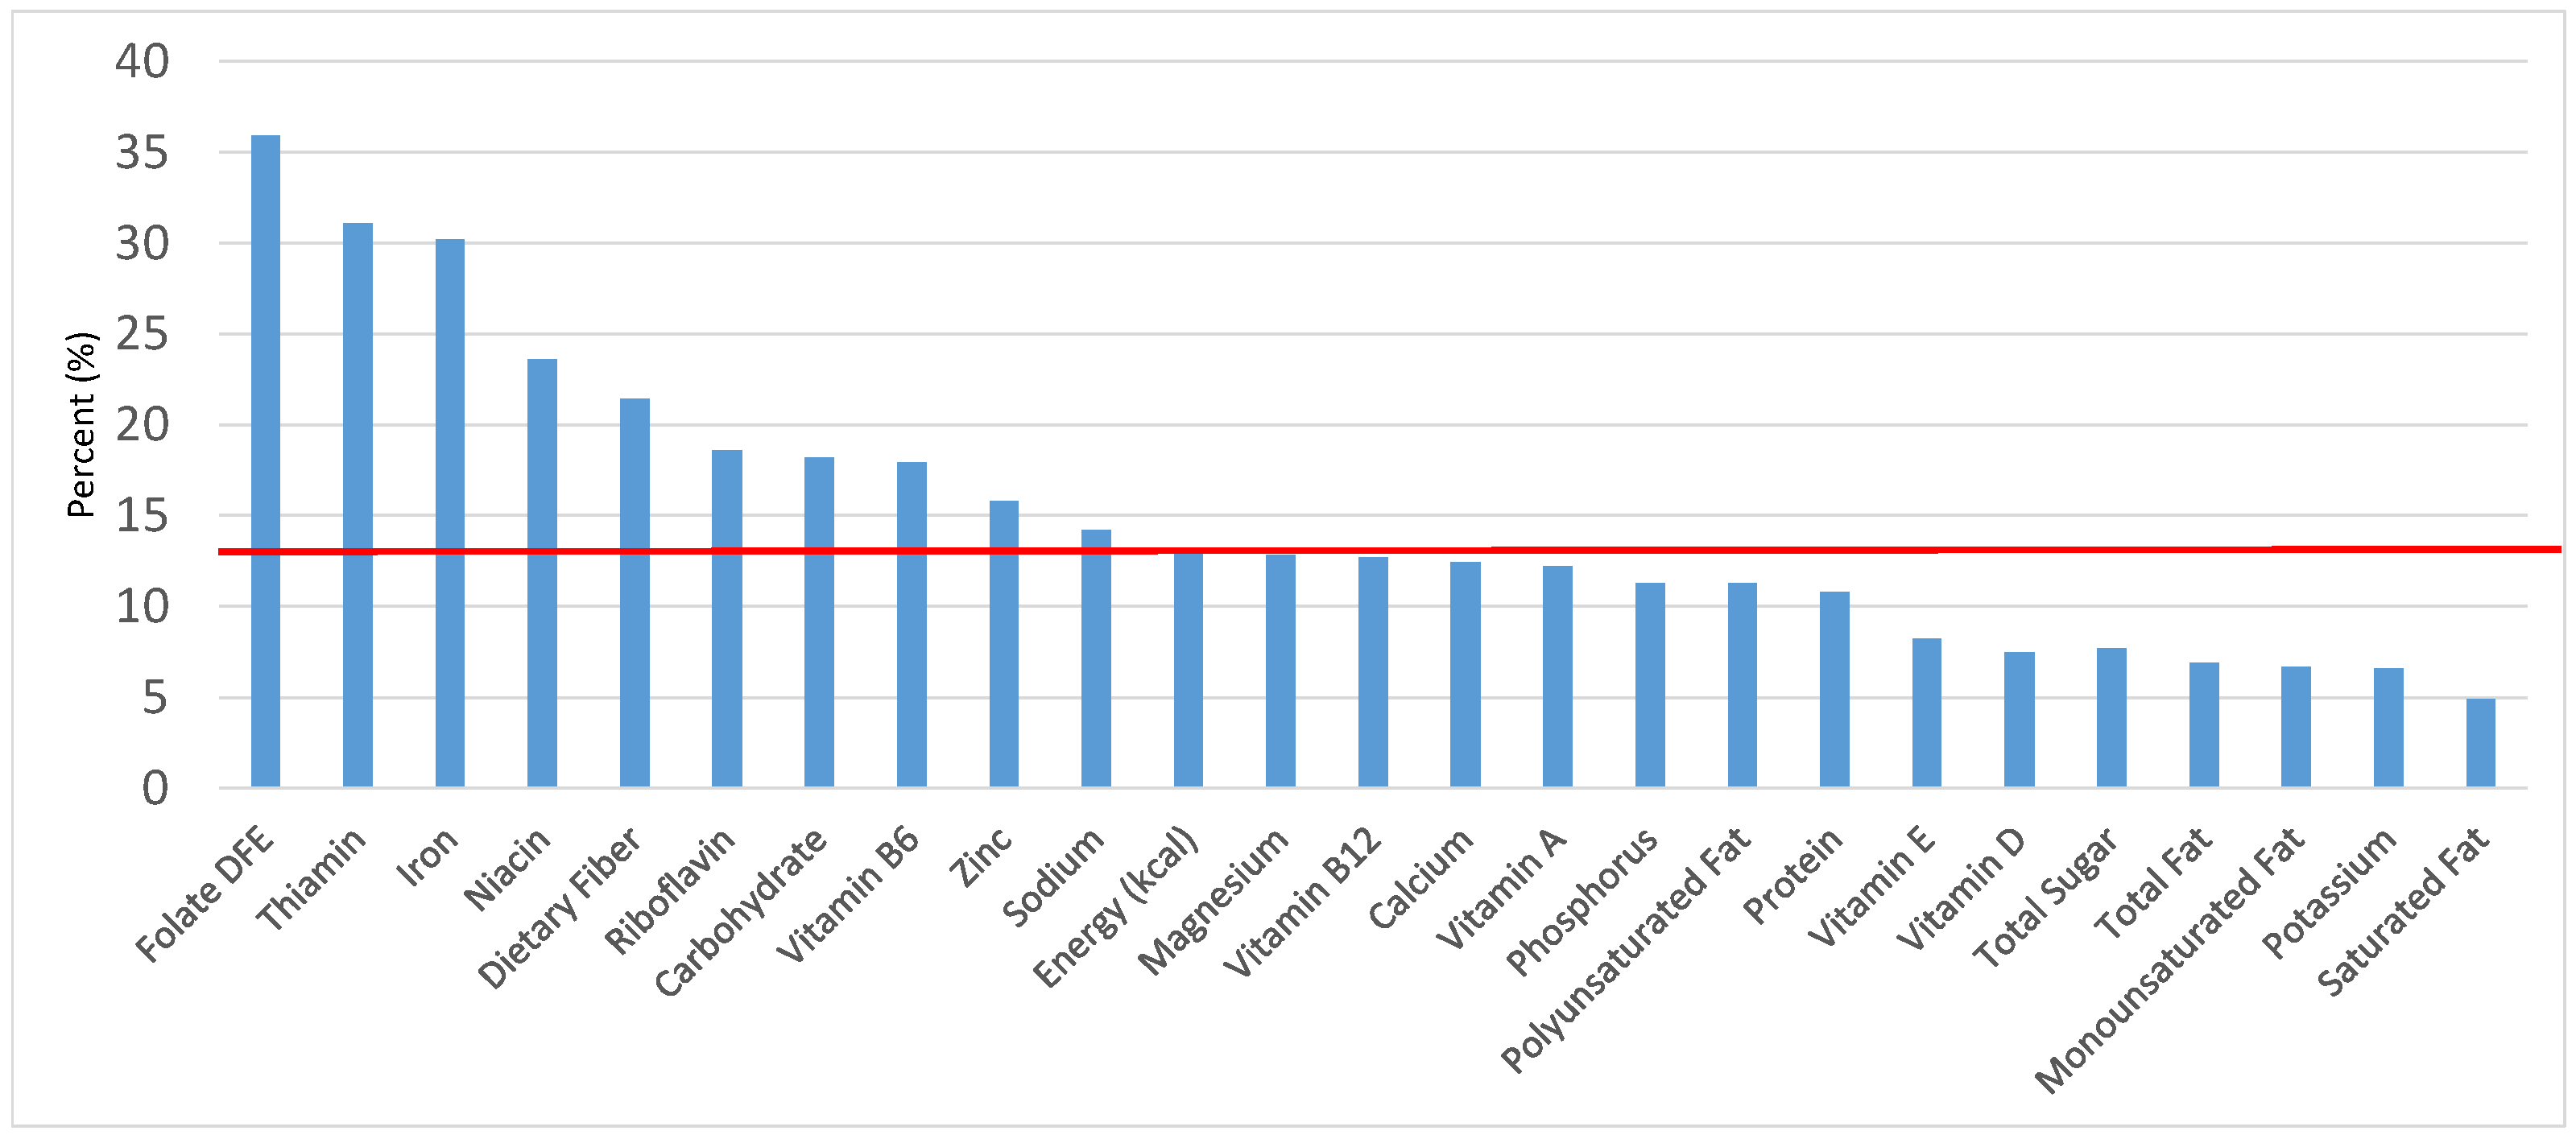
Figure 4.
Grain foods sources of energy and nutrients for children and adolescents 9–13 years old (N = 1730, daily intake data): DFE = Dietary Folate Equivalents; solid red line represents percentage of energy (kcal) provided in the diet relative to nutrients—nutrients above the red line show the grain food’s contribution to nutrient density.
Figure 5.
Grain foods sources of energy and nutrients for adolescents 14–18 years old (N = 1508, daily intake data): DFE = Dietary Folate Equivalents; solid red line represents percentage of energy (kcal) provided in the diet relative to nutrients—nutrients above the red line show the grain food’s contribution to nutrient density.
Figure 6.
Breads, Rolls and tortilla as sources of energy and nutrients for children and adolescents 2–18 years old (N = 6109, daily intake data): DFE = Dietary Folate Equivalents; solid red line represents percentage of energy (kcal) provided in the diet relative to nutrients—nutrients above the red line show the grain food’s contribution to nutrient density.
Figure 7.
Breads, rolls and tortilla as sources of energy and nutrients for children 1–3 years old (N = 1423, daily intake data): DFE = Dietary Folate Equivalents; solid red line represents percentage of energy (kcal) provided in the diet relative to nutrients—nutrients above the red line show the grain food’s contribution to nutrient density.
Figure 8.
Breads, rolls and tortilla as sources of energy and nutrients for children 4–8 years old (N = 1917, daily intake data): DFE = Dietary Folate Equivalents; solid red line represents percentage of energy (kcal) provided in the diet relative to nutrients—nutrients above the red line show the grain food’s contribution to nutrient density.
Figure 9.
Breads, rolls and tortilla as sources of energy and nutrients for children and adolescents 9–13 years old (N = 1730, daily intake data): DFE = Dietary Folate Equivalents; solid red line represents percentage of energy (kcal) provided in the diet relative to nutrients—nutrients above the red line show the grain food’s contribution to nutrient density
Figure 10.
Breads, rolls and tortilla as sources of energy and nutrients for adolescents 14–18 years old (N = 1508, daily intake data): DFE = Dietary Folate Equivalents; solid red line represents percentage of energy (kcal) provided in the diet relative to nutrients—nutrients above the red line show the grain food’s contribution to nutrient density.
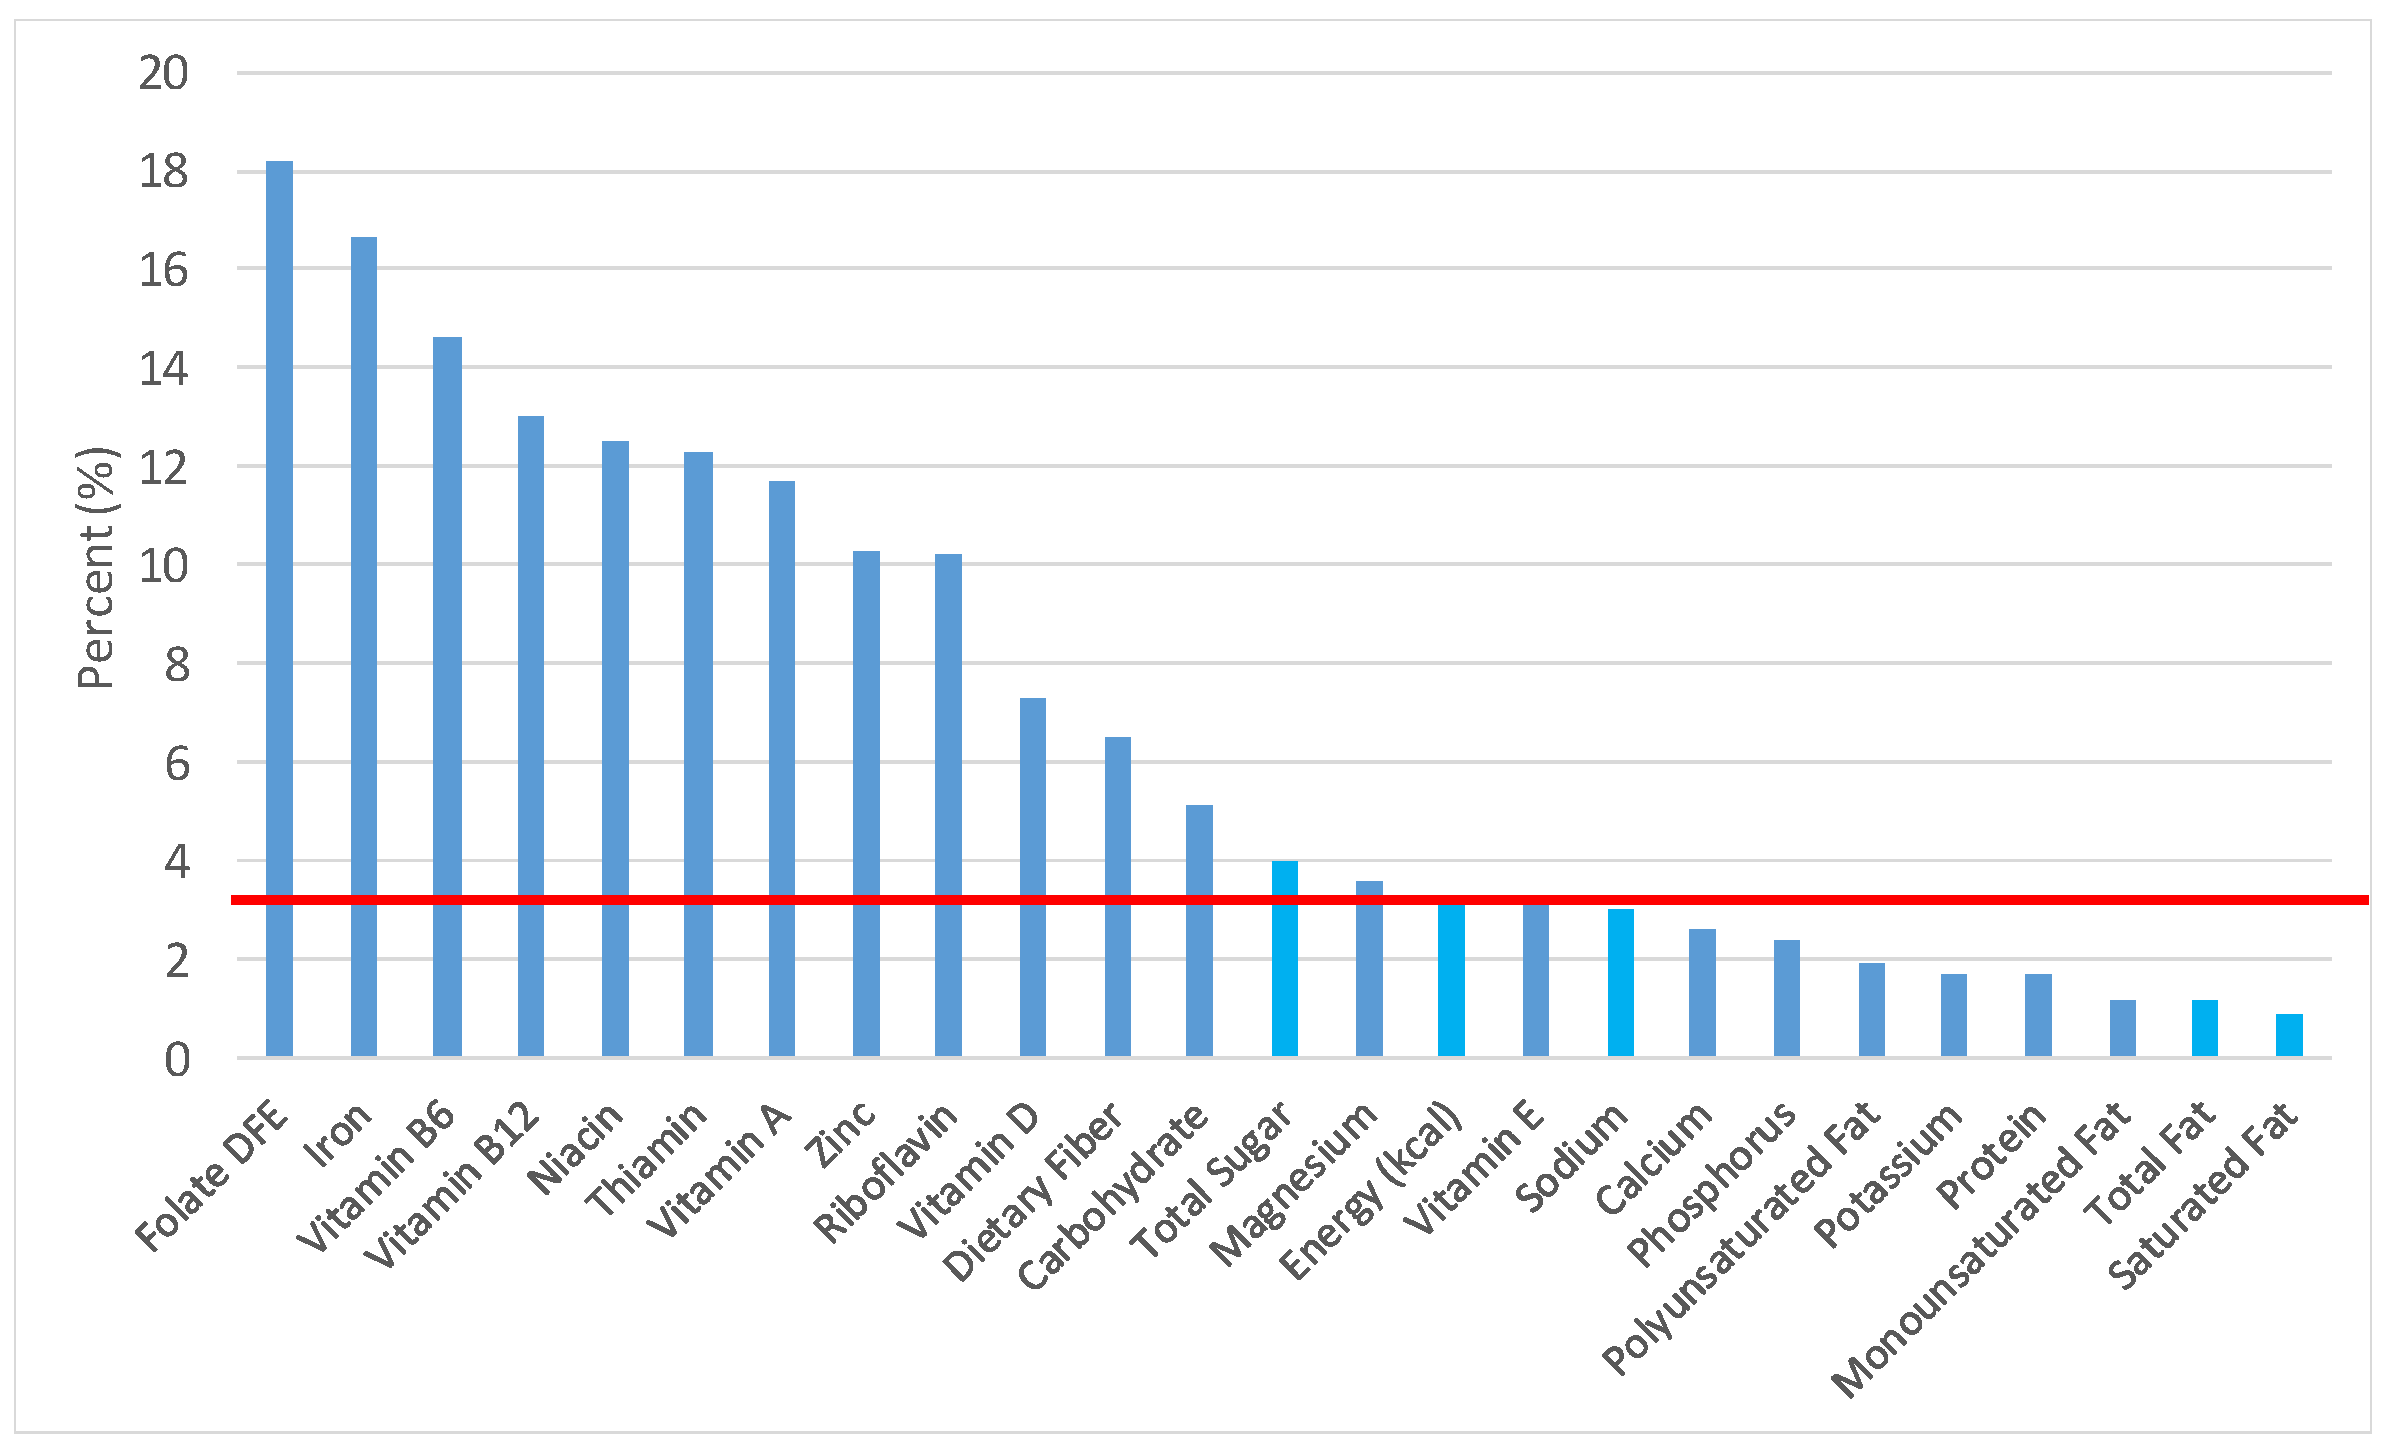
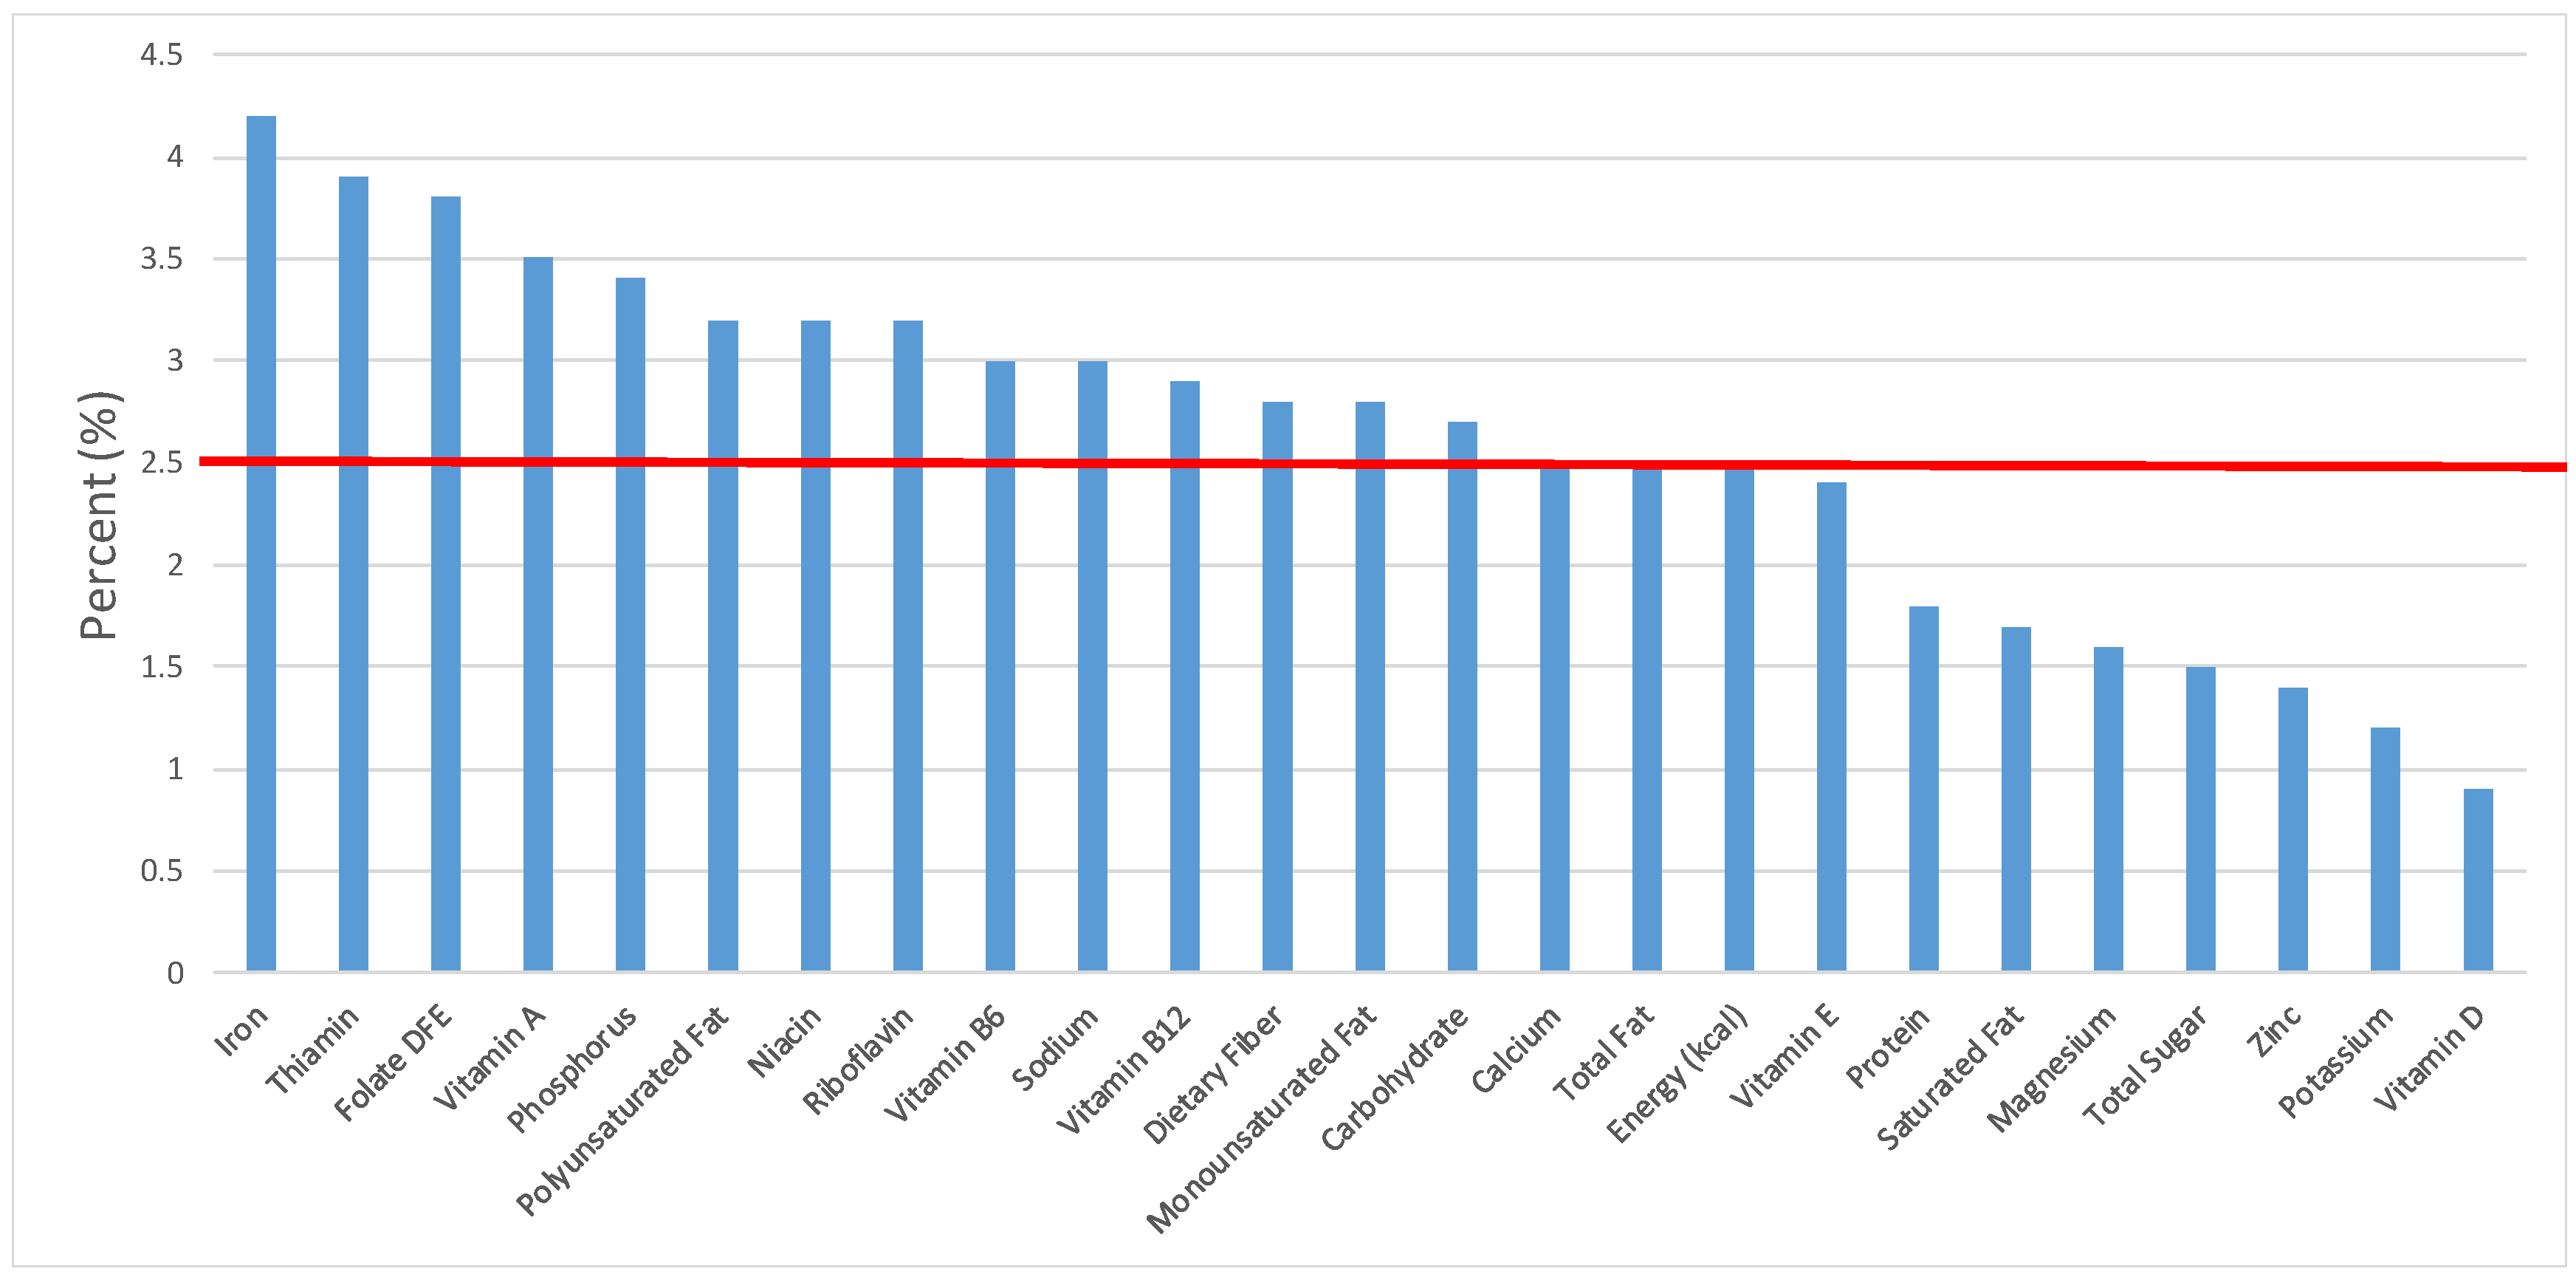
Figure 11.
Ready-to-eat cereals as sources of energy and nutrients for children and adolescents (N = 6109, daily intake data): DFE = Dietary Folate Equivalents; solid red line represents percentage of energy (kcal) provided in the diet relative to nutrients—nutrients above the red line show the grain food’s contribution to nutrient density.
Figure 12.
Ready-to-eat cereals as sources of energy and nutrients for children 1–3 years old (N = 1423, daily intake data): DFE = Dietary Folate Equivalents; solid red line represents percentage of energy (kcal) provided in the diet relative to nutrients—nutrients above the red line show the grain food’s contribution to nutrient density.
Figure 13.
Ready-to-eat cereals as sources of energy and nutrients for children 4–8 years old (N = 1917, daily intake data): DFE = Dietary Folate Equivalents; solid red line represents percentage of energy (kcal) provided in the diet relative to nutrients—nutrients above the red line show the grain food’s contribution to nutrient density.
Figure 14.
Ready-to-eat cereals as sources of energy and nutrients for children and adolescents 9–13 years old (N = 1730, daily intake data): DFE = Dietary Folate Equivalents; solid red line represents percentage of energy (kcal) provided in the diet relative to nutrients—nutrients above the red line show the grain food’s contribution to nutrient density.
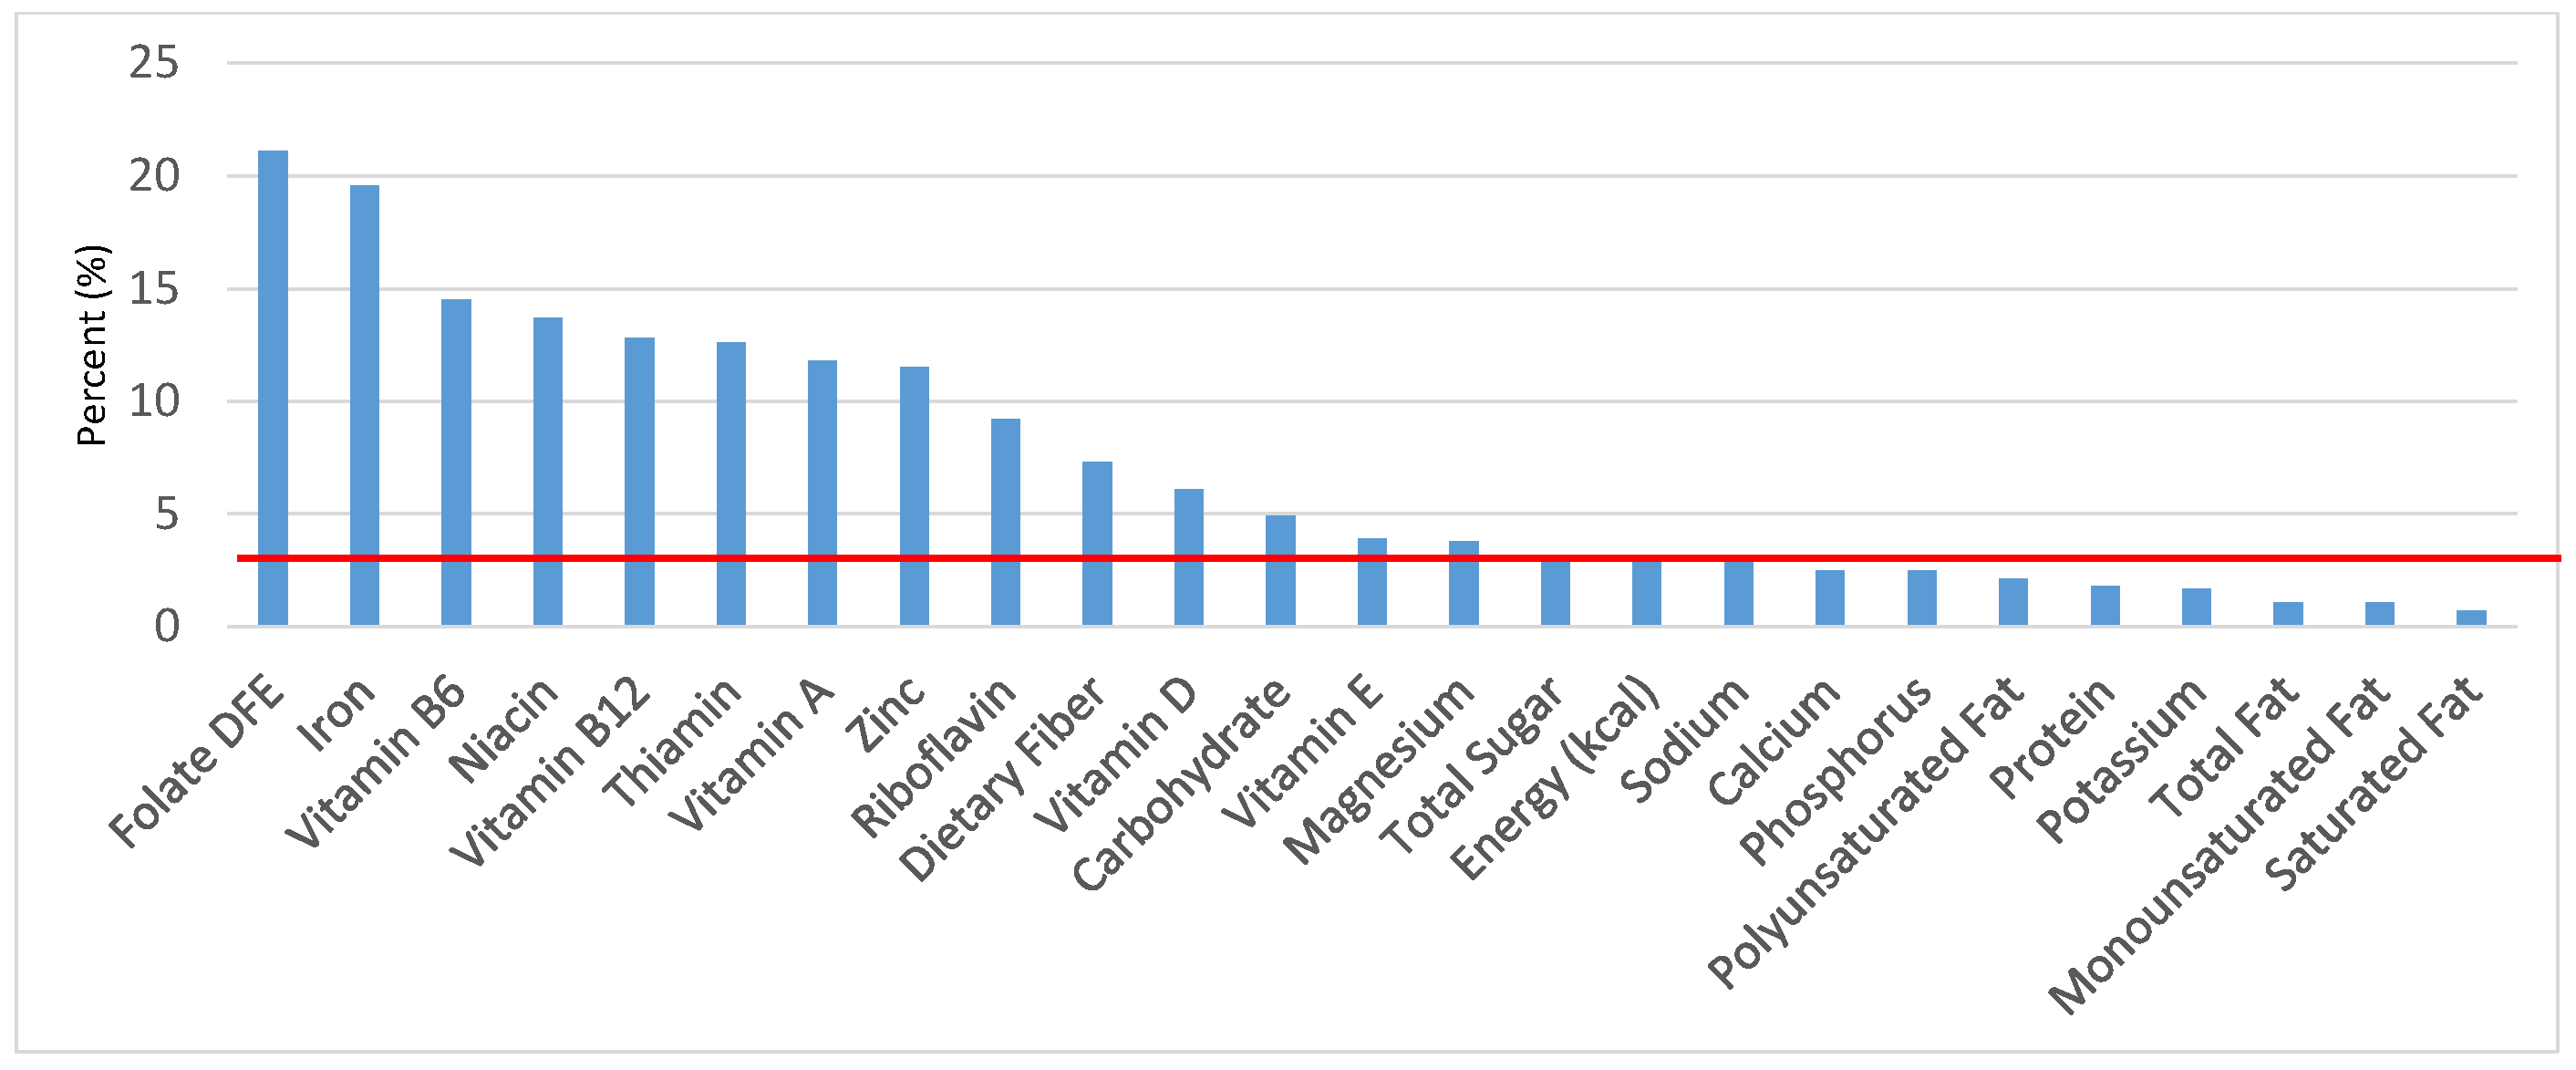
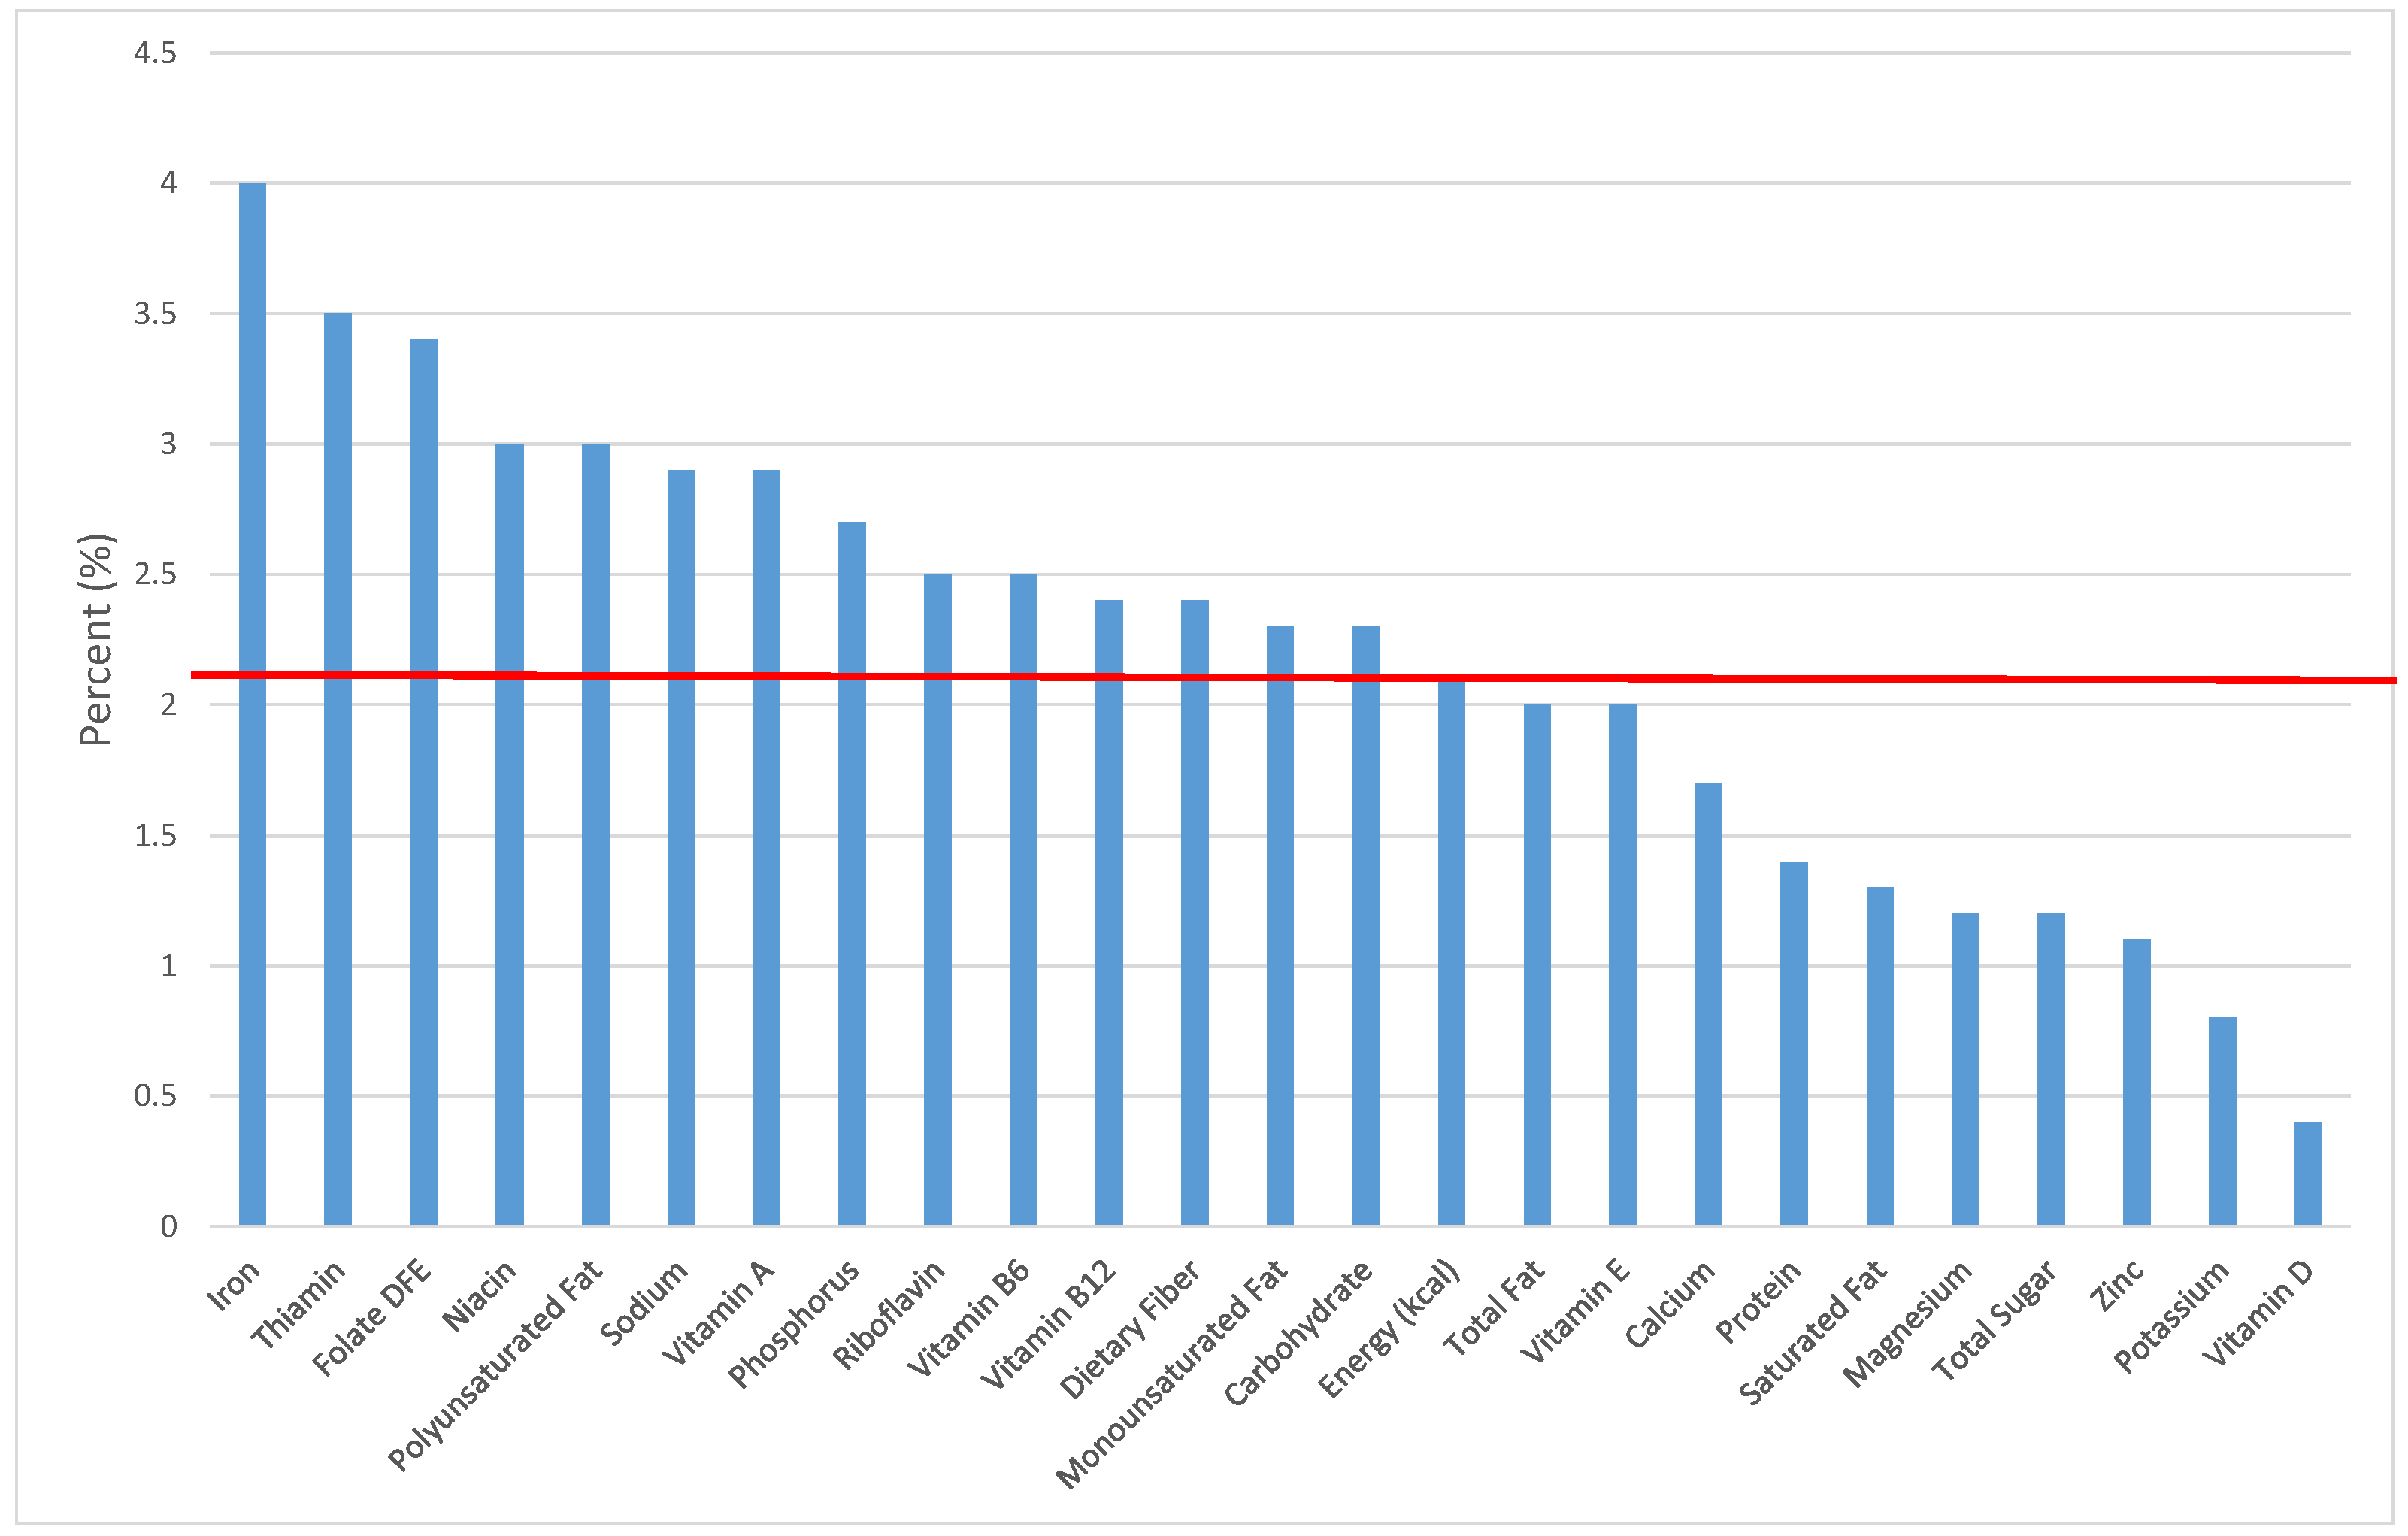
Figure 15.
Ready-to-eat cereals as sources of energy and nutrients for adolescents 14–18 years old (N = 1508, daily intake data): DFE = Dietary Folate Equivalents; solid red line represents percentage of energy (kcal) provided in the diet relative to nutrients—nutrients above the red line show the grain food’s contribution to nutrient density.
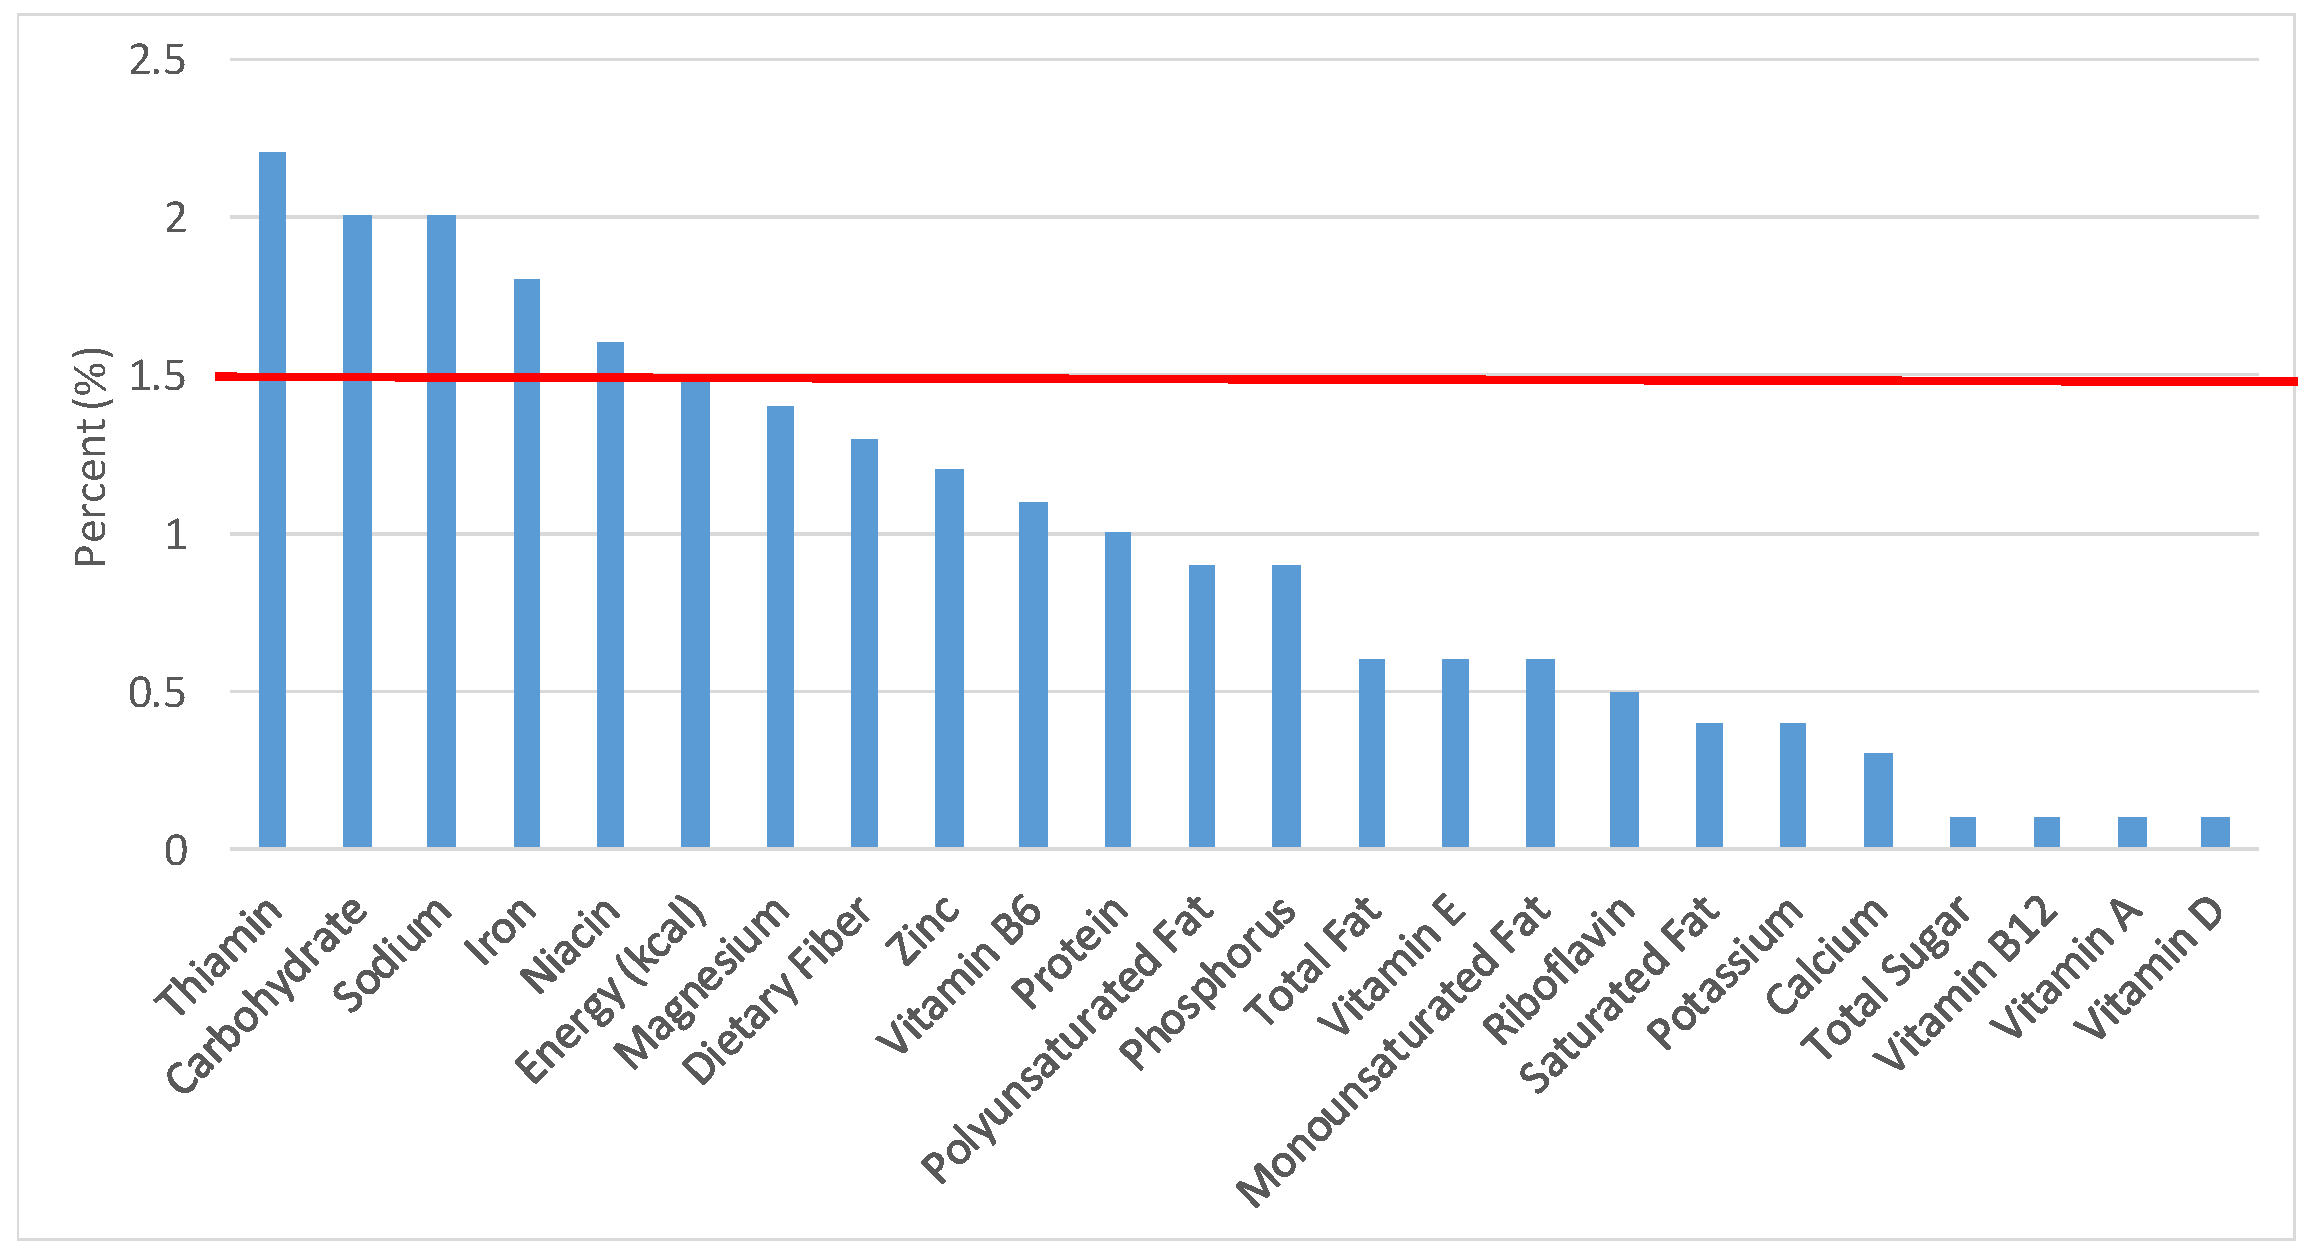
Figure 16.
Cooked grains as sources of energy and nutrients for children and adolescents 2–18 years old (N = 6109, daily intake data): DFE = Dietary Folate Equivalents; solid red line represents percentage of energy (kcal) provided in the diet relative to nutrients—nutrients above the red line show the grain food’s contribution to nutrient density.
Figure 17.
Cooked grains as sources of energy and nutrients for children 1–3 years old (N = 1423, daily intake data): DFE = Dietary Folate Equivalents; solid red line represents percentage of energy (kcal) provided in the diet relative to nutrients—nutrients above the red line show the grain food’s contribution to nutrient density.
Figure 18.
Cooked grains as sources of energy and nutrients for children 4–8 years old (N = 1917, daily intake data): DFE = Dietary Folate Equivalents; solid red line represents percentage of energy (kcal) provided in the diet relative to nutrients—nutrients above the red line show the grain food’s contribution to nutrient density.
Figure 19.
Cooked grains as sources of energy and nutrients for children and adolescents 9–13 years old (N = 1730, daily intake data): DFE = Dietary Folate Equivalents; solid red line represents percentage of energy (kcal) provided in the diet relative to nutrients—nutrients above the red line show the grain food’s contribution to nutrient density.
Figure 20.
Cooked grains as sources of energy and nutrients for adolescents 14–18 years old (N = 1508, daily intake data): DFE = Dietary Folate Equivalents; solid red line represents percentage of energy (kcal) provided in the diet relative to nutrients—nutrients above the red line show the grain food’s contribution to nutrient density.
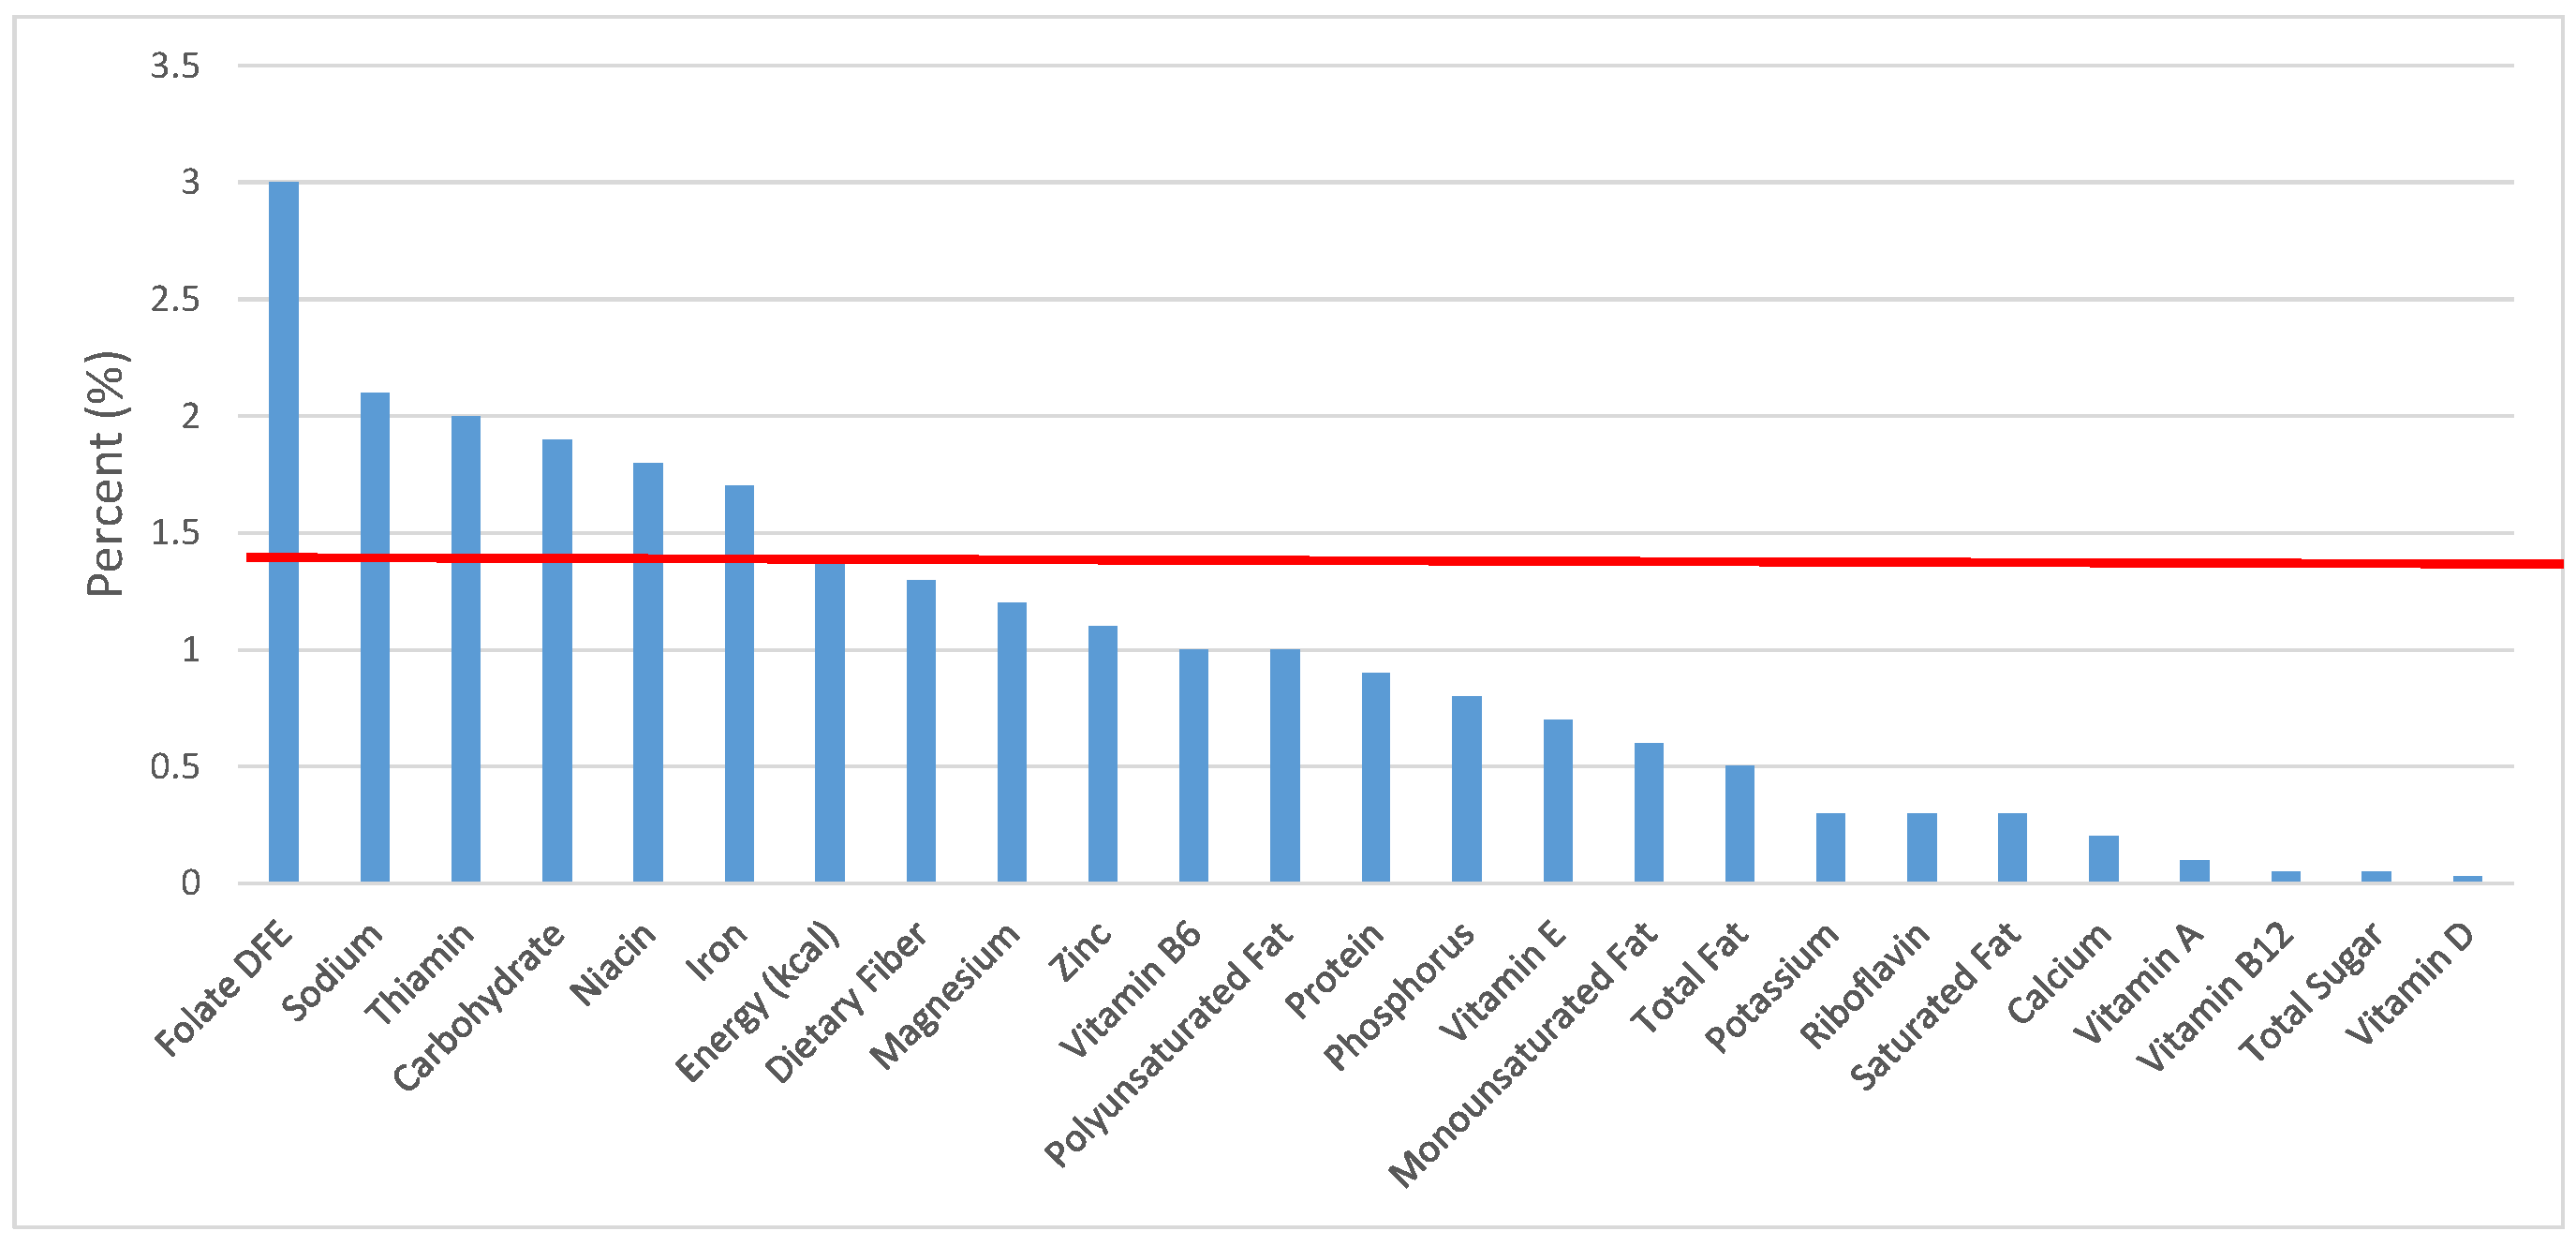
Figure 21.
Quick breads and bread products as sources of energy and nutrients for children and adolescents 2–18 years old (N = 6109, daily intake data): DFE = Dietary Folate Equivalents; solid red line represents percentage of energy (kcal) provided in the diet relative to nutrients—nutrients above the red line show the grain food’s contribution to nutrient density.
Figure 22.
Quick breads and bread products as sources of energy and nutrients for children 1–3 years old (N = 1423, daily intake data): DFE = Dietary Folate Equivalents; solid red line represents percentage of energy (kcal) provided in the diet relative to nutrients—nutrients above the red line show the grain food’s contribution to nutrient density.
Figure 23.
Quick breads and bread products as sources of energy and nutrients for children 4–8 years old (N = 1917, daily intake data): DFE = Dietary Folate Equivalents; solid red line represents percentage of energy (kcal) provided in the diet relative to nutrients—nutrients above the red line show the grain food’s contribution to nutrient density.
Figure 24.
Quick breads and bread products as sources of energy and nutrients for children and adolescents 9–13 years old (N = 1730, daily intake data): DFE = Dietary Folate Equivalents; solid red line represents percentage of energy (kcal) provided in the diet relative to nutrients—nutrients above the red line show the grain food’s contribution to nutrient density.
Figure 25.
Quick breads and bread products as sources of energy and nutrients for adolescents 14–18 years old (N = 1508, daily intake data): DFE = Dietary Folate Equivalents; solid red line represents percentage of energy (kcal) provided in the diet relative to nutrients—nutrients above the red line show the grain food’s contribution to nutrient density.
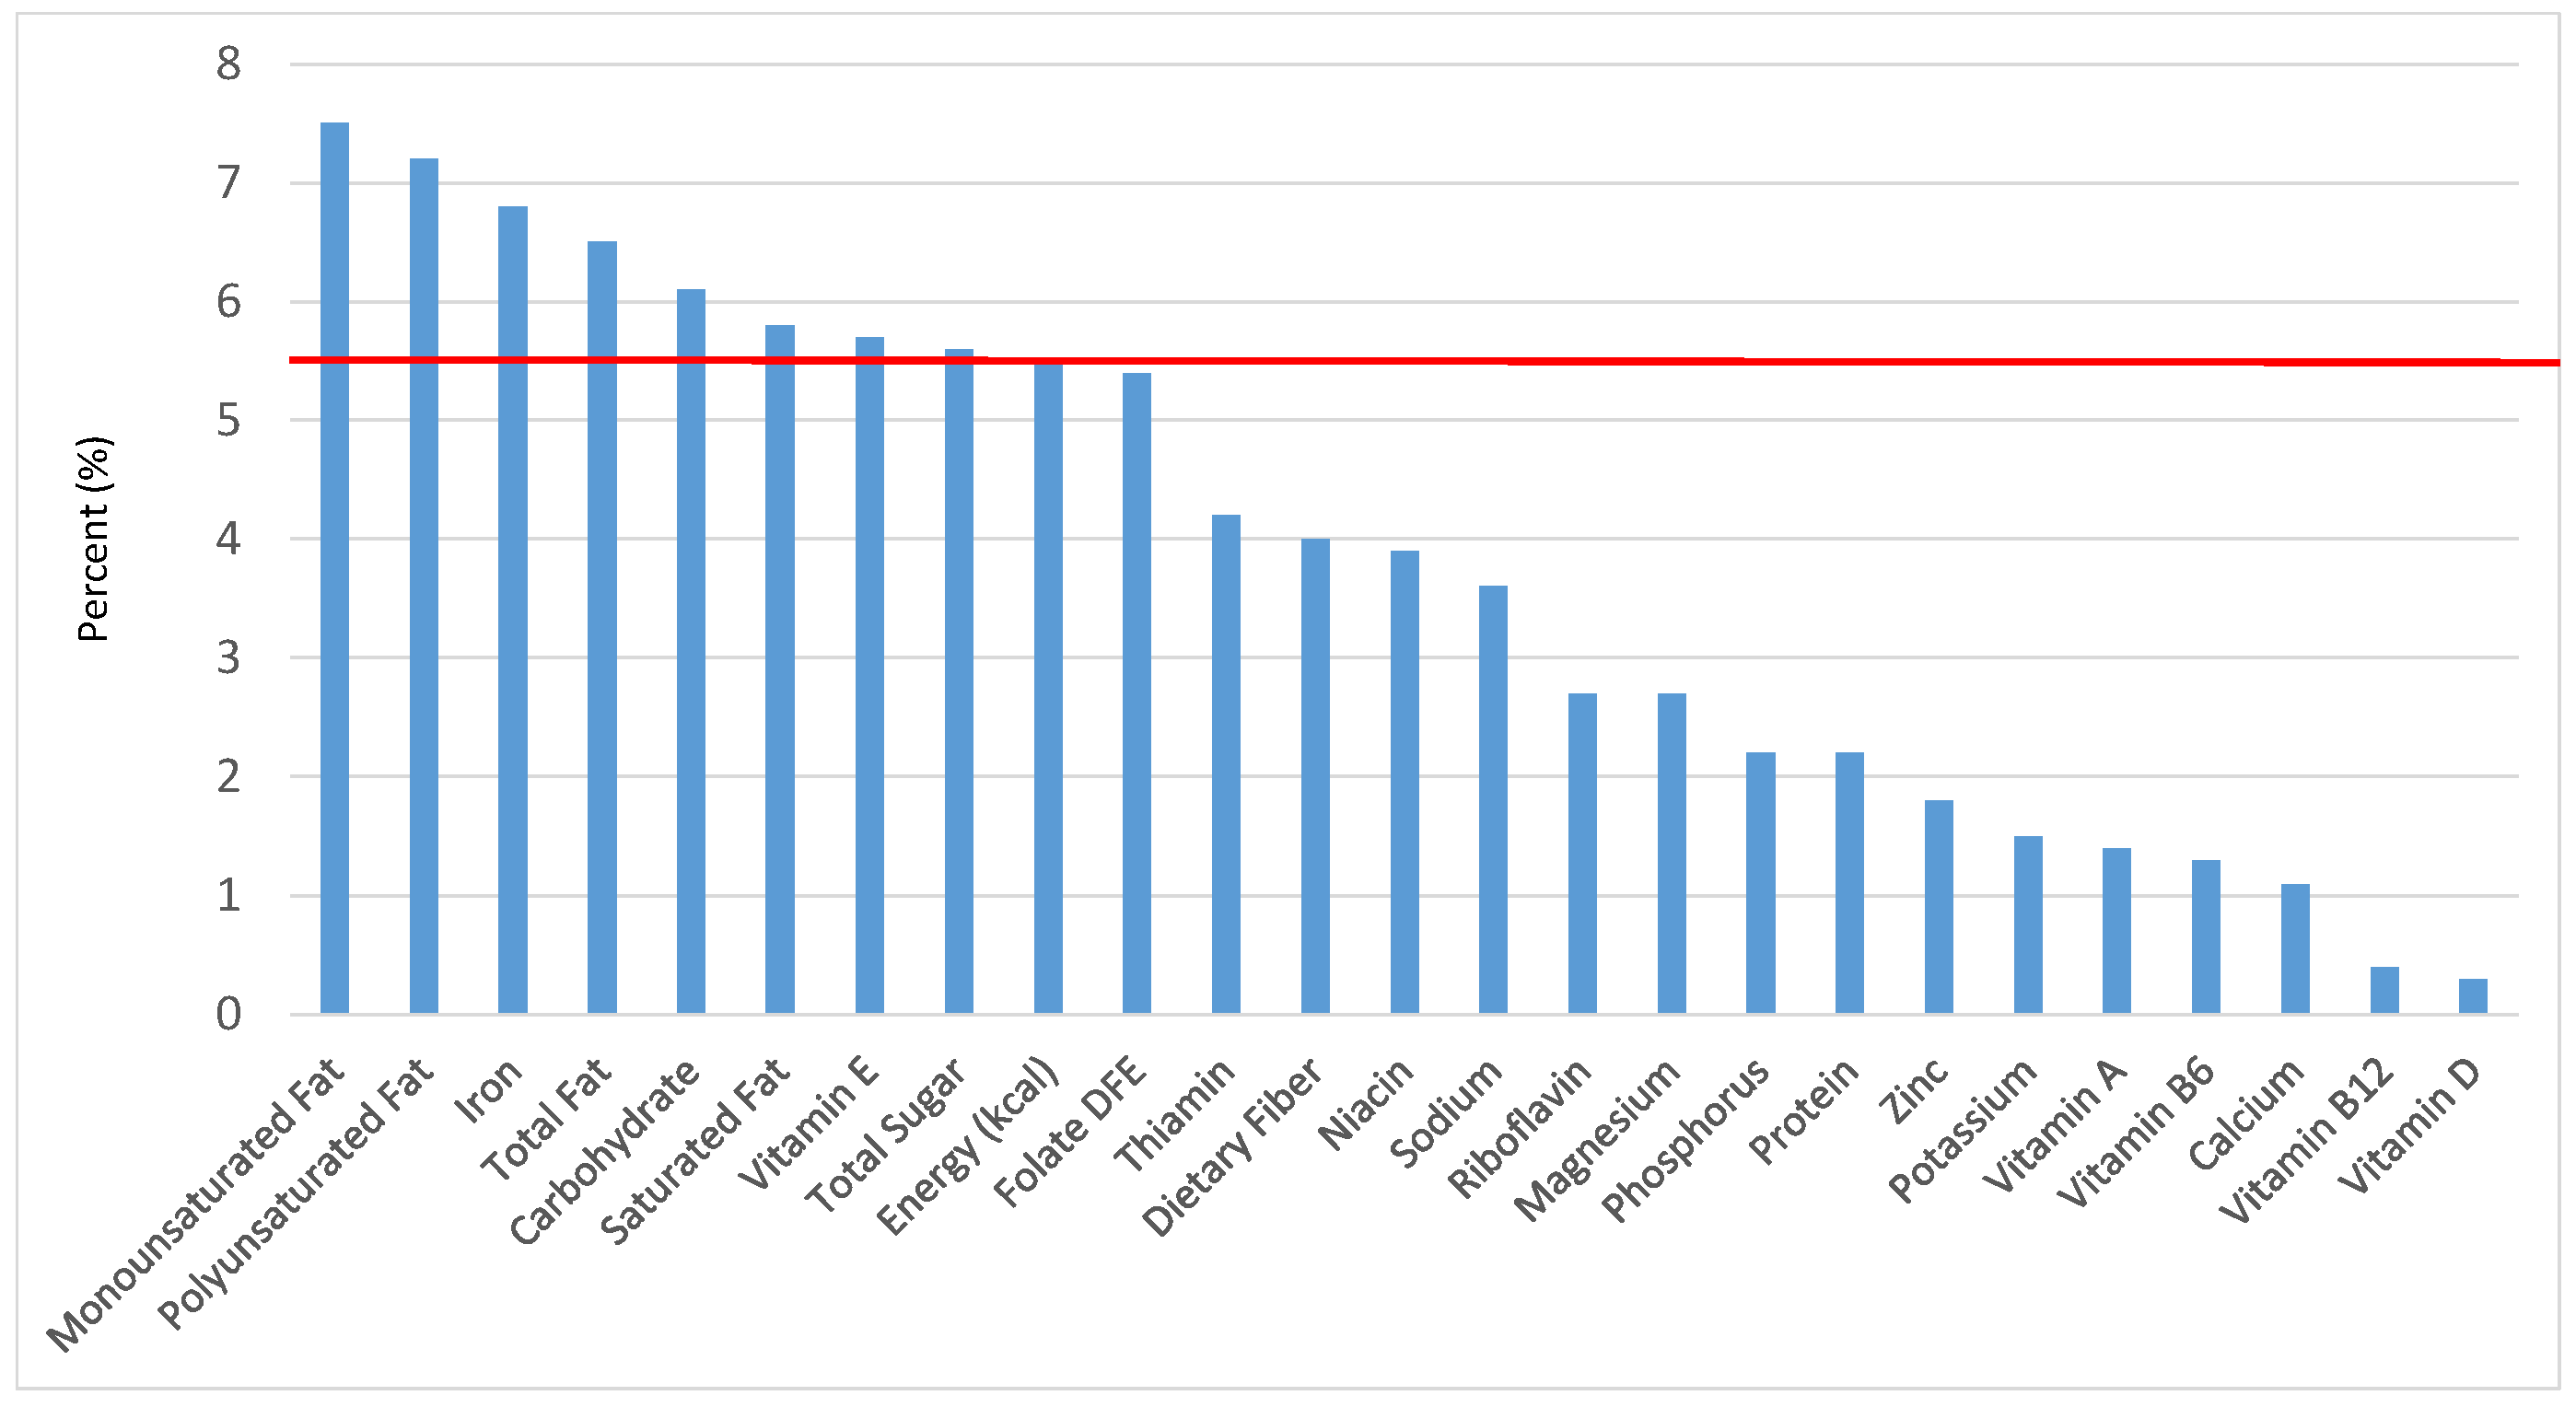
Figure 26.
Sweet bakery products as sources of energy and nutrients for children and adolescents 2–18 years old (N = 6109, daily intake data): DFE = Dietary Folate Equivalents; solid red line represents percentage of energy (kcal) provided in the diet relative to nutrients—nutrients above the red line show the grain food’s contribution to nutrient density.
Figure 27.
Sweet bakery products as sources of energy and nutrients for children 1–3 years old (N = 1423, daily intake data): DFE = Dietary Folate Equivalents; solid red line represents percentage of energy (kcal) provided in the diet relative to nutrients—nutrients above the red line show the grain food’s contribution to nutrient density.
Figure 28.
Sweet bakery products as sources of energy and nutrients for children 4–8 years old (N = 1917, daily intake data): DFE = Dietary Folate Equivalents; solid red line represents percentage of energy (kcal) provided in the diet relative to nutrients—nutrients above the red line show the grain food’s contribution to nutrient density.
Figure 29.
Sweet bakery products as sources of energy and nutrients for children and adolescents 9–13 years old (N = 1730, daily intake data): DFE = Dietary Folate Equivalents; solid red line represents percentage of energy (kcal) provided in the diet relative to nutrients—nutrients above the red line show the grain food’s contribution to nutrient density.
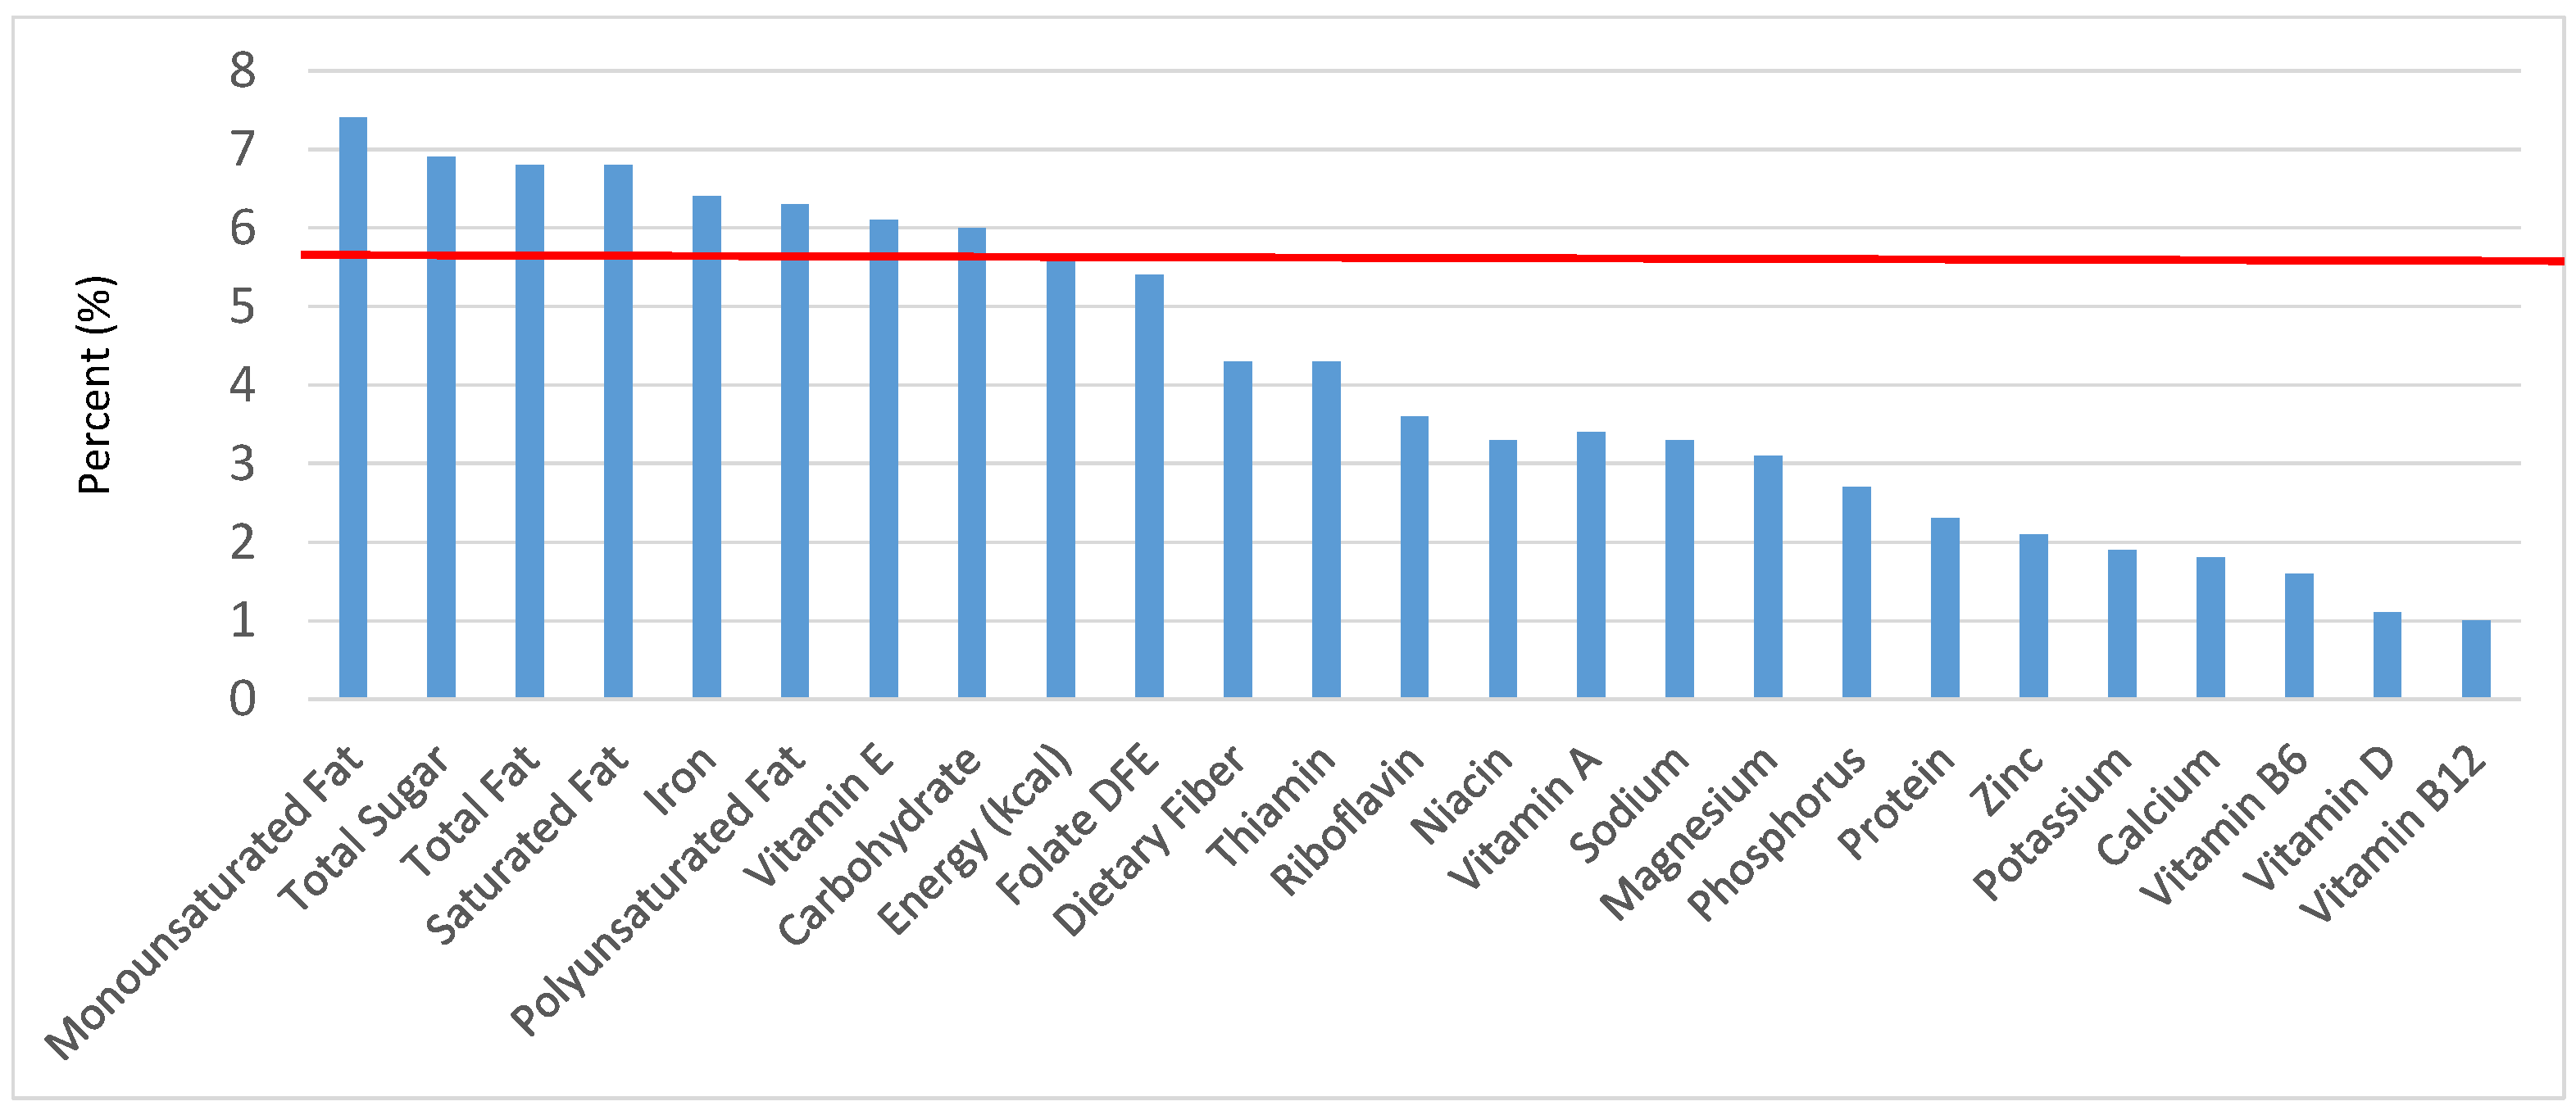
Figure 30.
Sweet bakery products as sources of energy and nutrients for adolescents 14–18 years old (N = 1508, daily intake data): DFE = Dietary Folate Equivalents; solid red line represents percentage of energy (kcal) provided in the diet relative to nutrients—nutrients above the red line show the grain food’s contribution to nutrient density.
Table 1.
Grain categories identified from National Health and Nutrition Examination Survey 2009–2012 in children and adolescents (2–18 years old; N = 6109) by mean ± standard error (SE) gram weight and percent weight (SE) in total diet.
Table 1.
Grain categories identified from National Health and Nutrition Examination Survey 2009–2012 in children and adolescents (2–18 years old; N = 6109) by mean ± standard error (SE) gram weight and percent weight (SE) in total diet.
| Grain Food Group Category | Mean Weight (g) Consumption (SE) | Percent Weight Consumption in the Total Diet |
|---|
| All Foods | 2208 ± 34 | 100% ± 0 |
| All Grains | 104 ± 2 | 5.18 ± 0.11 |
| Breads, Rolls and Tortillas | 43.6 ± 1.3 | 2.16 ± 0.05 |
| Ready-to-Eat Cereals | 15.3 ± 0.6 | 0.79 ± 0.03 |
| Cooked Grains | 20.0 ± 1.8 | 0.96 ± 0.08 |
| Quick Breads and Bread Products | 16.9 ± 1.0 | 0.88 ± 0.06 |
| Sweet Bakery Products | 34.4 ± 1.1 | 1.73 ± 0.06 |


