Dependence of Creep Strain and Fatigue Behavior on Surface Characteristics of Resistive Strain Gauges


Abstract
:
1. Introduction
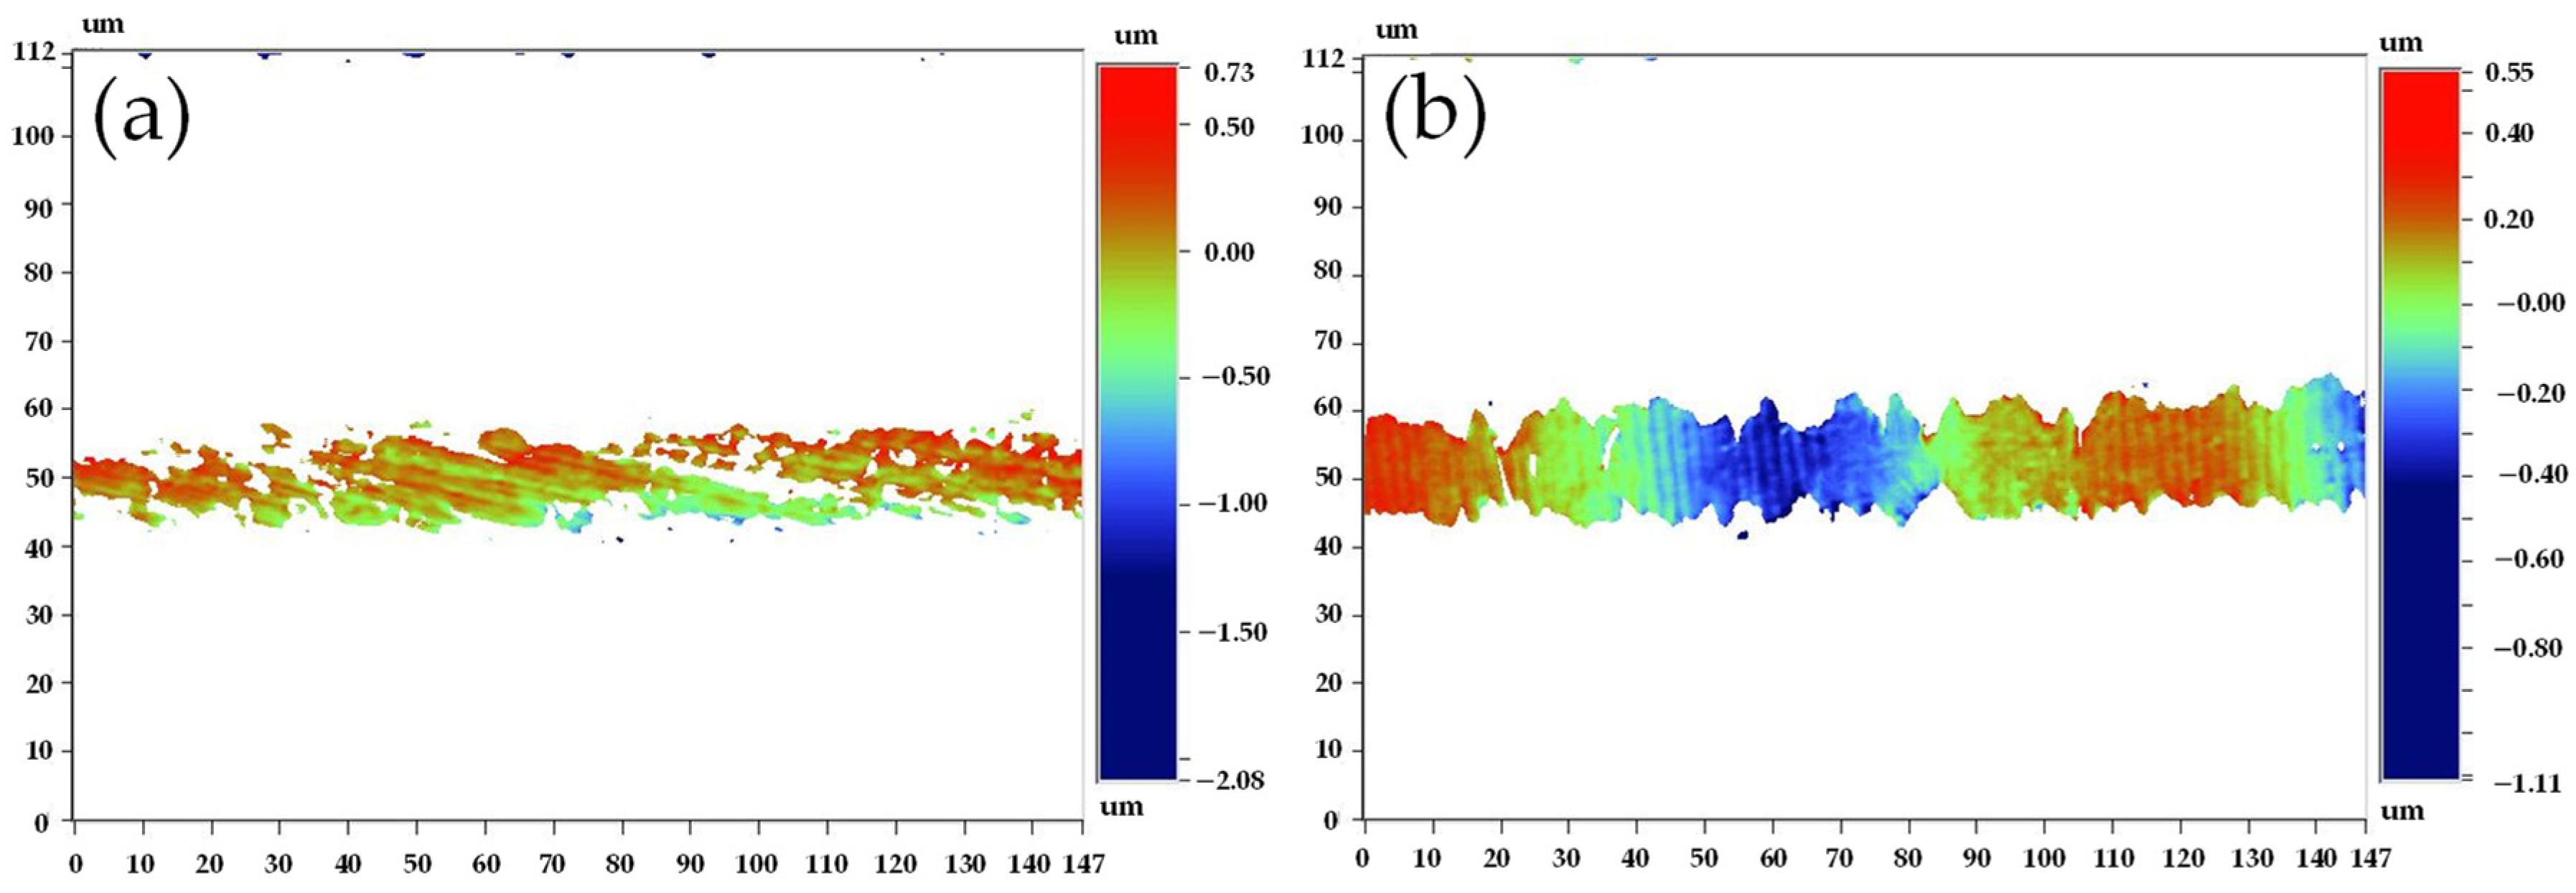
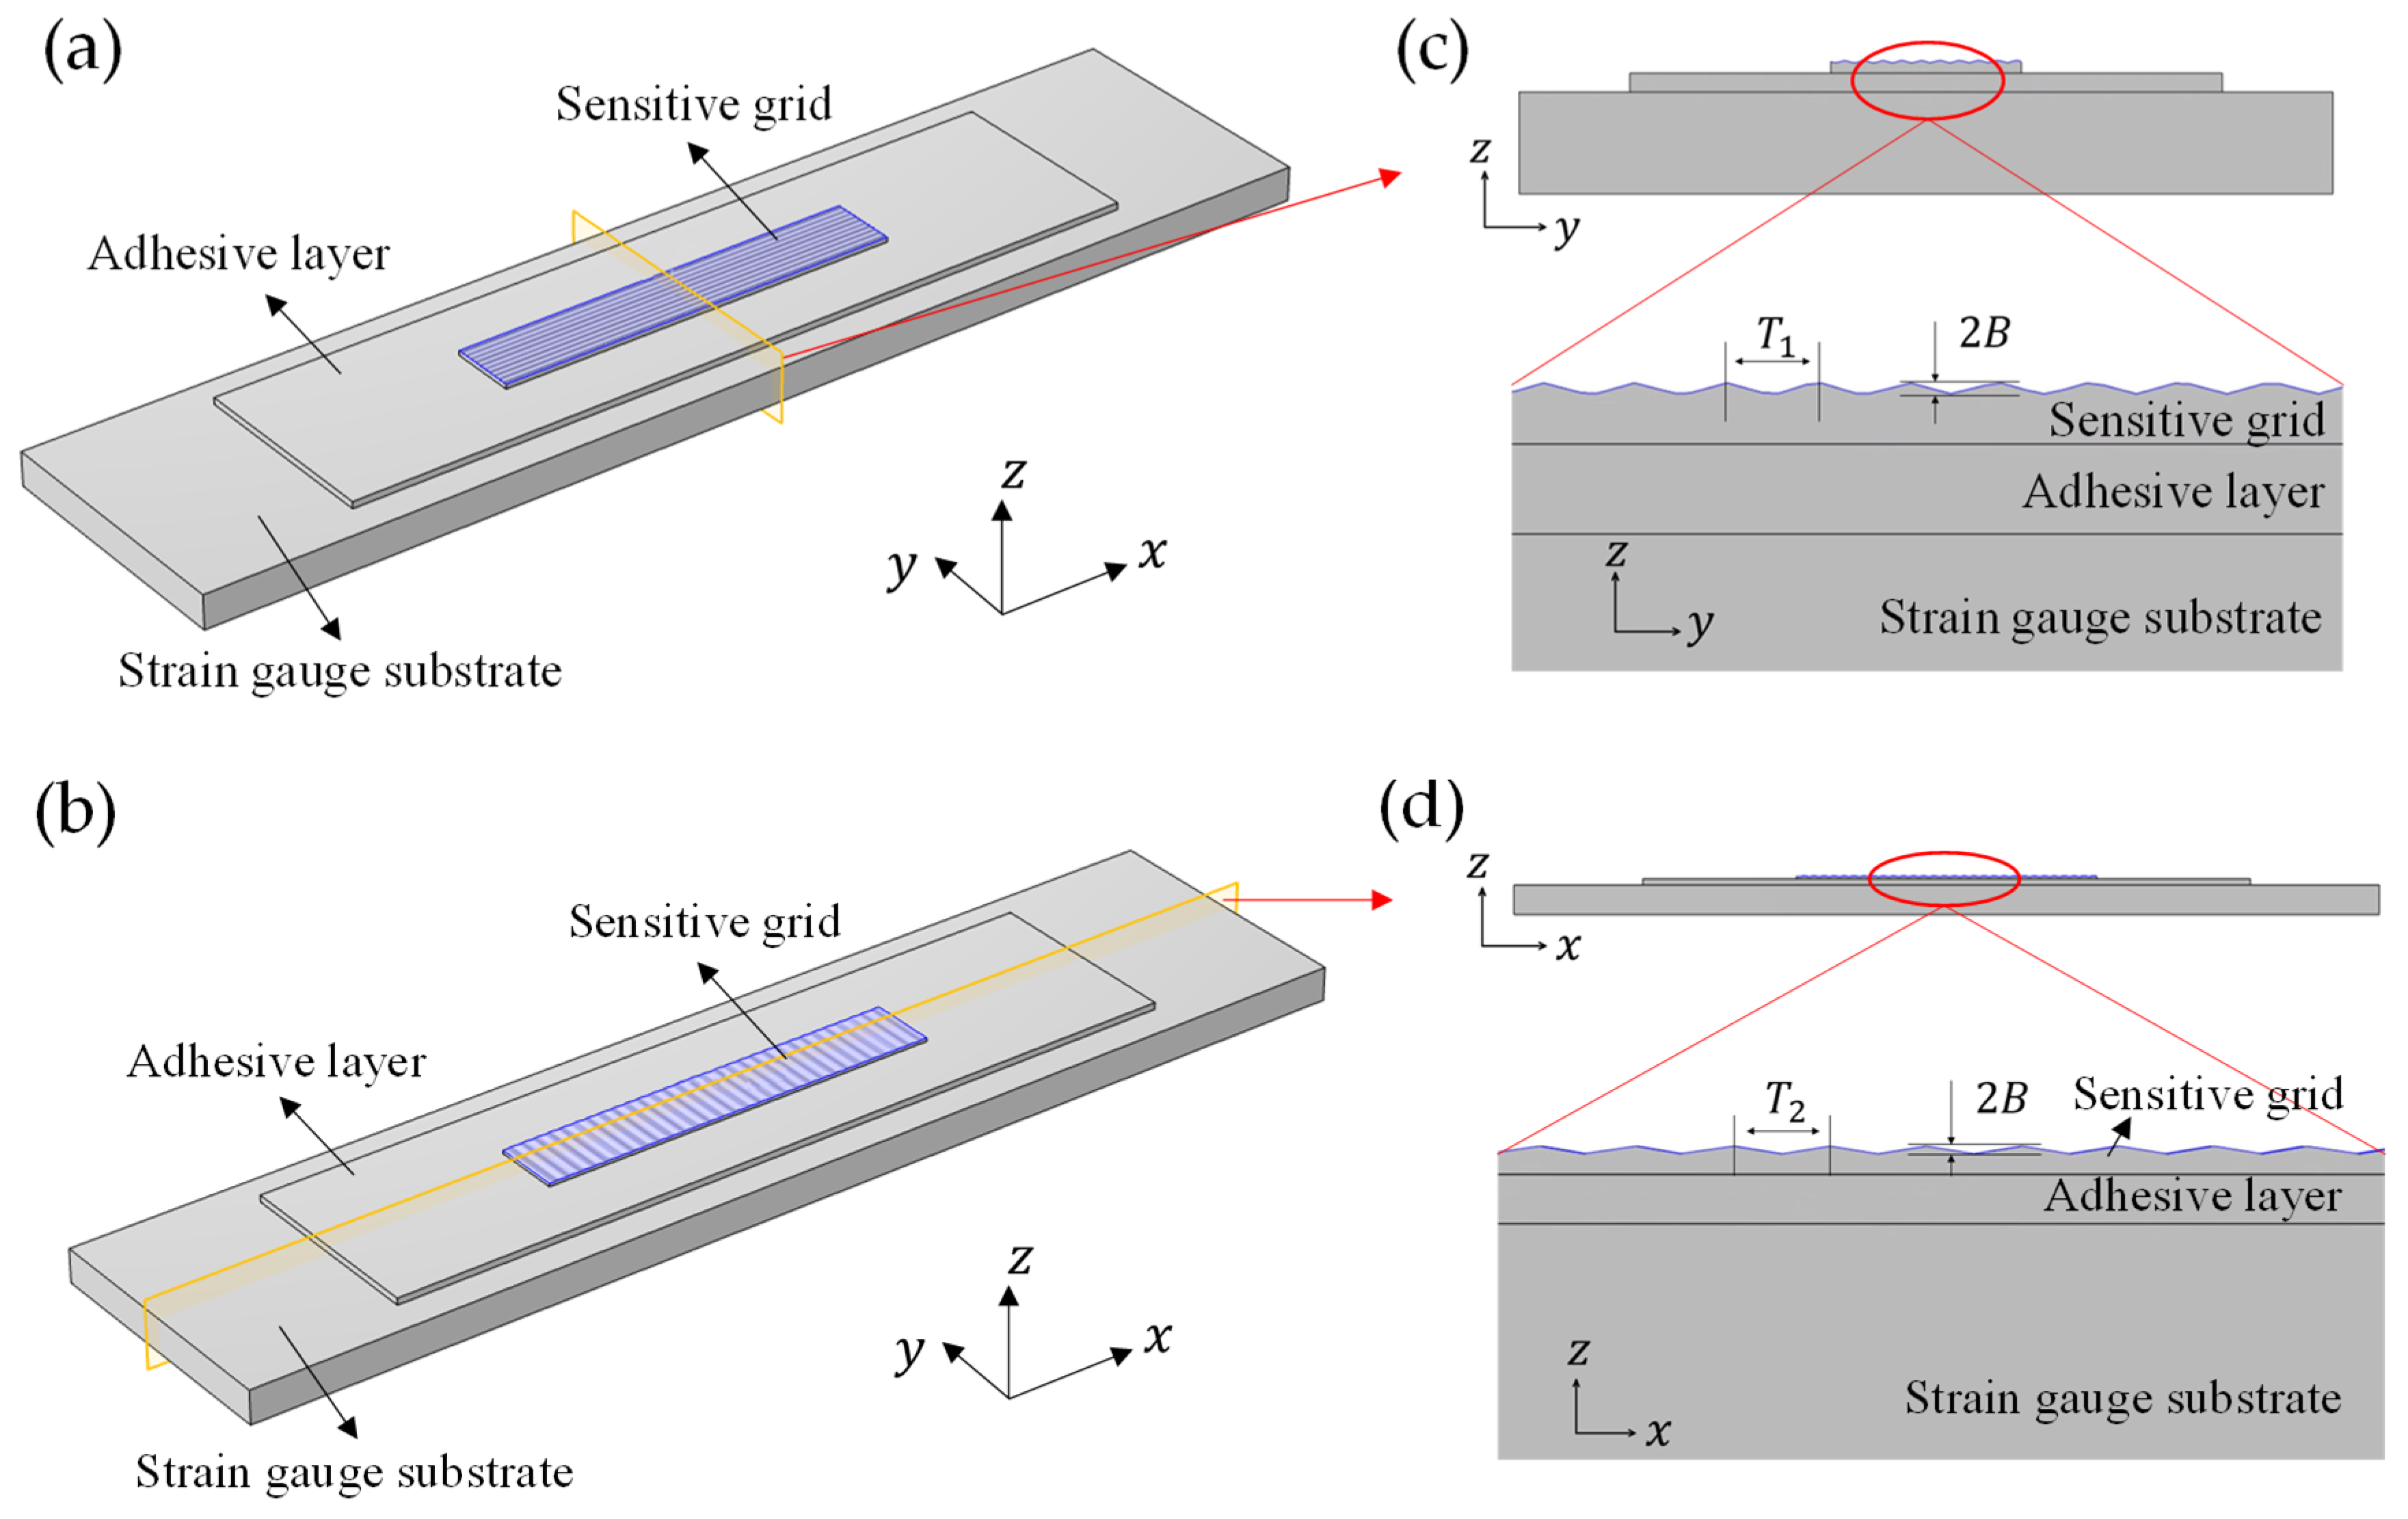
2. Observation and Analysis Procedures
3. Results and Discussion
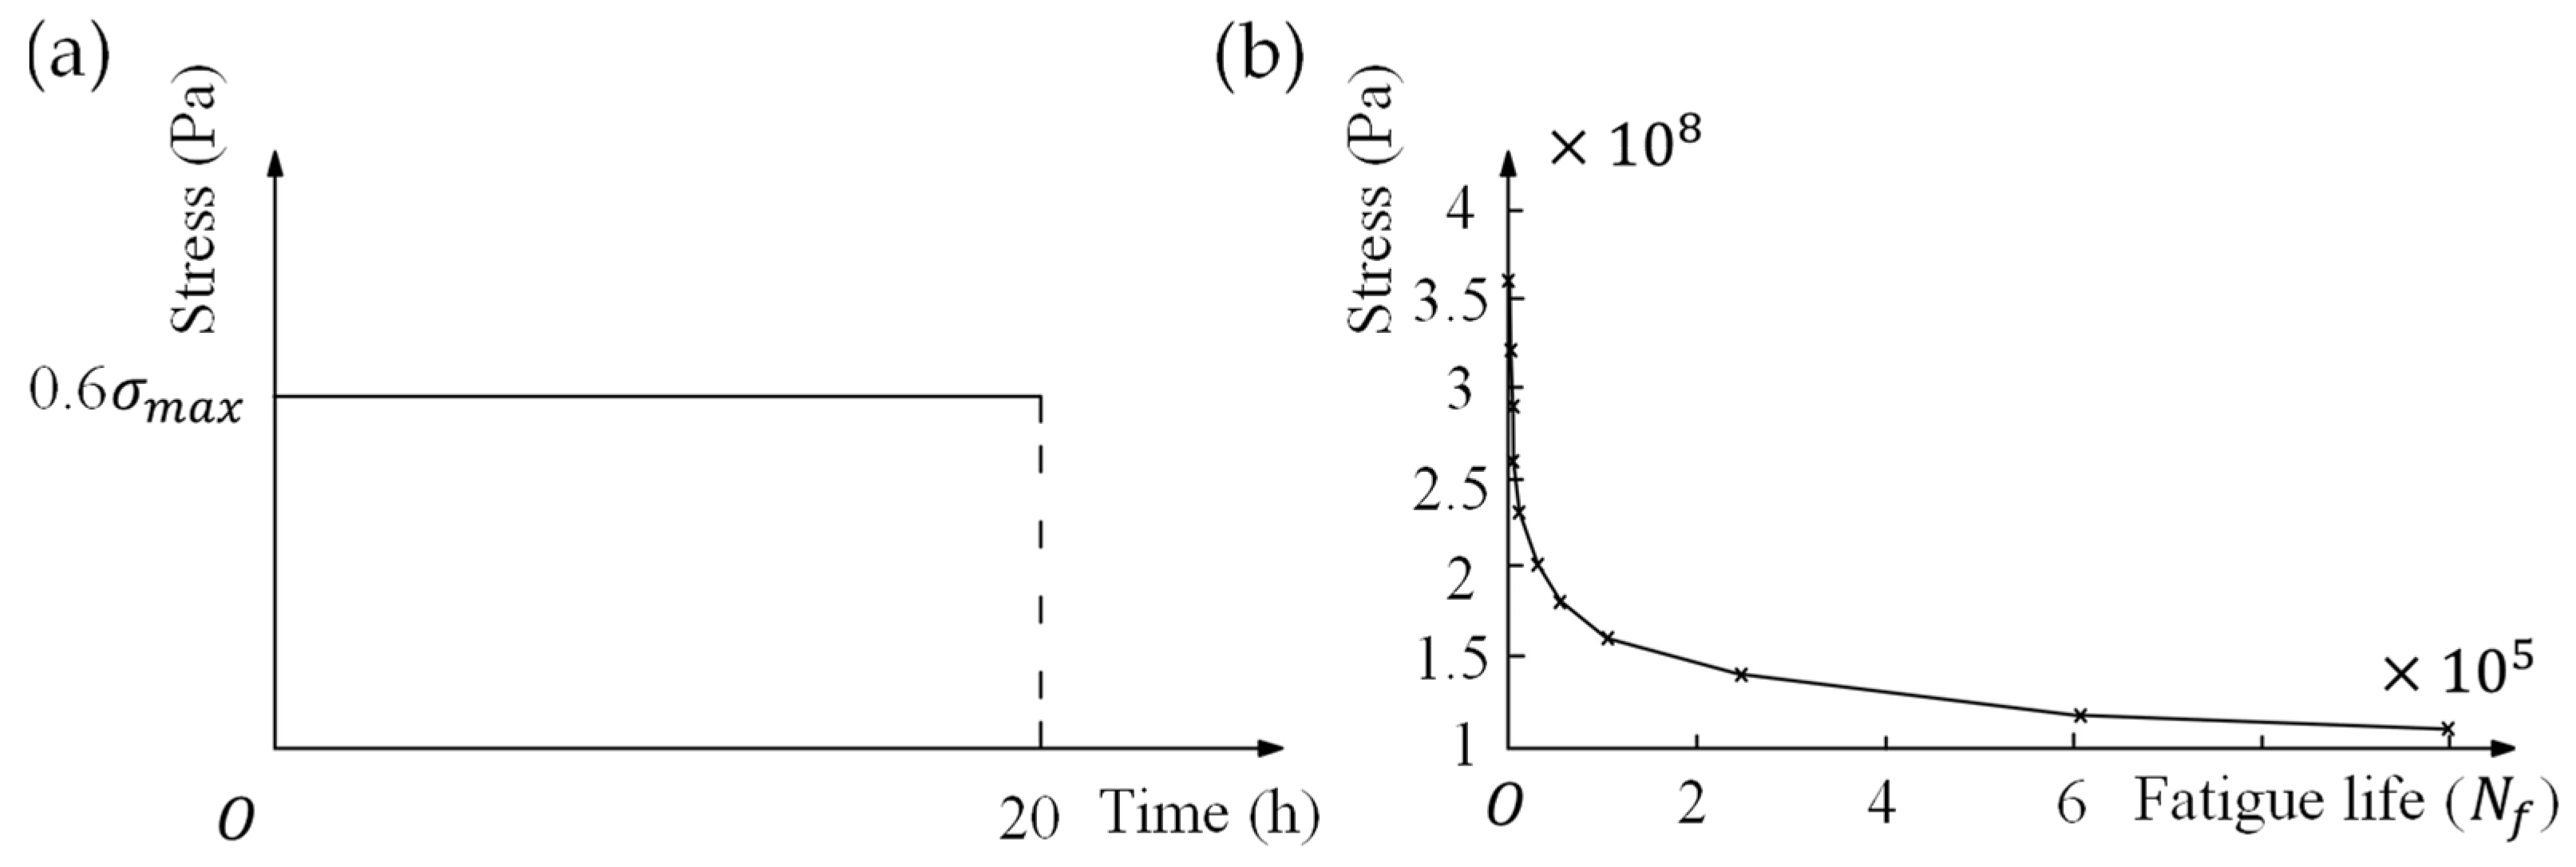
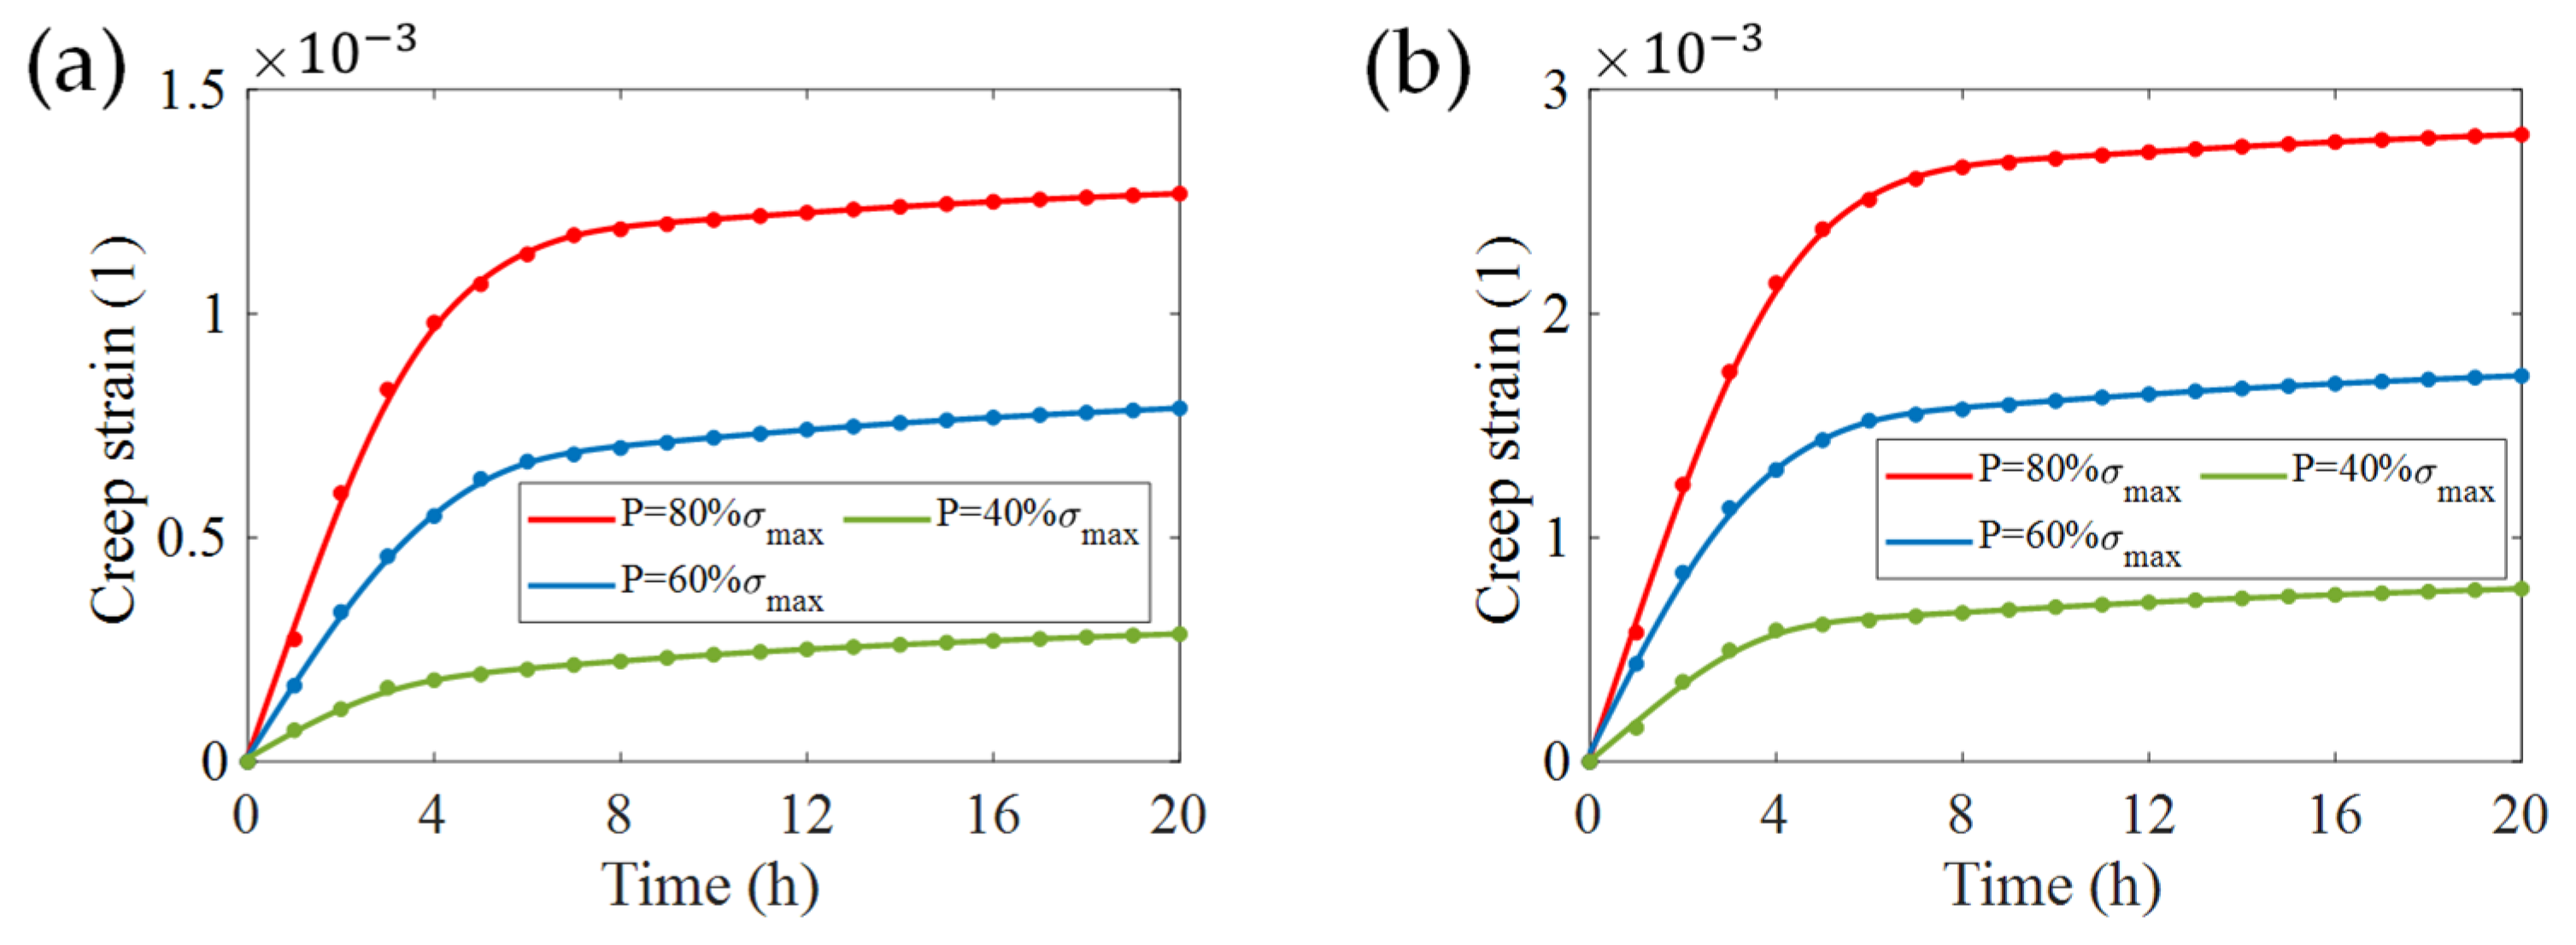
3.1. Creep Strain
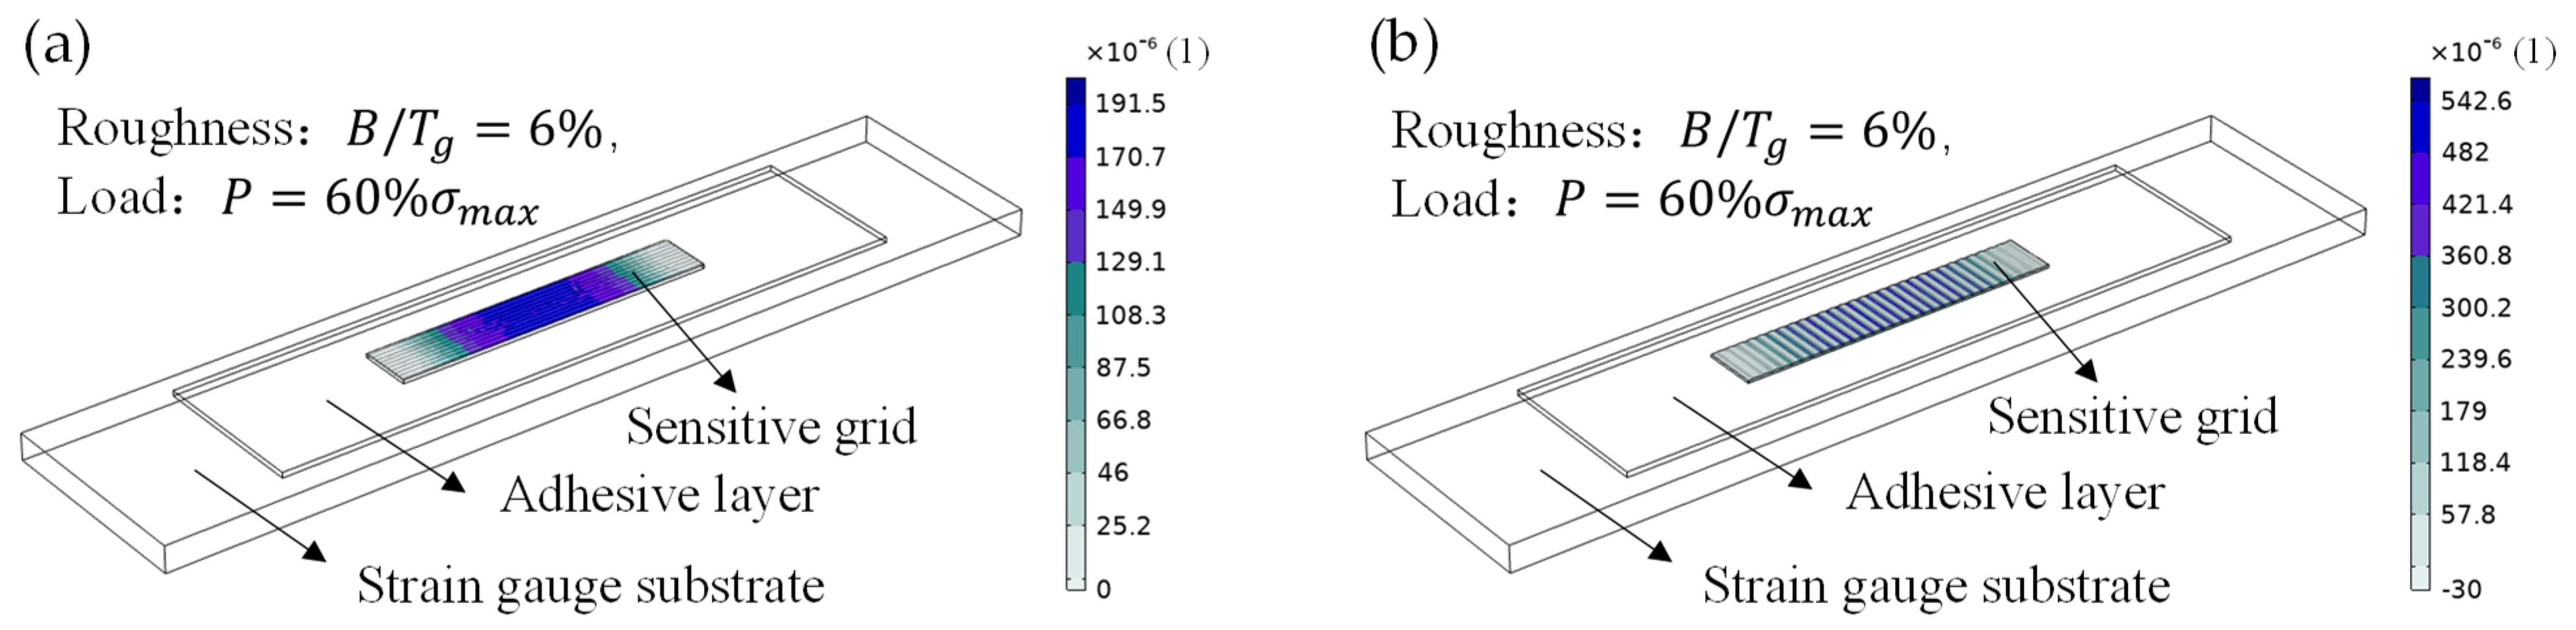
3.2. Fatigue Life
4. Conclusions
Supplementary Materials
Author Contributions
Funding
Data Availability Statement
Conflicts of Interest
References
- Yin, F. Principle of Metallic Foil Strain Gauge Manufacturing Techniques; National Defense Industry Press: Beijing, China, 2011. (In Chinese) [Google Scholar]
- Abot, J.L.; Góngora-Rubio, M.R.; Anike, J.C.; Kiyono, C.Y.; Mello, L.A.M.; Cardoso, V.F.; Rosa, R.L.S.; Kuebler, D.A.; Brodeur, G.E.; Alotaibi, A.H.; et al. Foil strain gauges using piezoresistive carbon nanotube yarn: Fabrication and calibration. Sensors 2018, 18, 464. [Google Scholar] [CrossRef] [PubMed] [Green Version]
- Strozzi, A.; Baldini, A.; Giacopini, M.; Bertocchi, E.; Bertocchi, L. Normalization of the stress concentrations at the rounded edges of a shaft–hub interference fit. J. Strain Anal. Eng. Des. 2011, 46, 478–491. [Google Scholar] [CrossRef]
- Zhou, C.H.; Schadler, L.S.; Beyerlein, I.J. Stress concentrations in graphite/epoxy model composites during creep at room temperature and elevated temperatures. J. Compos. Mater. 2004, 38, 417–433. [Google Scholar] [CrossRef]
- Bellett, D.; Taylor, D.; Marco, S.; Mazzeo, E.; Guillois, J.; Pircher, T. The fatigue behaviour of three-dimensional stress concentrations. Int. J. Fatigue 2005, 27, 207–221. [Google Scholar] [CrossRef]
- Haque, M.S.; Stewart, C.M. Finite-element analysis of waspaloy using sinh creep-damage constitutive model under triaxial stress state. J. Press. Vessel. Technol. 2016, 138, 031408. [Google Scholar] [CrossRef]
- Luo, Y.; Jiang, W.; Zhang, W.; Zhang, Y.C.; Woo, W.; Tu, S.T. Notch effect on creep damage for hastelloy C276-BNi2 brazing joint. Mater. Des. 2015, 84, 212–222. [Google Scholar] [CrossRef]
- Yadollahi, A.; Mahtabi, M.J.; Khalili, A.; Doude, H.R.; Newman, J.C., Jr. Fatigue life prediction of additively manufactured material: Effects of surface roughness, defect size, and shape. Fatigue Fract. Eng. Mater. Struct. 2018, 41, 1602–1614. [Google Scholar] [CrossRef]
- Majzoobi, G.H.; Daemi, N. The effects of notch geometry on fatigue life using notch sensitivity factor. Trans. Indian Inst. Met. 2010, 63, 547–552. [Google Scholar] [CrossRef]
- Song, R.; Ai, Y.; Li, C.; Wang, C.; Zhang, Y. Effect of sensitive grid structure on fatigue performance of strain gauge. J. Binzhou Univ. 2020, 36, 16–23. (In Chinese) [Google Scholar]
- Shu, D. Mechanical Properties of Engineering Materials; China Machine Press: Beijing, China, 2016. (In Chinese) [Google Scholar]
- Moradi, M.; Sivoththaman, S. Strain transfer analysis of surface-bonded MEMS strain sensors. IEEE Sens. J. 2012, 13, 637–643. [Google Scholar] [CrossRef]
- HBM Strain Gauges. Available online: https://www.hbm.com/0014/strain-gauges/ (accessed on 10 December 2021).
- AVIC Electric Measuring Instrument Co., Ltd. Available online: http://www.zemic.com.cn/ (accessed on 10 December 2021).
- El-Nahass, M.M.; Zeyada, H.M.; Aziz, M.S.; El-Ghamaz, N.A. Optical properties of thermally evaporated SnS thin films. Opt. Mater. 2002, 20, 159–170. [Google Scholar] [CrossRef]
- Sanchez-Juarez, A.; Tiburcio-Silver, A.; Ortiz, A. Fabrication of SnS2/SnS heterojunction thin film diodes by plasma-enhanced chemical vapor deposition. Thin Solid Films 2005, 480, 452–456. [Google Scholar] [CrossRef]
- COMSOL Official. Available online: http://cn.comsol.com/model/primary-creep-under-nonconstant-load-12399 (accessed on 15 December 2021).
- Hou, S. Life Evaluation Model of Stress Fatigue for Metals. Ph.D. Thesis, Shanghai Jiao Tong University, Shanghai, China, 2016. (In Chinese). [Google Scholar]
- Dong, P.; Hong, J.K. The master SN curve approach to fatigue evaluation of offshore and marine structures. In Proceedings of the International Conference on Offshore Mechanics and Arctic Engineering, Vancouver, BC, Canada, 20–25 June 2004; Volume 37440, pp. 847–855. [Google Scholar]
- Zhou, C.; Zheng, H.; Luo, H. Fatigue Application and Examples of Fatigue Analysis; Science Press: Beijing, China, 2005. (In Chinese) [Google Scholar]
- Zhao, J. Research on Theoretical Forming Limit Diagram of AA5083 Thin-Shell at Elevated Temperature; Yanshan University: Qinghuangdao, China, 2016. (In Chinese) [Google Scholar]
- Chen, C. Fatigue and Fracture; Huazhong University of Science & Technology Press: Wuhan, China, 2002. (In Chinese) [Google Scholar]
- Liu, C. Fatigue Simulation Analysis of Notched Specimen Based on Master S-N Curve; Dalian Jiaotong University: Dalian, China, 2014. (In Chinese) [Google Scholar]
- Dong, P.; Hong, J.K.; Osage, D.A. Master SN Curve Method for Fatigue Evaluation of Welded Components; Welding Research Council Bulletin: New York, NY, USA, 2002. [Google Scholar]


| Layer of Model | Material | Poisson’s Ratio | Young’s Modulus (Pa) |
|---|---|---|---|
| Sensitive grid | Constantan alloy | 0.329 | |
| Adhesive layer | Epoxy resin | 0.38 | |
| Strain gauge substrate | Polyimide | 0.272 |
| 300 | 600 | 850 | 50 | 150 | 200 | 5 | 5 | 25 |
| Creep Rate Coefficient C (1/h) | Stress Exponent n (MPa) | Time Hardening Exponent m |
|---|---|---|
| 3.125 × 10⁻¹⁴ | 1 | 0.5 |
Publisher’s Note: MDPI stays neutral with regard to jurisdictional claims in published maps and institutional affiliations. |
© 2022 by the authors. Licensee MDPI, Basel, Switzerland. This article is an open access article distributed under the terms and conditions of the Creative Commons Attribution (CC BY) license (https://creativecommons.org/licenses/by/4.0/).
Share and Cite
Zhao, Y.; Tan, S.; Zhang, C.; Liu, Y.; Wang, L.; Li, Y.; Hao, Q. Dependence of Creep Strain and Fatigue Behavior on Surface Characteristics of Resistive Strain Gauges. Micromachines 2022, 13, 379. https://doi.org/10.3390/mi13030379
Zhao Y, Tan S, Zhang C, Liu Y, Wang L, Li Y, Hao Q. Dependence of Creep Strain and Fatigue Behavior on Surface Characteristics of Resistive Strain Gauges. Micromachines. 2022; 13(3):379. https://doi.org/10.3390/mi13030379
Chicago/Turabian StyleZhao, Yinming, Siyang Tan, Chaofan Zhang, Yang Liu, Linglu Wang, Yongqian Li, and Qun Hao. 2022. "Dependence of Creep Strain and Fatigue Behavior on Surface Characteristics of Resistive Strain Gauges" Micromachines 13, no. 3: 379. https://doi.org/10.3390/mi13030379