
Fine-Tuning of Optical Resonance Wavelength of Surface-Micromachined Optical Ultrasound Transducer Arrays for Single-Wavelength Light Source Readout


Abstract
:1. Introduction
2. Methods
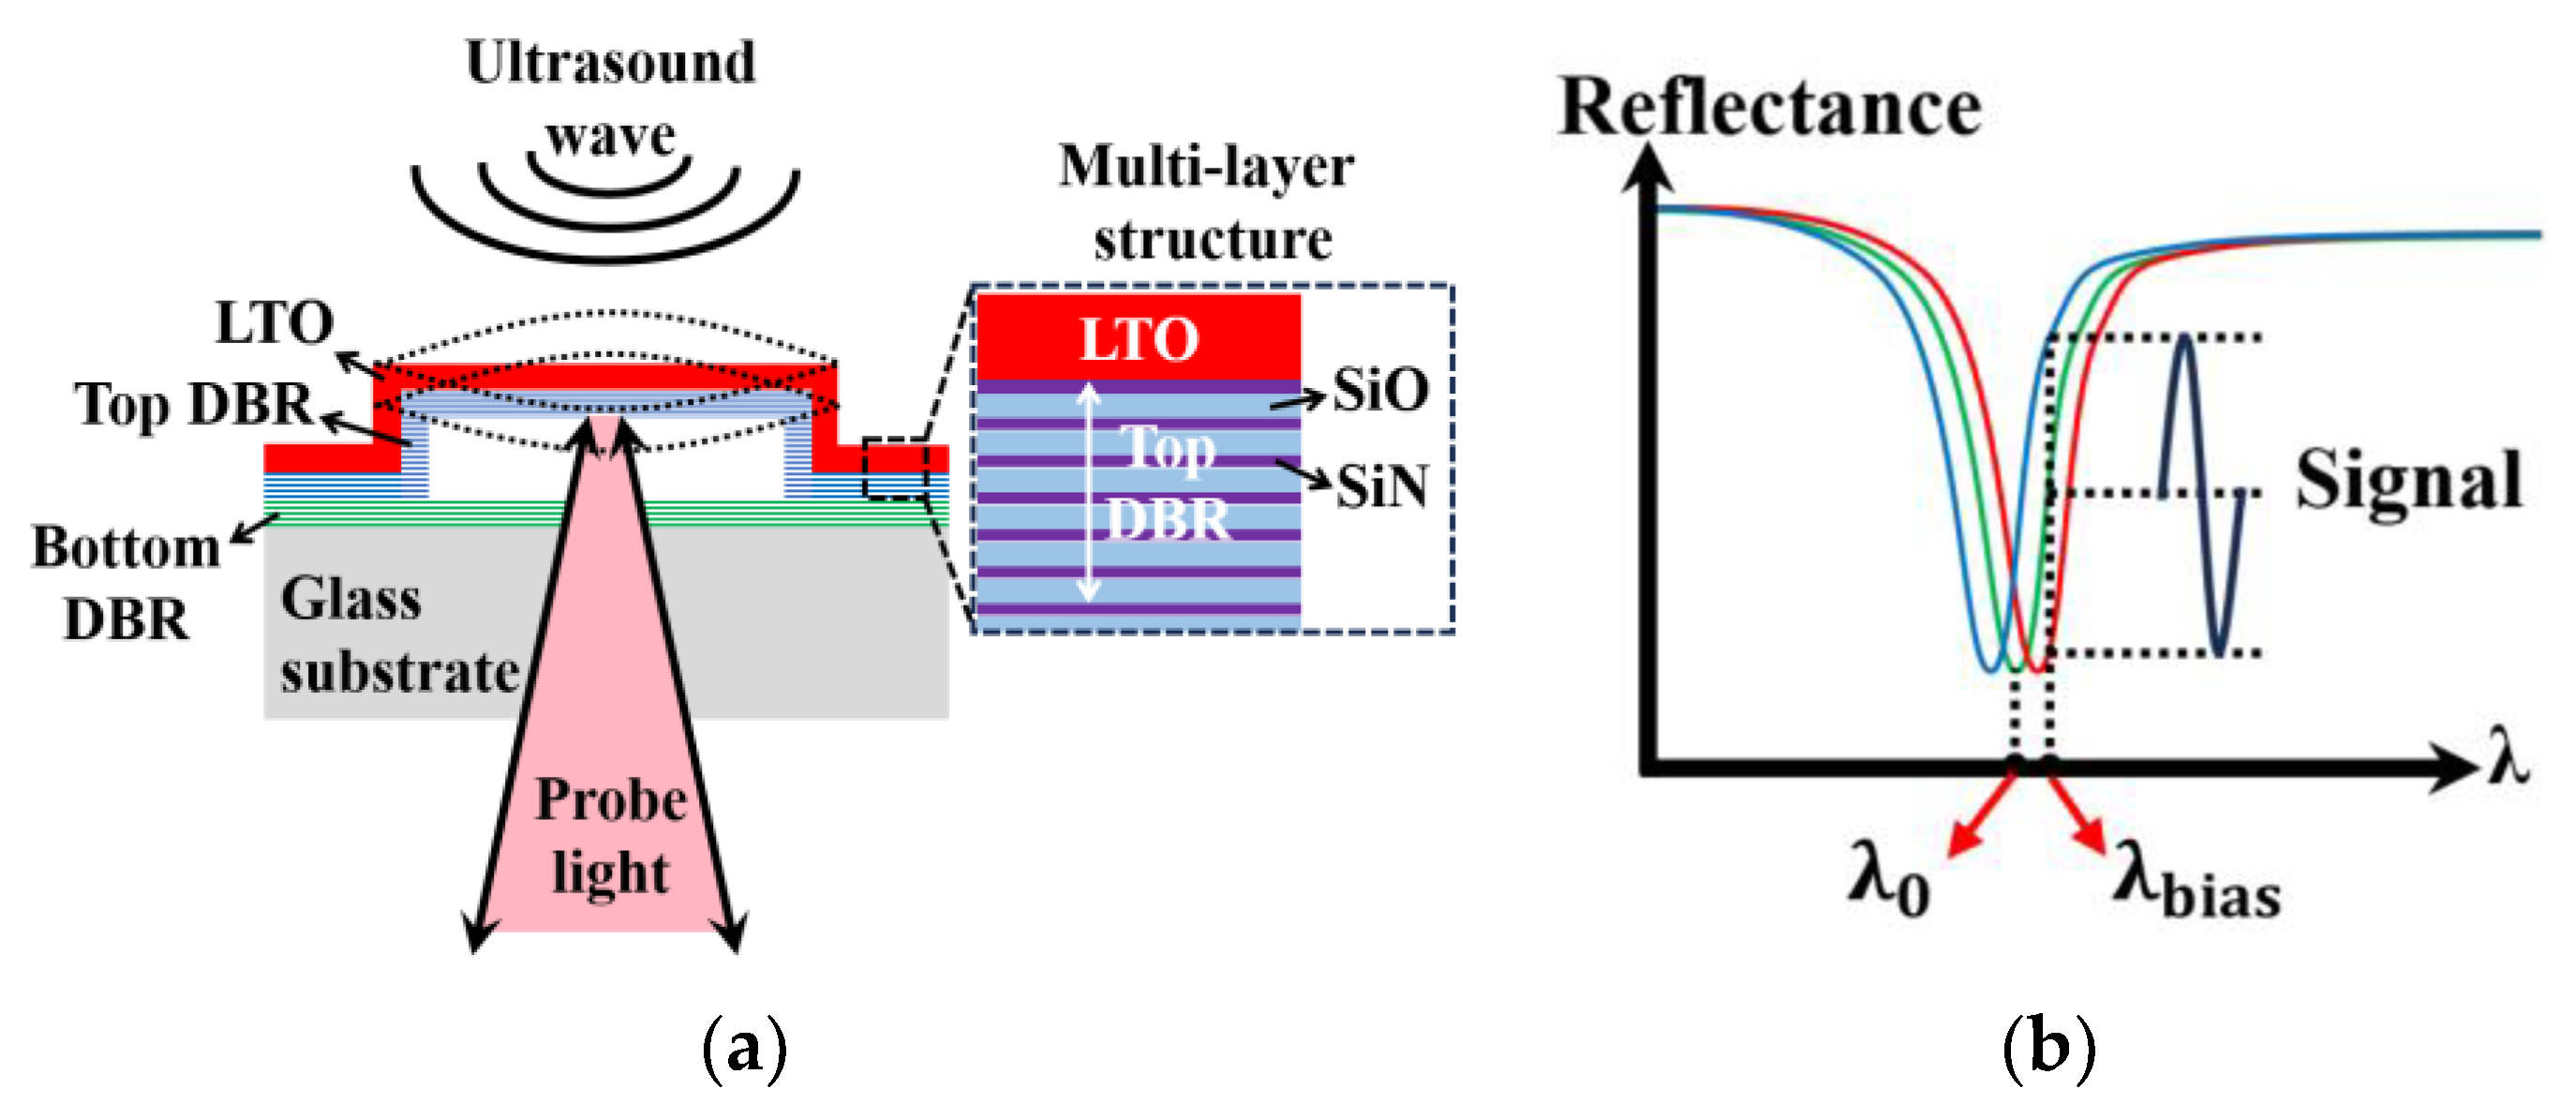
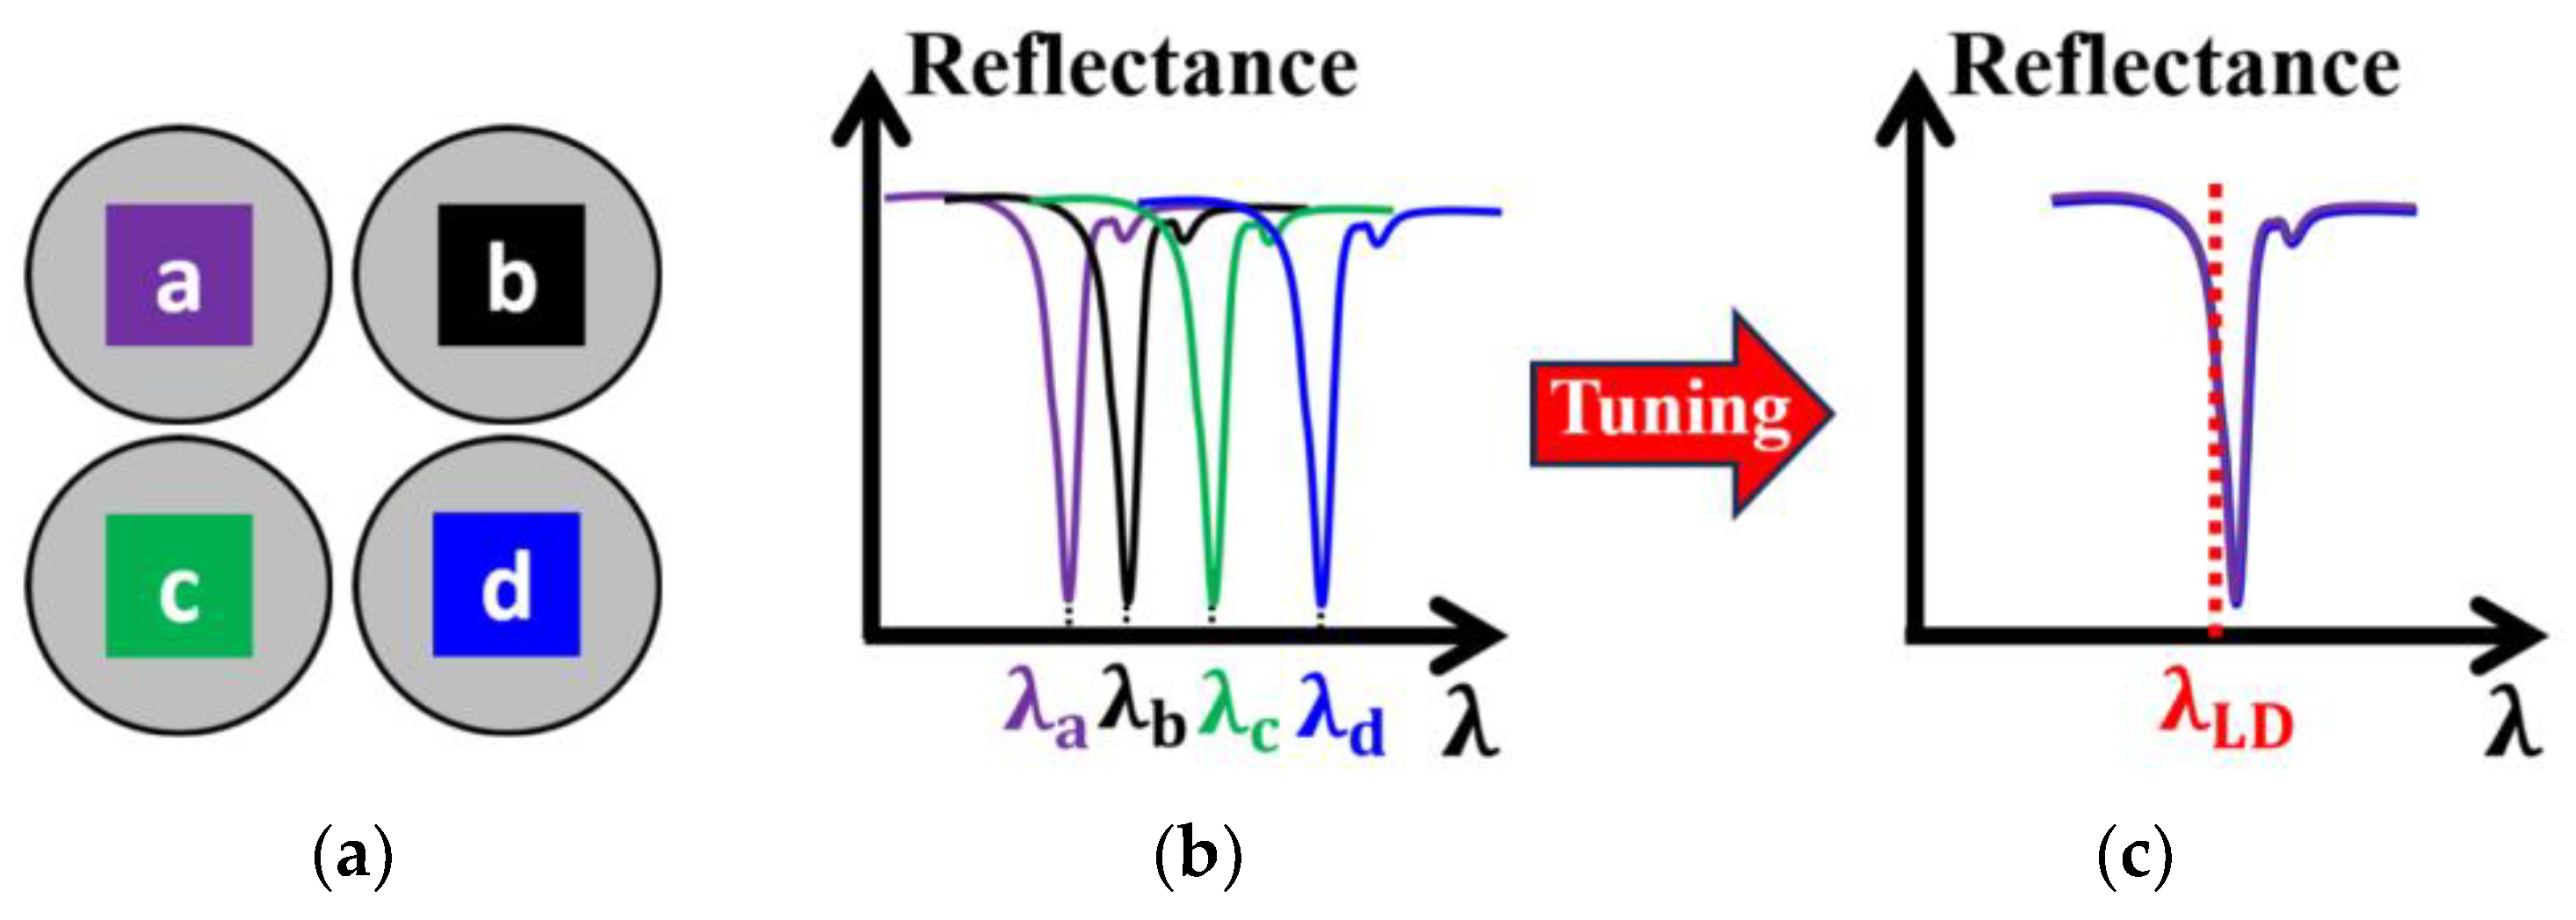
2.1. Tuning Mechanism
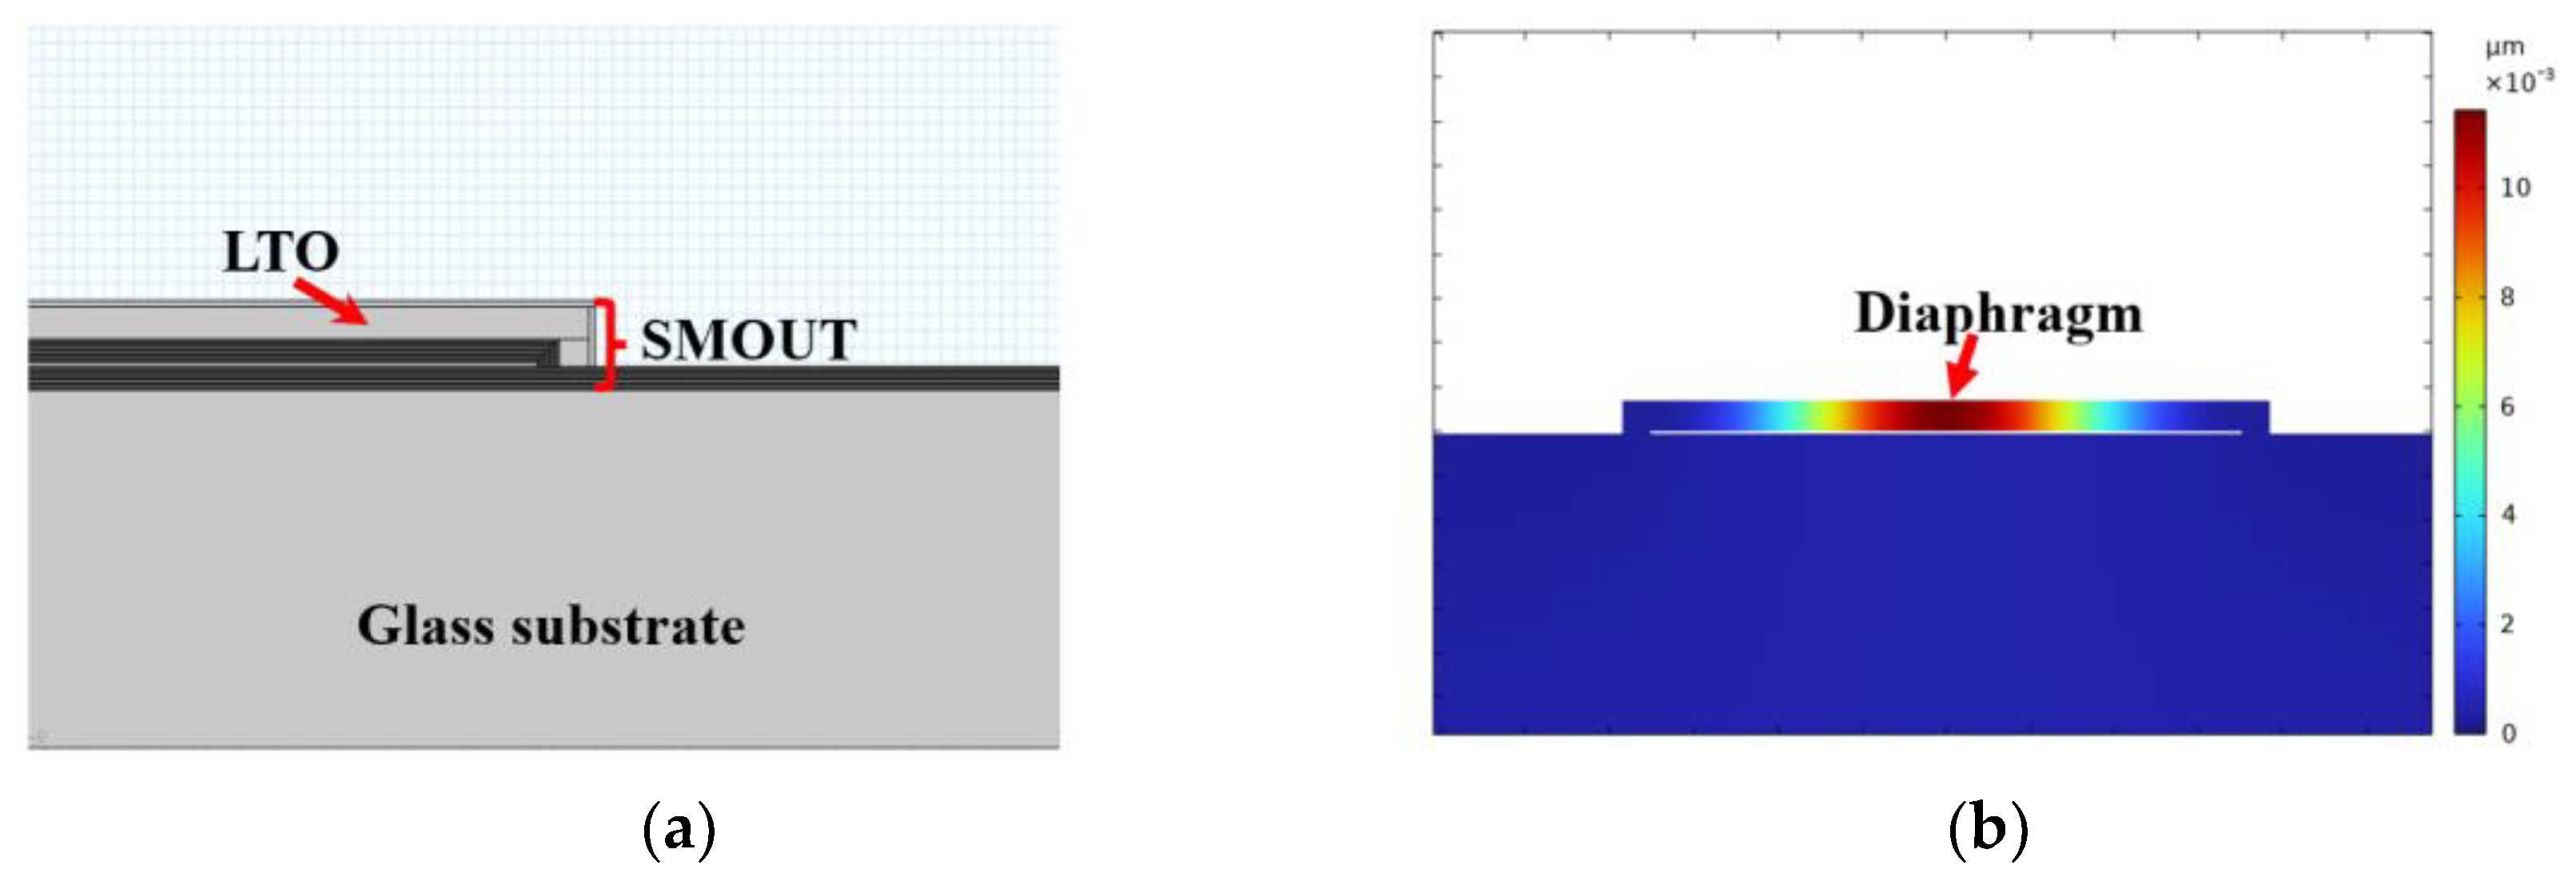
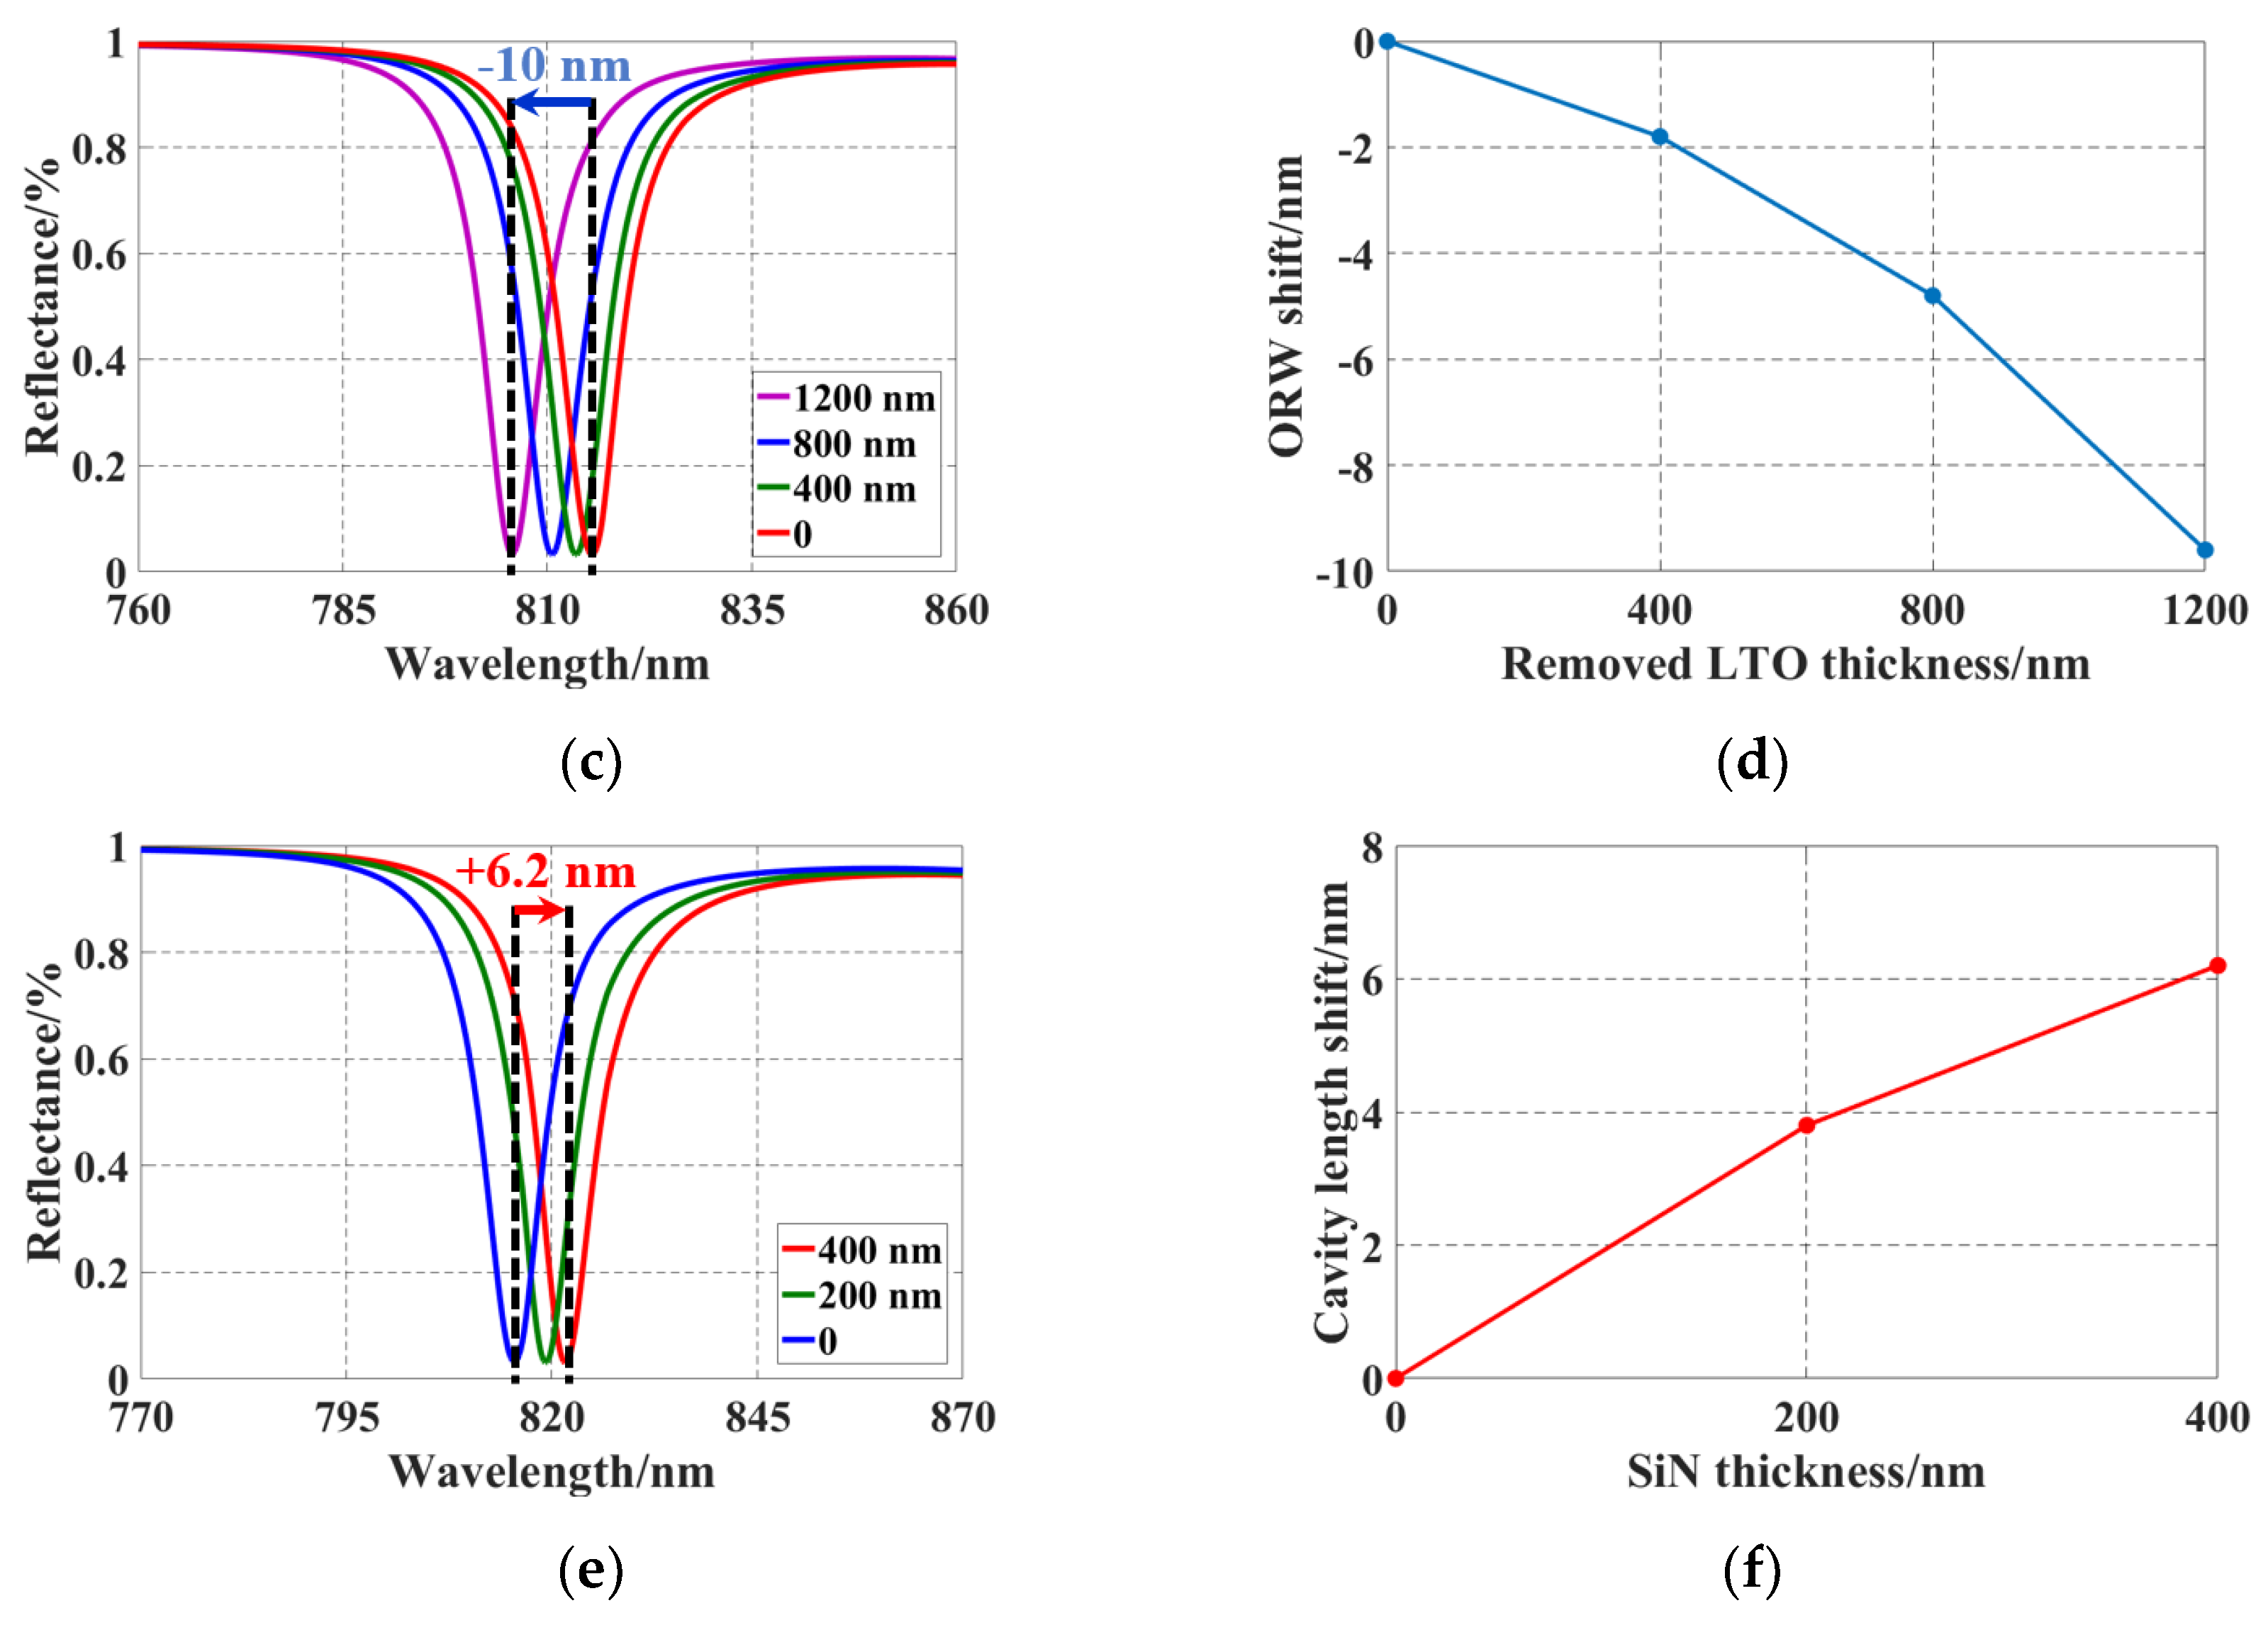
2.2. Simulation
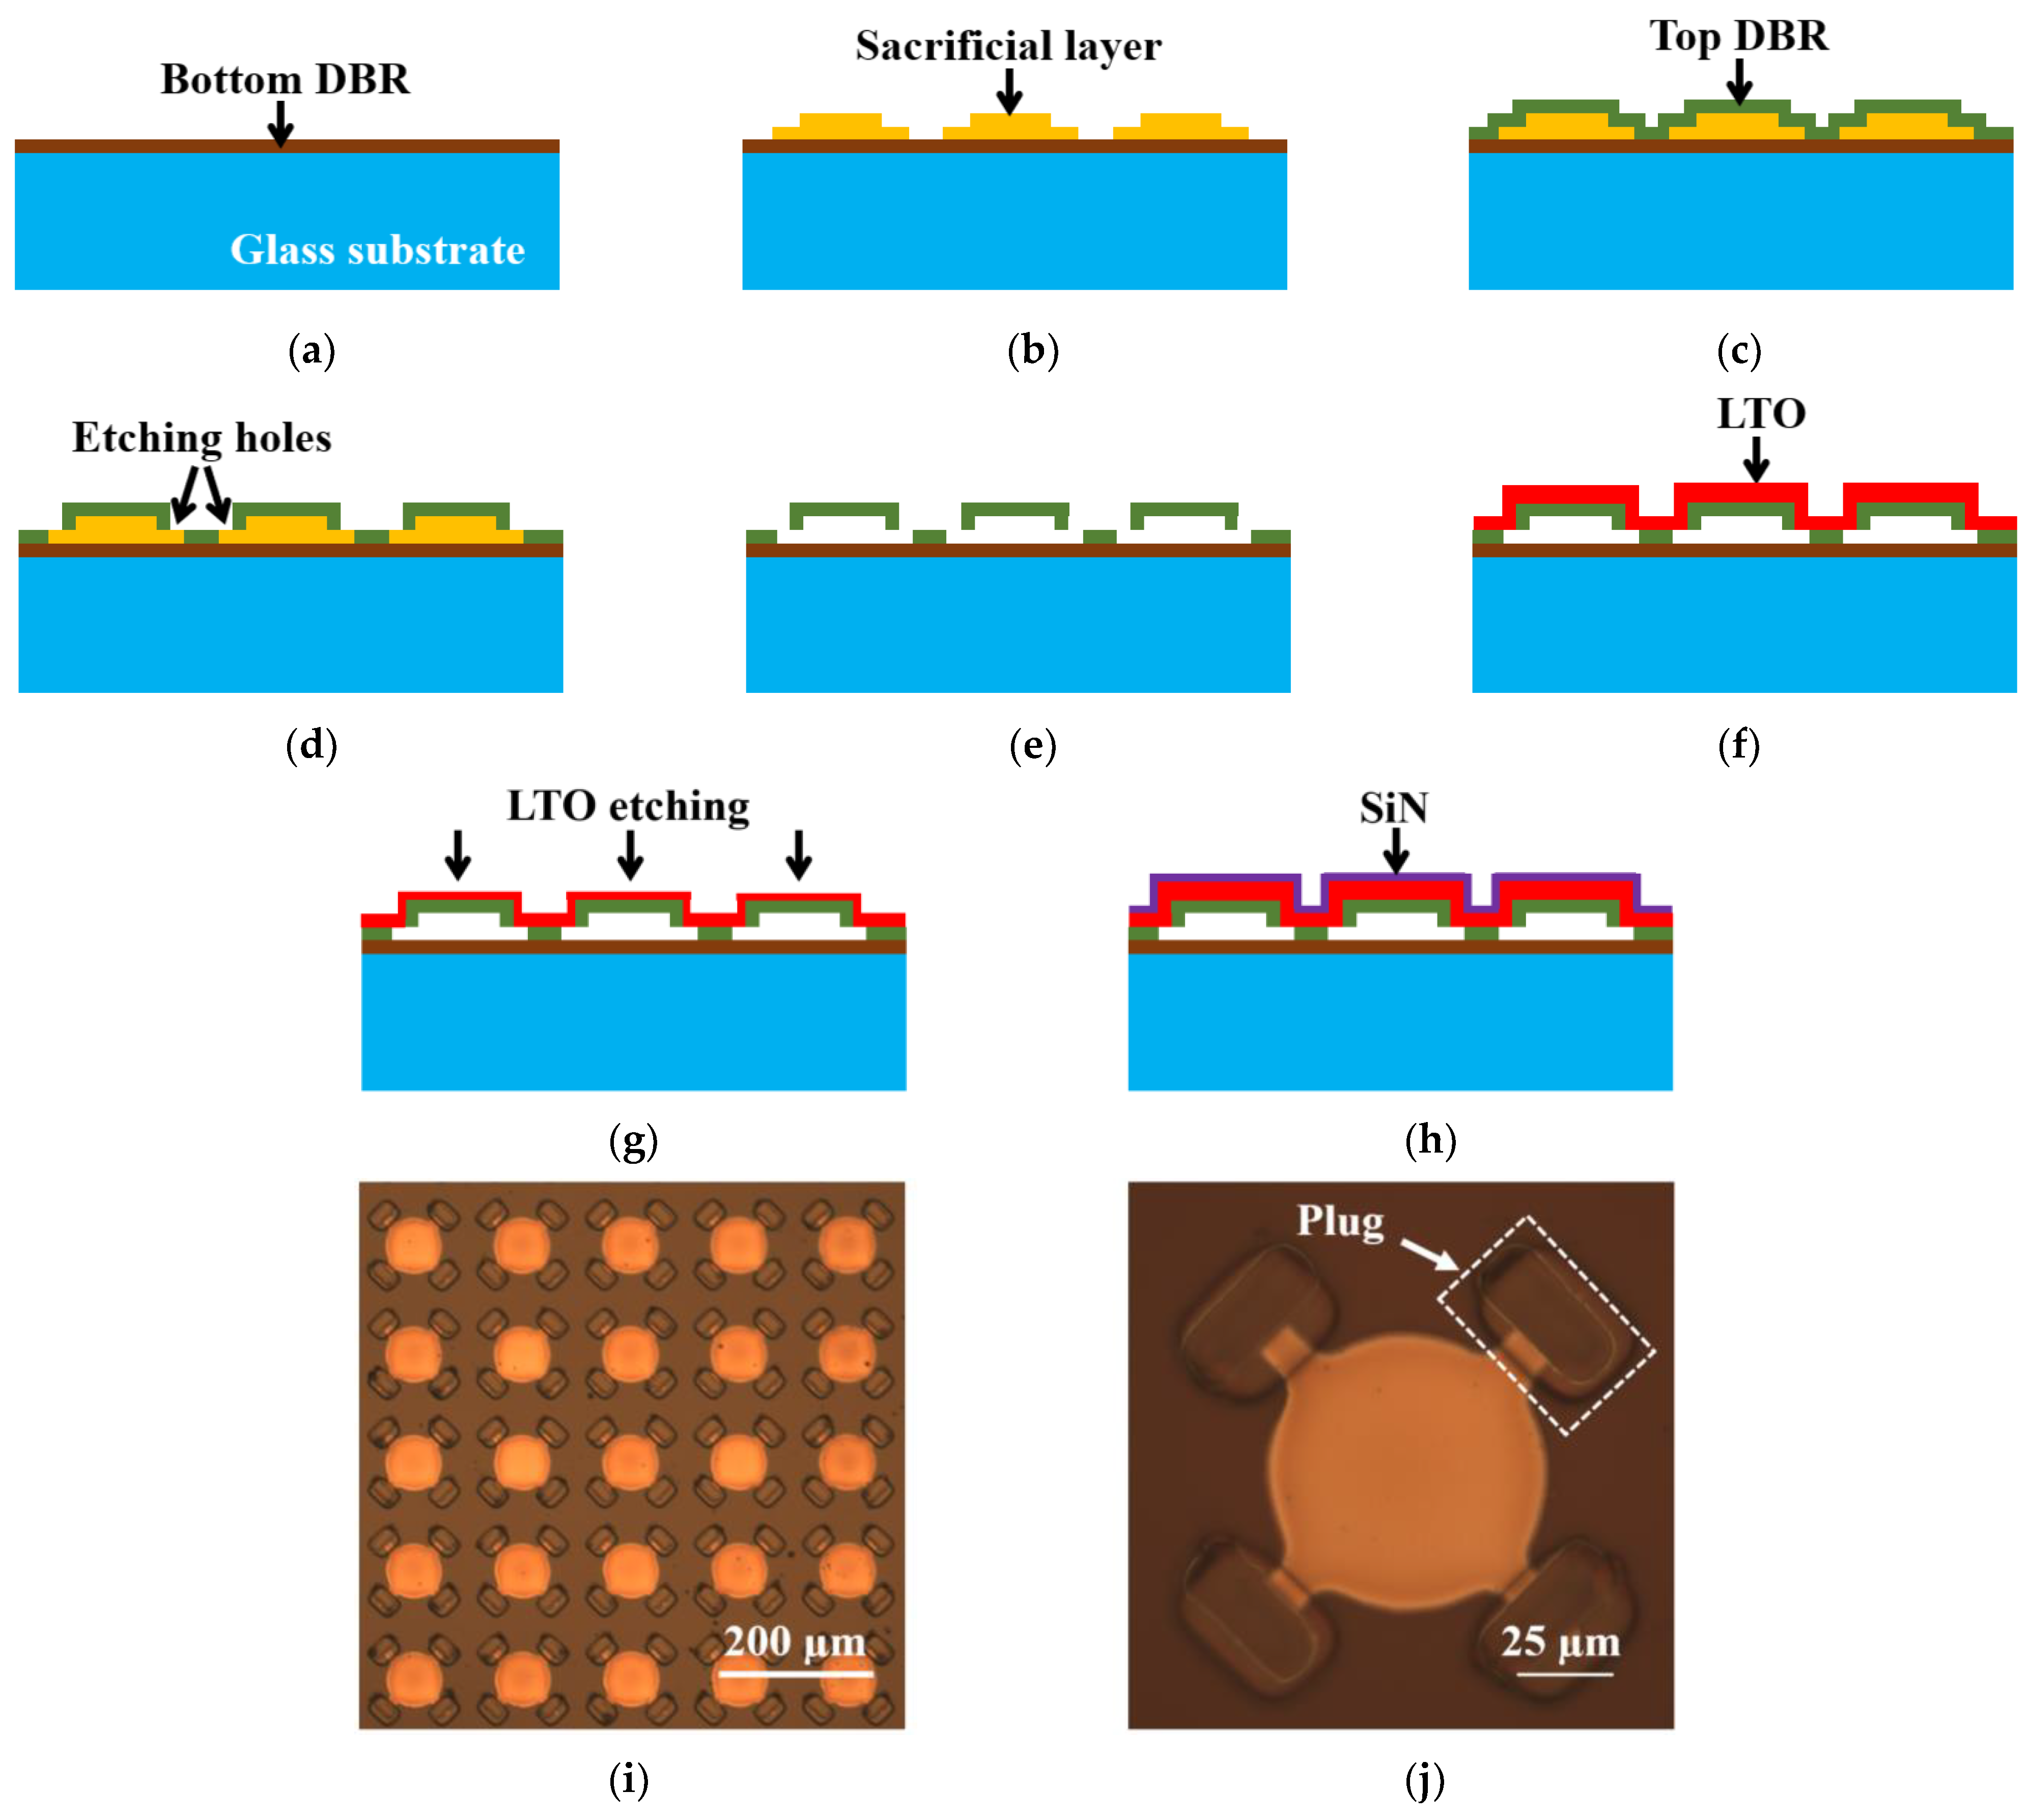
2.3. Fabrication and Tuning
3. Testing and Results
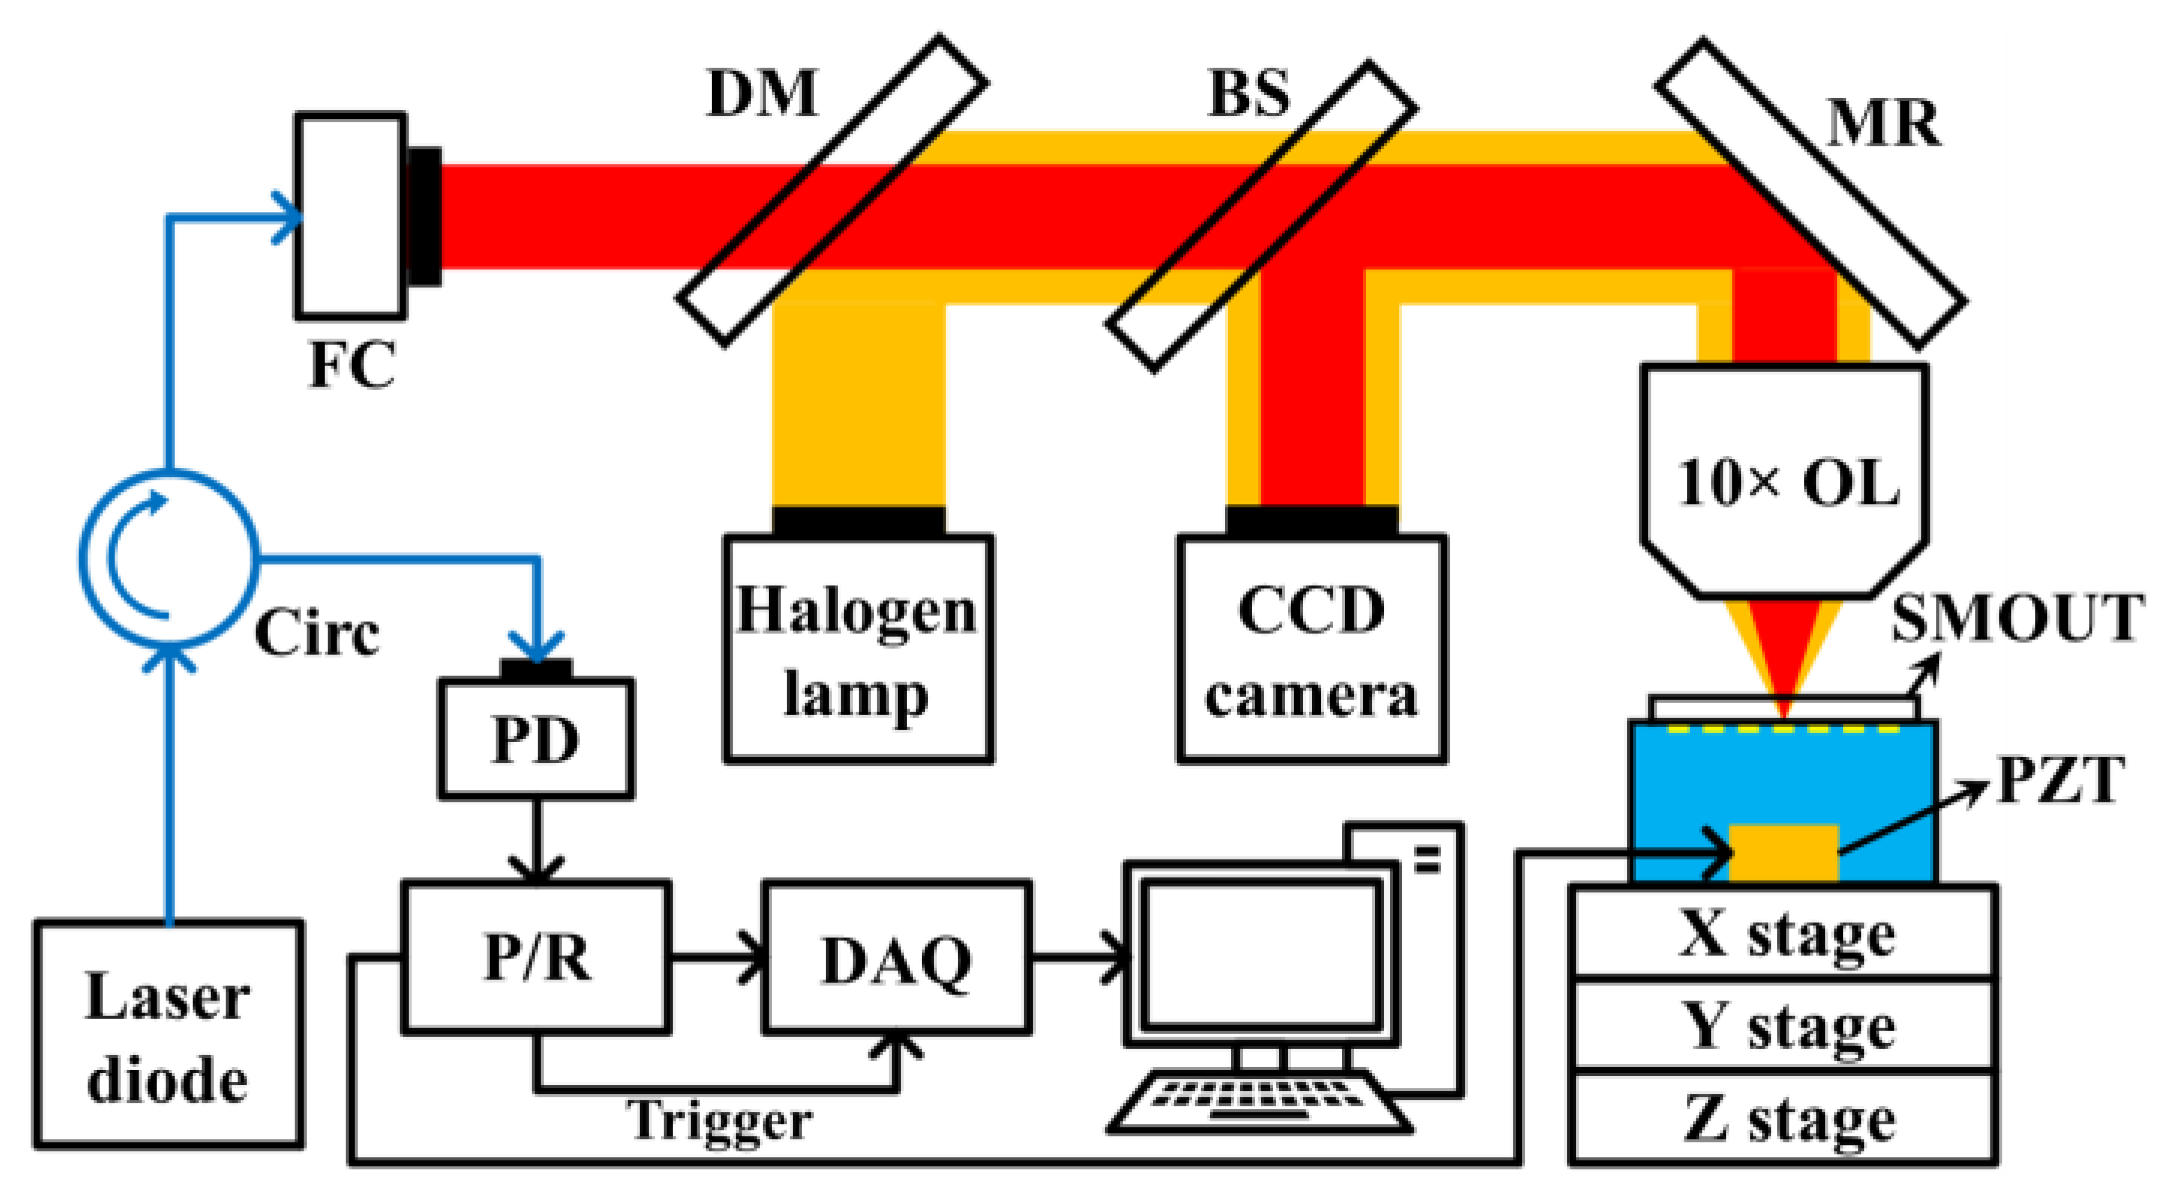
3.1. Testing Setup
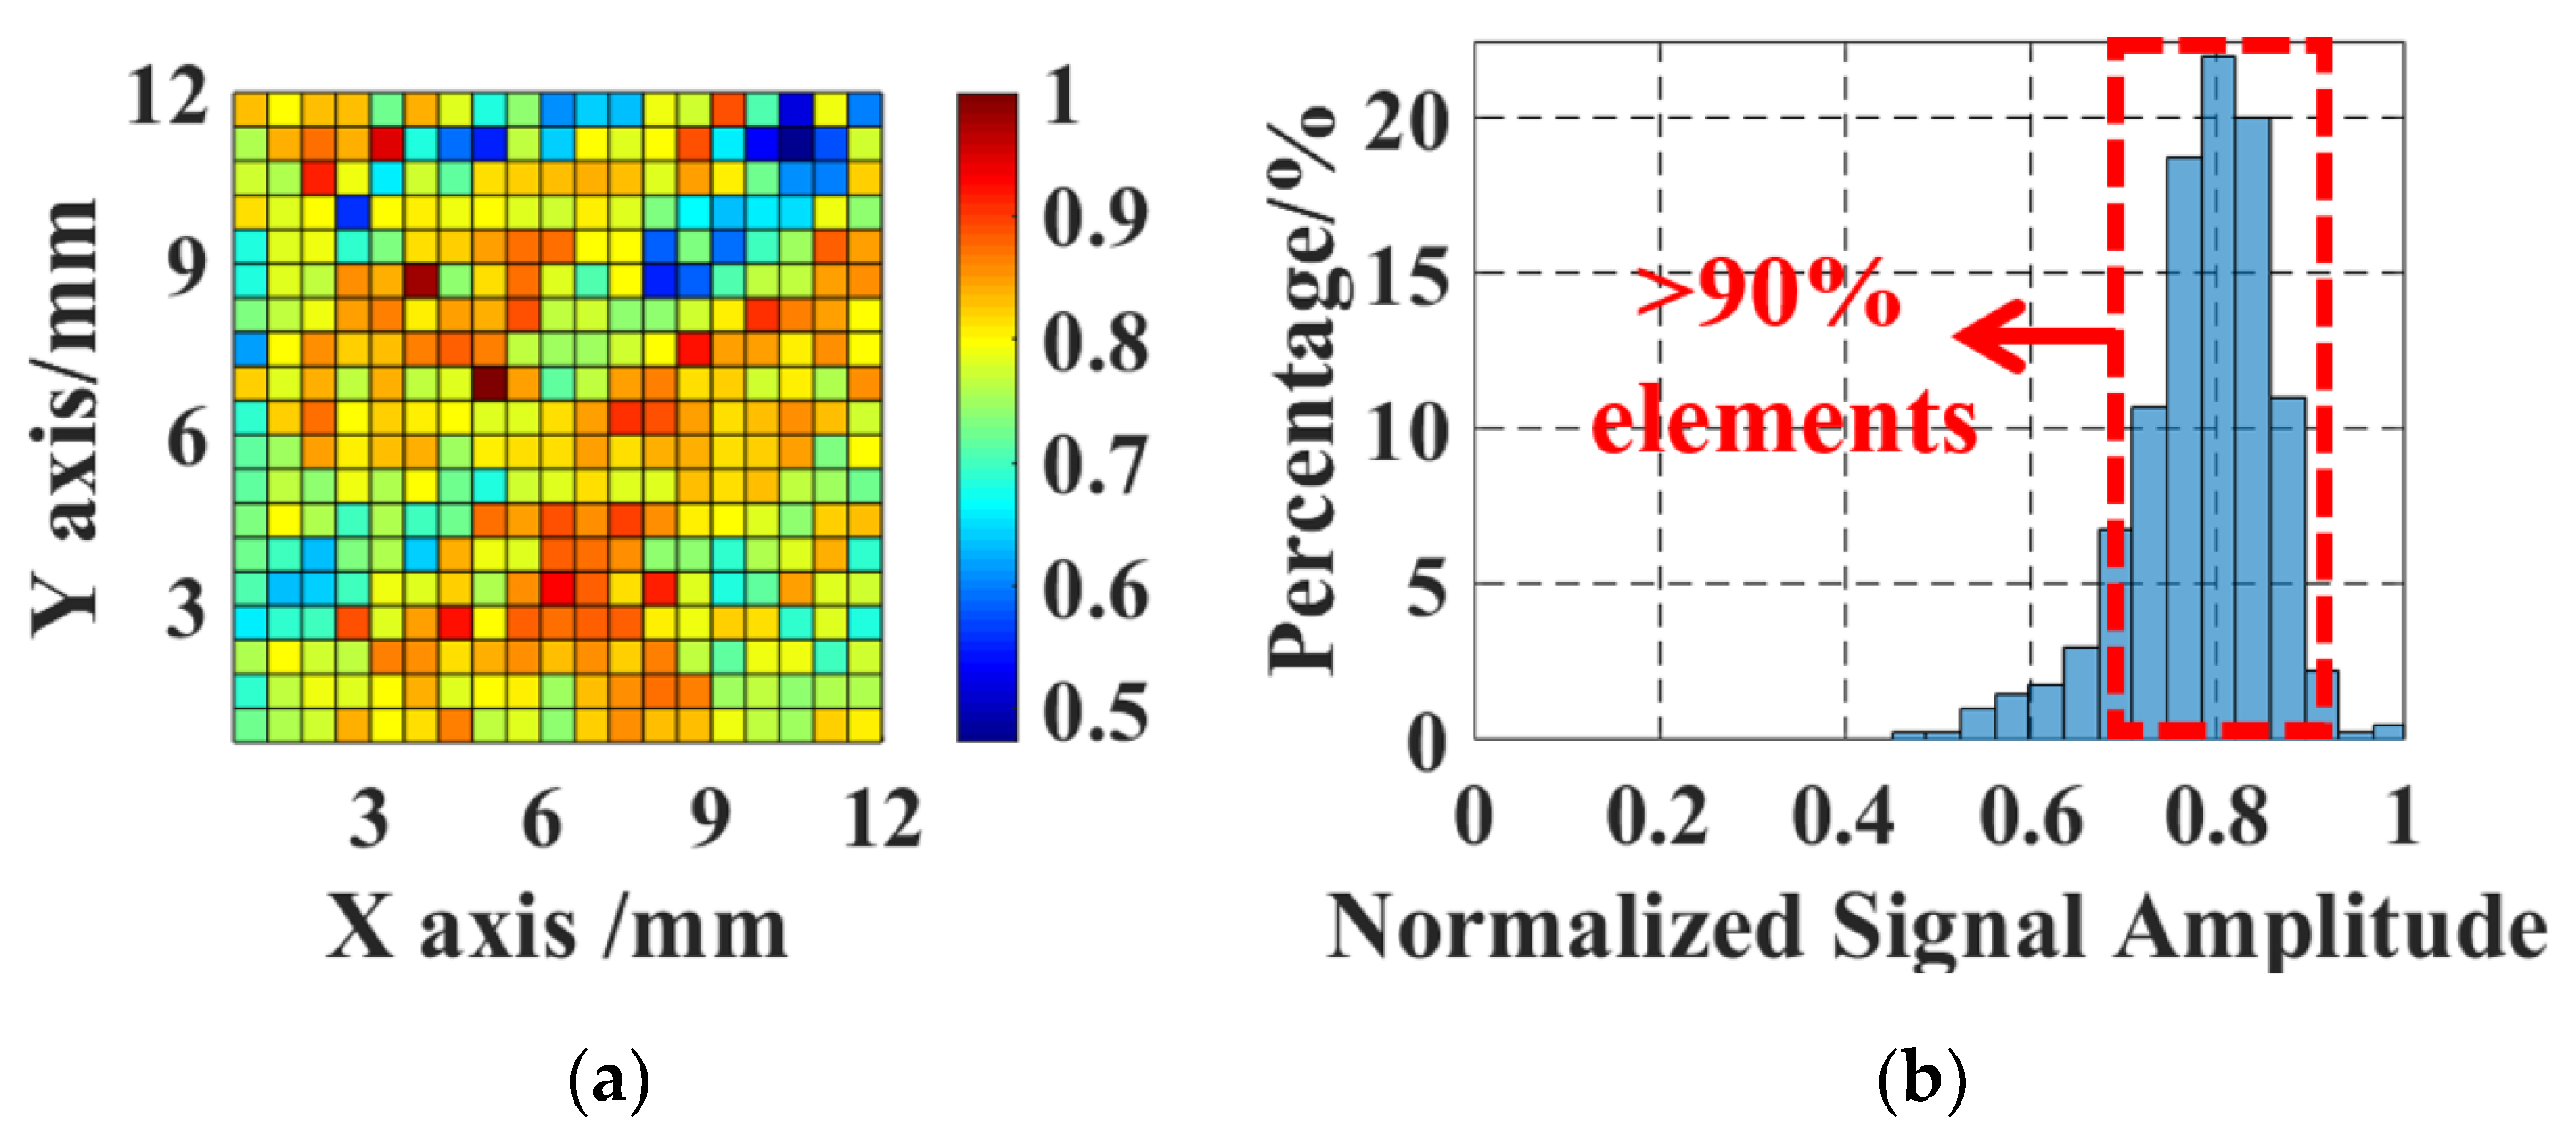
3.2. Uniformity
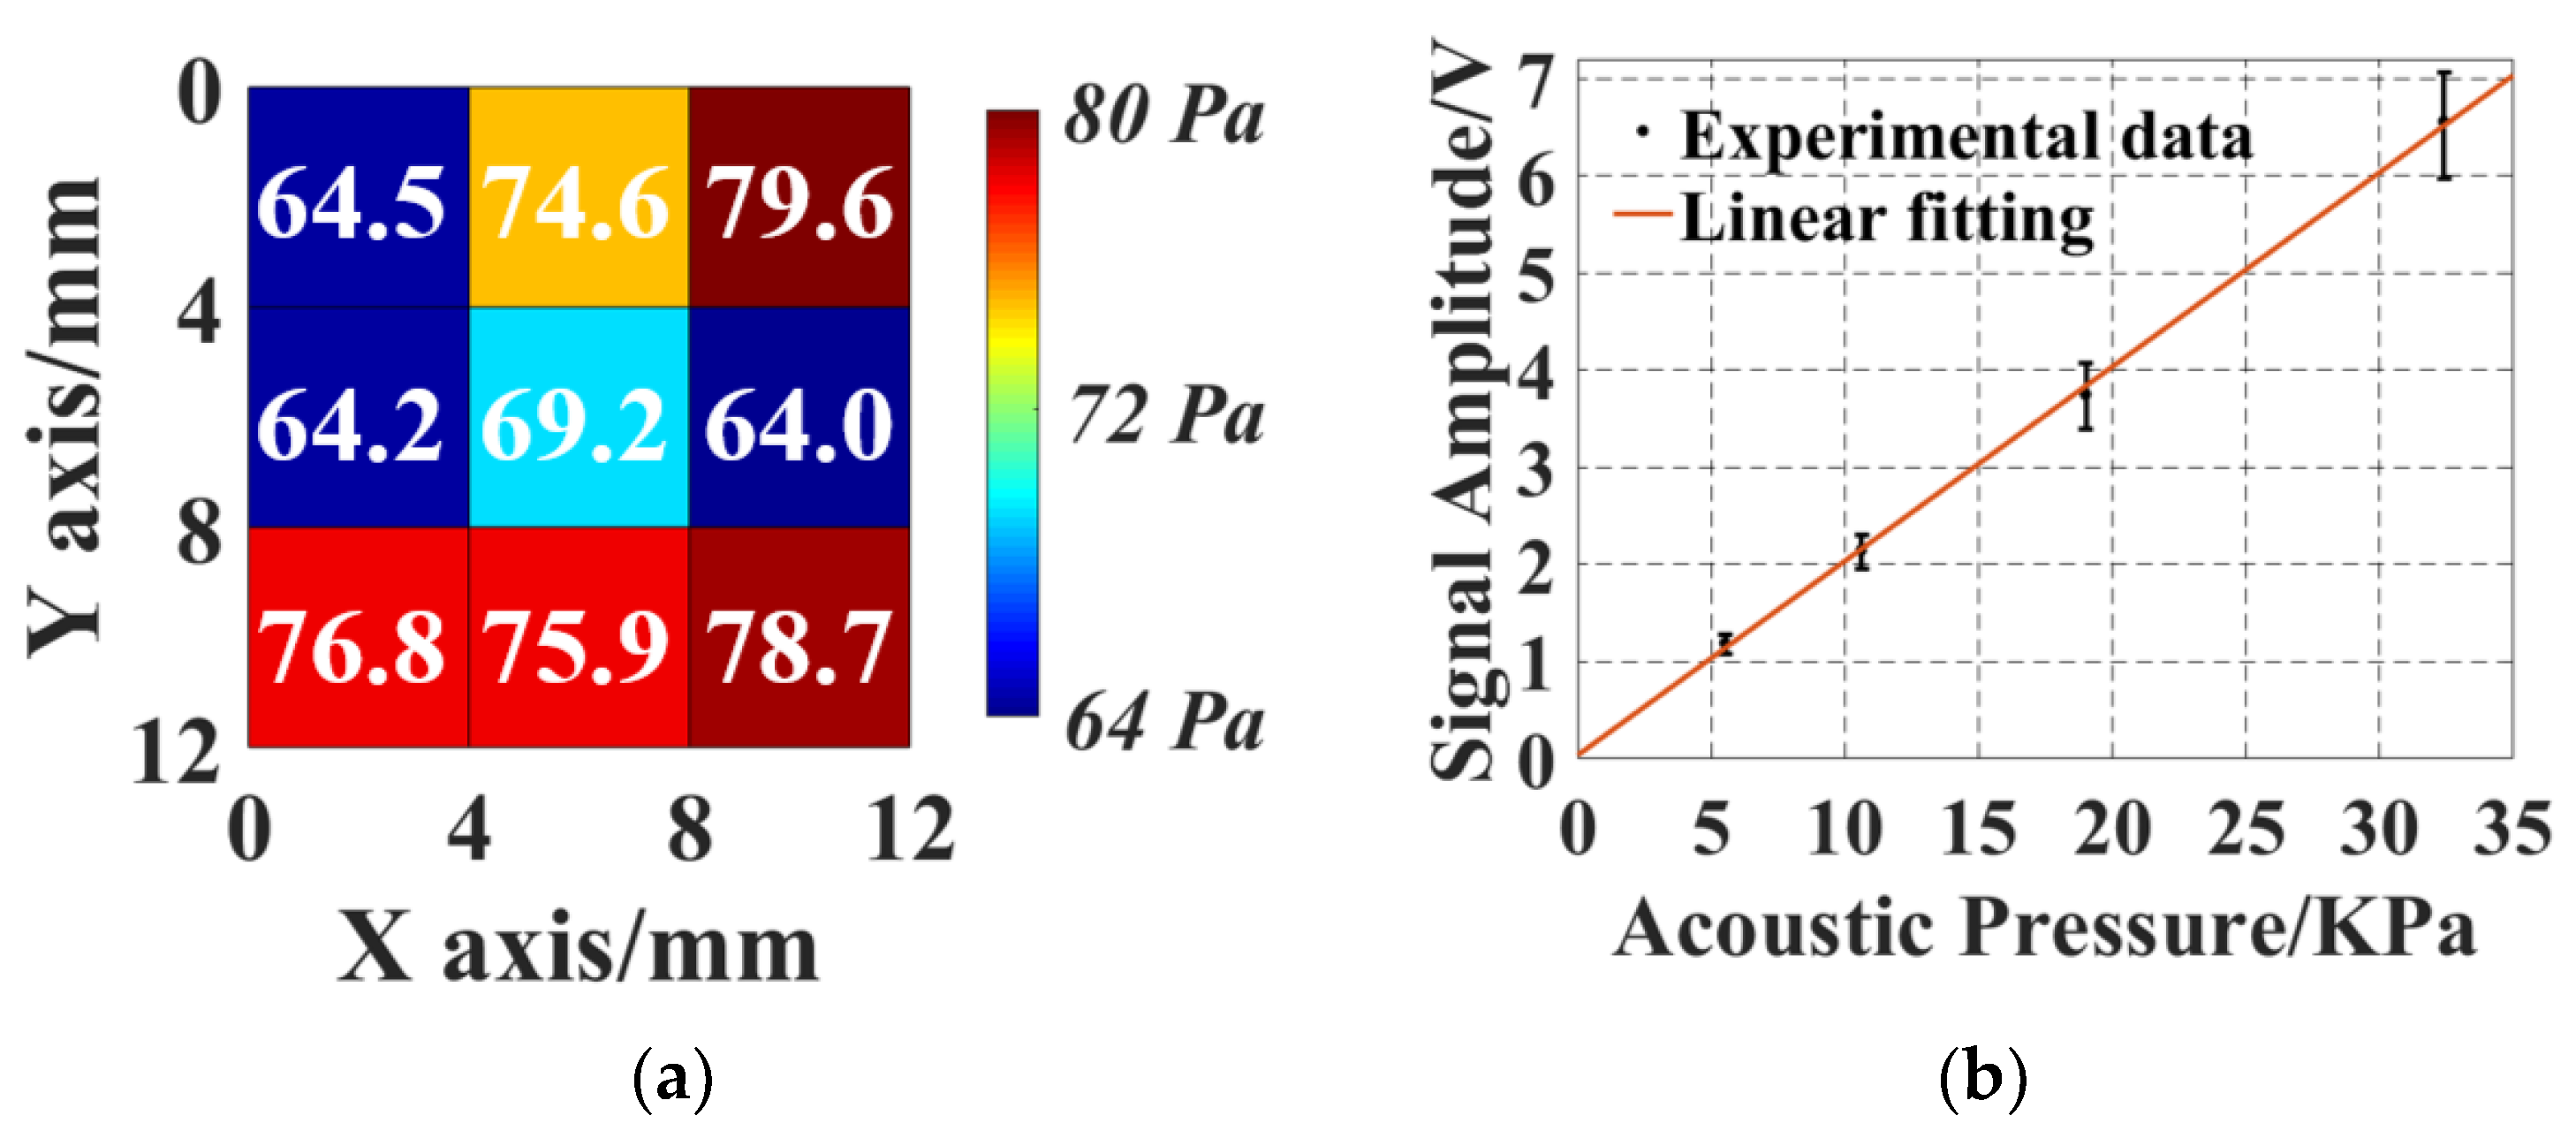
3.3. Noise Equivalent Pressure and Linearity
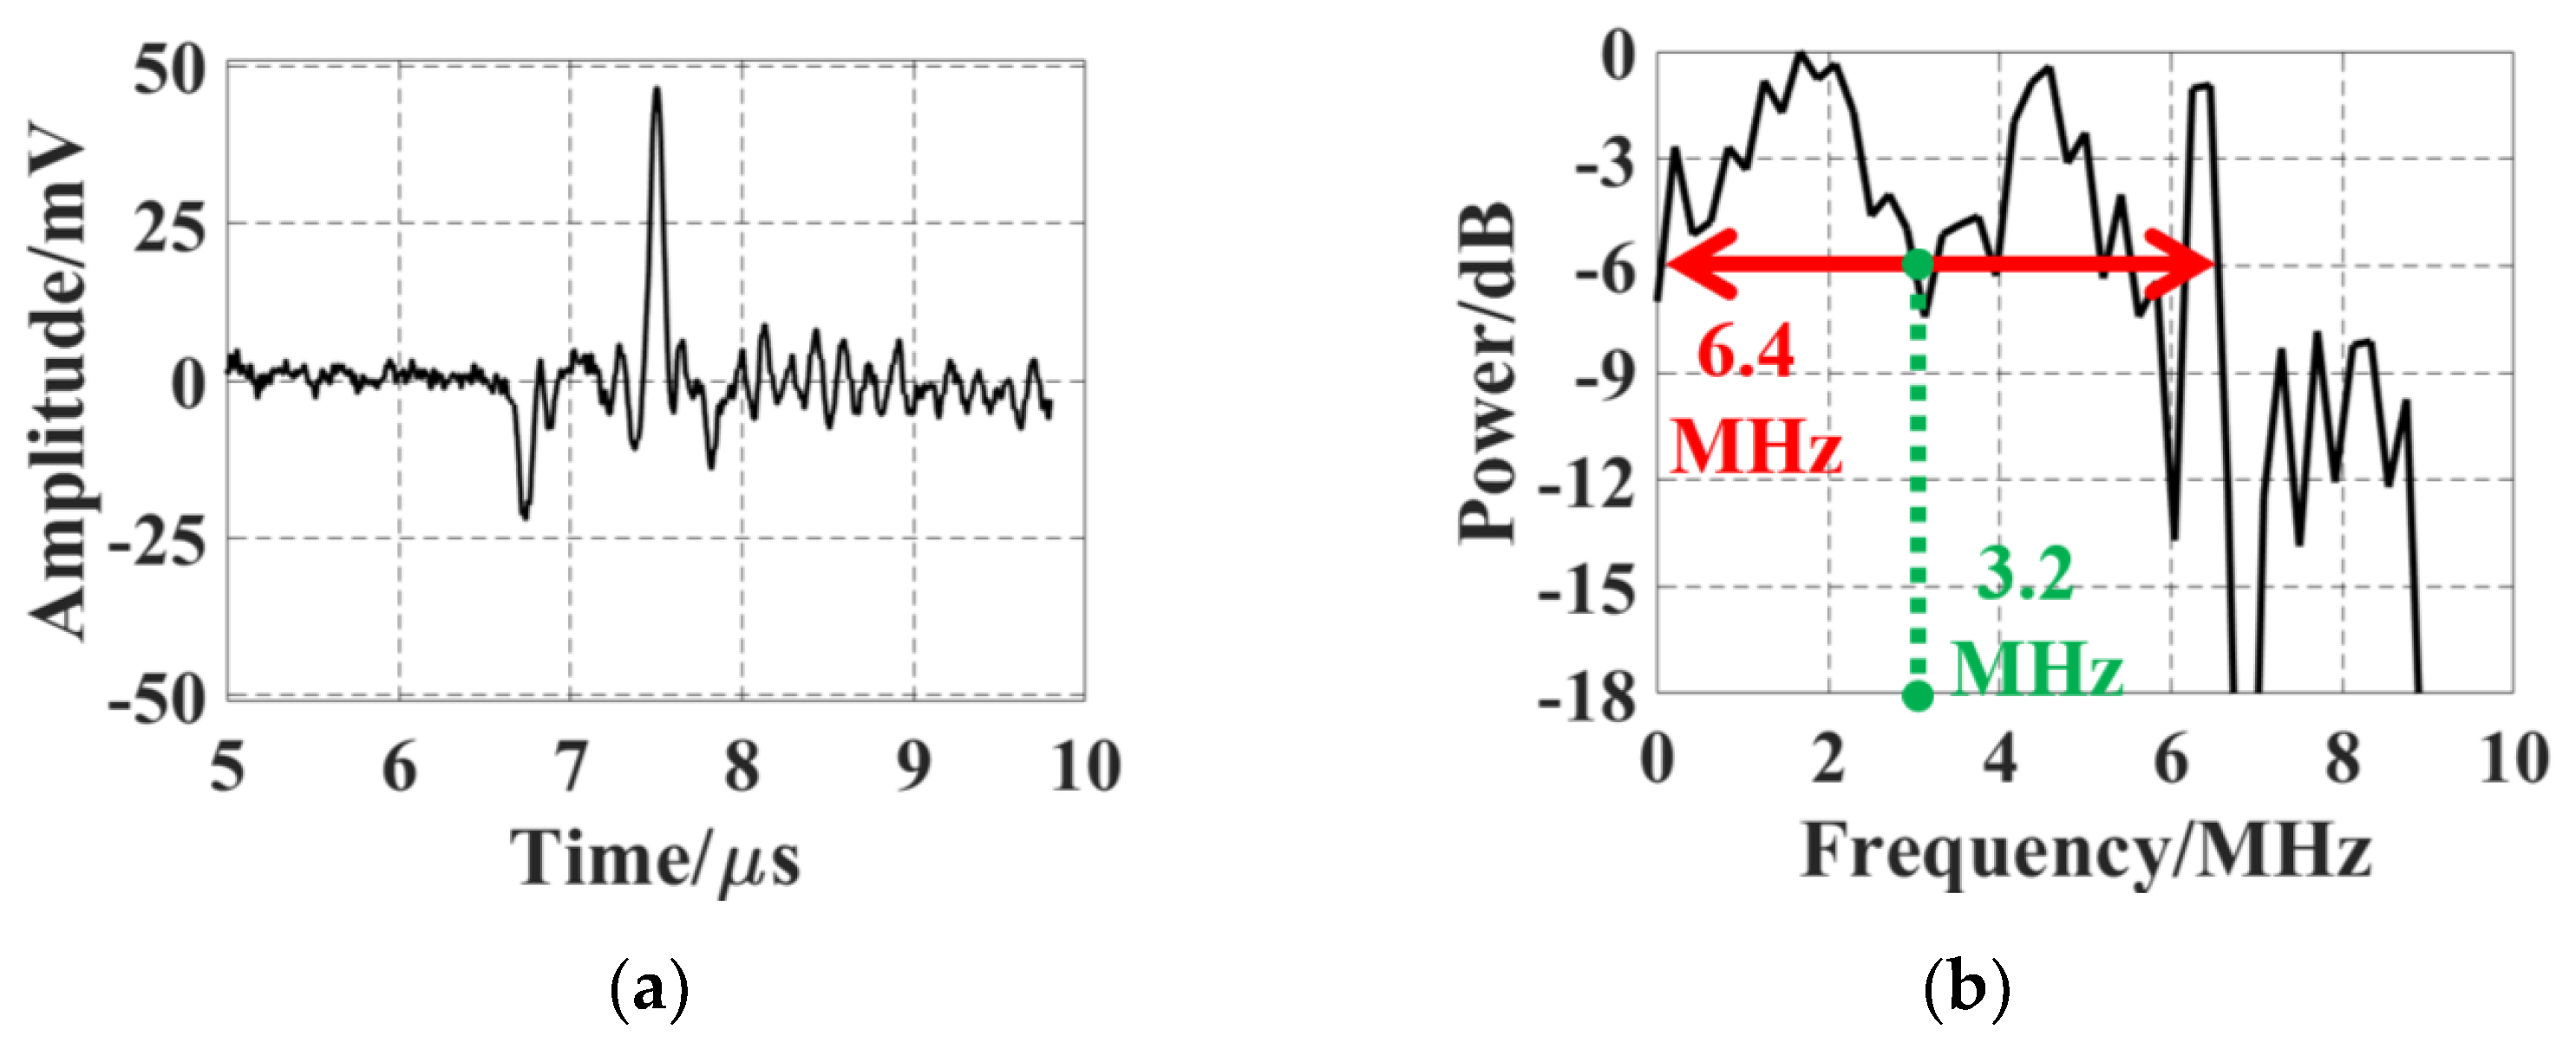
3.4. Frequency Response
3.5. Stability
4. Imaging Experiment
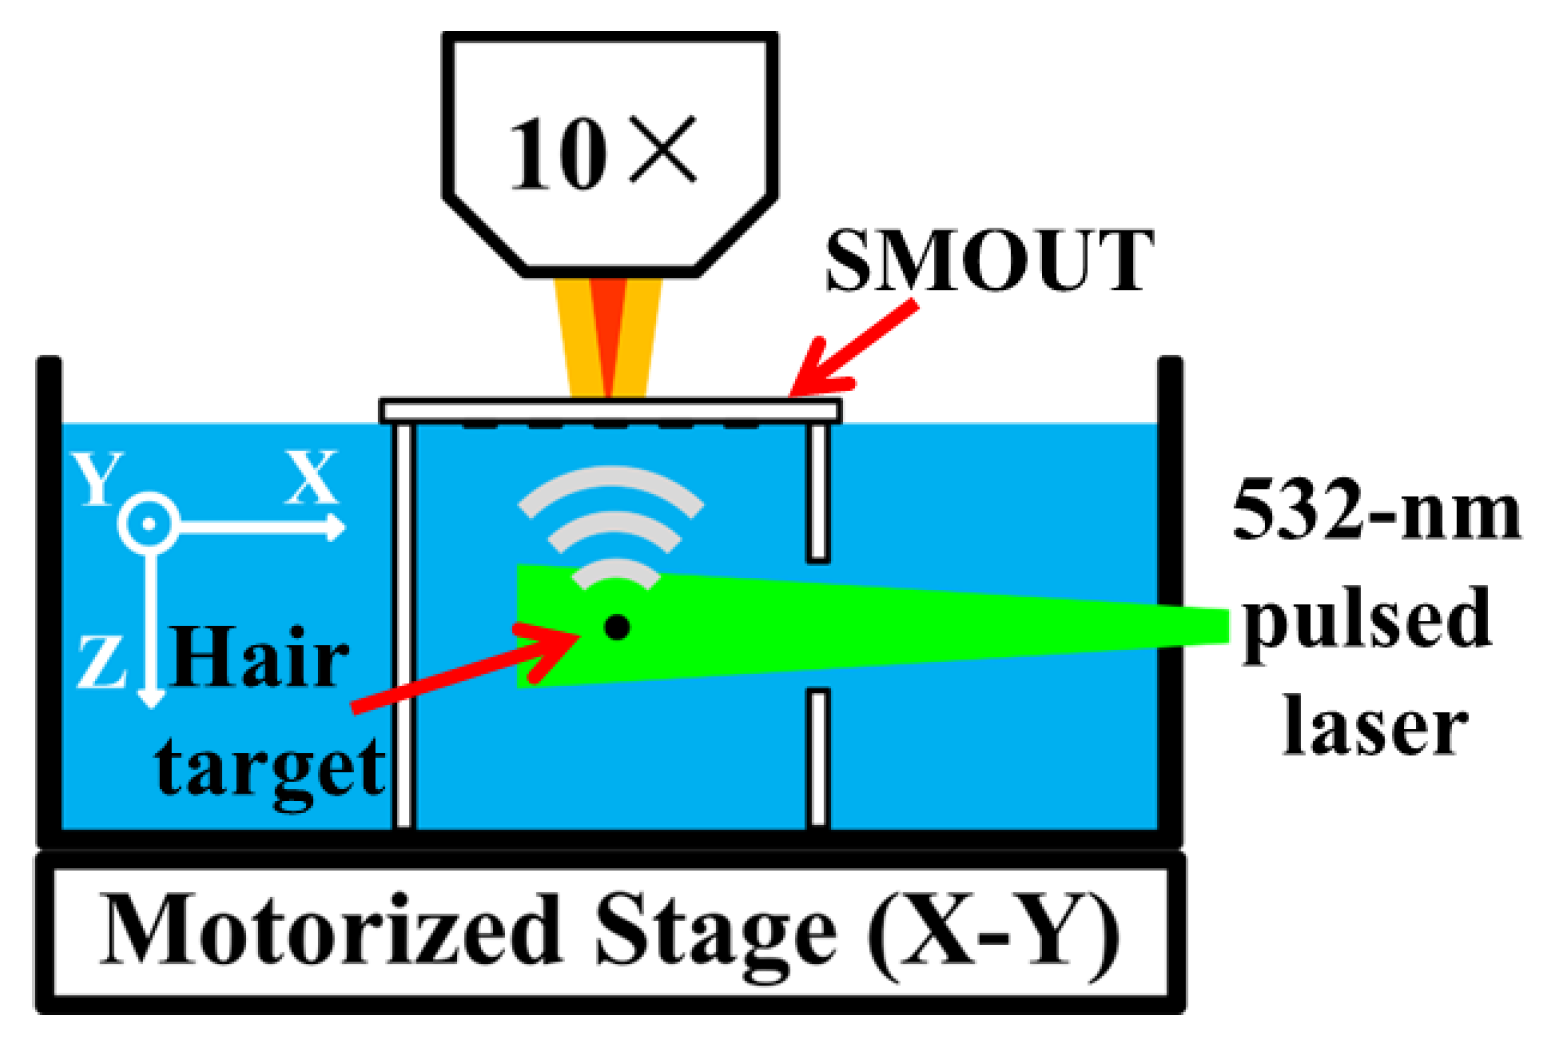
4.1. Imaging Setup and Data Acquisition
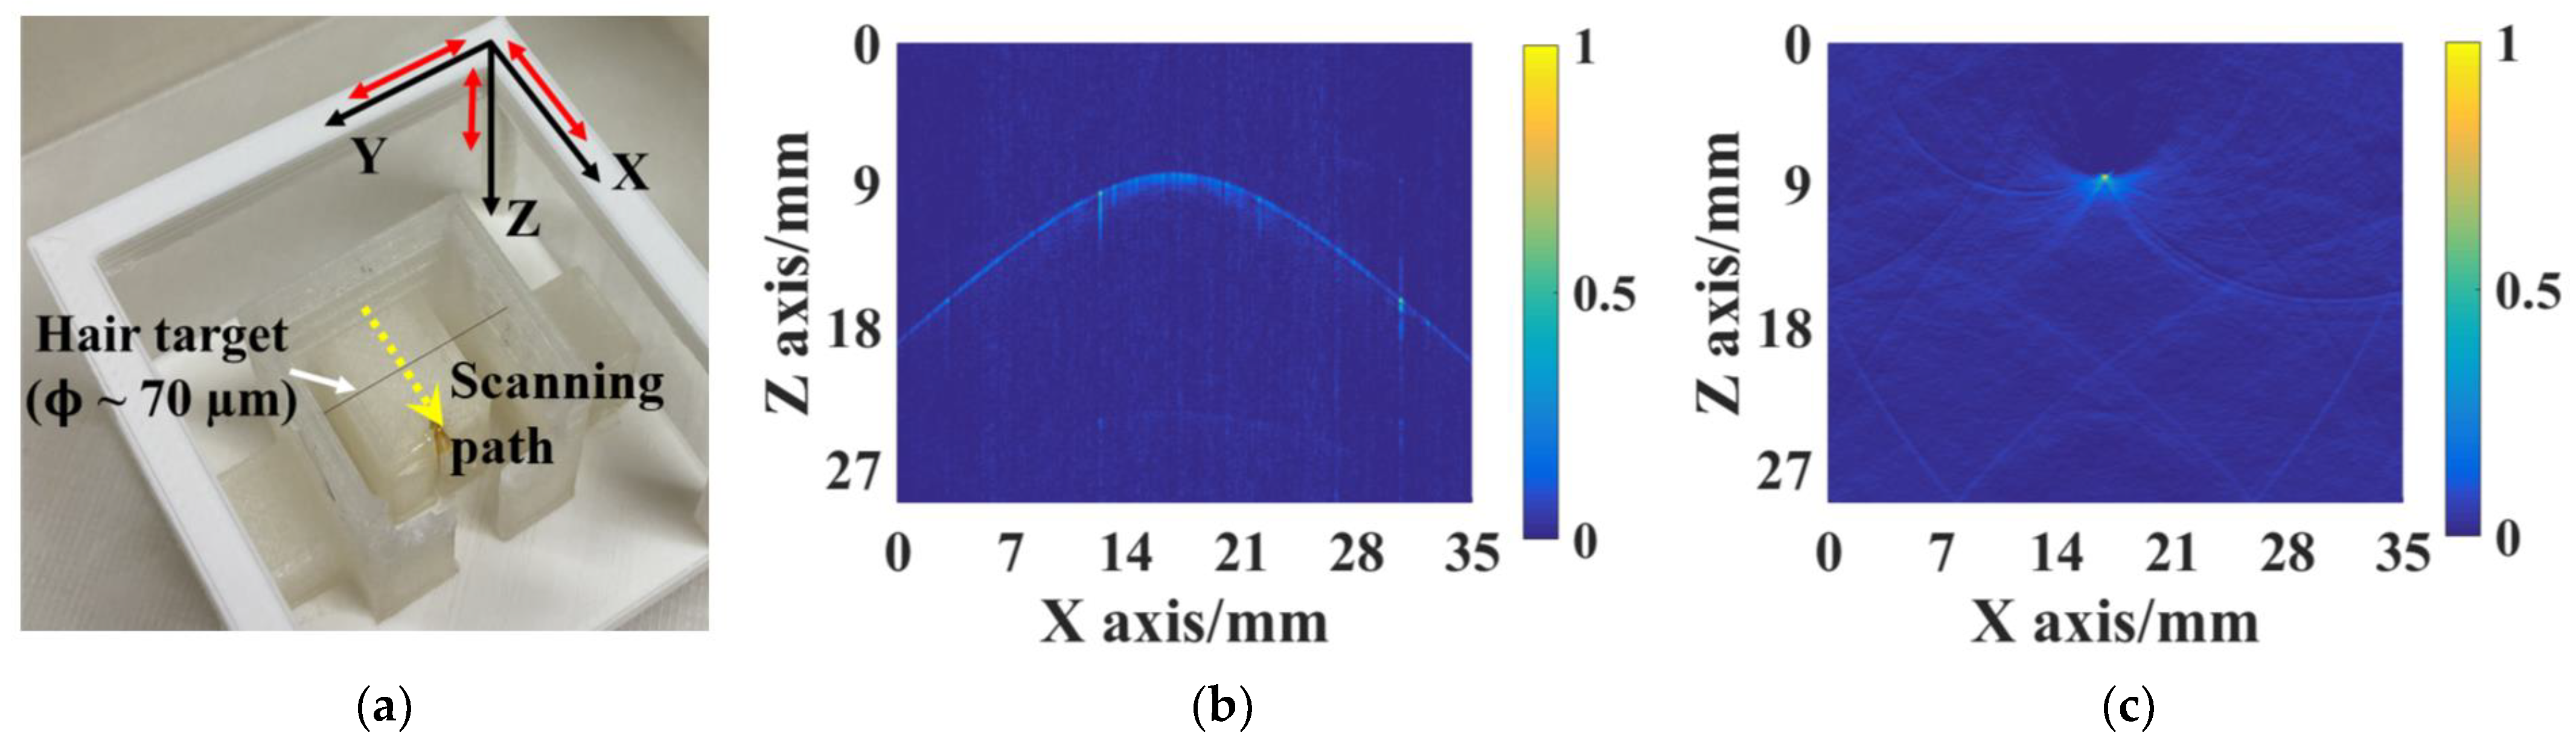
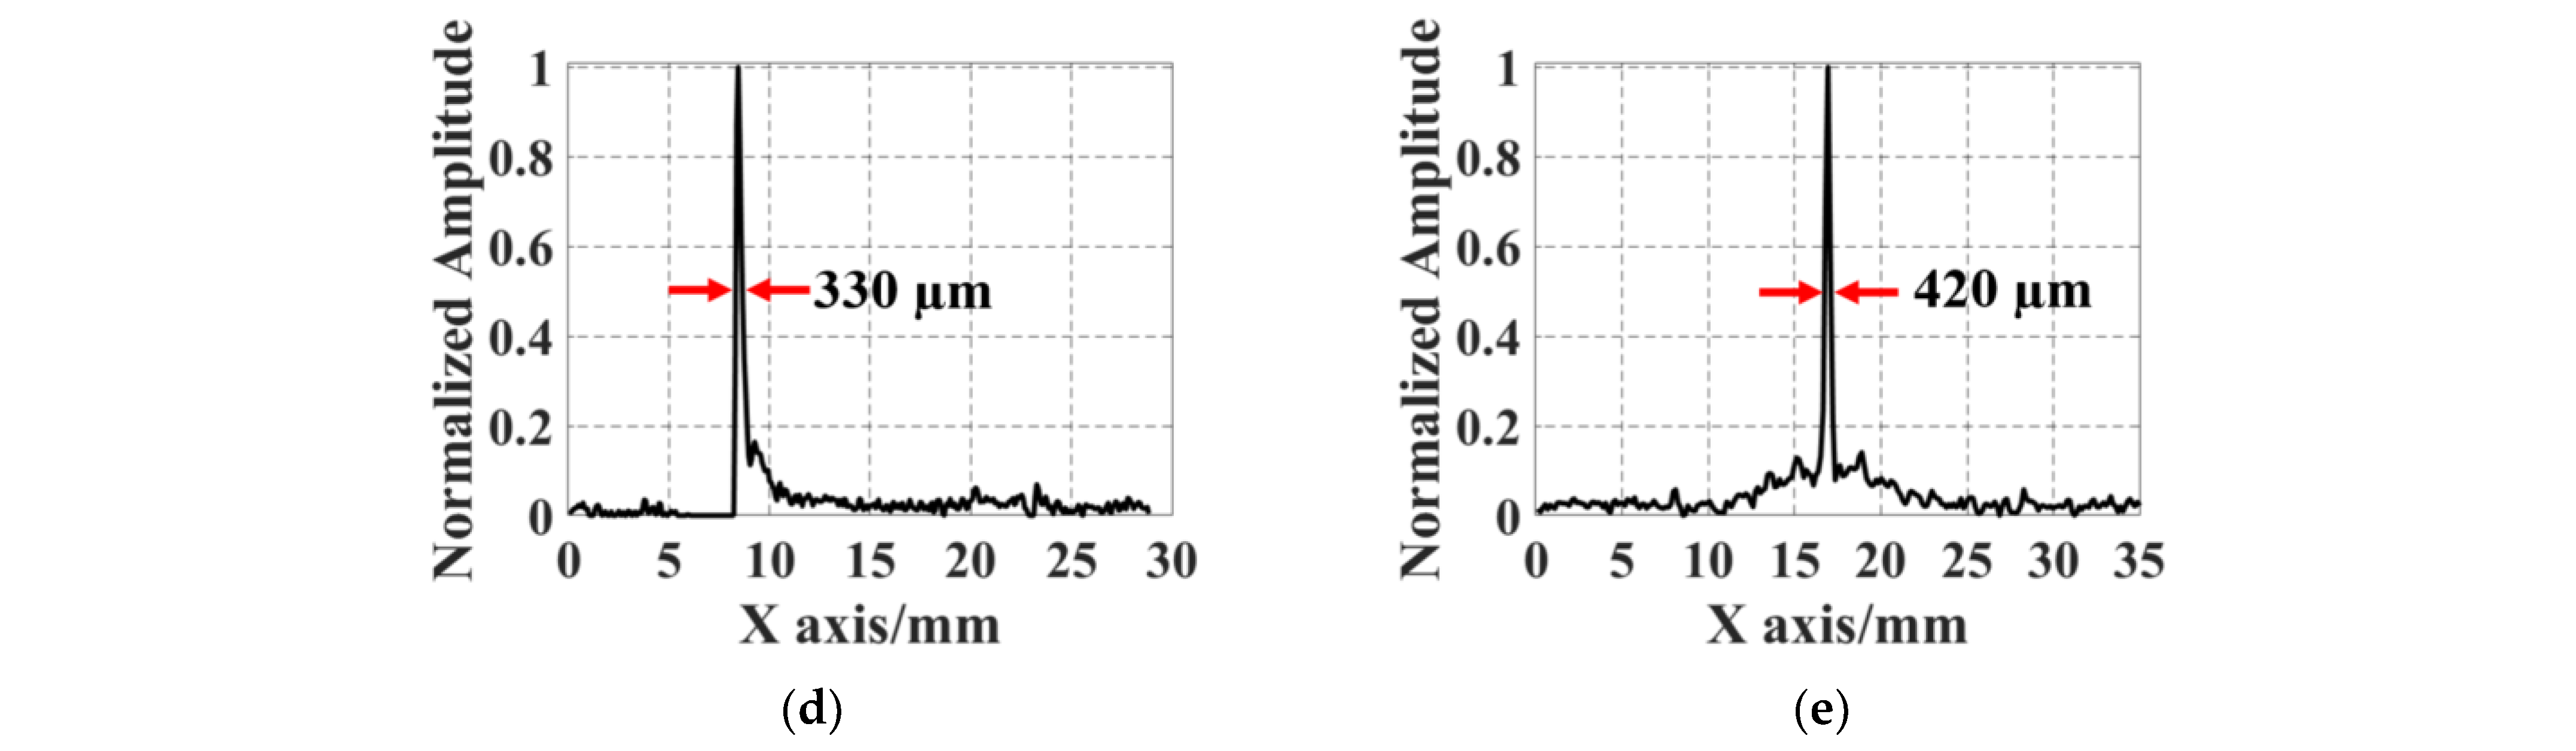
4.2. Two-Dimensional Imaging Results
4.3. Three-Dimensional Imaging Results
5. Conclusions and Discussion
Author Contributions
Funding
Data Availability Statement
Acknowledgments
Conflicts of Interest
References
- Wang, L.V. Photoacoustic Imaging and Spectroscopy, 1st ed.; CRC Press: Boca Raton, FL, USA, 2009. [Google Scholar] [CrossRef]
- Wang, L.V.; Yao, J. A practical guide to photoacoustic tomography in the life sciences. Nat. Methods 2016, 13, 627–638. [Google Scholar] [CrossRef] [PubMed]
- Xia, J.; Yao, J.; Wang, L.V. Photoacoustic tomography: Principles and advances. Electromagn. Waves 2014, 147, 1–22. [Google Scholar] [CrossRef] [PubMed]
- Fang, C.; Zou, J. Acoustic-resolution photoacoustic microscopy based on an optically transparent focused transducer with a high numerical aperture. Opt. Lett. 2021, 46, 3280–3283. [Google Scholar] [CrossRef] [PubMed]
- Yang, J.; Choi, S.; Kim, C. Practical review on photoacoustic computed tomography using curved ultrasound array transducer. Biomed. Eng. Lett. 2022, 12, 19–35. [Google Scholar] [CrossRef]
- Lin, L.; Hu, P.; Tong, X.; Na, S.; Cao, R.; Yuan, X.; Garrett, D.C.; Shi, J.; Maslov, K.; Wang, L.V. High-speed three-dimensional photoacoustic computed tomography for preclinical research and clinical translation. Nat. Commun. 2021, 12, 882. [Google Scholar] [CrossRef] [PubMed]
- Westerveld, W.J.; Mahmud-UI-Hasan, M.; Shnaiderman, R.; Ntziachristos, V.; Rottenberg, X.; Severi, S.; Rochus, V. Sensitive, small, broadband and scalable optomechanical ultrasound sensor in silicon photonics. Nat. Photonics 2021, 15, 341–345. [Google Scholar] [CrossRef]
- Shnaiderman, R.; Wissmeyer, G.; Ülgen, O.; Mustafa, Q.; Chmyrov, A.; Ntziachristos, V. A submicrometre silicon-on-insulator resonator for ultrasound detection. Nature 2020, 585, 372–378. [Google Scholar] [CrossRef] [PubMed]
- Yan, Z.; Zou, J. Large-scale surface-micromachined optical ultrasound transducer (SMOUT) array for photoacoustic computed tomography. Opt. Express 2022, 30, 19069–19080. [Google Scholar] [CrossRef] [PubMed]
- Hazan, Y.; Nagli, M.; Levi, A.; Rosenthal, A. Miniaturized ultrafast detector arrays in silicon photonics using pulse transmission amplitude monitoring. Opt. Lett. 2022, 47, 5660–5663. [Google Scholar] [CrossRef] [PubMed]
- Bisht, P.B. Chapter 9 The Fabry–Pérot resonator. In An Introduction to Photonics and Laser Physics with Applications; IOP Publishing Ltd., 2022; pp. 9–1–9–17. Available online: https://iopscience.iop.org/book/mono/978-0-7503-5226-0/chapter/bk978-0-7503-5226-0ch9 (accessed on 1 August 2022).
- Reflectivity and Transmissivity through Layered, Lossy Media: A User-Friendly Approach. Available online: https://apps.dtic.mil/sti/tr/pdf/ADA389099.pdf (accessed on 15 February 2001).
- Treeby, B.E.; Cox, B.T. k-Wave: MATLAB toolbox for the simulation and reconstruction of photoacoustic wave-fields. J. Biomed. Opt. 2010, 15, 021314. [Google Scholar] [CrossRef] [PubMed]
- Tian, C.; Zhang, C.; Zhang, H.; Xie, D.; Jin, Y. Spatial resolution in photoacoustic computed tomography. Rep. Prog. Phys. 2021, 84, 036701. [Google Scholar] [CrossRef] [PubMed]
- Yao, J.; Wang, L.V. Perspective on fast-evolving photoacoustic tomography. J. Biomed. Opt. 2021, 26, 060602. [Google Scholar] [CrossRef] [PubMed]


Disclaimer/Publisher’s Note: The statements, opinions and data contained in all publications are solely those of the individual author(s) and contributor(s) and not of MDPI and/or the editor(s). MDPI and/or the editor(s) disclaim responsibility for any injury to people or property resulting from any ideas, methods, instructions or products referred to in the content. |
© 2024 by the authors. Licensee MDPI, Basel, Switzerland. This article is an open access article distributed under the terms and conditions of the Creative Commons Attribution (CC BY) license (https://creativecommons.org/licenses/by/4.0/).
Share and Cite
Yan, Z.; Fang, C.; Zou, J. Fine-Tuning of Optical Resonance Wavelength of Surface-Micromachined Optical Ultrasound Transducer Arrays for Single-Wavelength Light Source Readout. Micromachines 2024, 15, 1111. https://doi.org/10.3390/mi15091111
Yan Z, Fang C, Zou J. Fine-Tuning of Optical Resonance Wavelength of Surface-Micromachined Optical Ultrasound Transducer Arrays for Single-Wavelength Light Source Readout. Micromachines. 2024; 15(9):1111. https://doi.org/10.3390/mi15091111
Chicago/Turabian StyleYan, Zhiyu, Cheng Fang, and Jun Zou. 2024. "Fine-Tuning of Optical Resonance Wavelength of Surface-Micromachined Optical Ultrasound Transducer Arrays for Single-Wavelength Light Source Readout" Micromachines 15, no. 9: 1111. https://doi.org/10.3390/mi15091111