3.1. Sharp vs. Blunt Cutting Edge
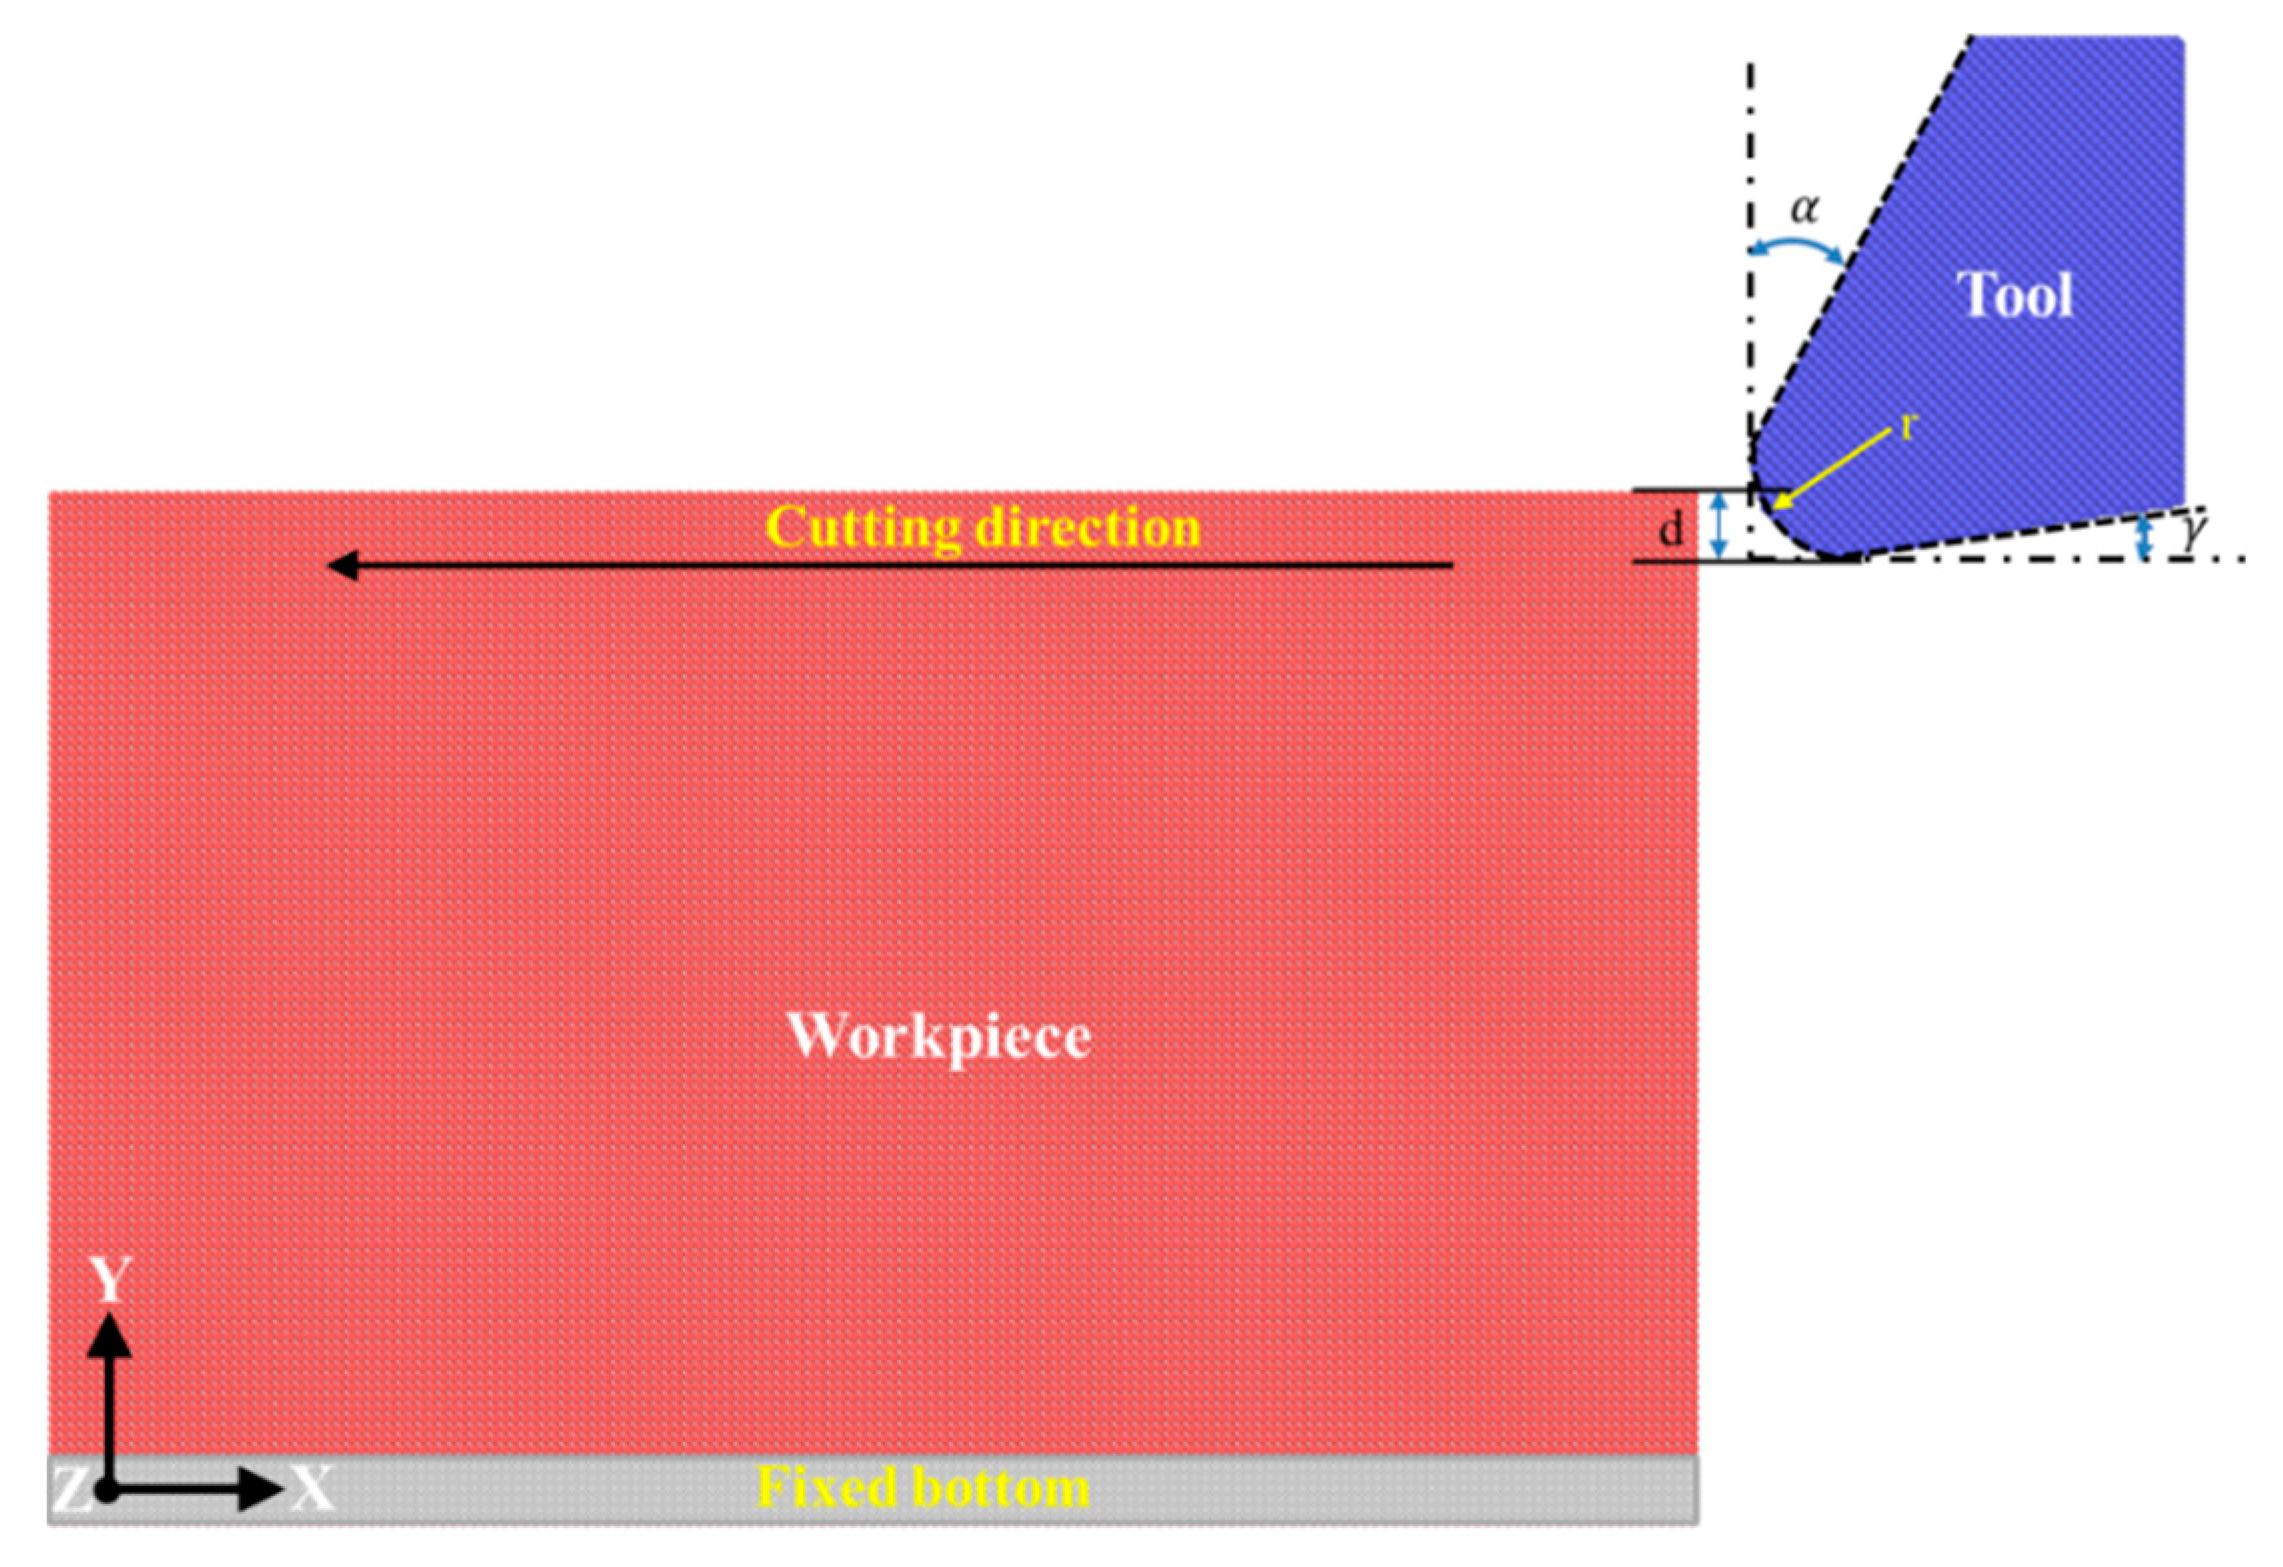
It has been demonstrated that the geometry of the diamond cutting tool has a prominent influence on the cutting process. Therefore, the influence of cutting edge sharpness on the diamond cutting of cerium is first investigated by using two types of cutting edge: an atomically sharp one with an edge radius of 0 nm and a blunt one with an edge radius of 2 nm. For each type of cutting edge, the rake angle and clearance angle are 30° and 10°, respectively. The DOC and cutting speed utilized in the two cutting processes are 0.2 nm and 100 m/s, respectively.
There are three machining force components acting on the diamond cutting tool: the cutting force along the
X direction, the normal force along the
Y direction and the lateral force along the
Z direction, respectively.
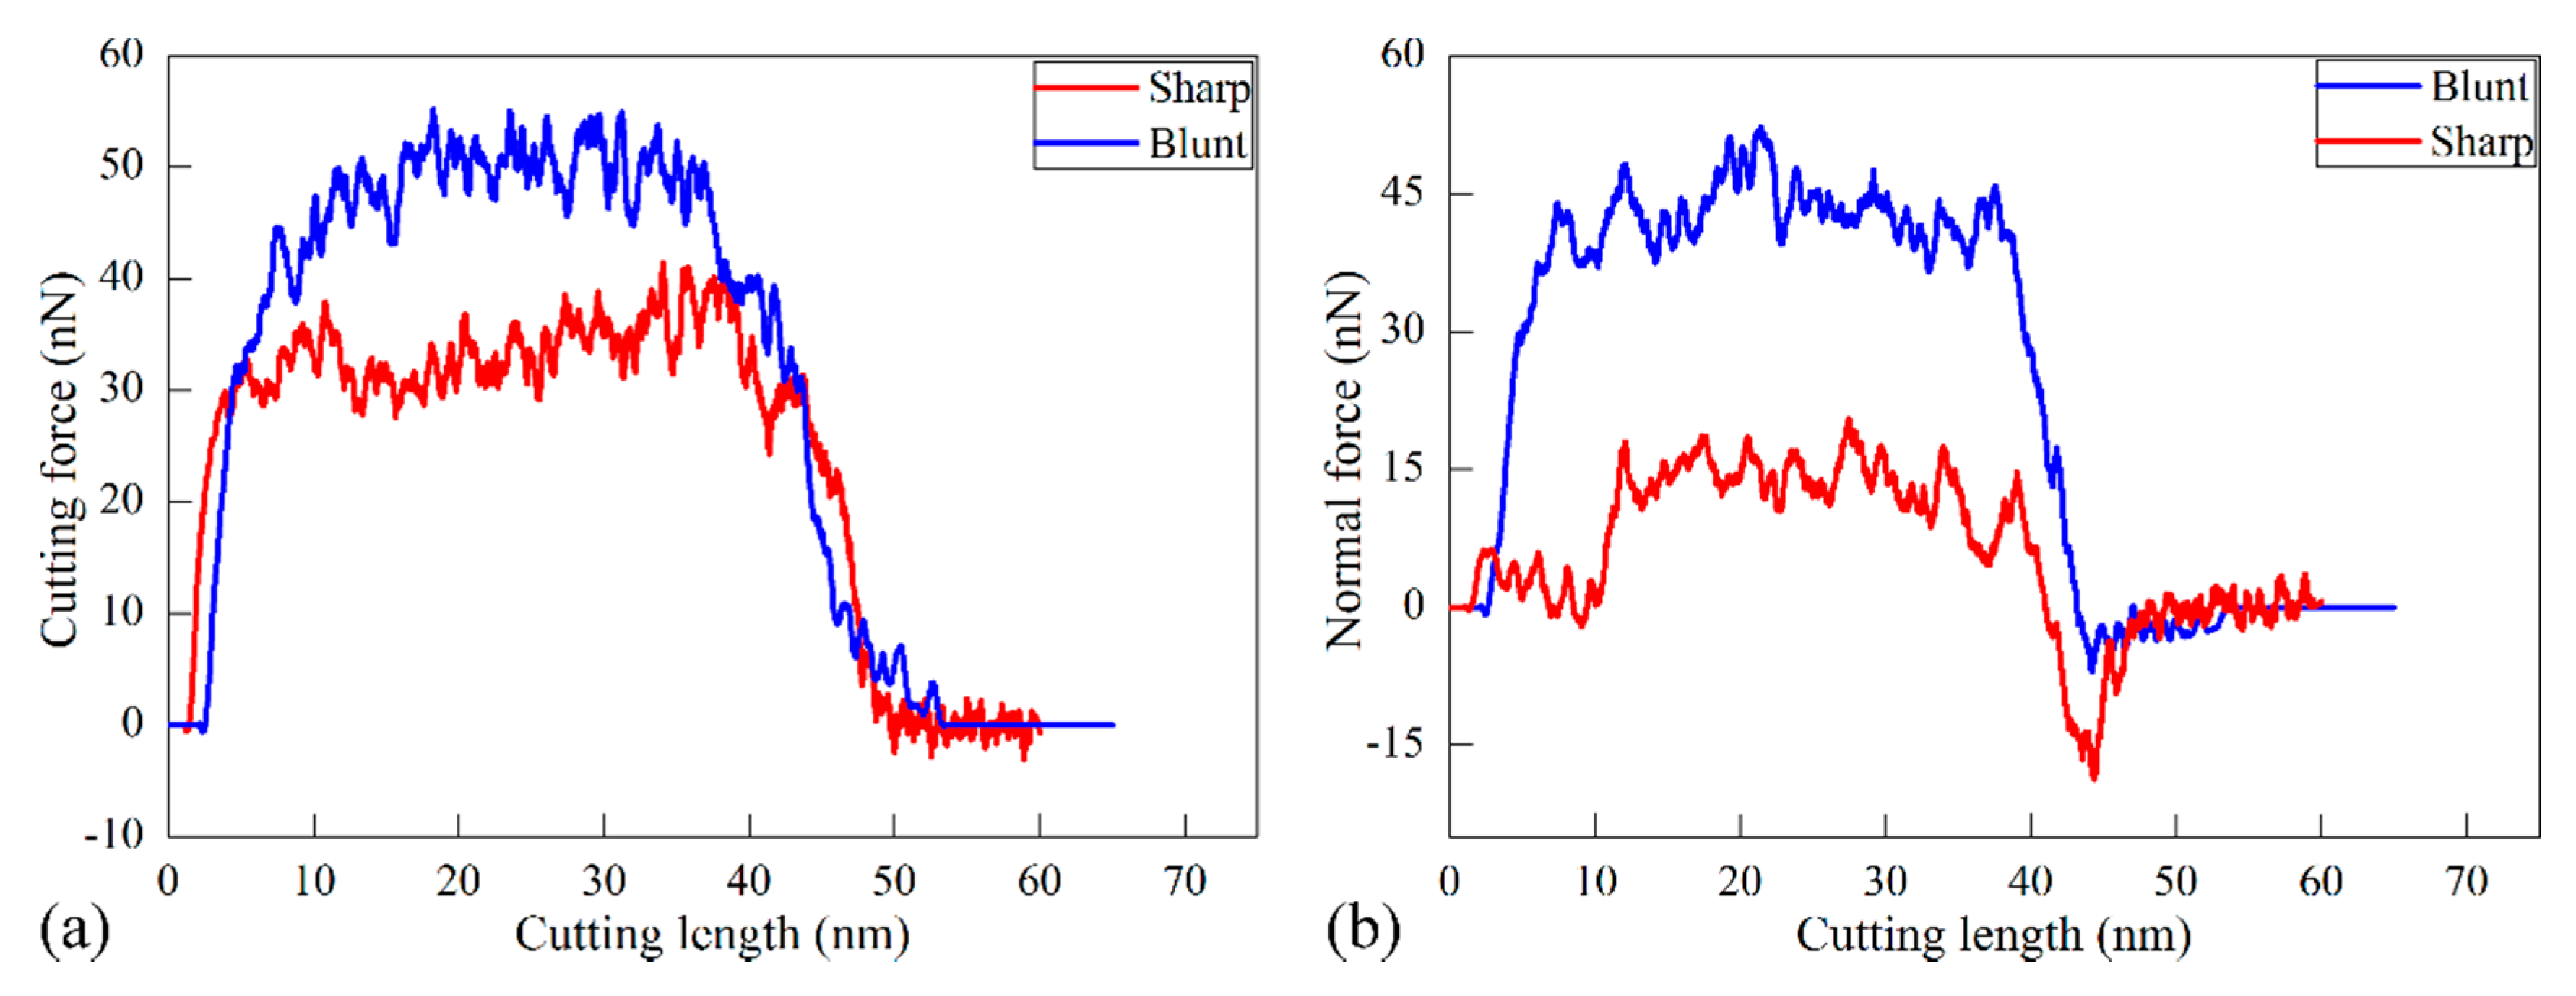
Figure 2a,b plot variations of cutting forces and normal forces with cutting length in the two cutting processes, respectively. Simultaneously,
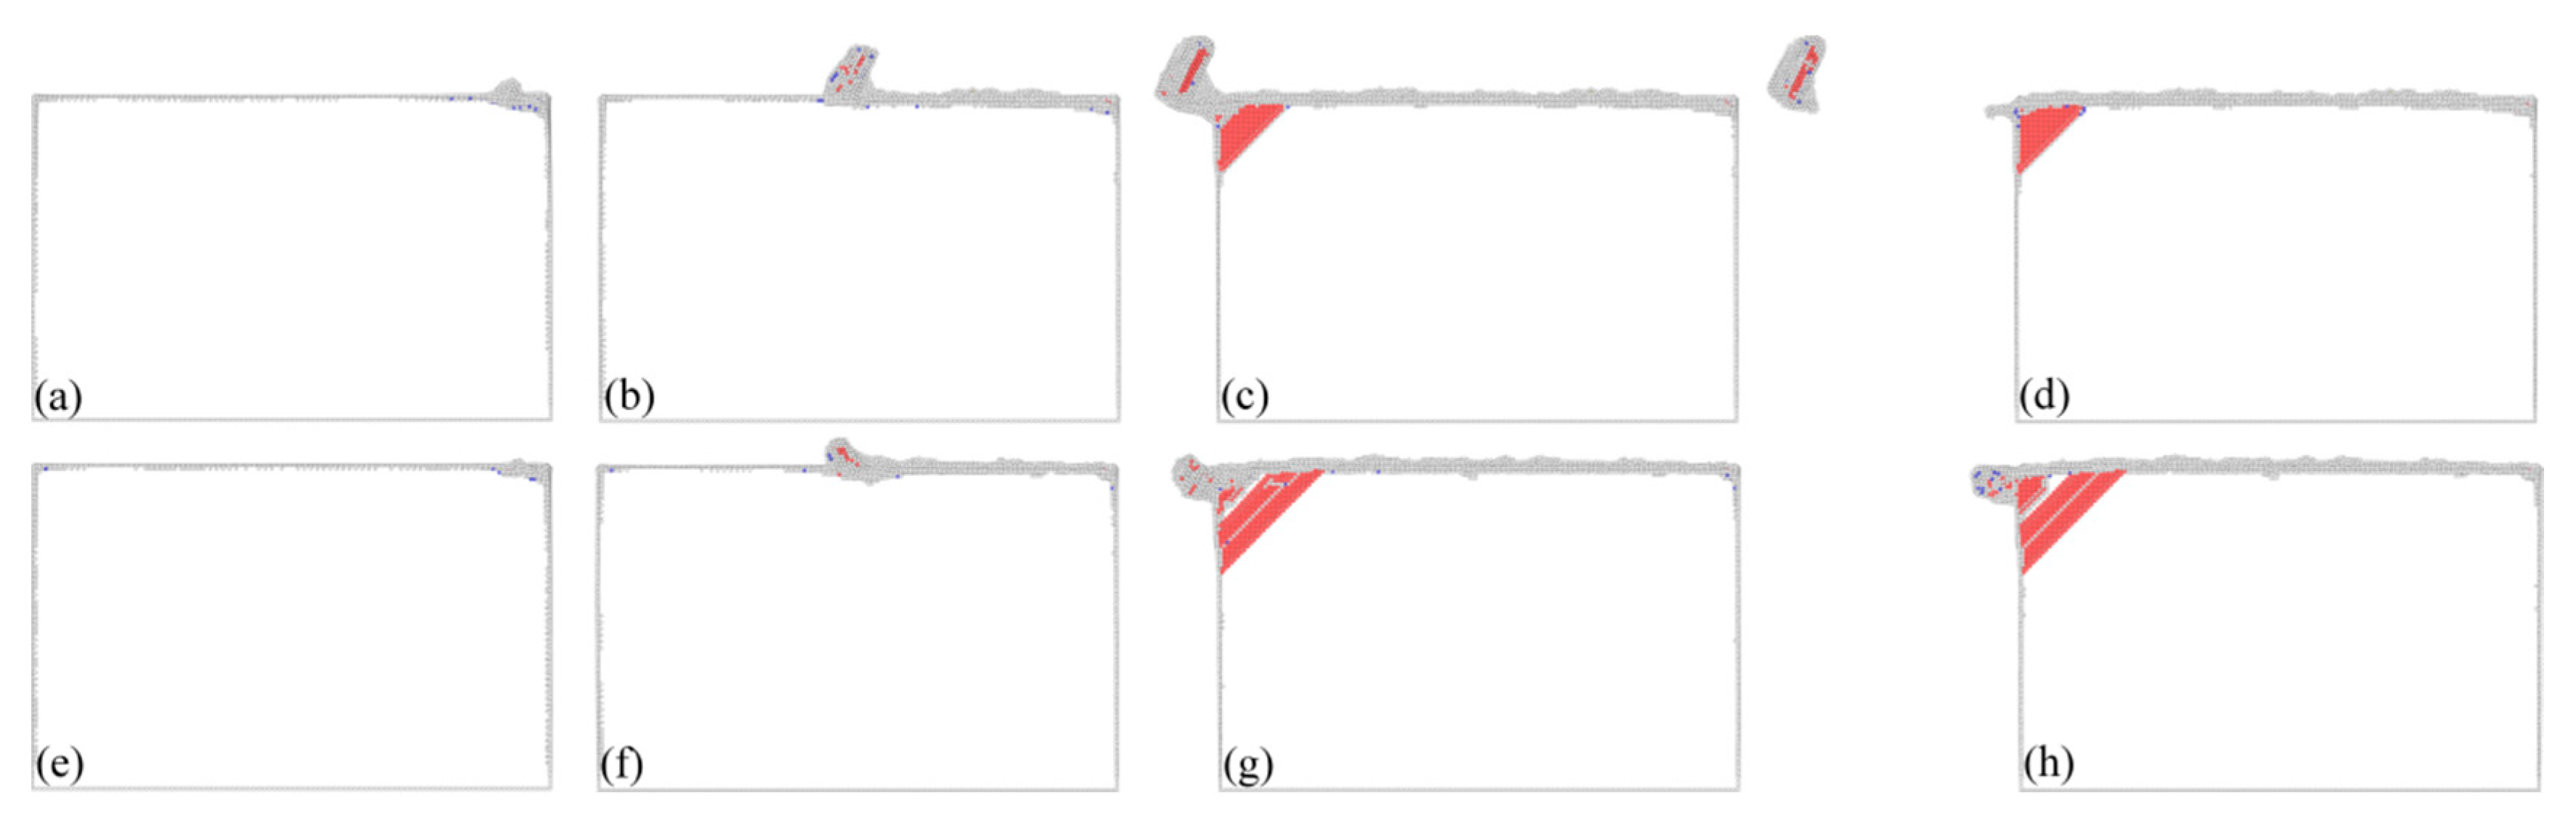
Figure 3 presents instantaneous defect structures formed in the workpiece at different cutting lengths with different cutting edge sharpness, aiming to reveal the microscopic deformation behavior of workpiece materials. Atoms in
Figure 3 are colored according to their CNA values, and perfect FCC atoms are not shown for clear visualization of defects.
It is seen from
Figure 2 that variations of both cutting force and normal force for each type of cutting edge have similar characteristics. Both cutting force and normal force have negative values when the cutting tool is approaching the workpiece, due to the adhesion between the cutting tool and the workpiece. When the cutting tool begins to come into contact with workpiece, the machining forces increase rapidly. Meanwhile,
Figure 3a,e show that there no defect is generated beneath the machined surface, indicating that the rapid increase of machining forces is accompanied by elastic deformation of the workpiece material. With the further advance of the diamond cutting tool, the machining forces drop due to the plasticity initiation in the workpiece material, as shown in
Figure 3b,f. Then the machining forces fluctuate around stable values when the cutting process is stable in the cutting length ranging from 10 to 35 nm. Dynamic inspection of the defect evolution indicates that there are considerable dislocations generated beneath the machined surface. Specifically, successive events of dislocation nucleation and subsequent glide lead to oscillations of machining forces shown in
Figure 2.
Figure 3c,g also show that there are dislocations accumulated in the vicinity of the left fixed free surface. Furthermore, dislocations have the same geometry with respect to the machined surface for different types of cutting edge.
Figure 3d,h show that dislocations are remained within the material after the diamond cutting tool is separating from the workpiece. Correspondingly,
Figure 2 shows that the machining forces drop precipitously.
Figure 2 and
Figure 3 jointly show that the cutting edge sharpness has a significant influence on the cutting processes.
Figure 2 indicates that the critical cutting length for the first drop of machining forces is 2.3 and 7.8 nm at for the sharp and the blunt cutting edge, respectively, indicating that plastic deformation takes place earlier in the cutting process with the sharp cutting edge.
Figure 2 indicates that machining forces for the blunt cutting edge are significantly higher than those for the sharp cutting edge. Furthermore, although the cutting force is larger than the normal force for each type of cutting edge, the differential value between the two force components is significantly different. In particular for the stable cutting period, the ratio of cutting force to normal force is 1.1 and 2.4 for the blunt and sharp cutting edge, respectively.
Figure 3 shows that a chip is formed for the sharp cutting edge, and there are considerable dislocations observed in the formed chip. In contrast, there is no chip formed for the blunt cutting edge.
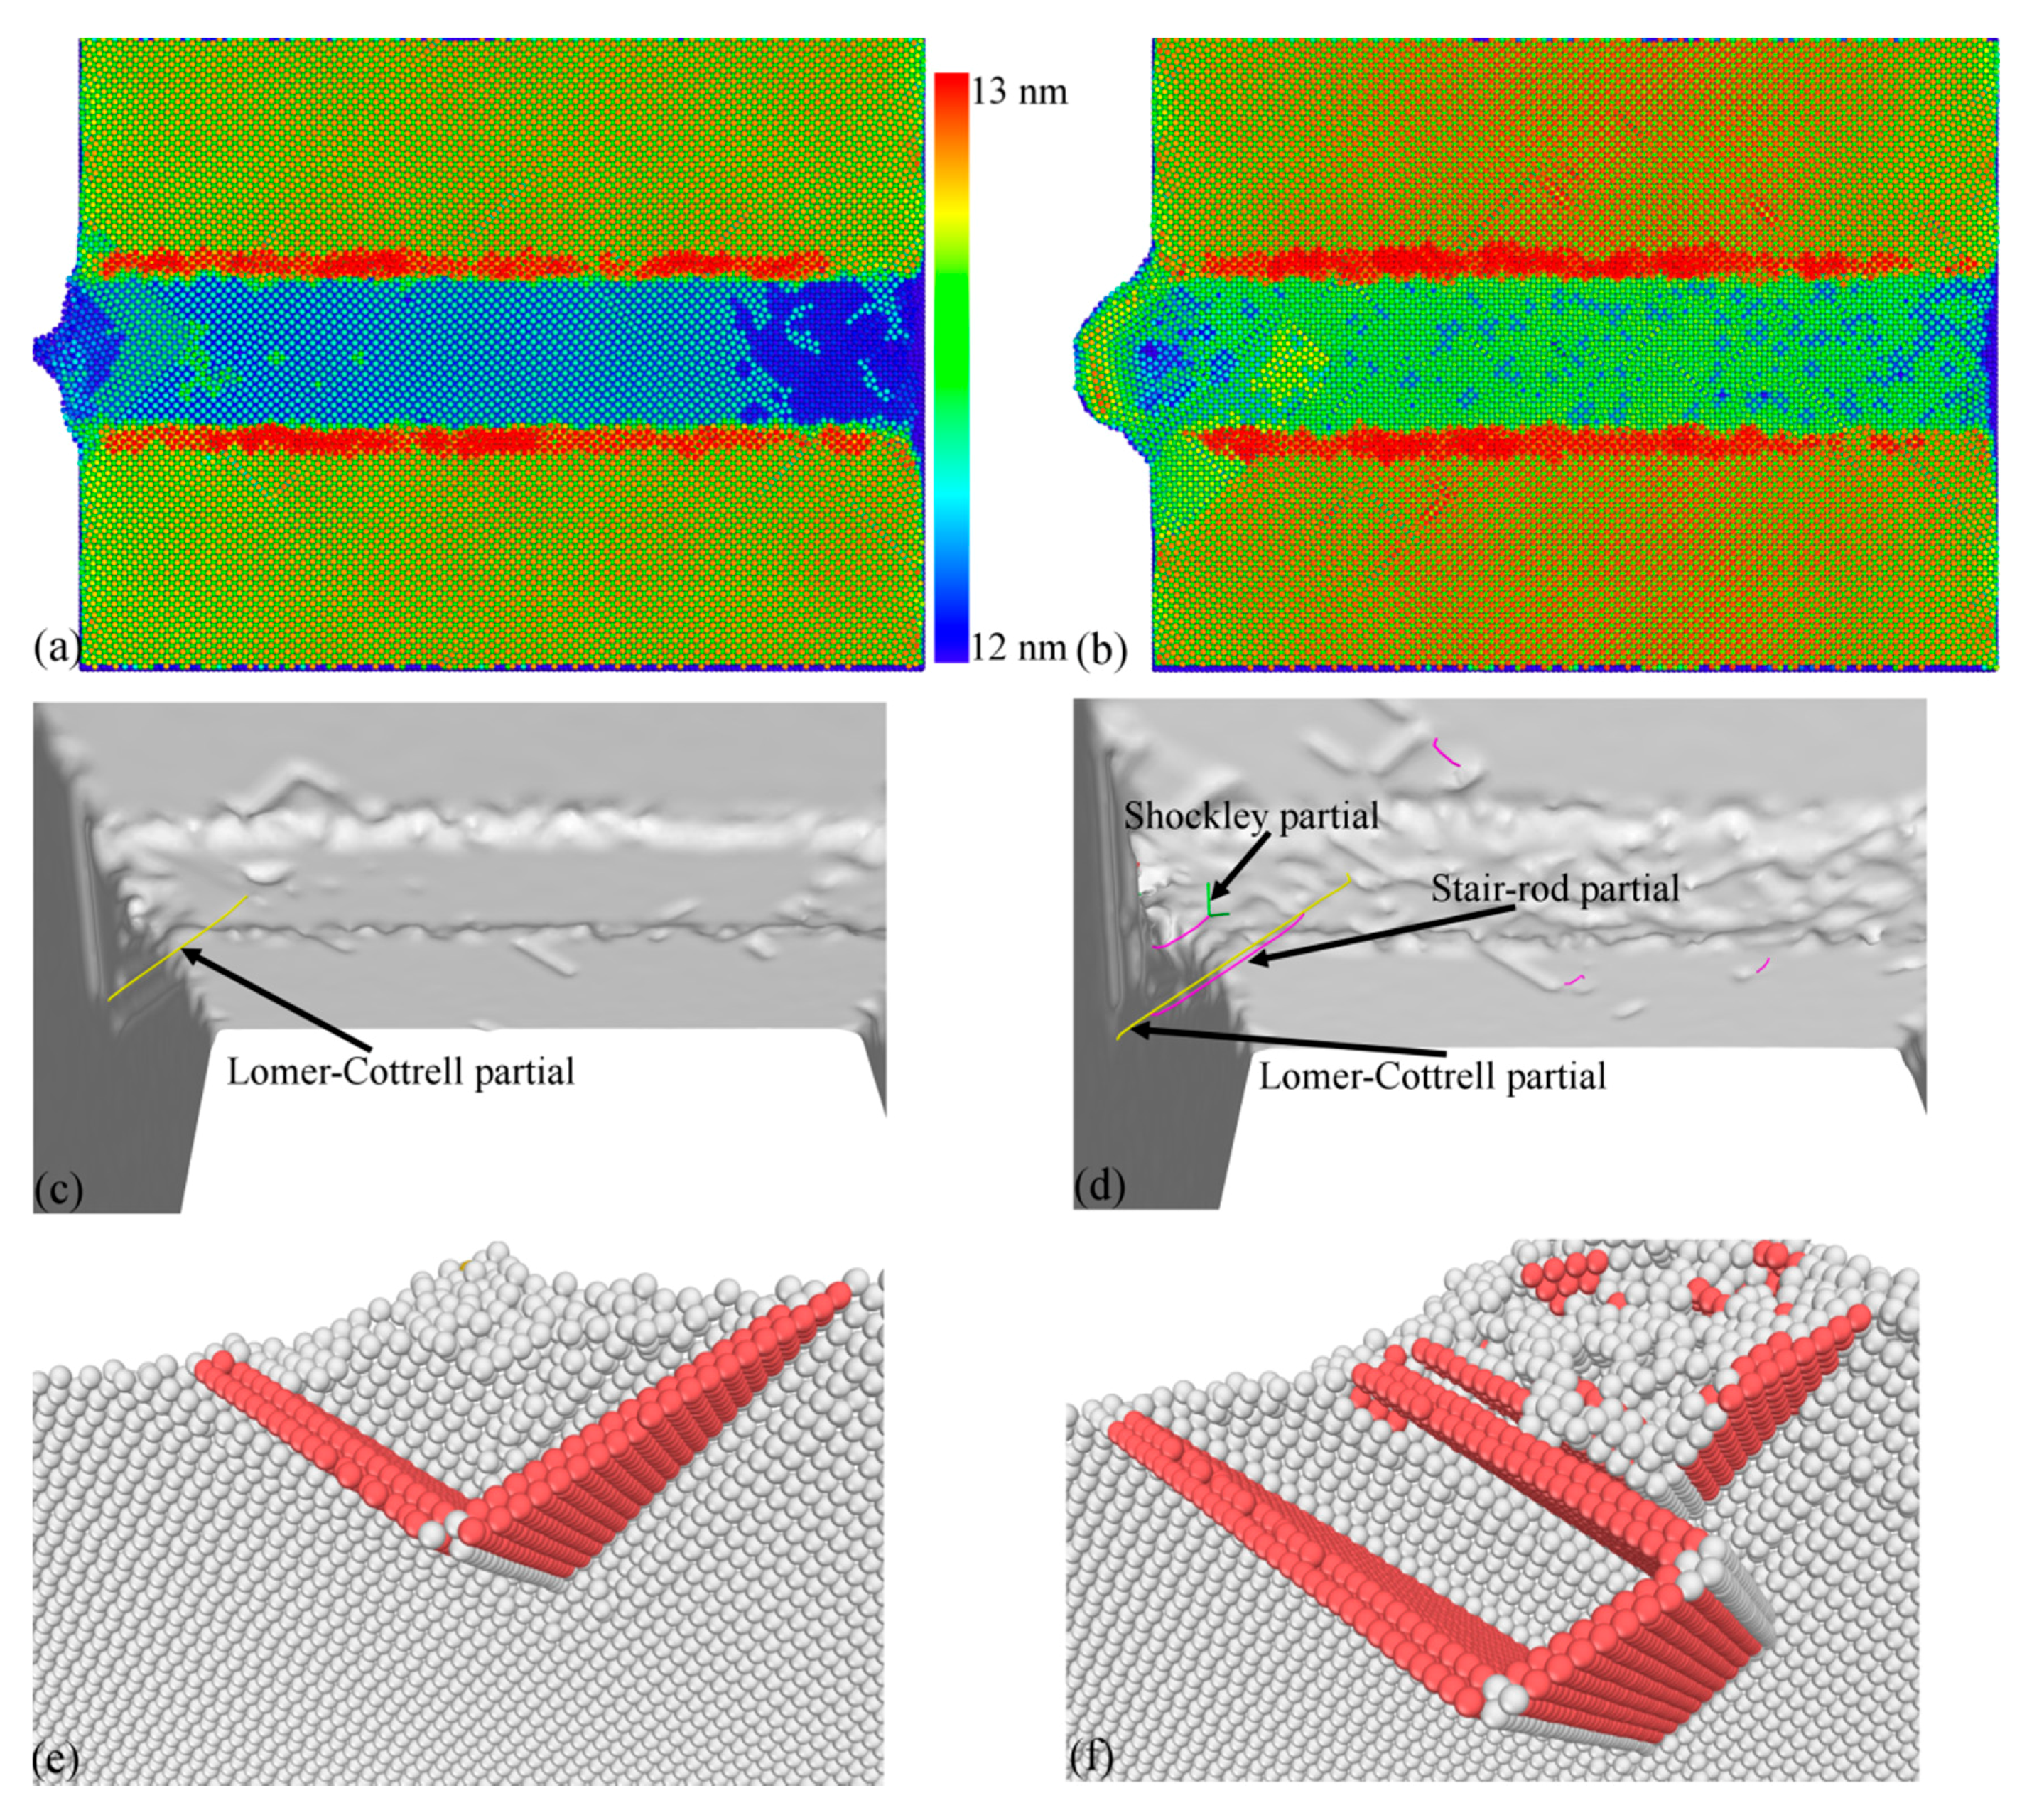
Figure 4a,b present machined surface morphologies after cutting processes with the sharp and blunt cutting edge, respectively. While the volume of surface pile up accumulating on both sides of the formed groove is significantly smaller for the sharp cutting edge than that for the blunt one, the integrity of the machined surface for the sharp cutting edge is also higher than that for the blunt cutting edge. These observations jointly demonstrate that a better machined surface quality can be achieved by using the cutting tool with a sharp cutting edge.
Figure 3 indicates that the cutting edge sharpness also has a prominent influence on the dislocation-dominated deformation of the workpiece material. Although the activated slip planes are similar for the two cutting processes due to the same crystallographic orientation, the dislocation slip event is more pronounced for the blunt cutting edge than that for the sharp cutting edge, indicating that a more serious plastic deformation occurred.
Figure 4c,d further characterize dislocation structures after the cutting process with the sharp and blunt cutting edge, respectively.
Figure 4c shows that there is only one Lomer–Cottrell lock and it has a Burgers vector of 1/3[1 0 0].
Figure 4e further presents the atomic configuration of the Lomer–Cottrell lock, in which atoms are colored according to their CNA values. The Lomer–Cottrell lock is a sessile dislocation structure that locks the dislocation slip in two adjacent slip planes. There is also a Lomer–Cottrell lock formed in the cutting process for the blunt cutting edge. However, there are other two types of dislocations formed, i.e., stair-rod dislocation with a Burgers vector of 1/6[1 1 0] and a Shockley partial with a Burgers vector of 1/6[1 1 2].
Figure 4f further presents the atomic configurations of the dislocation structures, in which atoms are colored according to their CNA values. Furthermore,
Figure 4d clearly shows the nonsymmetrical distribution of dislocation along the formed groove for the blunt cutting edge. The sharpness-dependent machining forces can be attributed to the different effective rake angles. For the blunt cutting edge with an edge radius of 2 nm, the effective rake angle is negative at the shallow DOC of 0.2 nm. In contrast, the effective rake angle is a constant value of 30° for the sharp cutting edge.
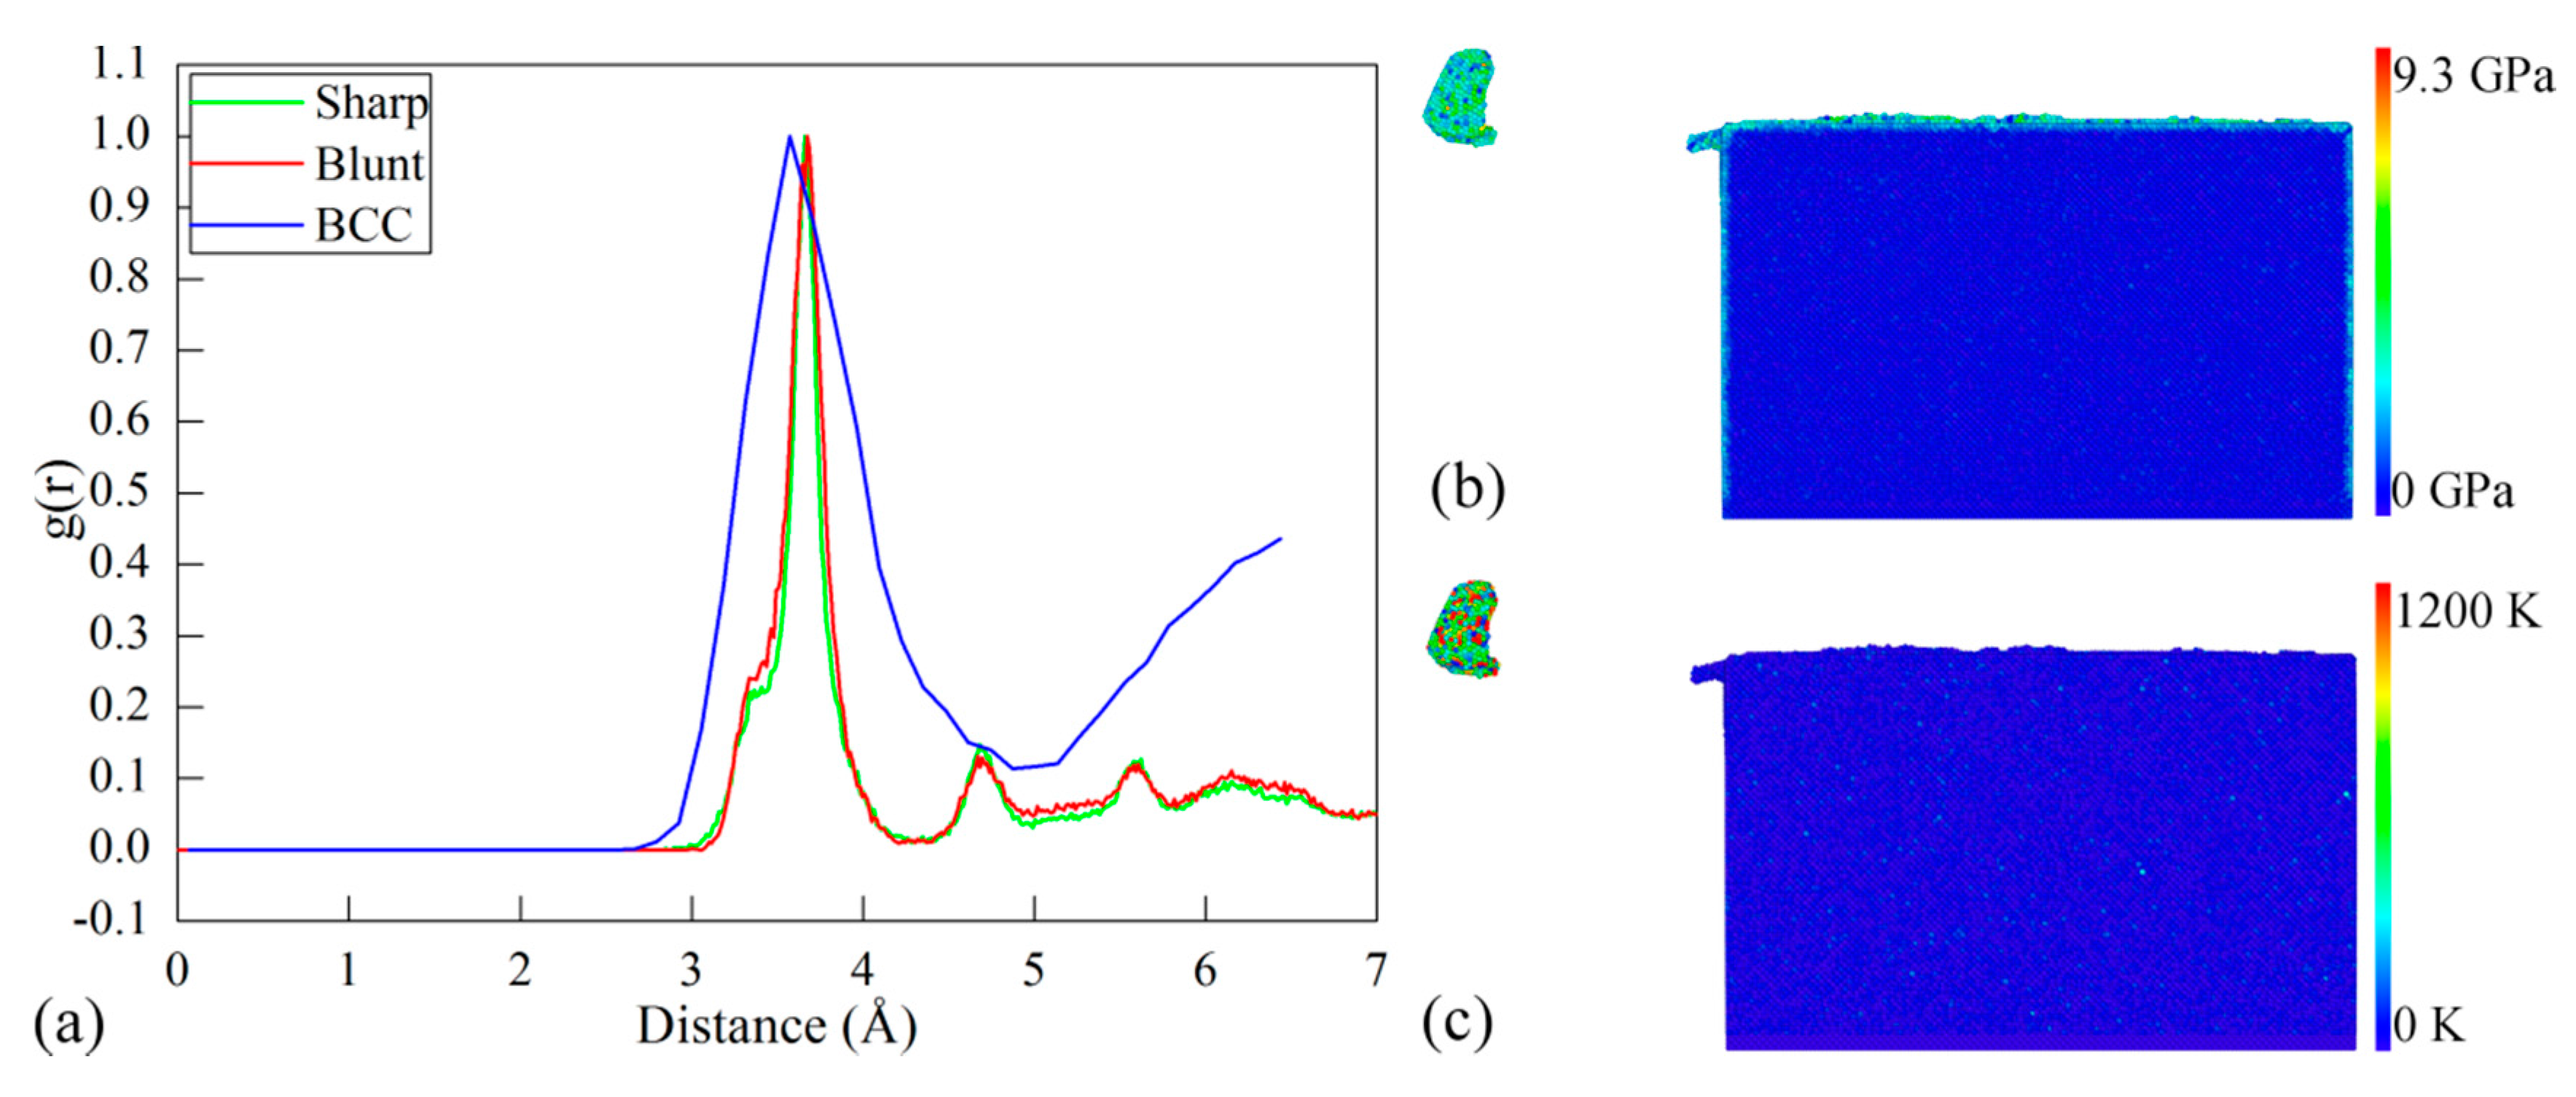
While the δ-Ce in the body-centered cubic (BCC) structure is stable at high temperature and low pressure, the γ→δ phase transformation may happen due to the high heat dissipation generated in the cutting process. In addition to dislocation slip, the propensity for phase transformation in the cutting processes with different types of cutting edge is also evaluated by examining the RDF evolution of the cerium workpiece. According to the CNA analysis of the machined workpiece, the ratio of other newly generated atoms except for FCC, hexagonal close-packed (HCP) and free surface atoms to the total atoms is 0.0004. The RDF analysis is performed on the defect zone that excludes FCC and HCP atoms, which is used to magnify the change of RDF peaks.
Figure 5a plots the RDF of the workpiece after cutting processes with the sharp and blunt cutting edges. Furthermore, the RDF of the δ-Ce is also presented for comparison. It can be seen from
Figure 5a that the sharp and blunt cutting edges yield similar RDF curves of the workpiece material. For each type of cutting edge, the first peak of the RDF curve of the machined surface closely coincides with that of the BCC cerium, indicating that there is phase transformation from γ-Ce to δ-Ce in the machined surface. Moreover, the RDF analysis on the formed chip also indicates that there is the same phase transformation from γ-Ce to δ-Ce in the chip.
Figure 5b,c present contours of workpiece colored by atomic stress and temperature. It is seen from
Figure 5b that although the highest stress approaches 9.3 GPa, the main part of the machined surface has a low stress of 2 GPa.
Figure 5c indicates that the atoms with the highest temperature of 1000–1200 K are overwhelmingly located in the formed chip. The highest stress and temperature formed in the cutting process coincide with the stable condition of δ-Ce [
11,
16,
20].
3.2. Influence of DOC
Diamond cutting simulations of single crystal cerium at different DOCs are conducted to address the influence of DOC on the cutting processes. For each DOC, the same diamond cutting tool with a blunt cutting edge radius of 2 nm is employed. Five DOCs: 0.2 (d1), 0.6 (d2), 1.0 (d3), 1.5 (d4) and 2.0 (d5) nm, are considered. Correspondingly, the ratio (R) of DOC (d) to cutting edge radius (r) is 0.1, 0.3, 0.5, 0.75 and 1.
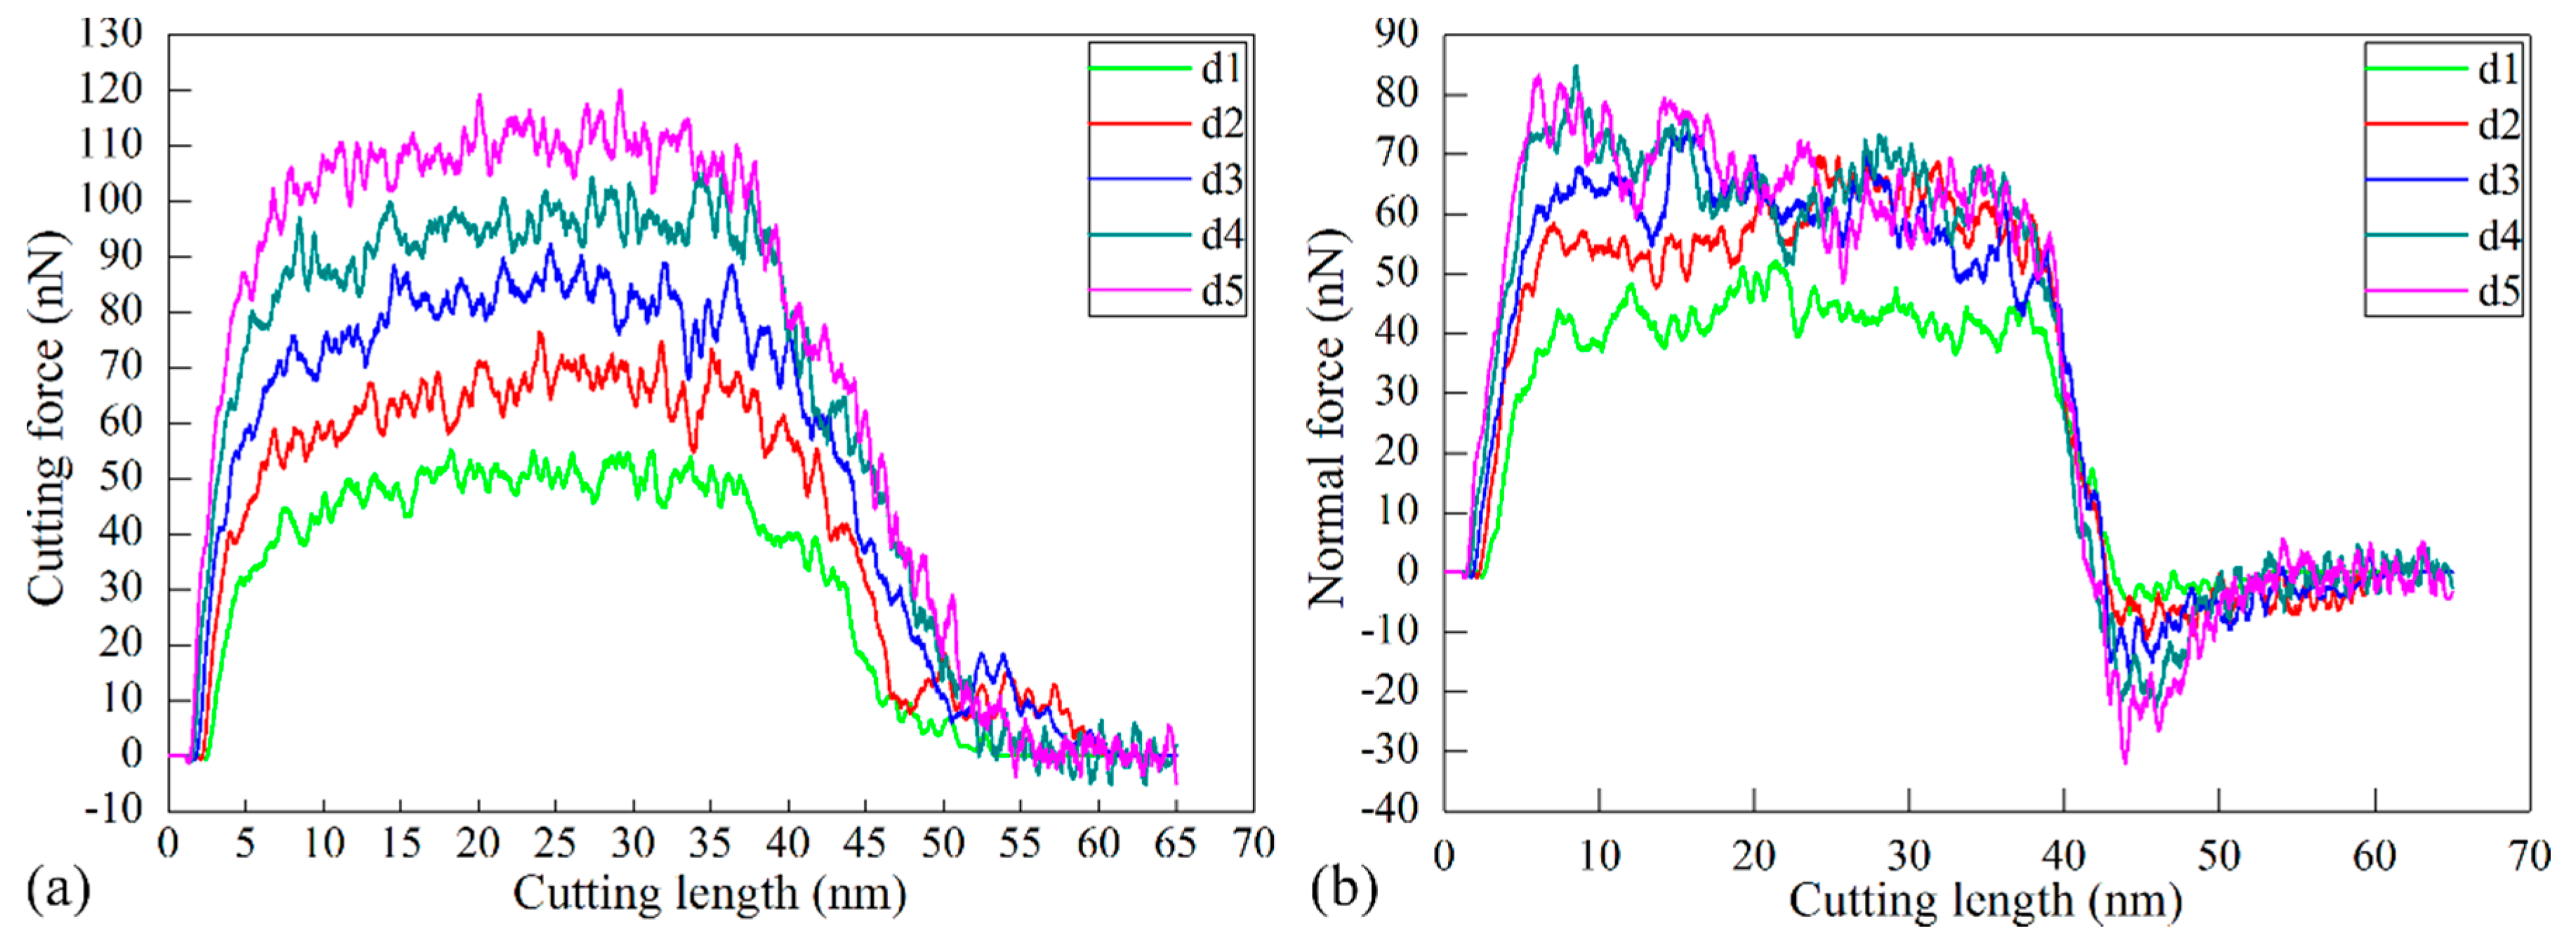
Figure 6a,b plot the variation of cutting force and normal force with cutting length in each cutting process. It is can be seen from
Figure 6 that the variation of the machining force for each DOC can be categorized into three zones, which is similar with the machining force for the DOC of 0.2 nm as described in the
Section 3.1. In the first zone that corresponds to a cutting length of 0–10 nm. The material undergoes elastic deformation accompanied with a rapid increase of the machining force. In the second zone, which corresponds to a cutting length of 10–35 nm, the machining force remains stable with fluctuations around constant values after elastic–plastic transition, indicating that the cutting process is stable. In the third zone, which corresponds to a cutting length of 35–65 nm, the machining force decreases rapidly due to the separation of the cutting tool from the workpiece.
Figure 6 also suggests that the DOC has a significant influence on machining force variations.
Figure 6a shows that in the first and second zones, the value of the cutting force is monotonously higher for a higher DOC. In the cutting length ranging from 10 to 35 nm, the average values of both cutting force and normal force increase with increasing
R. Furthermore, the ratio of cutting force to normal force also increases with increasing
R.
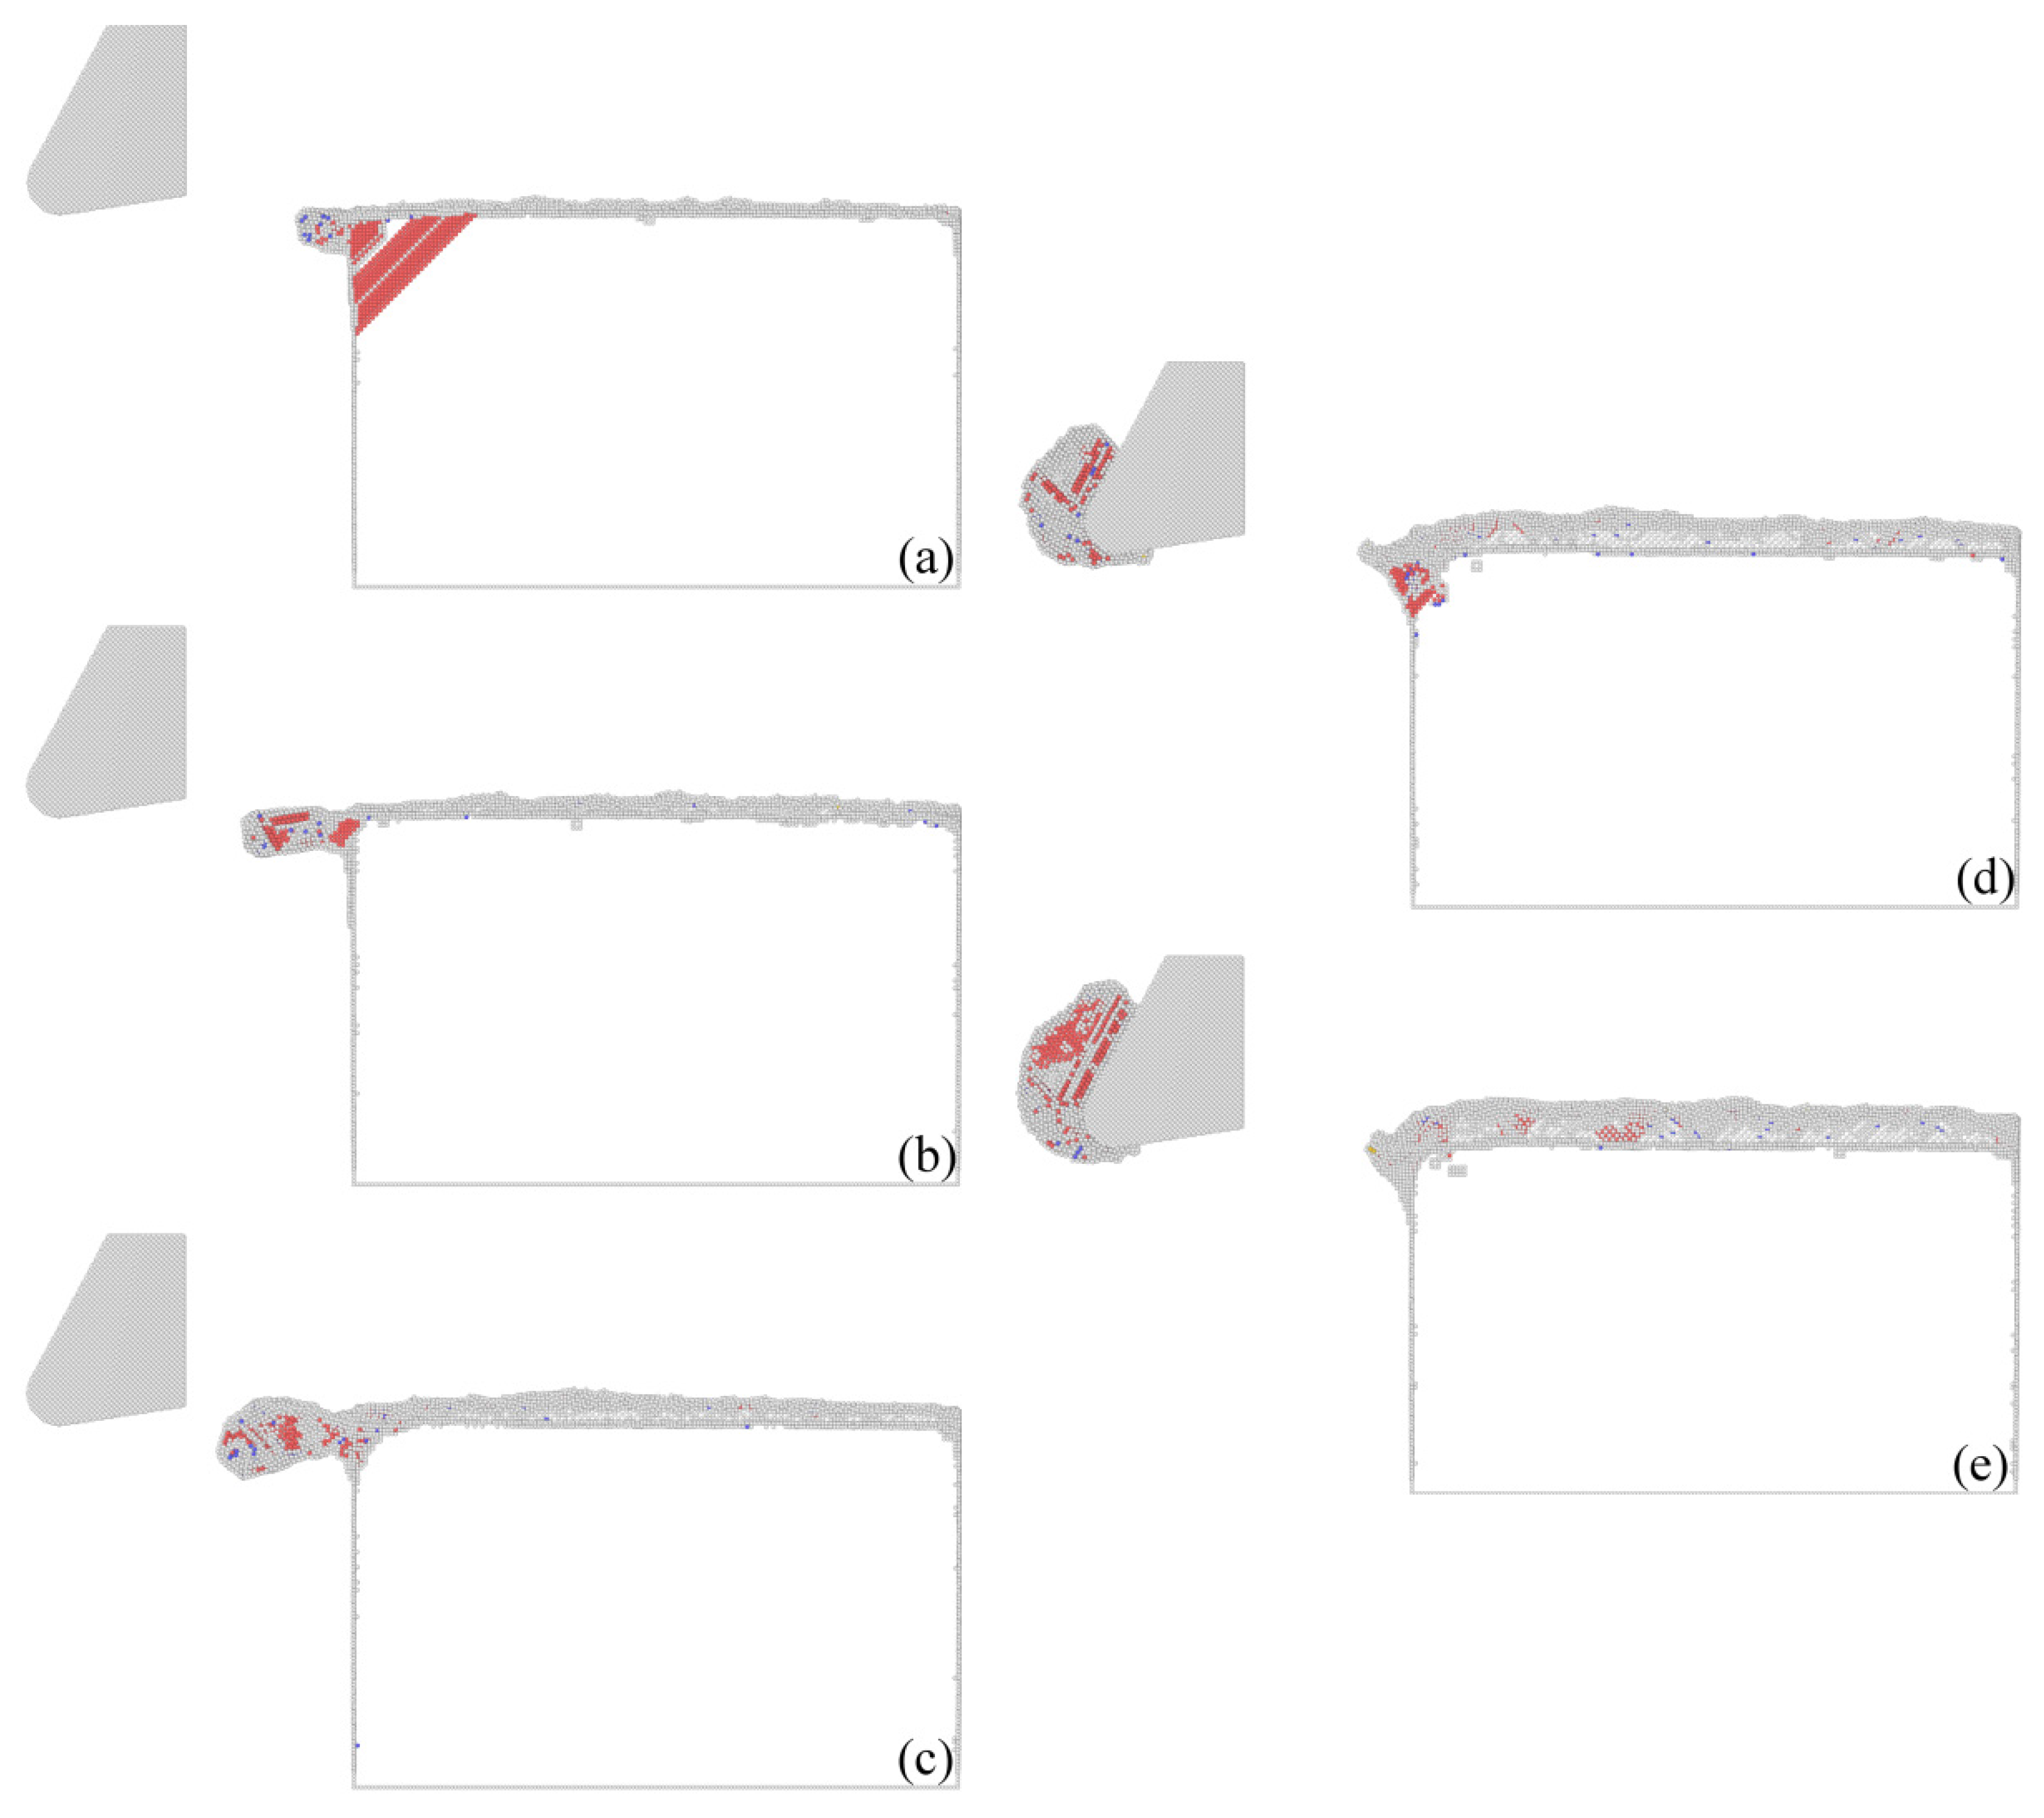
Figure 7 presents cross-sectional views of instantaneous defect structures within materials after cutting processes with different DOCs. It can be found that there is no chip formed for any DOC that is no larger than d3. Furthermore, dislocation density within the workpiece material decreases with the increase of DOC. In contrast, there is a chip formed for d4 or d5. Furthermore, there are considerable dislocations in the formed chip. However, there is rather limited dislocation beneath the machined surface, which demonstrates that the formation of the chip lowers the dislocation density within the workpiece material.
Figure 7 indicates that there is a transition of material removal mechanisms from plowing to cutting with the increase of DOC. The observed DOC-dependent material removal mode is in agreement with previous studies [
21,
22,
23].
Figure 7 shows that when the DOC is 0.2 nm, there is a rather limited defect formed within the workpiece material when the cutting process is stable. However, when the cutting tool is very close to separating from the workpiece material, a slip plan that is inclined to the adjacent left free surfaces is activated due to strong stress concentration built in the intersections of the free surfaces. Although there is no chip formed for the DOC of 0.2 nm, there is little machining debris formed in the left side of the workpiece. When the DOC is 0.6 or 1 nm, there are considerable dislocations generated in the workpiece material, but the dislocation density is less than that for the DOC of 0.2 nm. Furthermore, there is still no chip formed, although the extent of the machining debris is increased. There are chips formed for the DOC of 1.5 or 2 nm, at which there are also dislocations on both sides of the groove. Furthermore, the chip volume and dislocation density increase with the increase of DOC.
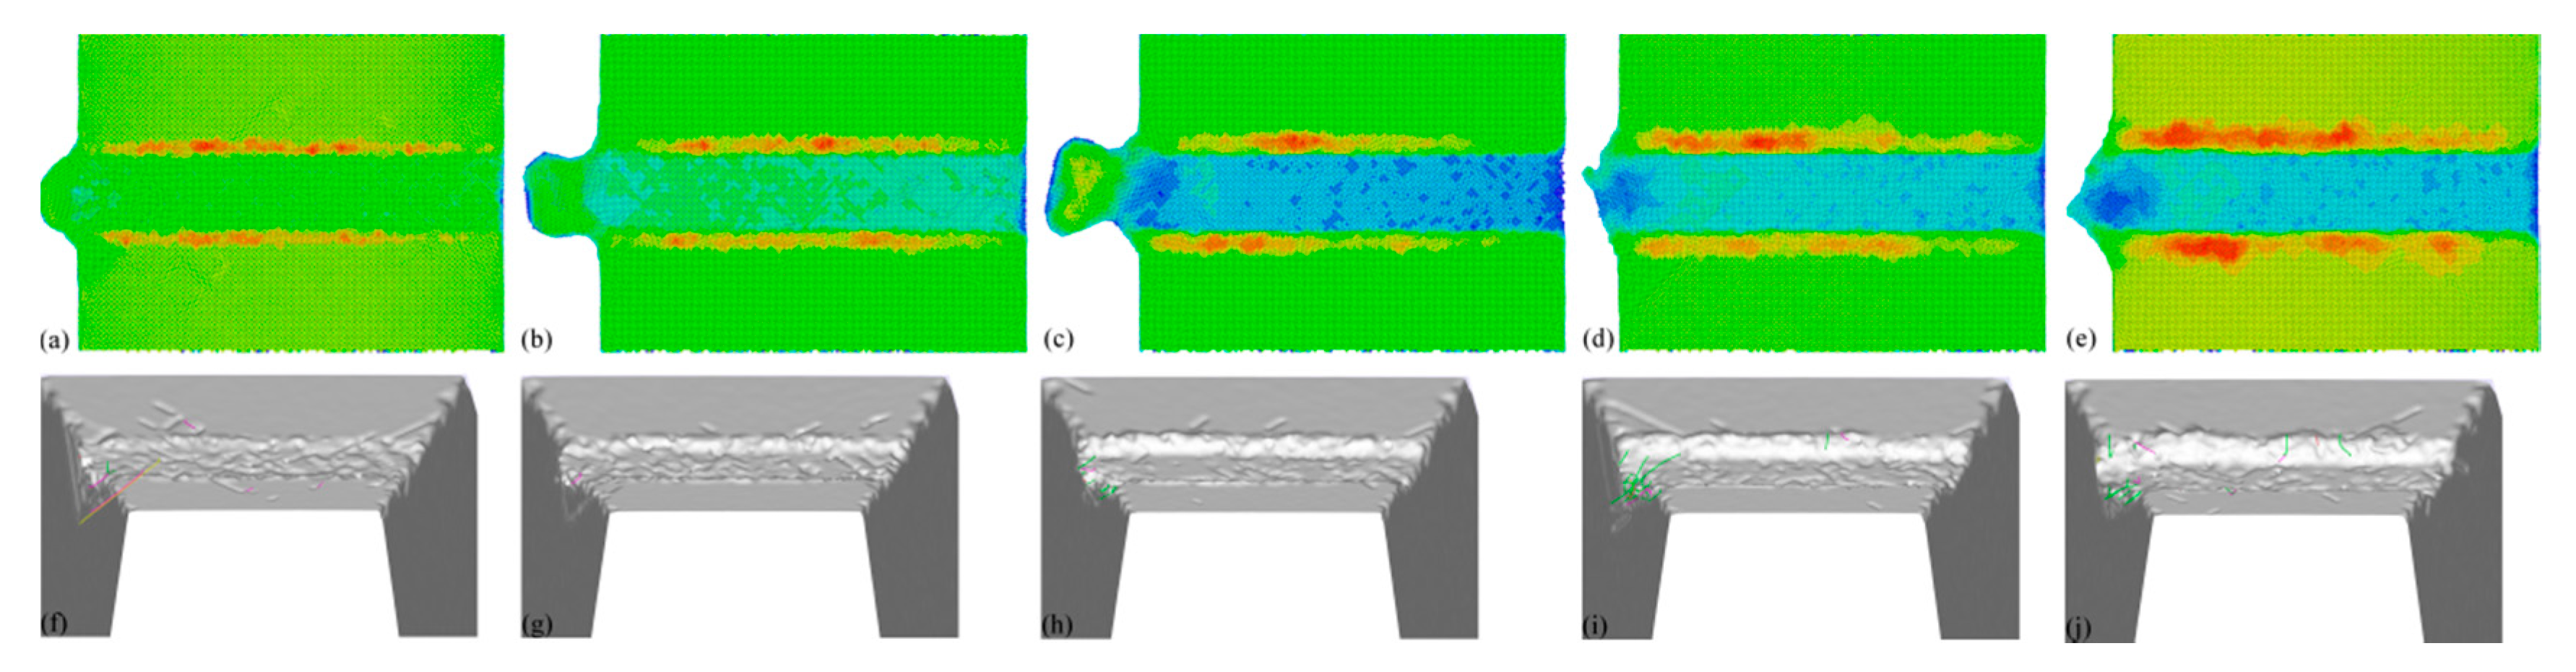
Figure 8 presents machined surface morphologies for different DOCs. While the material removal for DOCs no higher than d3 is dominated by plowing,
Figure 6a–c show that displaced material is mainly accumulated on both sides of the formed groove, and cutting debris is also observed in the end of the workpiece. It is found that both the volume of surface pile up and the volume of debris are larger for higher DOCs. For DOCs higher than d3, there is also considerable surface pile up formed on both sides of the groove, although materials are mainly removed in the form of chip.
Figure 8 also presents characterized dislocation structures within the workpiece material with different DOCs. It can be found that when the DOC is no larger than d3, dislocation mainly resides on the end of workpiece, and dislocation density is less than that at d4 or d5.
When the DOC is smaller than the cutting edge radius, the effective rake angle involved in the cutting process is always negative, which means that the compression stress applied by the cutting tool leads to extrusion of the displaced workpiece in the form of plowing, which consequently results in non-uniform material removal. With the increase of DOC, the effective negative rake angle is also increased, thus leading to decreased compress stress and increased shear stress. Consequently, uniform material removal can be achieved in the form of cutting, which leads to uniform machined surface quality. Upon further increase of DOC, however, the machined surface quality deteriorates due to serious plastic deformation in the material. The critical DOC for the transition of material removal mode from plowing to cutting at microscopic scale can be calculated analytically based on the geometry of the cutting tool. For a spherical tool with cutting edge radius (
r) sliding on a flat substrate at a DOC (
d), the critical depth (
dc) for transition is given as [
24]:
where μ is the coefficient of friction at the sliding interface. For a μ in the range of 0–1, the derived critical depth
dc is in good agreement with the simulation results.
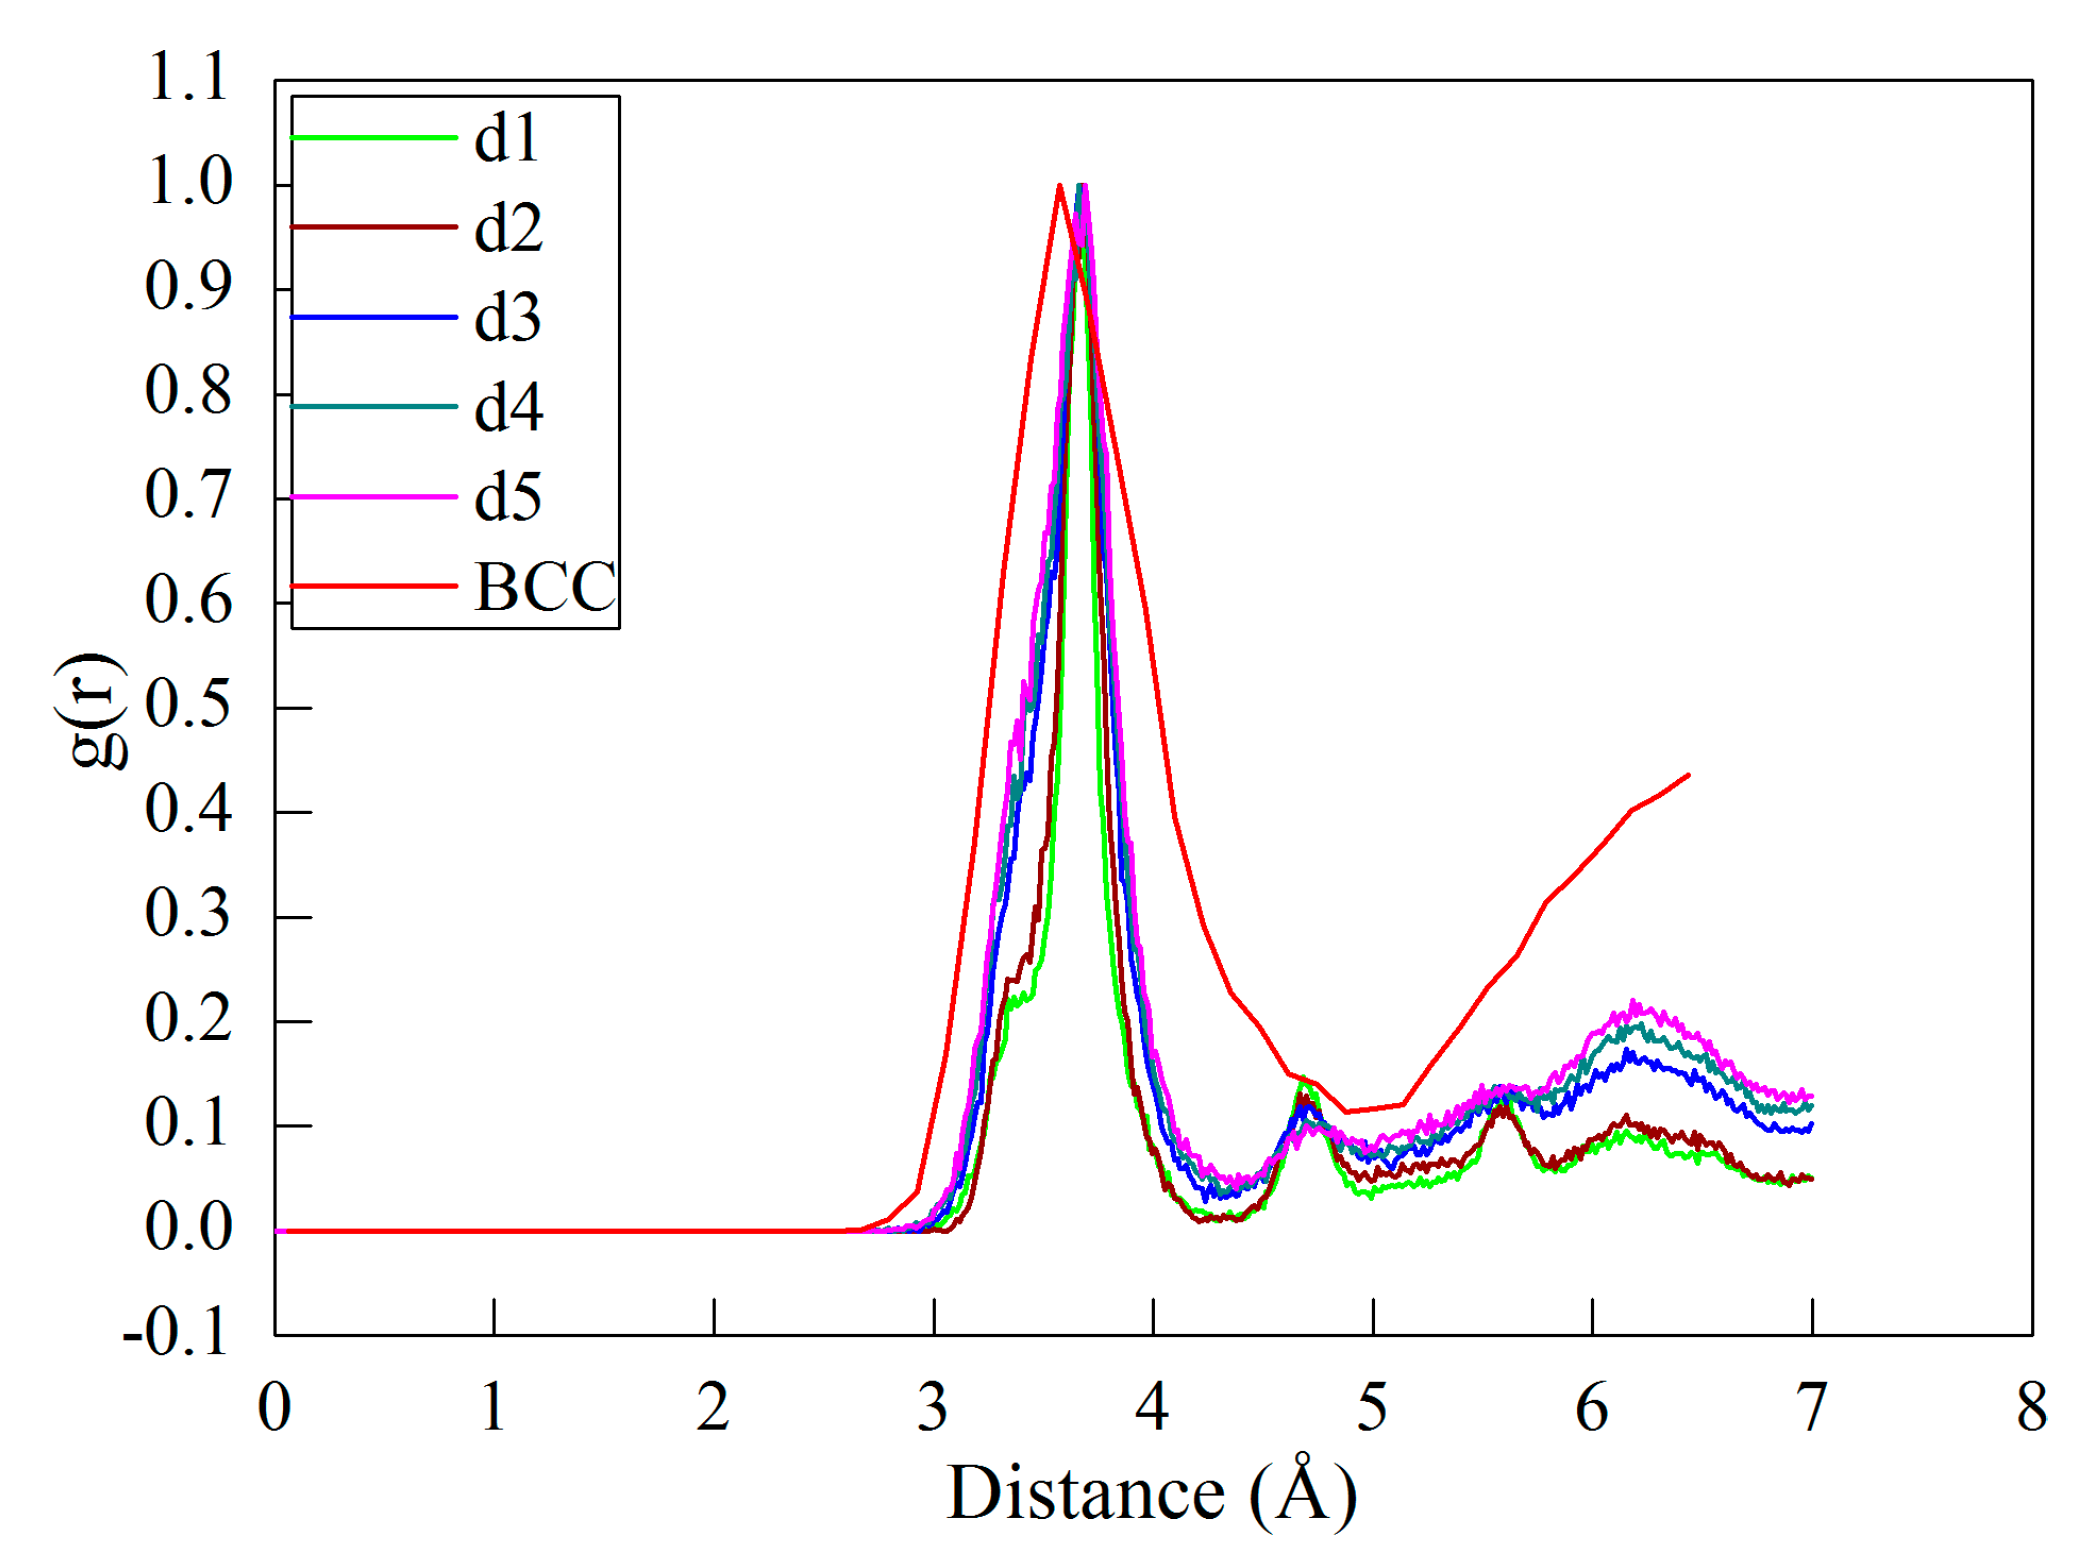
In addition to dislocation slip-dominated plasticity, the influence of DOC on the propensity of phase transformation in the diamond cutting process of cerium is also evaluated by performing RDF analysis on the workpiece.
Figure 9 plots the RDF of the machined workpiece at different DOCs, and the RDF of the δ-Ce is also provided for reference. It is seen from
Figure 9 that each DOC yields a similar RDF curve of the workpiece material. Furthermore, the first peak of the RDF curve of the machined surface with each DOC closely coincides with that of the BCC cerium, indicating that there is phase transformation from γ-Ce to δ-Ce in the machined surface. In particular for d4 and d5, corresponding to the cutting mode of material removal, there is the same phase transformation from γ-Ce to δ-Ce occurred in the formed chip.
Figure 9 also indicates that the DOC slightly influences the propensity for phase transformation. With the increase of DOC, the intensity of the RDF peaks increases, indicating that the propensity for phase transformation from γ-Ce to δ-Ce increases.
3.3. Diamond Cutting Experiments
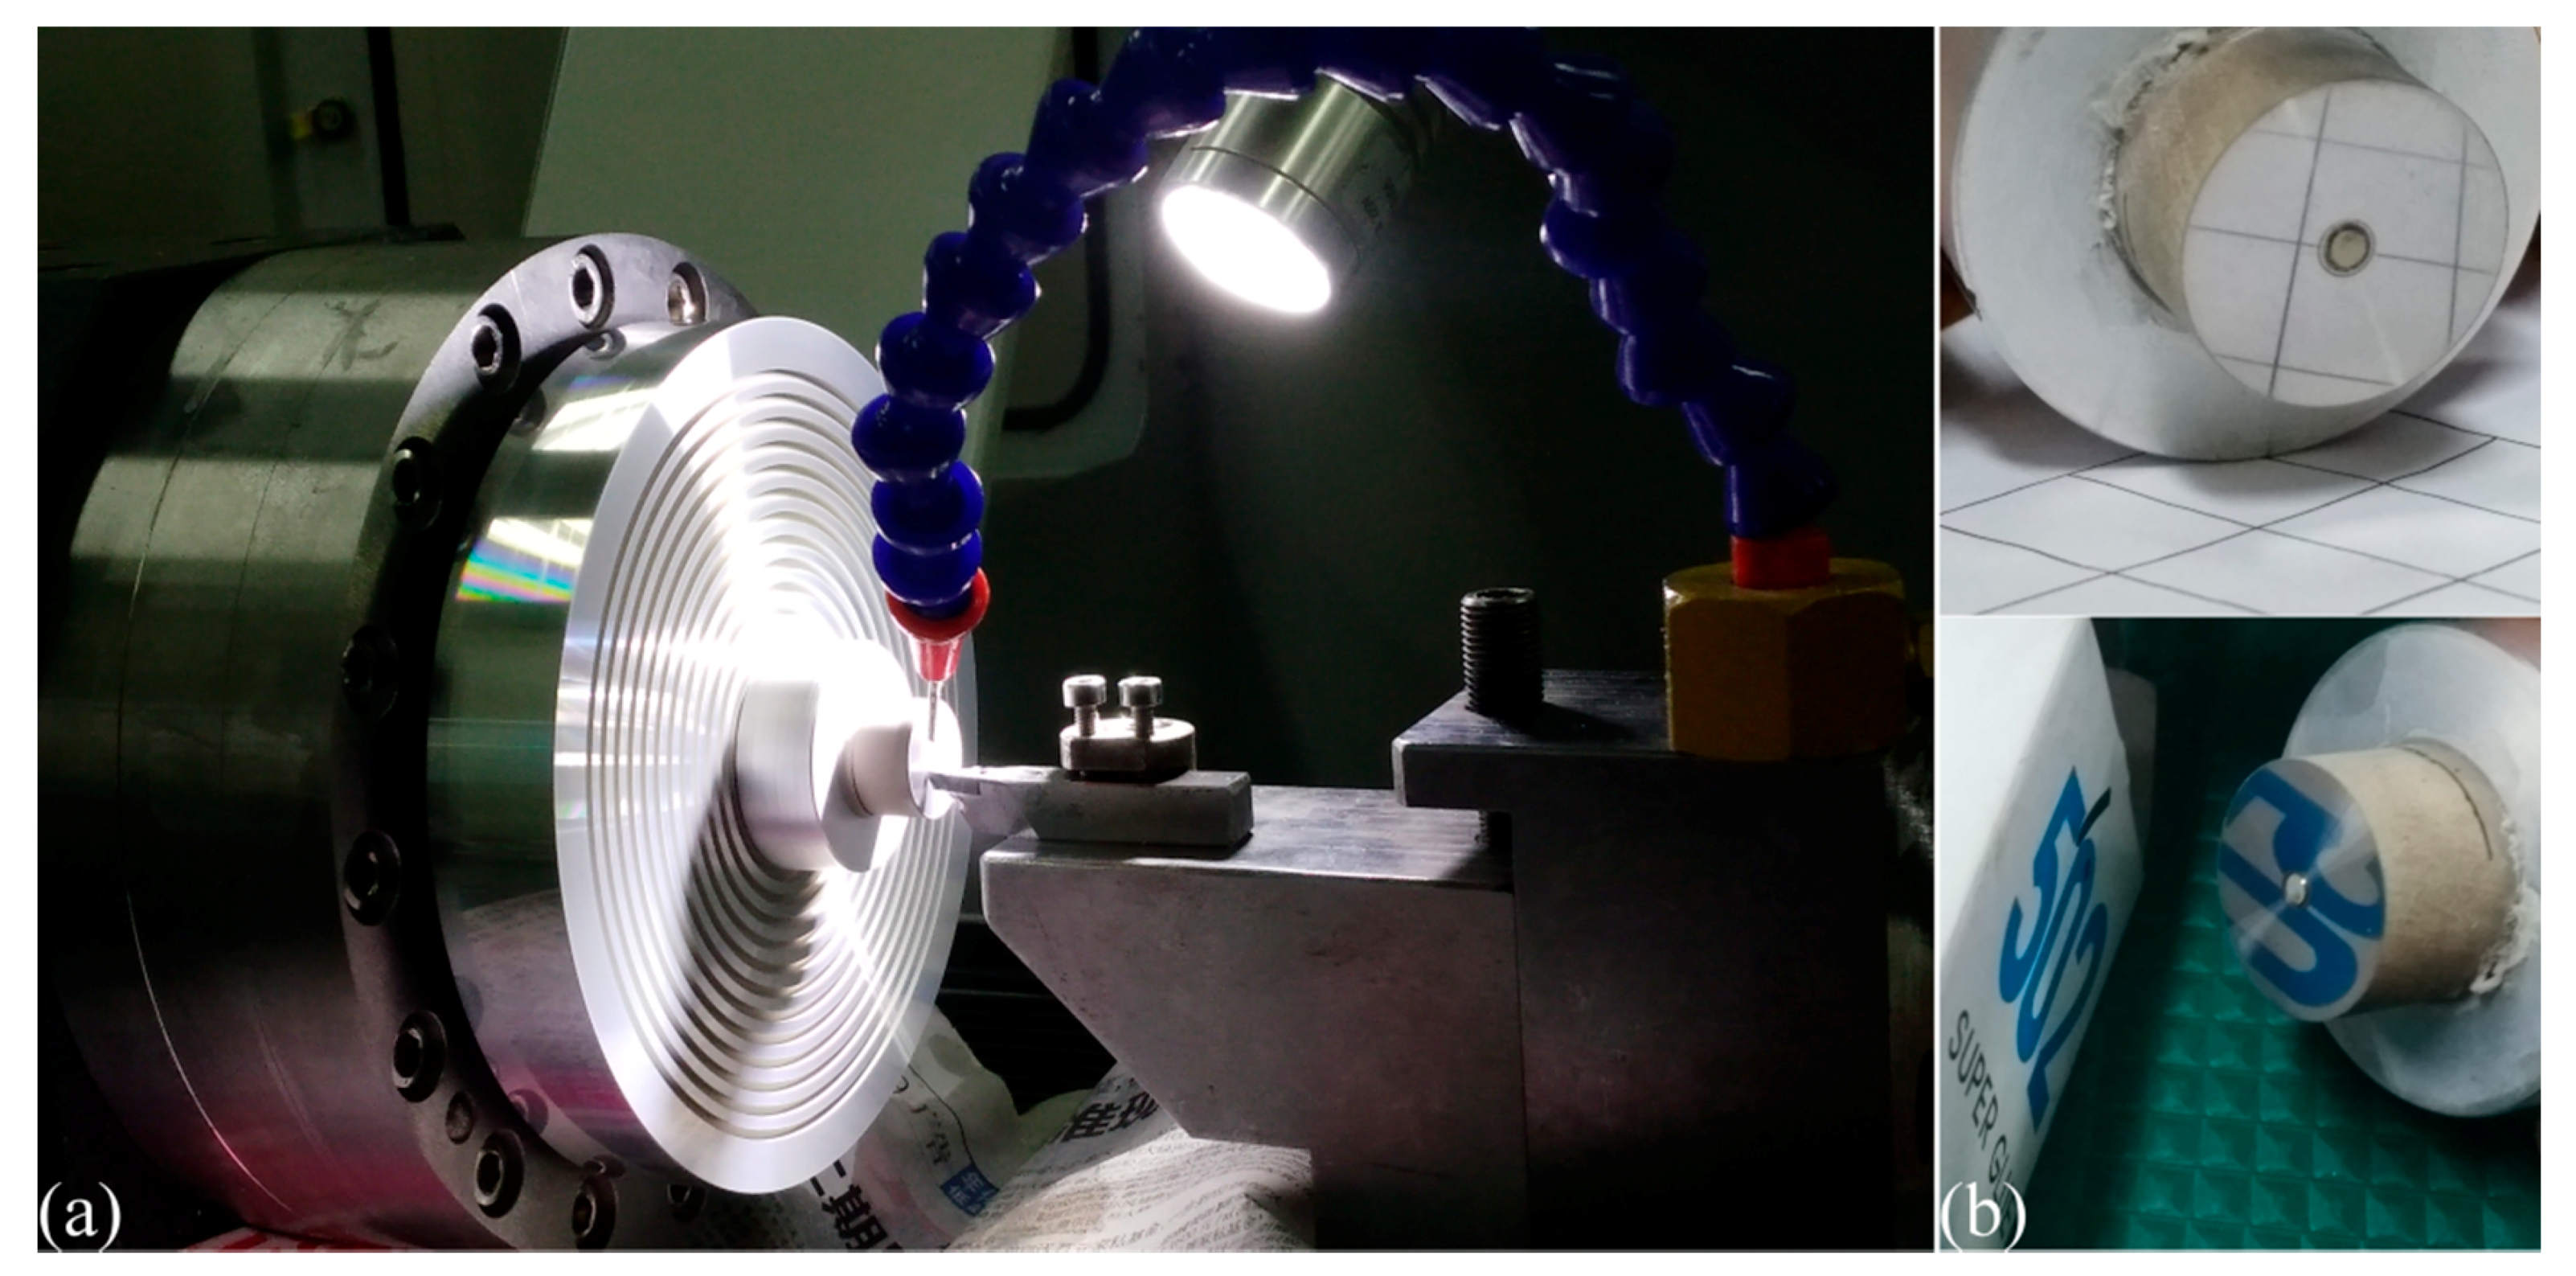
Diamond cutting experiments of cerium with different DOCs are also carried out on a home-made NanoForm ultra-precision diamond turning lathe. The detailed configuration of this diamond cutting experiment is shown in
Figure 10a. The 99.5% purity cerium workpiece has a cylinder shape with a diameter of 20 mm. The diamond cutting tool has a nose radius of 1 mm and a cutting edge radius of 60 nm. The diamond cutting tool has a rake angle of 0° and a clearance angle of 9°. The utilized spindle speed is 1000 rpm and the feed rate is 1 μm/rev. Prior to the formal cutting, a pre-cutting with a DOC of 10 μm is conducted to remove the oxide layer on the cerium workpiece. To address the influence of DOC on the diamond cutting of the cerium workpiece, four DOCs of 2, 5, 10 and 15 μm are considered. For each DOC, the machined surface quality of the cerium workpiece is characterized by a surface profiler and an atomic force microscope (AFM).
Figure 10b presents the machined surface obtained with the DOC of 5 μm, which shows that a mirror surface with considerable reflectance is achieved on the cerium workpiece.
Table 1 lists the machined surface quality in terms of surface roughness (
Ra) for the four DOCs, which indicates that a good surface quality can be achieved at a DOC of 5 or 10 μm. The surface quality for the smallest DOC of 2 μm is not good as the
Ra is 133.2 nm. With an increase of DOC to 5 μm, the Ra is reduced to 46.2 nm, indicating that the surface quality is significantly improved. The surface quality is further refined at a DOC of 10 μm, at which the
Ra is 37.6 nm. With a further increase of DOC to 15 μm, however, the machined surface quality deteriorates as the
Ra is 64.1 nm.
Table 1 demonstrates that the DOC-dependent surface roughness measured by the AFM is generally consistent with that obtained by the surface profiler.
Table 1 also shows that the measured results by the AFM are smaller than those of the surface profiler for each DOC, due to a smaller measurement area.
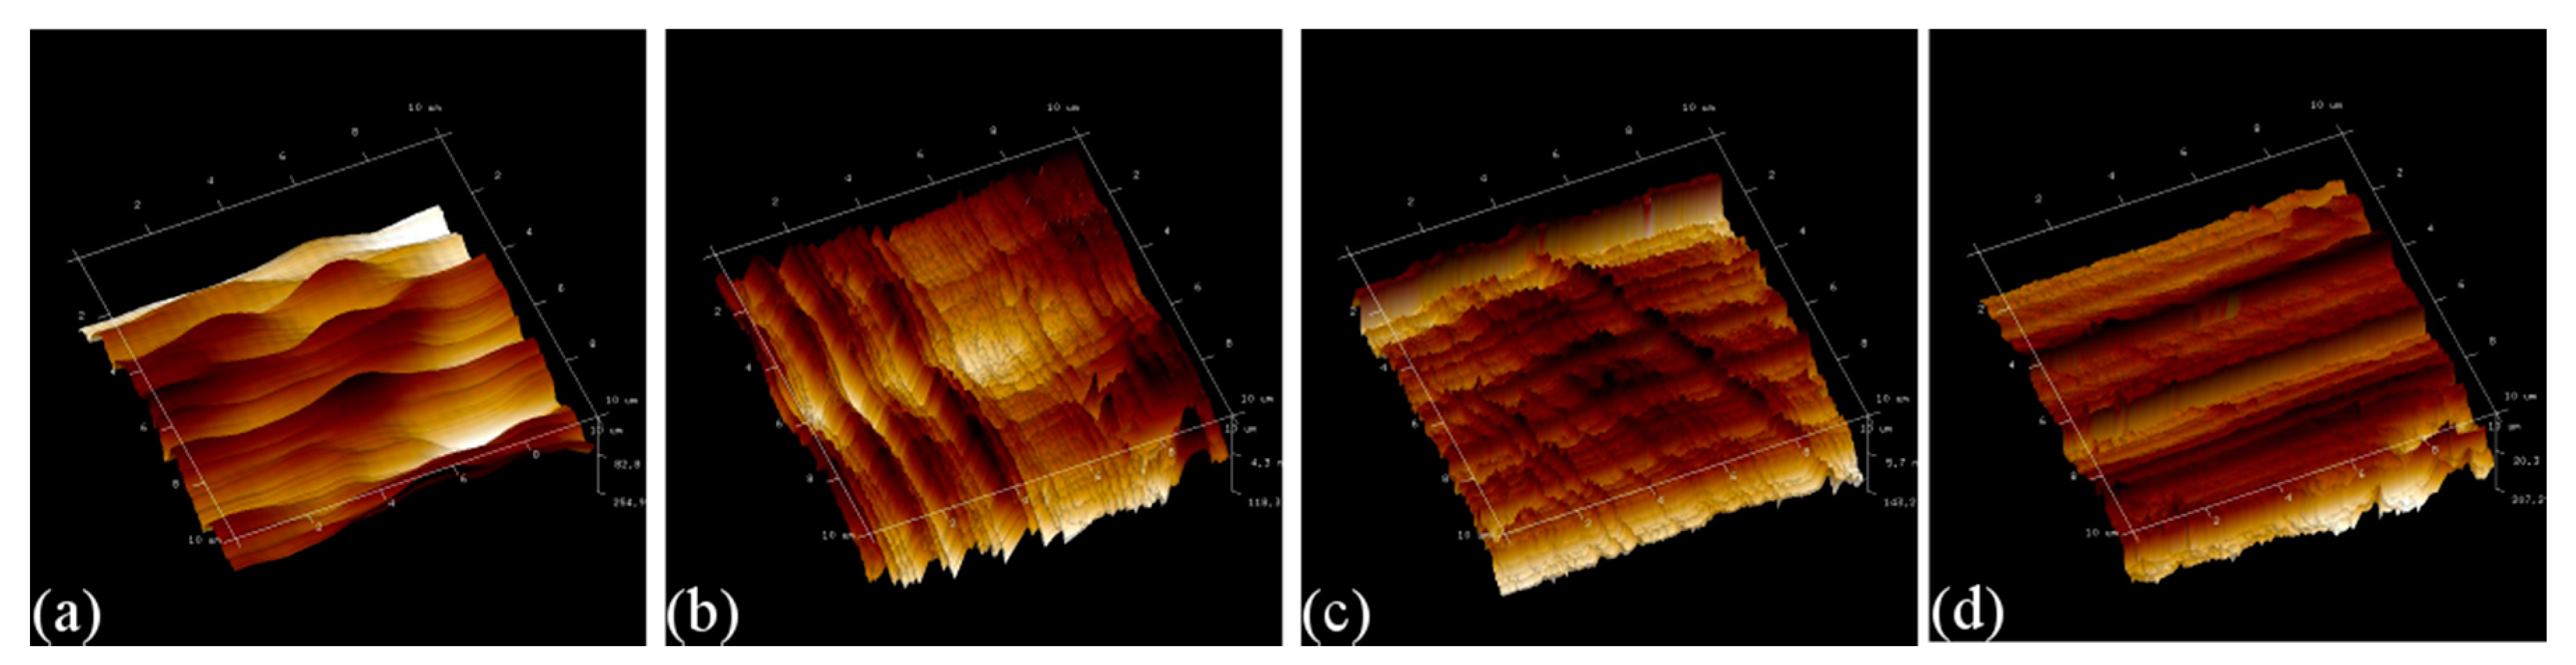
Figure 11 presents AFM images of the four machined surface obtained with different DOCs. It is found that for the DOC of 2 μm, the resulting surface is not uniform due to non-continuous material removal. Consequently, the value of surface roughness of the machined surface is high. With the increase of DOC, the propensity of continuous material removal is increased, thus a uniform machined surface quality with a decreased value of surface roughness is achieved. However, at the largest DOC, there are obvious tool marks remaining on the machined surface, and the resulting value of surface roughness is also high. It is known that plowing leads to non-continuous material removal, and cutting is desirable for achieving a high quality of machined surface due to continuous material removal in terms of chip formation [
21]. Therefore,
Figure 11 indicates that there is a transition of dominant material removal from plowing to cutting with the increase of DOC, which qualitatively agrees well with the results of MD simulations.


