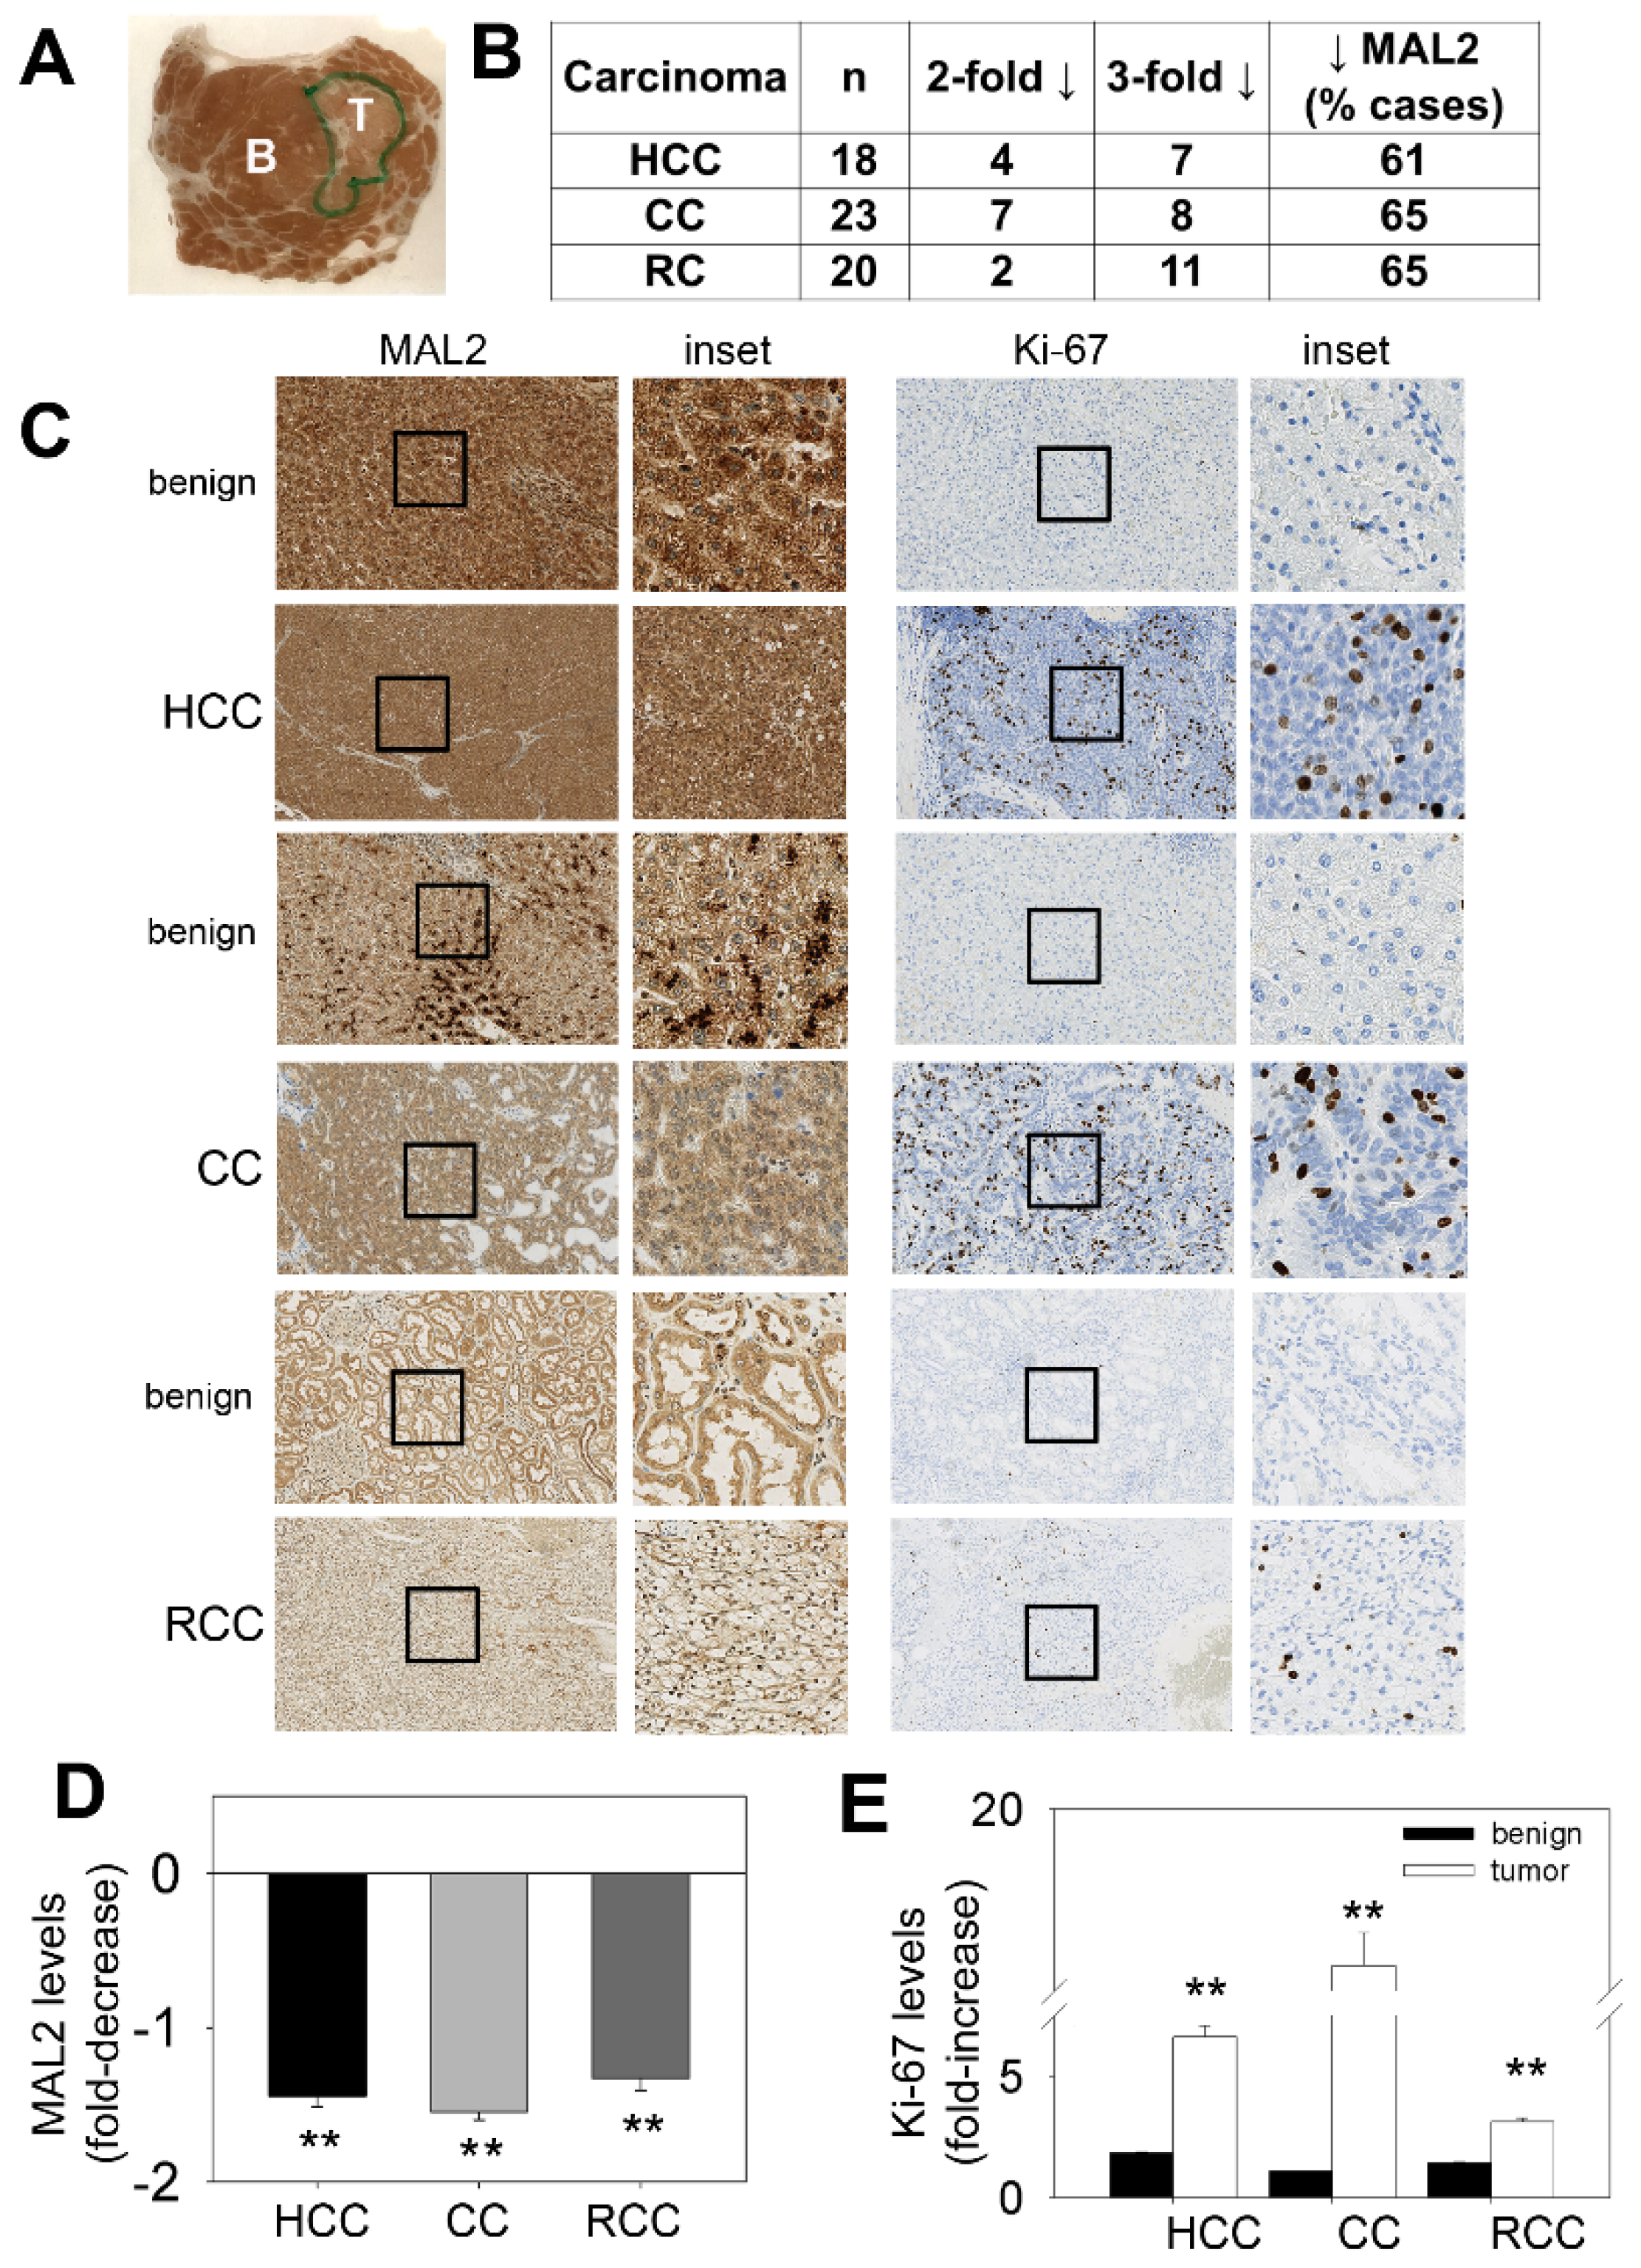
Figure 1.
MAL2 expression patterns in human cancer tissue are consistent with its role as a tumor suppressor. (A) A liver biopsy was immunostained with diagnostically validated MAL2 antibodies. An unmagnified image of the biopsy mounted on the slide is shown. The areas containing the benign (B) and tumor (T) components are indicated. (B) Tumors from hepatocellular carcinoma (HCC), cholangiocarcinoma (CC) and renal cell carcinoma (RCC) biopsies were scored for MAL2 expression. Numbers of patient tumor samples that displayed 2- or 3-fold decreases in MAL2 protein expression are indicated. The total number of cases examined is shown (n) and the percent of cases examined that displayed decreased MAL2 protein expression is indicated. (C) Benign and cancerous lesions from human tissues from HCC, CC and RCC as indicated were immunostained with diagnostically validated MAL2 and Ki-67 antibodies. The black boxes indicate the regions of the micrograph enlarged insets. The fold-decrease in MAL2 expression (D) and fold-increase in Ki-67 expression (E) in cancerous lesions relative to benign across all patient biopsies are plotted. Values represent the mean ± SEM from 18 HCC patients, 23 CC patients and 20 RCC patients. ** p ≤ 0.001.
![Cancers 12 00422 g001]()
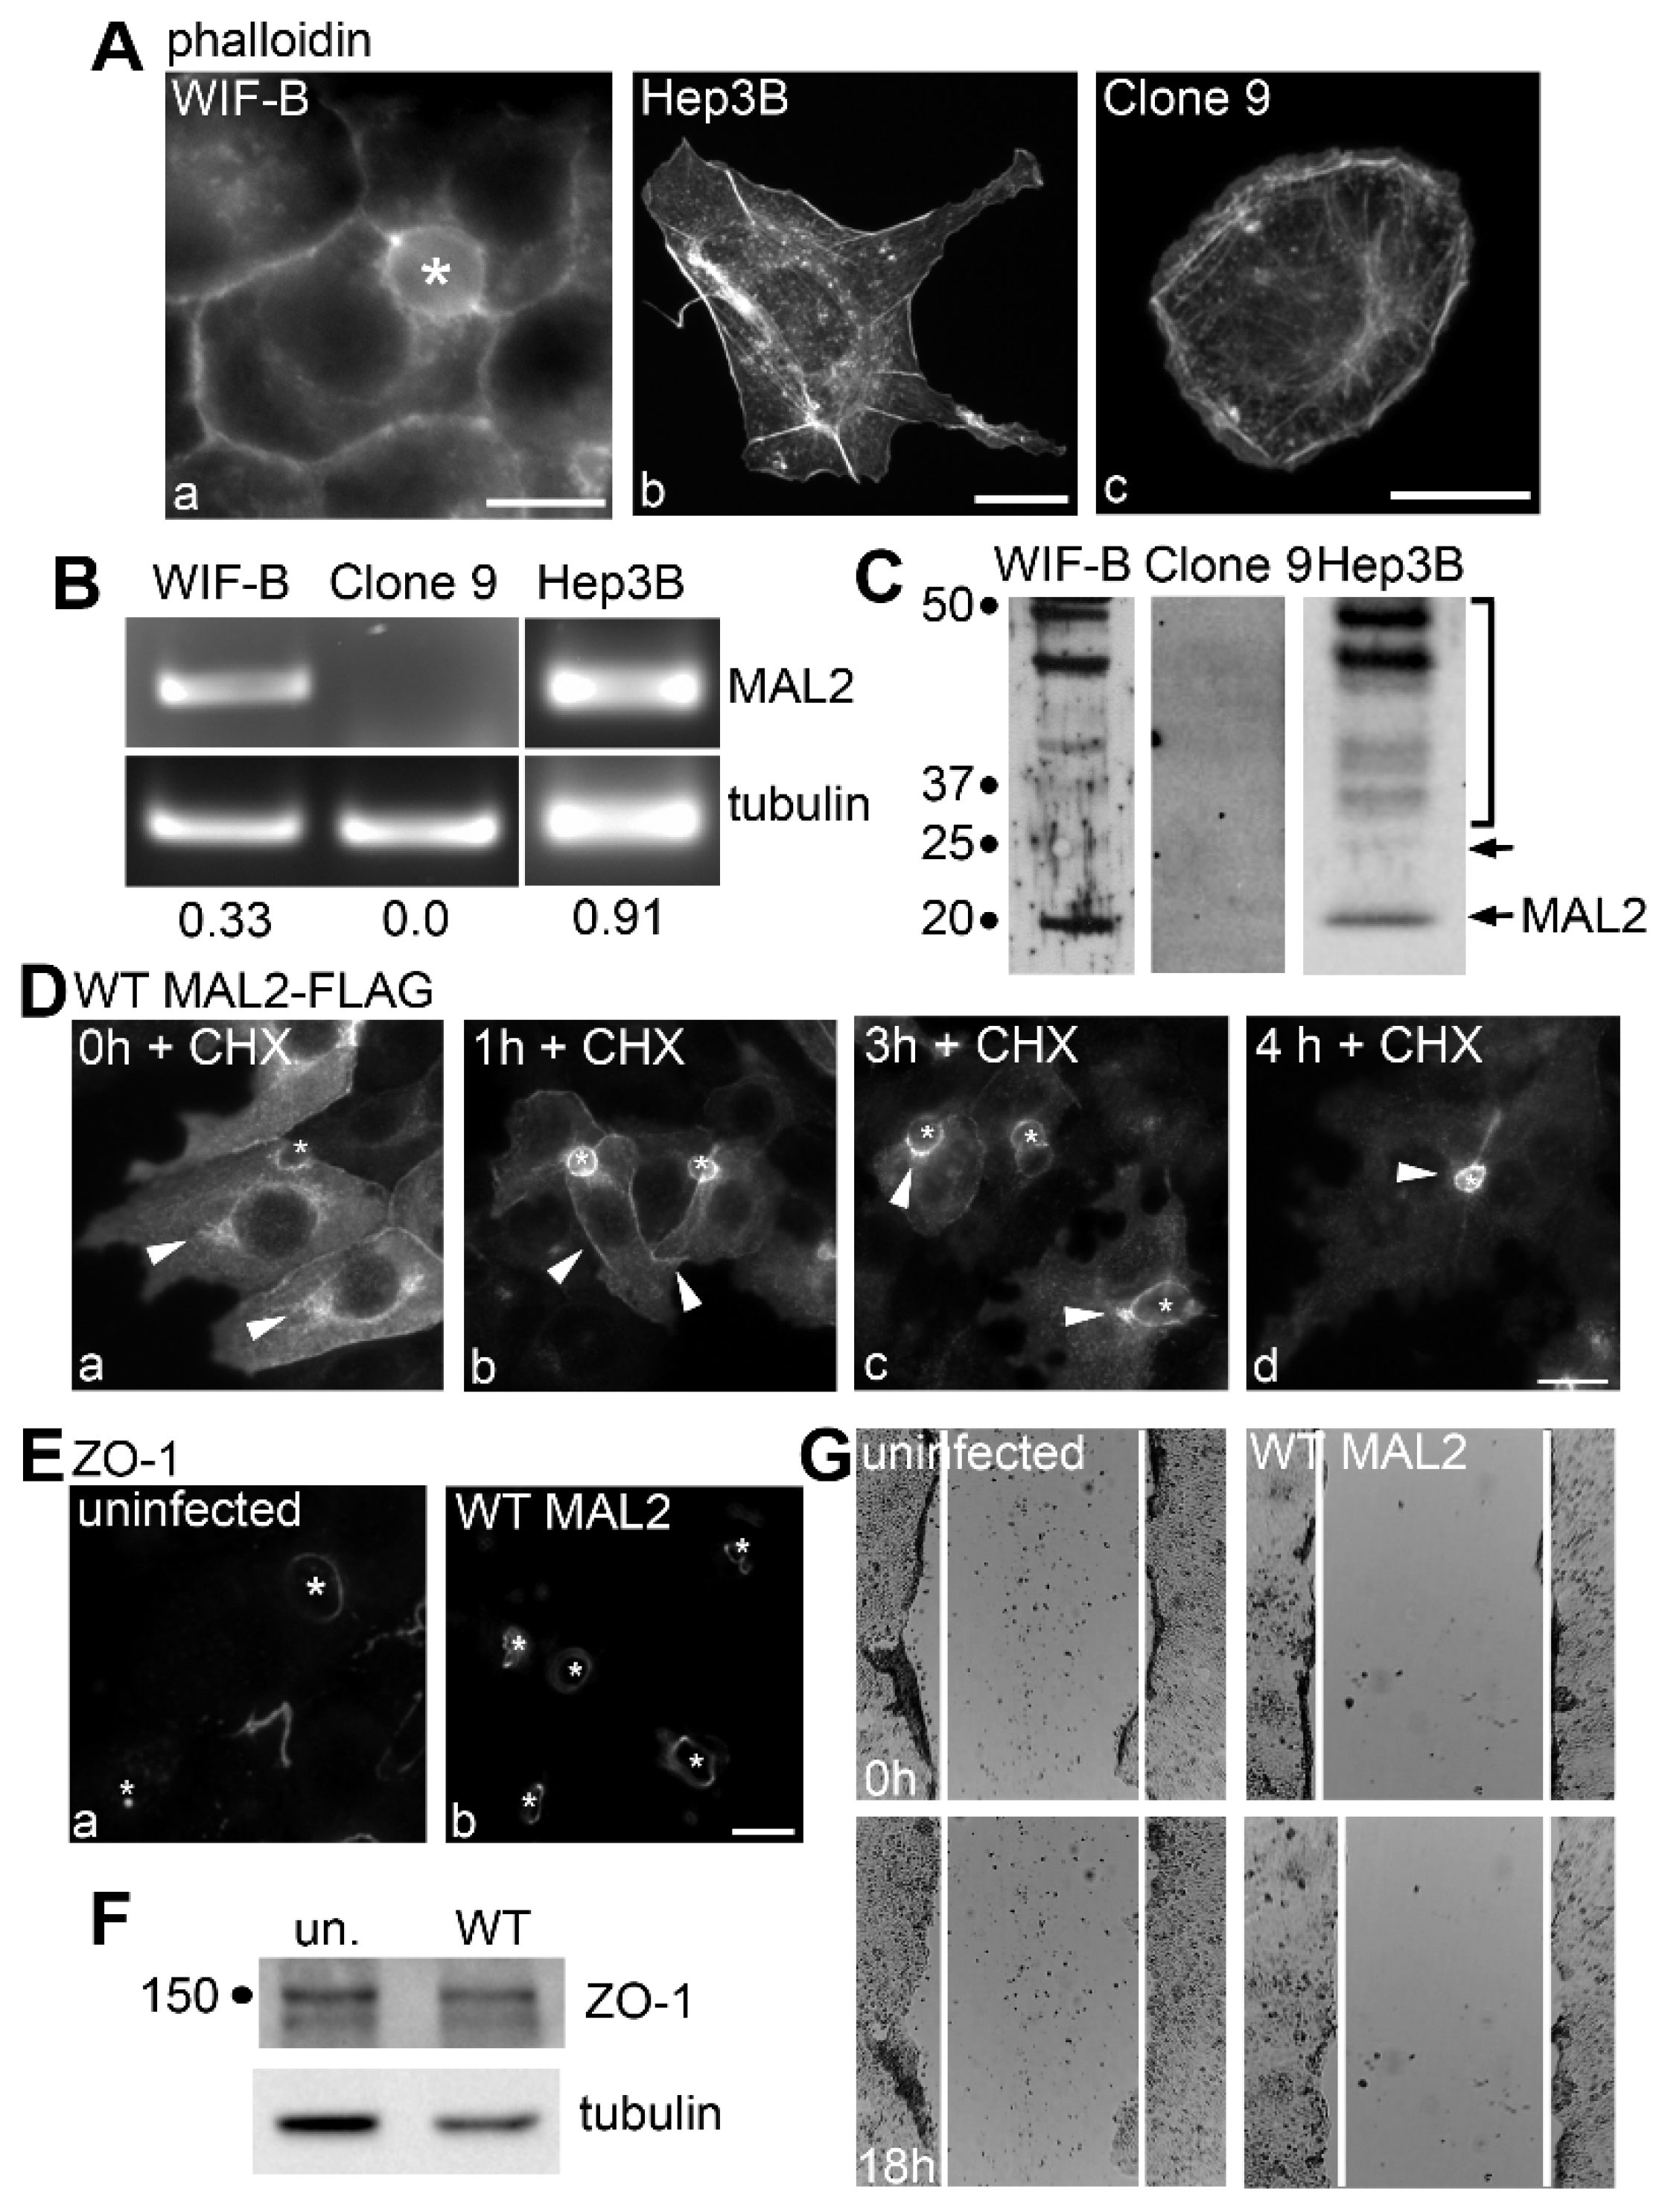
Figure 2.
MAL2 is expressed in normal and malignant liver-derived cell lines, but simply overexpressing MAL2 in polarized WIF-B cells is not oncogenic. (A) WIF-B (a), Hep3B (b) and Clone 9 cells (c) were labeled for actin with phalloidin. (B) Agarose gels are shown of MAL2 (upper panels) and α-tubulin (lower panels) cDNA amplified by RT-PCR from 1 µg total RNA isolated from WIF-B, Clone 9 or Hep3B cells as indicated. Human-specific MAL2 and α-tubulin primers were used for Hep3B cell amplification while rat-specific primers were used for WIF-B and Clone 9 cells. Numbers below the lanes represent the ratio of MAL2 mRNA expression levels normalized to α-tubulin expression levels. (C) Lysates from WIF-B and Clone 9 cells were immunoblotted with antibodies specific for rat MAL2 and lysates from Hep3B cells were immunoblotted for human MAL2. Molecular weight standards are indicated on the left in kDa. The bottom arrow marks the predicted 19 kDa MAL2 immunoreactive species. The bracket highlights a diffuse set of bands that has been described by us and others and the upper arrow indicates a 25 kDa species also detected by others. (D) WIF-B cells expressing FLAG-tagged wild type (WT) MAL2 were treated with 50 µg/mL of cycloheximide (CHX) for up to 4 h as indicated and immunolabeled for MAL2 with anti-FLAG antibodies. Arrowheads indicate MAL2 localization at the Golgi (a), basolateral membrane (b) SAC (c) or apical surface (d). Asterisks mark bile canaliculi. (E) Uninfected WIF-B cells and cells overexpressing wild type MAL2 were immunolabeled for ZO-1. Asterisks indicate bile canaliculi. (F) Lysates from uninfected or MAL2-overexpressing cells were immunolabeled for ZO-1 and tubulin as indicated. Molecular weight standards are indicated on the left in kDa. (G) Uninfected WIF-B cells or cells overexpressing MAL2 were subjected to a scratch assay. Wound healing was analyzed 0 h (upper panels) and 18 h (lower panels) after the scratch. White lines indicate the edges of the gap. Bar = 10 µm.
![Cancers 12 00422 g002]()
Figure 3.
MAL2 knockdown in Hep3B cells enhances cell migration. (
A) Lysates from uninfected (un) Hep3B cells or cells knocked down (KD) for MAL2 expression with anti-sense MAL2 recombinant adenoviruses for 4 days were immunoblotted for endogenous MAL2 or tubulin. Molecular weight markers are indicated on the left in kDa. A ~30% reduction in MAL2 levels was observed. (
B) Wound healing was imaged at 0 and 18 h post-scratch. White lines indicate the border of the monolayer along the scratch. Boxed areas were enlarged and shown in
Figure 4A. (
C) The gap area remaining relative to the initial scratch area was determined 0, 6 (
p ≤ 0.013), 12 (
p ≤ 0.014) and 18 h (
p ≤ 0.002) after recovery. The values represent the average ± SEM determined from at least three independent experiments.
Figure 4.
MAL2 expression in Hep3B cells correlates with actin-based protrusion formation. (
A) The boxed areas from
Figure 3B were enlarged. Arrowheads indicate long protrusions present in uninfected migrating cells that were lost in cells knocked down for MAL2 expression (MAL2 KD). (
B) Uninfected cells and cells knocked down for MAL2 at the migrating edge were double-labeled for MAL2 (with anti-FLAG antibodies) and actin (with phalloidin). Arrowheads in panels a and b indicate long, MAL2- and actin-positive protrusions present in uninfected migrating cells whereas arrowheads in c and d point out the smooth surfaces in migrating cells knocked down for MAL2 expression. (
C) Cells from Part B were scored for the presence of protrusions. Values represent the number of MAL2 KD cells with protrusions relative to uninfected cells. (
D) Cells knocked down for MAL2 expression were immunolabeled for actin with phalloidin. Arrowheads mark dorsal ruffle-like structures. (
E) Uninfected and MAL2 overexpressing WIF-B cells present at the edge of a scratch were labeled for actin with phalloidin. Arrowheads mark long protrusions present at the cell surface. (
F) Hep3B cells overexpressing MAL2 were treated for 4 h with 50 µg/mL cycloheximide and immunolabeled for MAL2 with anti-FLAG antibodies. Arrowheads point to MAL2 labeling present at the ends of the long protrusions. Bar = 10 µm.
![Cancers 12 00422 g004]()
Figure 5.
MAL2 expression in Clone 9 cells is associated with actin-based protrusion formation. (A) Uninfected Clone 9 cells and Clone 9 cells expressing wild type (WT) MAL2 were immunolabled for MAL2 (with anti-FLAG antibodies) and actin (with phalloidin). Nuclei were also stained with DAPI and merged images are shown in panels c and f. Arrowheads are marking actin-based protrusions in MAL2-expressing cells. (B) Clone 9 cells expressing FLAG-tagged wild type MAL2 were treated 50 µg/mL of cycloheximide (CHX) for up to 4 h as indicated and immunolabeled for MAL2 with anti-FLAG antibodies. Arrowheads indicate MAL2 localization at the Golgi (a), at the cell surface (b) and in the apical compartment (c,d). (C) Clone 9 cells expressing FLAG-tagged wild type MAL2 were immunolabeled for MAL2 (with anti-FLAG antibodies), actin (with phalloidin) and nuclei (with DAPI) after treatment with 5 μM latrunculin B (lat B) for 0 or 15 min or after washout for 60 min. Arrowheads in panels a and c mark long, actin-based protrusions in untreated cells and cells after latrunculin B washout. In panel b, arrowheads point to the smooth cell surfaces with no actin-based protrusion in cells treated for 15 min with latrunculin B. Bar = 10 µm.
![Cancers 12 00422 g005a]()
![Cancers 12 00422 g005b]()
Figure 6.
MAL2 expression in Clone 9 cells is associated with actin-based protrusion formation, yet impaired migration. (A) Monolayers of uninfected Clone 9 cells or cells expressing wild type (WT) MAL2 were scratched and wound healing was imaged at 0 h (upper panels) and 18 h (lower panels). White lines indicate the edges of the gap. (B) The gap area remaining after 18 h of recovery was determined relative to the area of the initial gap after 0, 4 (p ≤ 0.033), 8 (p ≤ 0.008), 12 (p ≤ 0.008), 16 (p ≤ 0.006) and 18 h (p ≤ 0.008) after recovery. Values represent the mean ± SEM determined from at least three independent experiments. (C) The boxed areas indicated in Part A were enlarged. Arrowheads point to long surface protrusions in MAL2-expressing cells present at the edge of the scratch. (D–G) Uninfected cells or cells expressing wild type MAL2 were seeded in serum-free medium onto filters in Boyden chambers in the absence (D,E) or presence of matrigel (F,G). After 24 h, the nuclei of cells that had penetrated to the underside of the filter were labeled with DAPI and visualized (D,F). In (E,G), the numbers of MAL2-expressing cells that had penetrated the filter were determined relative to the numbers of uninfected cells and plotted as the percent of control (uninfected). Values represent the mean ± SEM from at least three independent experiments. The difference in invasion was significant (p ≤ 0.05).
![Cancers 12 00422 g006]()
Figure 7.
MAL2 overexpression disrupts invadopodia formation. (A) Lysates from uninfected Clone 9 cells and Clone 9 cells expressing wild type (WT) MAL2 were immunoblotted for Tks5, Mena, VASP, FAK and tubulin (as a loading control) as indicated. Molecular weight standards are indicated on the left in kDa. (B) Uninfected Clone 9 cells and Clone 9 cells expressing wild type MAL2 were immunolabeled for Tks5 or Mena as indicated. Arrowheads in panels a and b mark Tks5 and Mena present in juxta-nuclear invadopodia that are absent in cells expressing MAL2. (C) Uninfected and MAL2-expressing cells were seeded onto 96-well plates at 4000 cells/well and relative cell numbers monitored after 1 (p ≤ 0.006), 2 (p ≤ 0.006) or 3 days. Values represent the mean ± SEM from at least three independent experiments each performed in triplicate. (D) Uninfected Clone 9 cells were labeled for Mena. Arrowheads mark Mena present at the surface in patches. (E) Clone 9 cells expressing wild type MAL2 were immunolabeled for Mena and MAL2 as indicated. Arrowheads mark Mena present at the far distal tips of protrusions induced by MAL2 expression. Bar = 10 µm.
![Cancers 12 00422 g007]()
Figure 8.
Mutations in a putative EVH1 recognition site decrease protrusion formation. (A) A diagram of the cytosolic, N-terminal amino acid sequence of MAL2 containing is shown. The two putative proline-rich EVH1 recognition sites are underlined and the single and double mutations are indicated in red. All constructs were FLAG-tagged at the C-terminus. (B) WIF-B cells expressing the wild type (WT) and mutant MAL2 proteins were immunolabeled for MAL2 with anti-FLAG antibodies. Asterisks mark bile canaliculi. (C) Clone 9 cells expressing wild type (WT) and the mutant MAL2 proteins were double labeled for MAL2 (with anti-FLAG antibodies) and actin (with phalloidin). Merged images are shown in c, f, i and l with DAPI labeling of nuclei. Arrowheads in a–f indicate surface protrusions in cells expressing wild type or VPPPP mutant MAL2. Bar = 10 µm.
Figure 9.
The FPAP motif mediates MAL2-induced protrusion formation and impaired cell migration. (A) Monolayers of infected cells or cells expressing wild type (WT) or mutant MAL2 as indicated were scratched and wound healing was imaged 0 h (upper panels), 6 h (middle panels) and 12 h (lower panels) post-scratch. White lines indicate the edges of the gap. (B) The boxed areas in Part A were enlarged. Arrowheads in panels c and d indicate protrusions in cells expressing wild type or the VPPPP mutant MAL2 at the migrating edge. (C) Cells at the migrating edge were immunolabeled for MAL2 (with anti-FLAG antibodies). The Arrowheads in panels a and b indicate protrusions in cells expressing wild type or the VPPPP mutant MAL2 at the migrating edge. Bar = 10 µm. (D) The gap area remaining after 0, 6, 12 (p ≤ 0.008 for WT and ≤ 0.005 for VPPPP) and 18 h (p ≤ 0.008 for WT and ≤ 0.005 for VPPPP) of recovery was determined relative to the area of the initial gap in cells expressing wild type and mutant MAL2 as indicated. Values represent the mean ± SEM from at least five independent experiments. (E) Uninfected or MAL2-expressing cells were seeded onto 96-well plates at 4000 cells/well and relative cell numbers monitored after 1 (p ≤ 0.006 for WT and ≤0.01 for VPPPP), 2 (p ≤ 0.008 for WT and ≤0.024 for VPPPP) or 3 days. Values represent the mean ± SEM from at least three independent experiments each performed in triplicate.
![Cancers 12 00422 g009]()
Figure 10.
The FPAP motif mediates MAL2-induced protrusion formation and impaired cell migration. (A–D) Uninfected cells or cells expressing wild type of mutant MAL2 were seeded in serum-free medium onto filters in Boyden chambers in the absence (A,B) or presence of matrigel (C,D) cells. After 24 h, the nuclei of cells that had penetrated to the underside of the filter were labeled with DAPI and visualized (A,C). In (B,D), the numbers of MAL2-expressing cells that had penetrated the filter were determined relative to the numbers of uninfected cells and plotted as the percent of control (uninfected). In (B), * p ≤ 0.049 and in (D), p ≤ 0.007 for WT and ≤0.029 for VPPPP. Bar = 10 µm.
Figure 11.
MAL2 has a low somatic mutation frequency in human cancers. MAL2 mutation rates for 18 different human cancer types were determined from data compiled by the NCI Genomic Data Commons. Below, the specific patient mutations (and consequences) in the MAL2 amino acid sequence are indicated in blue and red. MAL2 transmembrane domains are underlined.
Figure 12.
Explaining the MAL2 paradox. (A) MAL2 and c-Myc are on chromosome 8q24, a region frequently amplified in epithelial-derived cancers. (B), In normal cells with low c-Myc (left), Miz1 binds a core promoter with p300 and nucleophosmin (npm) and activates transcription of genes involved in tumor suppression (including MAL2). Upon 8q24 amplification in early HCC, both MAL2 and myc levels are increased. As transformation progresses, Myc levels are increased (right), Myc-Max dimers bind Miz1, displace p300 and npm, recruit a methyl transferase and other factors thereby repressing Miz1 transcriptional activity and lead to decreased MAL2 expression and enhanced transformation.

 ,
, 