
Definitive Local Therapy Is Associated with Improved Survival in Metastatic Soft Tissue Sarcomas

 ,
,
Abstract
:Simple Summary
Abstract
1. Introduction
2. Results
2.1. Baseline Clinical Characteristics
2.2. Factors Associated with Receipt of Definitive Local Therapy
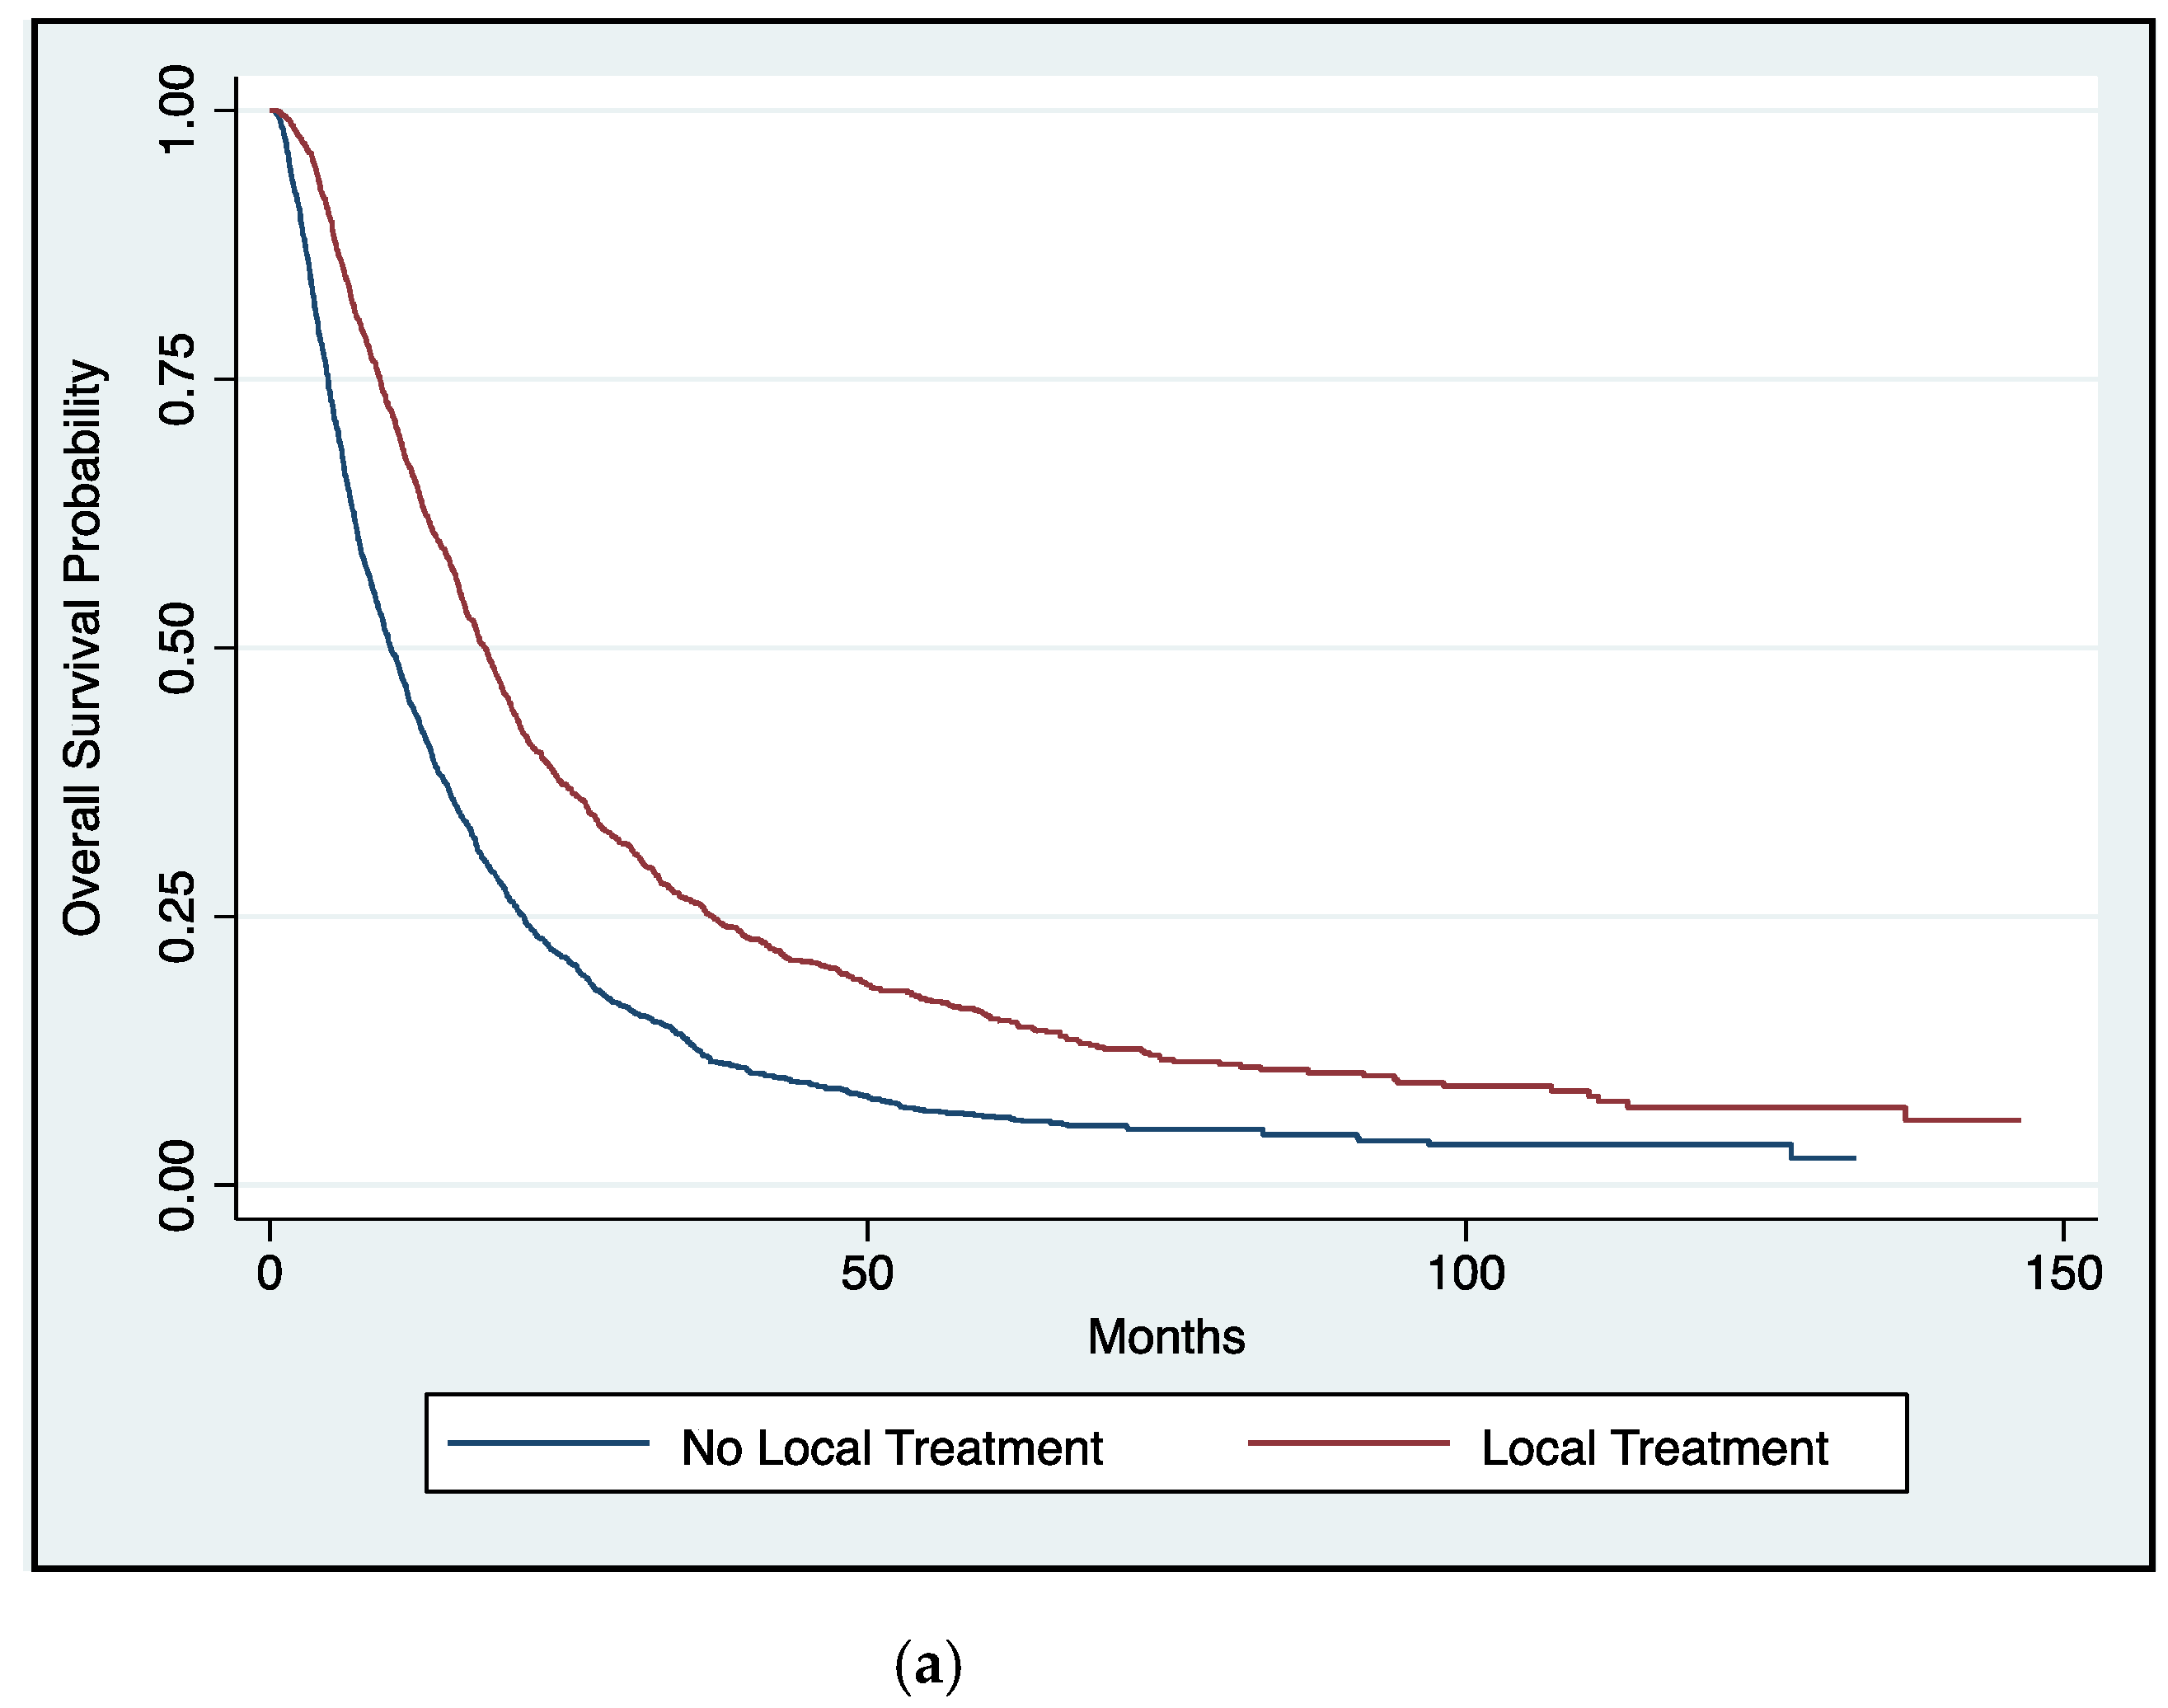
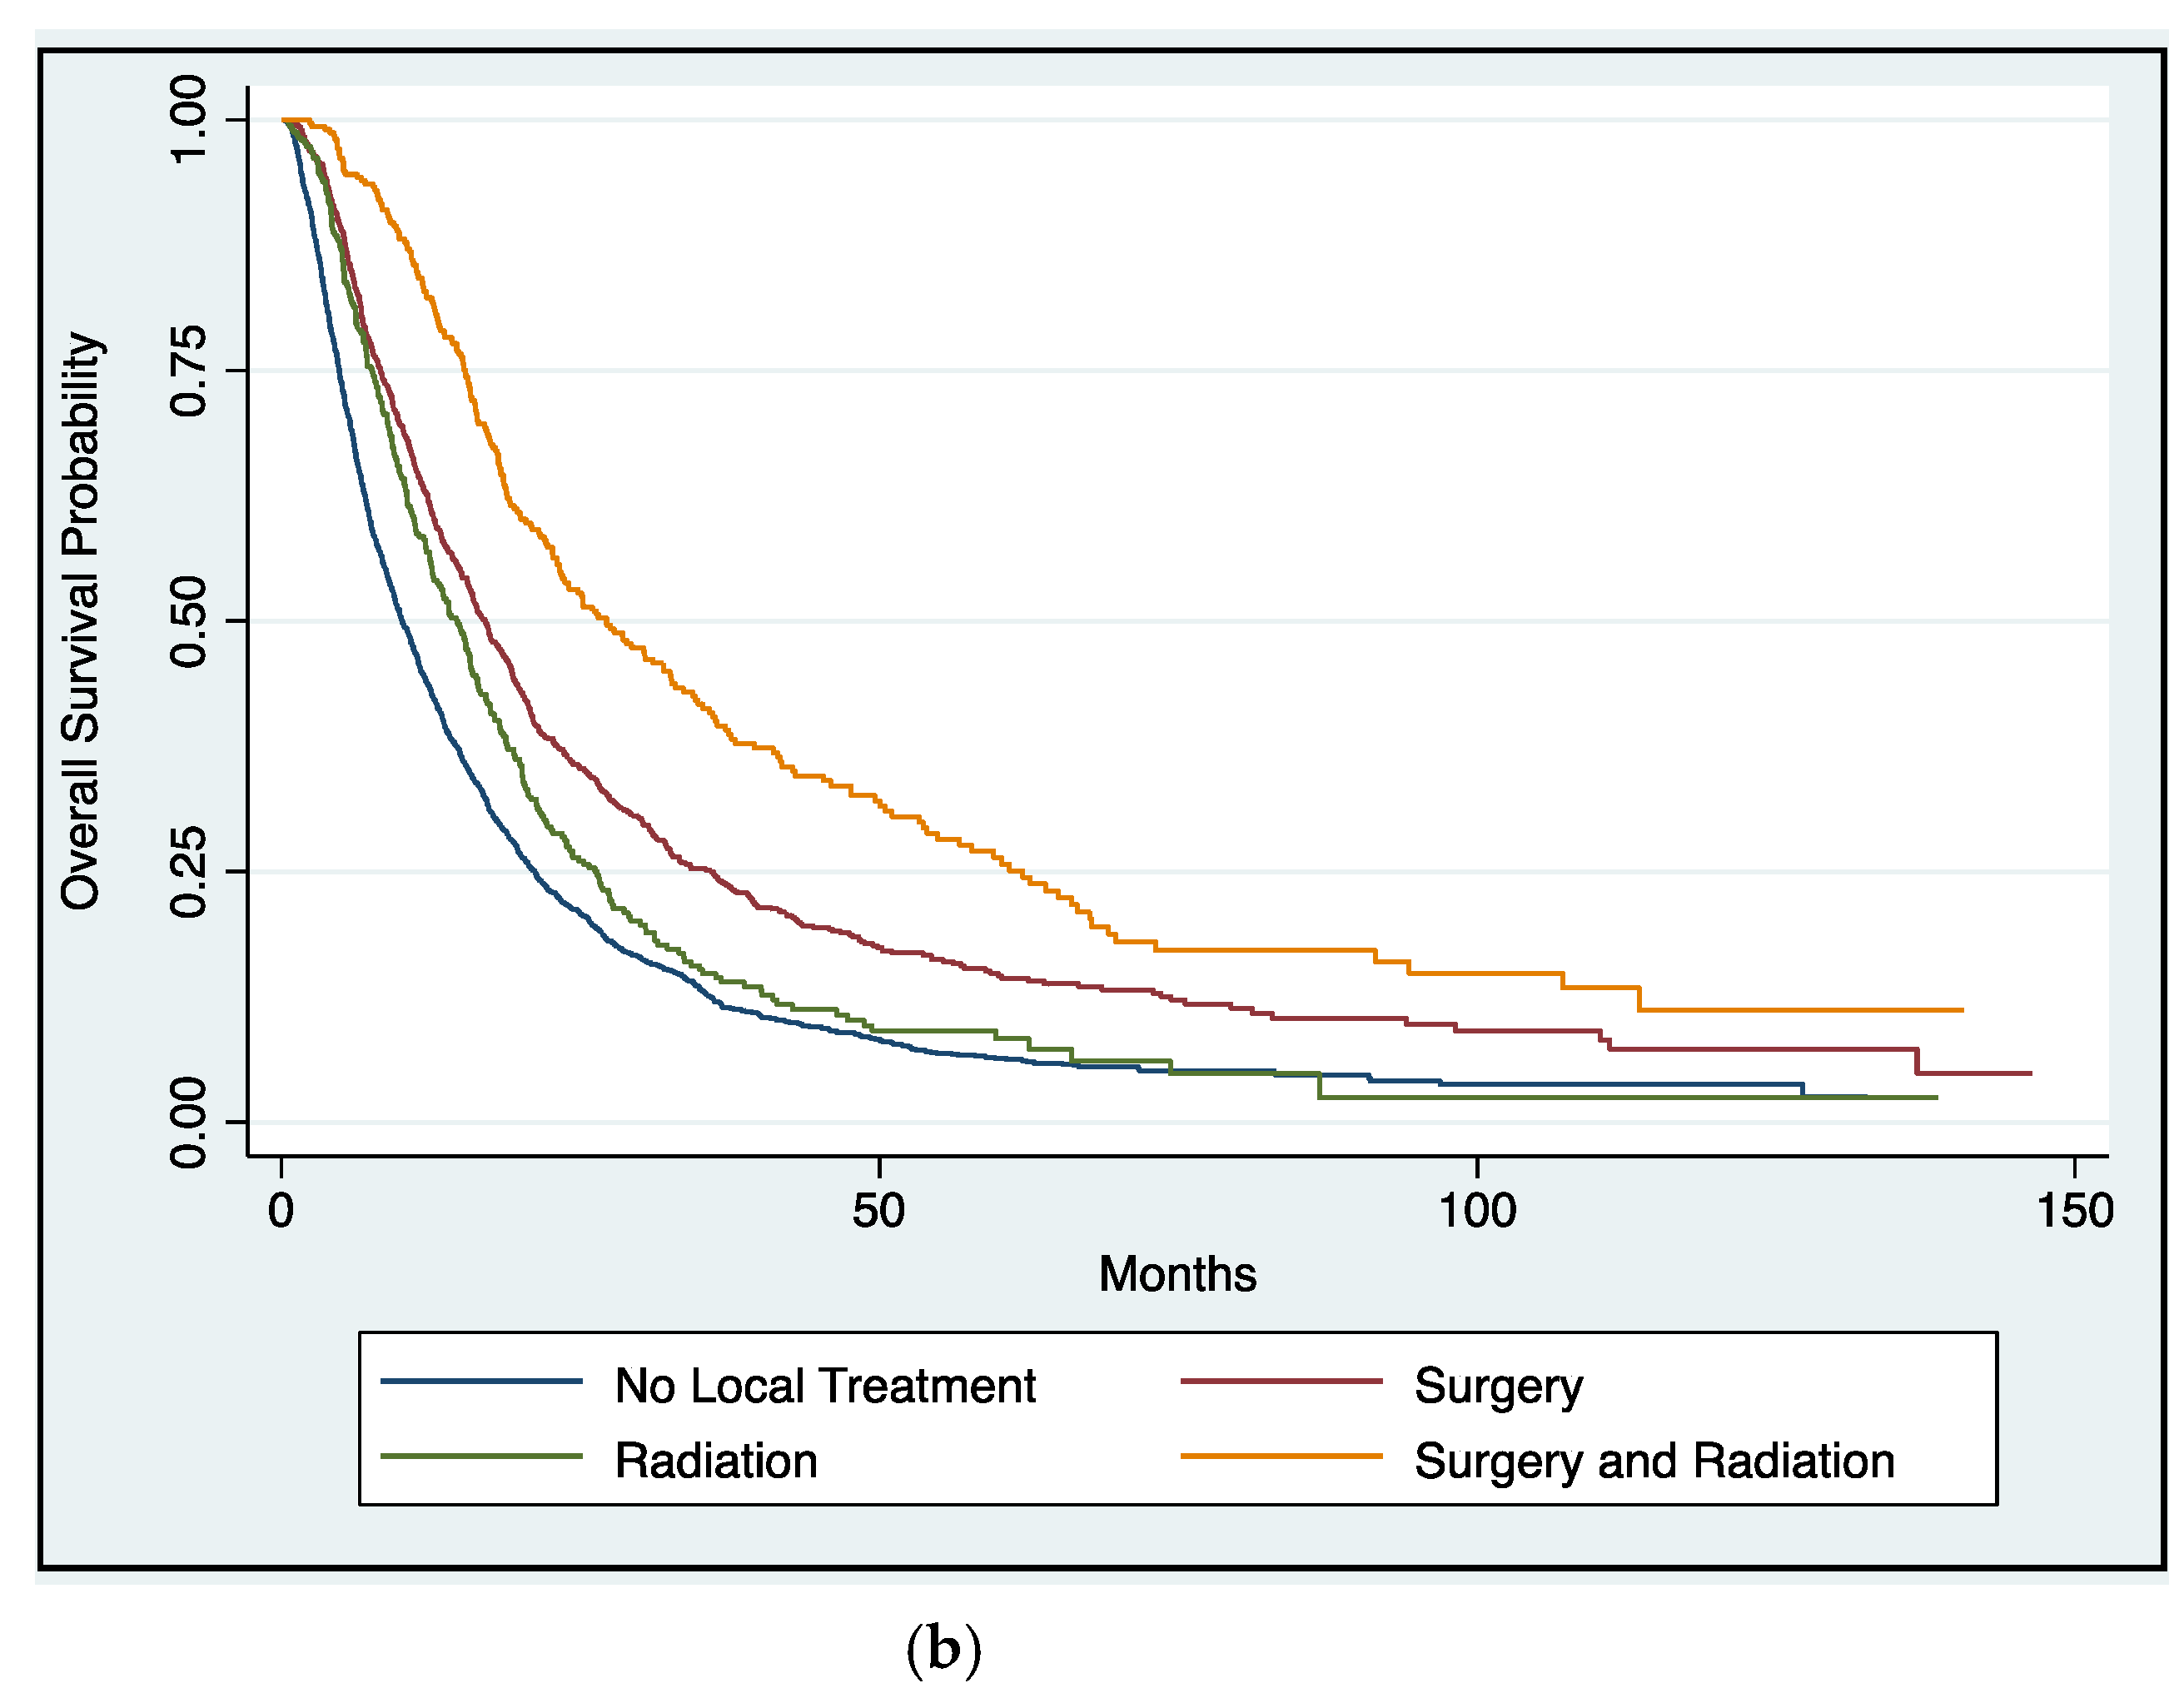
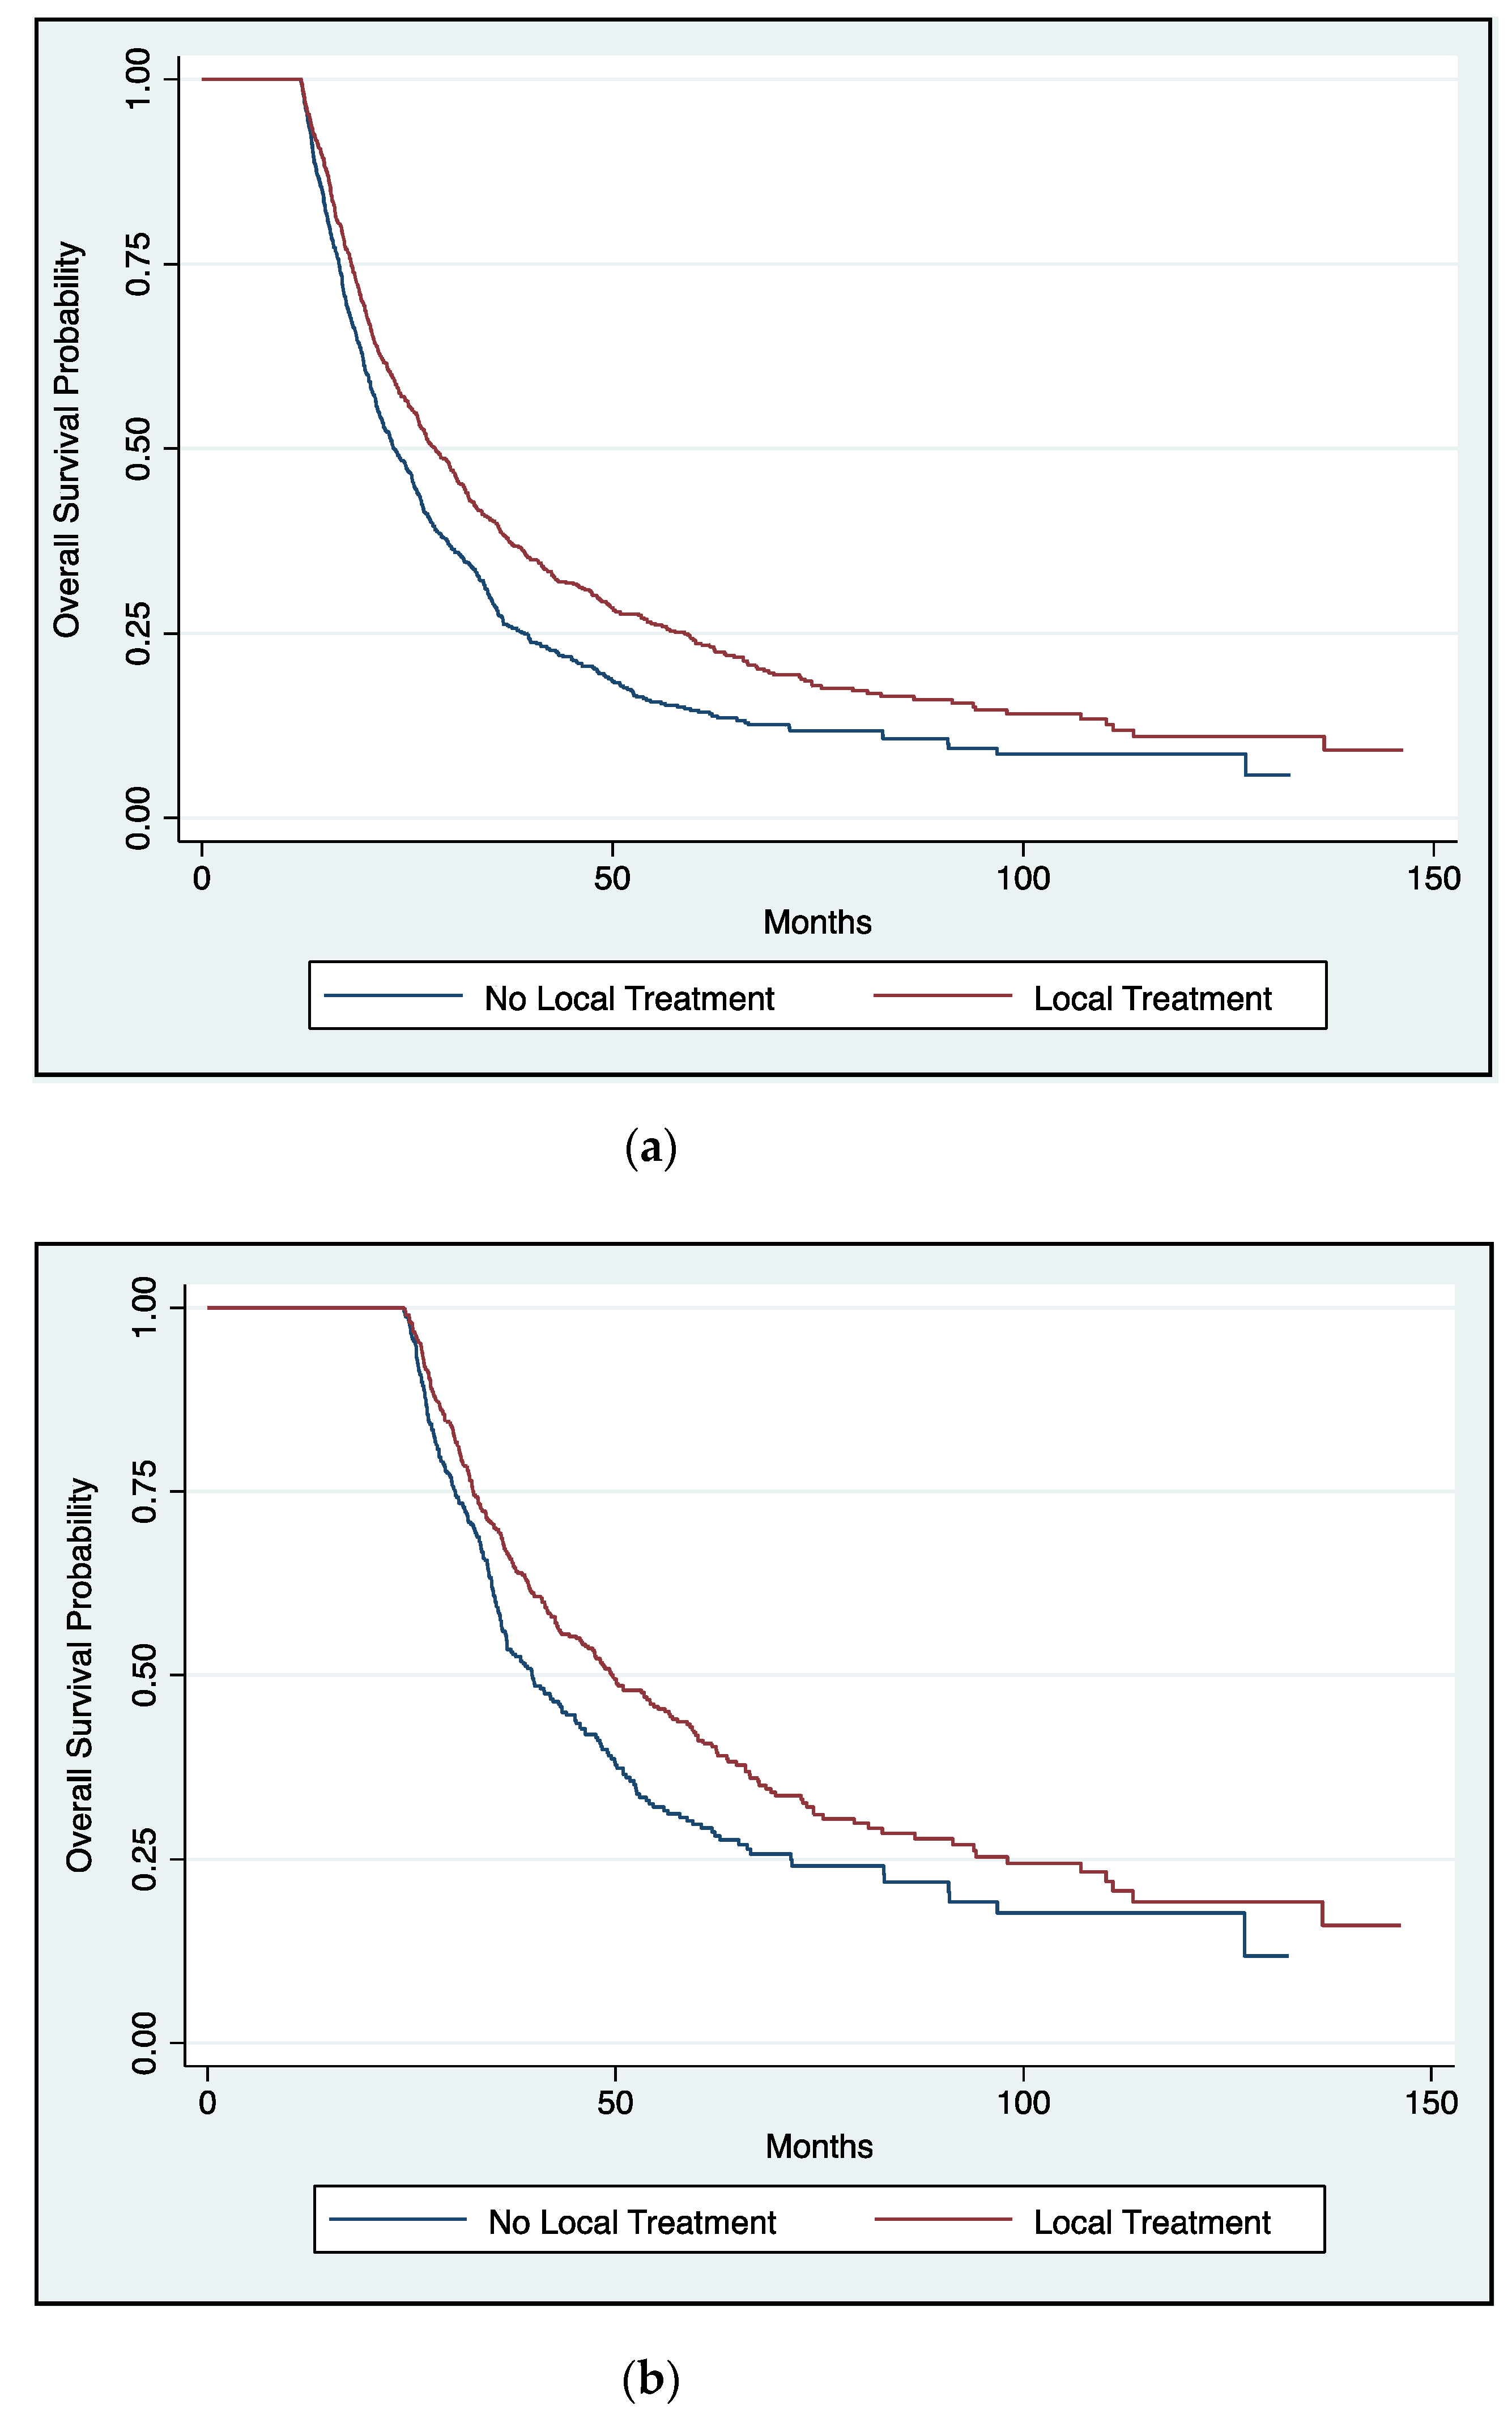
2.3. Impact of Definitive Local Therapy on Overall Survival
3. Discussion
4. Materials and Methods
4.1. Data Source
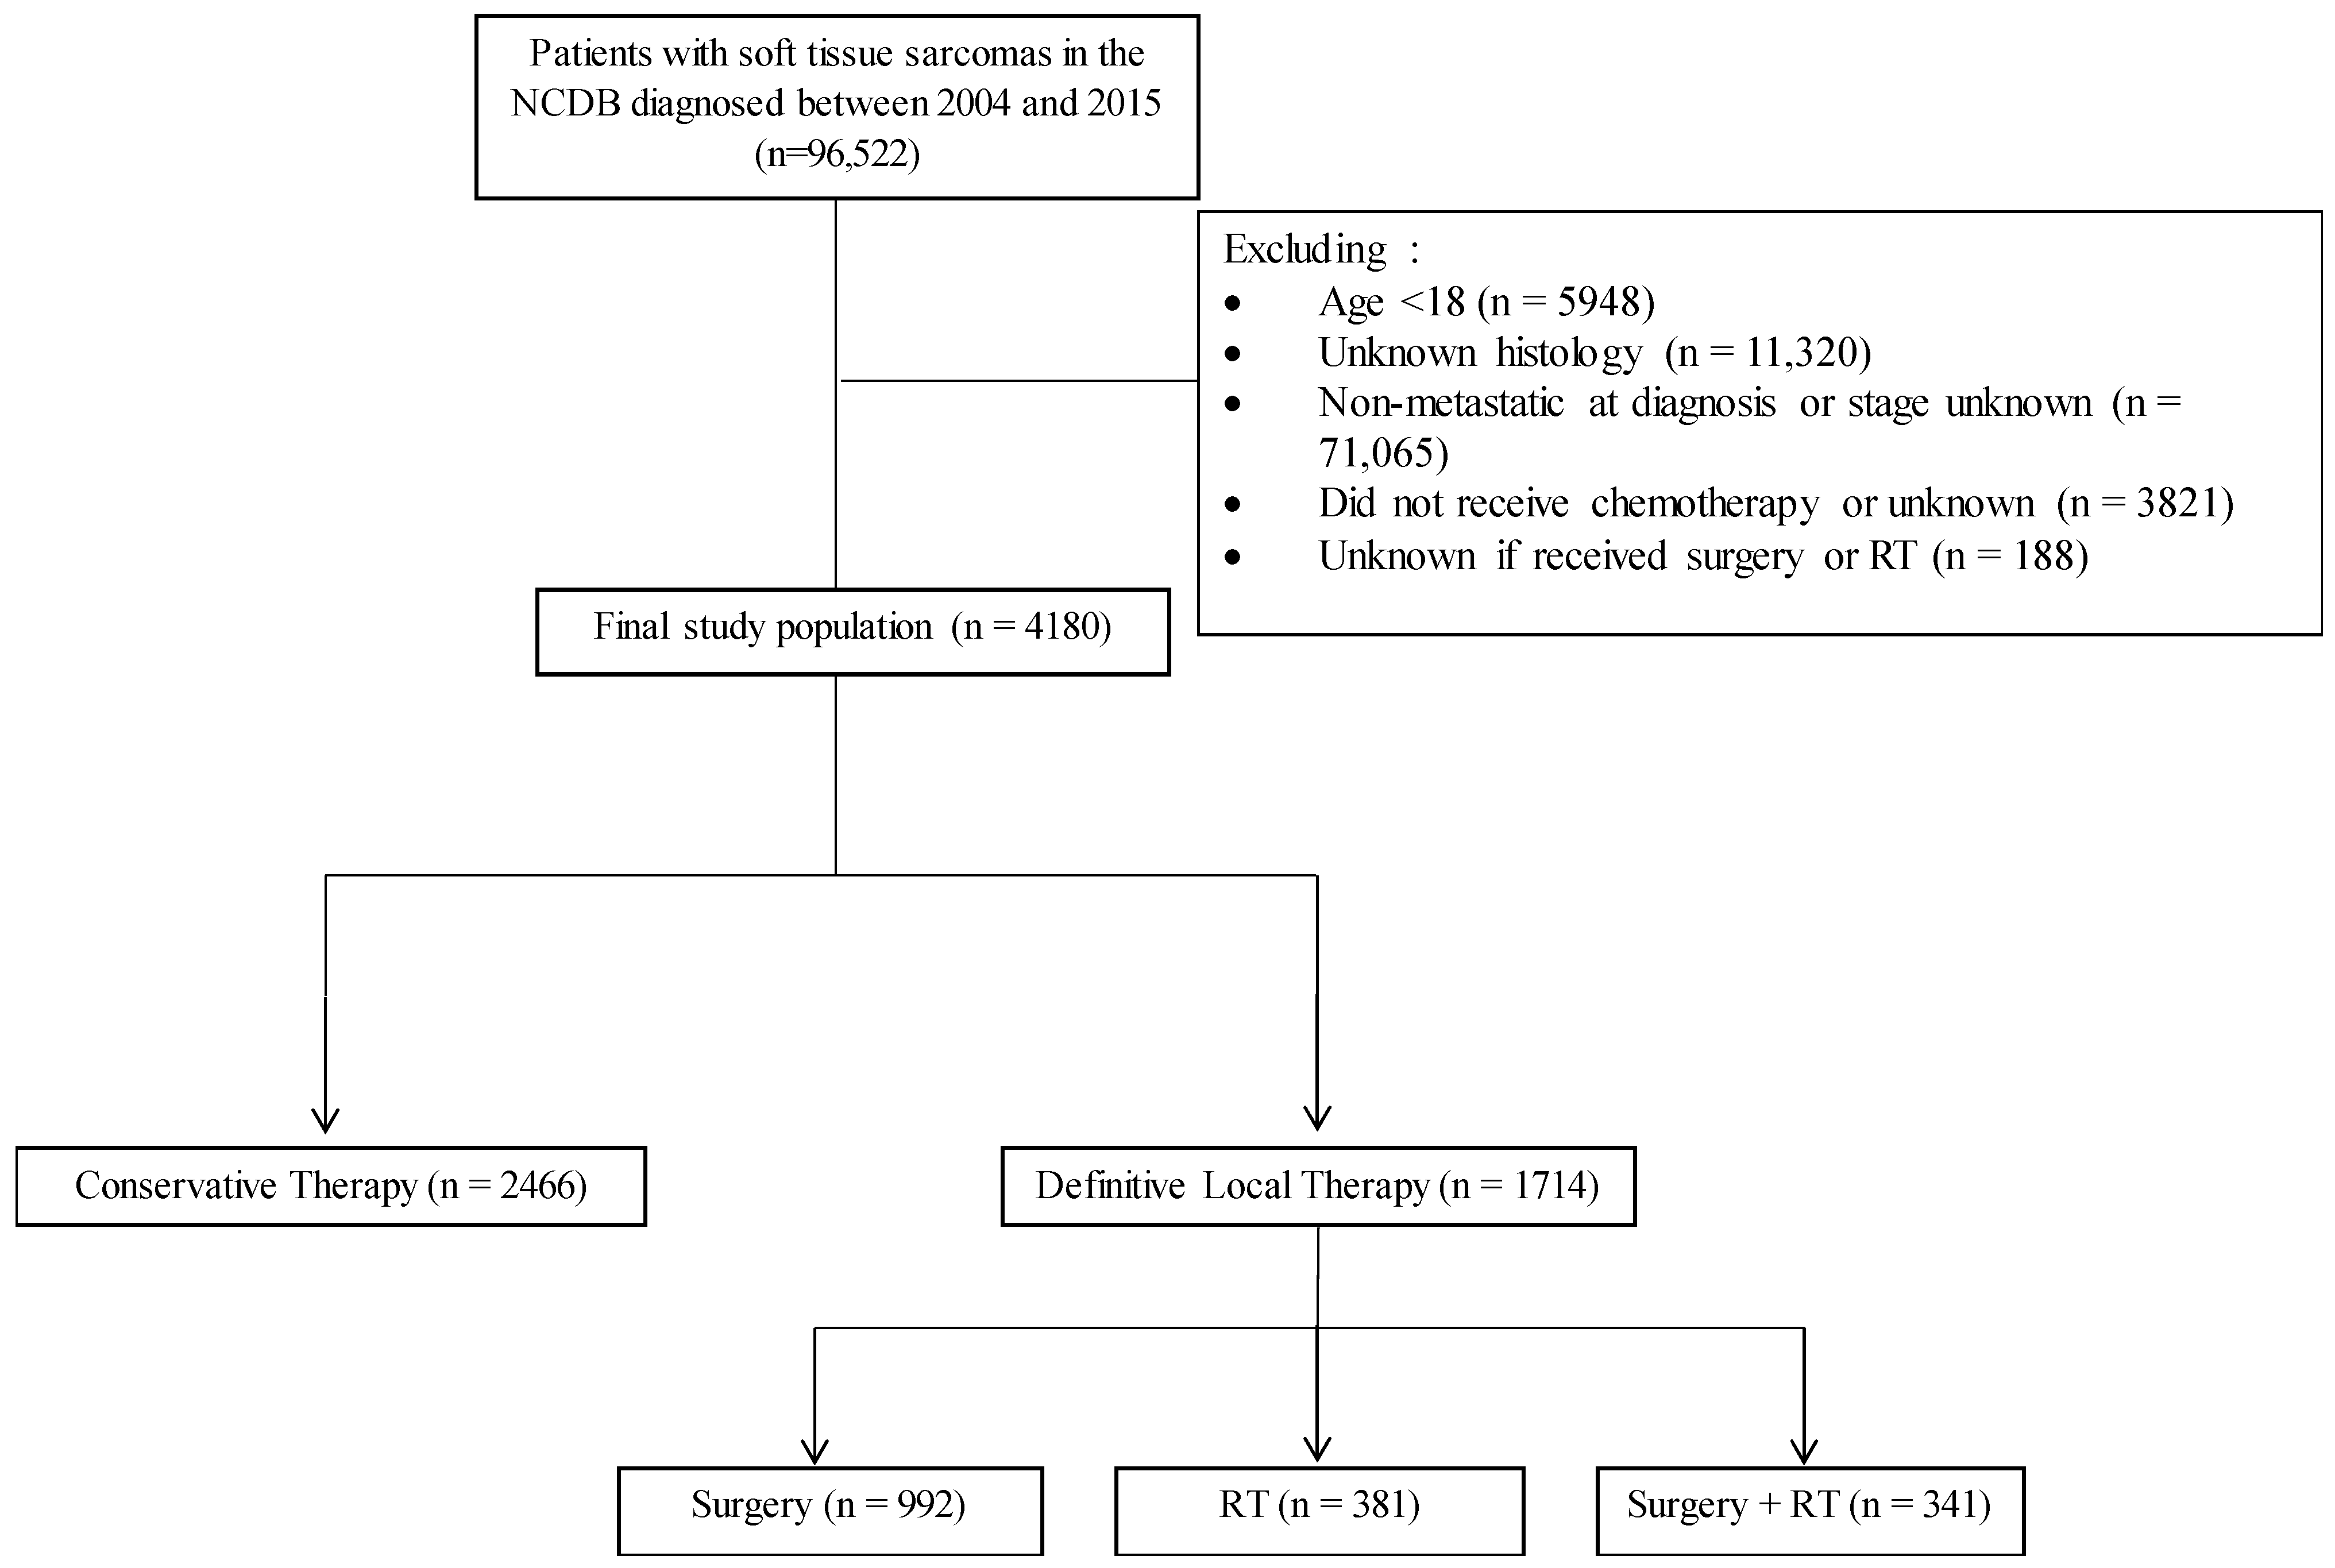
4.2. Study Population
4.3. Patient Cohorts and Variables
4.4. Endpoints
4.5. Statistical Analysis
5. Conclusions
Supplementary Materials
Author Contributions
Funding
Institutional Review Board Statement
Informed Consent Statement
Data Availability Statement
Conflicts of Interest
References
- Siegel, R.L.; Miller, K.D.; Jemal, A. Cancer statistics, 2019. CA Cancer J. Clin. 2019, 69, 7–34. [Google Scholar] [CrossRef] [PubMed] [Green Version]
- Surveillance, Epidemiology, and End Results Program. SEER Cancer Statistics Review. Available online: https://seer.cancer.gov/ (accessed on 15 January 2020).
- NCCN Guidelines: Soft Tissue Sarcoma. NCCN Guidelines Version 6.2019 Soft Tissue Sarcoma. 2019. Available online: https://www.nccn.org (accessed on 15 January 2020).
- Judson, I.; Verweij, J.; Gelderblom, H.; Hartmann, J.T.; Schöffski, P.; Blay, J.Y.; Kerst, J.M.; Sufliarsky, J.; Whelan, J.; Hohenberger, P.; et al. Doxorubicin alone versus intensified doxorubicin plus ifosfamide for first-line treatment of advanced or metastatic soft-tissue sarcoma: A randomised controlled phase 3 trial. Lancet Oncol. 2014, 15, 415–423. [Google Scholar] [CrossRef]
- Ryan, C.W.; Merimsky, O.; Agulnik, M.; Blay, J.Y.; Schuetze, S.M.; Van Tine, B.A.; Jones, R.L.; Elias, A.D.; Choy, E.; Alcindor, T.; et al. PICASSO III: A phase III, placebo–controlled study of doxorubicin with or without palifosfamide in patients with metastatic soft tissue sarcoma. J. Clin. Oncol. 2016, 34, 3898–3905. [Google Scholar] [CrossRef]
- Kane, J.M.; Finley, J.W.; Driscoll, D.; Kraybill, W.G.; Gibbs, J.F. The treatment and outcome of patients with soft tissue sarcomas and synchronous metastases. Sarcoma 2002, 6, 69–73. [Google Scholar] [CrossRef] [PubMed] [Green Version]
- Ferguson, P.C.; Deheshi, B.M.; Chung, P.; Catton, C.N.; O’Sullivan, B.; Gupta, A.; Griffin, A.M.; Wunder, J.S. Soft tissue sarcoma presenting with metastatic disease: Outcome with primary surgical resection. Cancer 2011, 117, 372–379. [Google Scholar] [CrossRef]
- Okiror, L.; Peleki, A.; Moffat, D.; Bille, A.; Bishay, E.; Rajesh, P.; Steyn, R.; Naidu, B.; Grimer, R.; Kalkat, M. Survival following Pulmonary Metastasectomy for Sarcoma. Thorac. Cardiovasc. Surg. 2016, 64, 146–149. [Google Scholar] [CrossRef] [PubMed]
- Chudgar, N.P.; Brennan, M.F.; Tan, K.S.; Munhoz, R.R.; D’Angelo, S.P.; Bains, M.S.; Huang, J.; Park, B.J.; Adusumilli, P.S.; Tap, W.D.; et al. Is Repeat Pulmonary Metastasectomy Indicated for Soft Tissue Sarcoma? Ann. Thorac. Surg. 2017, 104, 1837–1845. [Google Scholar] [CrossRef] [PubMed] [Green Version]
- Guttmann, D.M.; Mitra, N.; Bekelman, J.; Metz, J.M.; Plastaras, J.; Feng, W.; Swisher-McClure, S. Improved Overall Survival with Aggressive Primary Tumor Radiotherapy for Patients with Metastatic Esophageal Cancer. J. Thorac. Oncol. 2017, 12, 1131–1142. [Google Scholar] [CrossRef] [PubMed] [Green Version]
- Flanigan, R.C.; Salmon, S.E.; Blumenstein, B.A.; Bearman, S.I.; Roy, V.; McGrath, P.C.; Caton, J.R.; Munshi, N.; Crawford, E.D. Nephrectomy followed by interferon alfa-2b compared with interferon alfa-2b alone for metastatic renal-cell cancer. N. Engl. J. Med. 2001, 345, 1655–1659. [Google Scholar] [CrossRef] [PubMed]
- Mickisch, G.H.J.; Garin, A.; Van Poppel, H.; De Prijck, L.; Sylvester, R. Radical nephrectomy plus interferon-alfa-based immunotherapy compared with interferon alfa alone in metastatic renal-cell carcinoma: A randomised trial. Lancet 2001, 358, 966–970. [Google Scholar] [CrossRef]
- Seisen, T.; Sun, M.; Leow, J.J.; Preston, M.A.; Cole, A.P.; Gelpi-Hammerschmidt, F.; Hanna, N.; Meyer, C.P.; Kibel, A.S.; Lipsitz, S.R.; et al. Efficacy of High-Intensity Local Treatment for Metastatic Urothelial Carcinoma of the Bladder: A Propensity Score-Weighted Analysis From the National Cancer Data Base. J. Clin. Oncol. 2016, 34, 3529–3536. [Google Scholar] [CrossRef]
- Rusthoven, C.G.; Jones, B.L.; Flaig, T.W.; Crawford, E.D.; Koshy, M.; Sher, D.J.; Mahmood, U.; Chen, R.C.; Chapin, B.F.; Kavanagh, B.D.; et al. Improved survival with prostate radiation in addition to androgen deprivation therapy for men with newly diagnosed metastatic prostate cancer. J. Clin. Oncol. 2016, 34, 2835–2842. [Google Scholar] [CrossRef]
- Venigalla, S.; Guttmann, D.M.; Horne, Z.D.; Carmona, R.; Shabason, J.E.; Beriwal, S. Definitive local therapy is associated with improved overall survival in metastatic cervical cancer. Pract. Radiat. Oncol. 2018, 8, e377–e385. [Google Scholar] [CrossRef] [PubMed] [Green Version]
- Gomez, D.R.; Blumenschein, G.R., Jr.; Lee, J.J.; Hernandez, M.; Ye, R.; Camidge, D.R.; Doebele, R.C.; Skoulidis, F.; Gaspar, L.E.; Gibbons, D.L.; et al. Local consolidative therapy versus maintenance therapy or observation for patients with oligometastatic non-small-cell lung cancer without progression after first-line systemic therapy: A multicentre, randomised, controlled, phase 2 study. Lancet Oncol. 2016, 17, 1672–1682. [Google Scholar] [CrossRef] [Green Version]
- Gomez, D.R.; Tang, C.; Zhang, J.; Blumenschein Jr, G.R.; Hernandez, M.; Lee, J.J.; Ye, R.; Palma, D.A.; Louie, A.V.; Camidge, D.R.; et al. Local consolidative therapy vs. Maintenance therapy or observation for patients with oligometastatic non-small-cell lung cancer: Long-term results of a multi-institutional, phase II, randomized study. J. Clin. Oncol. 2019, 37, 1558–1565. [Google Scholar] [CrossRef]
- Slotman, B.J.; van Tinteren, H.; Praag, J.O.; Knegjens, J.L.; El Sharouni, S.Y.; Hatton, M.; Keijser, A.; Faivre-Finn, C.; Senan, S. Use of thoracic radiotherapy for extensive stage small-cell lung cancer: A phase 3 randomised controlled trial. Lancet 2015, 385, 36–42. [Google Scholar] [CrossRef]
- Comen, E.; Norton, L.; Massagué, J. Clinical implications of cancer self-seeding. Nat. Rev. Clin. Oncol. 2011, 8, 369–377. [Google Scholar] [CrossRef]
- Danna, E.A.; Sinha, P.; Gilbert, M.; Clements, V.K.; Pulaski, B.A.; Ostrand-Rosenberg, S. Surgical Removal of Primary Tumor Reverses Tumor–Induced Immunosuppression Despite the Presence of Metastatic Disease. Cancer Res. 2004, 64, 2205–2211. [Google Scholar] [CrossRef] [PubMed] [Green Version]
- American College of Surgeons American Cancer Society. National Cancer Database. National Cancer Database. 2017. Available online: https://www.facs.org/quality-programs/cancer/ncdb (accessed on 15 January 2020).
- Bilimoria, K.Y.; Stewart, A.K.; Winchester, D.P.; Ko, C.Y. The National Cancer Data Base: A powerful initiative to improve cancer care in the United States. Ann. Surg. Oncol. 2008, 15, 683–690. [Google Scholar] [CrossRef] [PubMed] [Green Version]
- Deyo, R.A.; Cherkin, D.C.; Ciol, M.A. Adapting a clinical comorbidity index for use with ICD-9—CM administrative databases. J. Clin. Epidemiol. 1992, 45, 613–619. [Google Scholar] [CrossRef]
- Austin, P.C. An introduction to propensity score methods for reducing the effects of confounding in observational studies. Multivar. Behav. Res. 2011, 46, 399–424. [Google Scholar] [CrossRef] [PubMed] [Green Version]
- Austin, P.C. Balance diagnostics for comparing the distribution of baseline covariates between treatment groups in propensity—Score matched samples. Stat. Med. 2009, 28, 3083–3107. [Google Scholar] [CrossRef] [PubMed] [Green Version]
- Park, H.S.; Gross, C.P.; Makarov, D.V.; Yu, J.B. Immortal time bias: A frequently unrecognized threat to validity in the evaluation of postoperative radiotherapy. Int. J. Radiat. Oncol. Biol. Phys. 2012, 83, 1365–1373. [Google Scholar] [CrossRef] [PubMed]


| Receipt of Local Therapy | OR (95% CI) | p Value | OR (95% CI) | p Value |
|---|---|---|---|---|
| Age | ||||
| <70 years | 1 | 1 | ||
| ≥70 years | 0.74 (0.63–0.87) | <0.001 | 0.90 (0.72–1.12) | 0.326 |
| Gender | ||||
| Male | 1 | --- | --- | |
| Female | 0.99 (0.87–1.12) | 0.853 | --- | --- |
| Race | ||||
| Non-Hispanic White | 1 | --- | --- | |
| Non-Hispanic Black | 0.91 (0.76–1.08) | 0.291 | --- | --- |
| Hispanic | 0.95 (0.76–1.19) | 0.645 | --- | --- |
| Other | 0.95 (0.70–1.27) | 0.720 | --- | --- |
| Facility Area | ||||
| Metropolitan | 1 | --- | --- | |
| Urban | 0.97 (0.80–1.17) | 0.738 | --- | --- |
| Rural | 0.74 (0.45–1.22) | 0.240 | --- | --- |
| Unknown | 0.92 (0.66–1.28) | 0.632 | --- | --- |
| Facility Location | ||||
| East | 1 | 1 | ||
| South | 0.97 (0.81–1.18) | 0.779 | 1.06 (0.86–1.31) | 0.589 |
| Central | 1.05 (0.86–1.28) | 0.617 | 1.09 (0.88–1.36) | 0.422 |
| West | 1.23 (0.98–1.55) | 0.077 | 1.32 (1.03–1.70) | 0.031 |
| Unknown | 1.38 (1.13–1.70) | 0.002 | 1.36 (1.04–1.78) | 0.027 |
| Facility Type | ||||
| Non-Academic | 1 | 1 | ||
| Academic | 1.35 (1.18–1.55) | <0.001 | 1.17 (1.00–1.37) | 0.052 |
| Unknown | 1.56 (1.31–1.85) | <0.001 | ||
| Insurance | ||||
| Commercial | 1 | 1 | ||
| Medicare | 0.71 (0.62–0.83) | <0.001 | 0.78 (0.64–0.95) | 0.012 |
| Medicaid | 1.03 (0.85–1.26) | 0.761 | 0.86 (0.69–1.06) | 0.161 |
| Uninsured | 0.75 (0.57–0.98) | 0.035 | 0.66 (0.49–0.88) | 0.005 |
| Other | 0.83 (0.57–1.21) | 0.342 | 0.80 (0.53–1.20) | 0.279 |
| Distance to Treatment Facility | ||||
| ≤40 miles | 1 | 1 | ||
| >40 miles | 1.20 (1.03–1.39) | 0.018 | 0.97 (0.83–1.15) | 0.748 |
| Unknown | 0.89 (0.54–1.47) | 0.646 | 0.67 (0.39–1.14) | 0.139 |
| Zip Code Education Level | ||||
| ≥21% | 1 | --- | --- | |
| 13–20.9% | 1.13 (0.93–1.36) | 0.211 | --- | --- |
| 7–12.9% | 1.10 (0.92–1.32) | 0.310 | --- | --- |
| <7% | 1.02 (0.84–1.23) | 0.854 | --- | --- |
| Unknown | 0.95 (0.57–1.58) | 0.839 | --- | --- |
| Zip Code Income Level | ||||
| <38,000 | 1 | --- | --- | |
| 38,000–47,999 | 1.05 (0.86–1.27) | 0.653 | --- | --- |
| 48,000–62,999 | 1.10 (0.91–1.32) | 0.330 | --- | --- |
| ≥63,000 | 1.03 (0.86–1.23) | 0.774 | --- | --- |
| Unknown | 0.92 (0.56–1.52) | 0.745 | --- | --- |
| Charlson Deyo Score | ||||
| 0 | 1 | --- | --- | |
| 1 | 0.91 (0.76–1.08) | 0.286 | --- | --- |
| 2 | 0.94 (0.65–1.35) | 0.740 | --- | --- |
| 3 | 0.56 (0.27–1.18) | 0.128 | --- | --- |
| Primary Site | ||||
| Extremity | 1 | 1 | ||
| Head and Neck | 0.88 (0.63–1.23) | 0.458 | 1.13 (0.79–1.63) | 0.504 |
| Thorax | 0.50 (0.41–0.61) | <0.001 | 0.55 (0.44–0.69) | <0.001 |
| Abdomen/Pelvis | 0.44 (0.38–0.51) | <0.001 | 0.49 (0.42–0.57) | <0.001 |
| Other/NOS | 0.18 (0.14–0.23) | <0.001 | 0.31 (0.23–0.40) | <0.001 |
| Histology | ||||
| Unclassified | 1 | 1 | ||
| Undifferentiated Pleomorphic | 1.73 (1.28–2.33) | <0.001 | 1.64 (1.18–2.26) | 0.003 |
| Fibrosarcoma/Myxofibrosarcoma | 2.11 (1.50–2.97) | <0.001 | 2.06 (1.42–2.97) | <0.001 |
| Liposarcoma | 1.42 (1.11–1.81) | 0.005 | 1.49 (1.14–1.93) | 0.003 |
| Leiomyosarcoma | 0.78 (0.66–0.92) | 0.003 | 1.09 (0.90–1.31) | 0.379 |
| Synovial Sarcoma | 1.81 (1.44–2.28) | <0.001 | 1.67 (1.30–2.14) | <0.001 |
| Angiosarcoma | 0.66 (0.51–0.84) | 0.001 | 1.00 (0.76–1.32) | 0.995 |
| MPNST | 1.79 (1.29–2.47) | <0.001 | 1.97 (1.39–2.80) | <0.001 |
| Tumor Size | ||||
| <5 cm | 1 | 1 | ||
| 5.1–10 cm | 0.94 (0.75–1.18) | 0.590 | 0.85 (0.67–1.08) | 0.191 |
| 10.1–15 cm | 1.01 (0.80–1.28) | 0.928 | 0.87 (0.68–1.12) | 0.280 |
| >15 cm | 0.96 (0.76–1.21) | 0.727 | 0.80 (0.62–1.03) | 0.088 |
| Unknown | 0.33 (0.26–0.42) | <0.001 | 0.41 (0.32–0.53) | <0.001 |
| Grade | ||||
| I | 1 | 1 | ||
| II | 1.17 (0.69–1.99) | 0.566 | 1.08 (0.61–1.90) | 0.800 |
| III | 1.27 (0.79–2.03) | 0.322 | 1.15 (0.69–1.90) | 0.592 |
| Unknown | 0.54 (0.33–0.86) | 0.010 | 0.55 (0.33–0.91) | 0.020 |
| Year of Diagnosis | ||||
| 2004–2007 | 1 | 1 | ||
| 2008–2011 | 0.98 (0.83–1.17) | 0.852 | 1.01 (0.84–1.22) | 0.913 |
| 2012–2015 | 0.85 (0.72–1.01) | 0.060 | 0.92 (0.77–1.11) | 0.389 |
| HR (95% CI) | p Value | HR (95% CI) | p Value | HR (95% CI) | p Value | |
|---|---|---|---|---|---|---|
| Local Therapy | ||||||
| None | 1 | 1 | 1 | |||
| Radiation Alone | 0.79 (0.70–0.90) | <0.001 | 0.77 (0.67–0.87) | <0.001 | 0.75 (0.66–0.86) | <0.001 |
| Surgery Alone | 0.63 (0.58–0.69) | <0.001 | 0.67 (0.61–0.73) | <0.001 | 0.66 (0.60–0.72) | <0.001 |
| Surgery and Radiation | 0.41 (0.36–0.48) | <0.001 | 0.42 (0.36–0.48) | <0.001 | 0.41 (0.35–0.47) | <0.001 |
| Age | ||||||
| <70 years | 1 | 1 | --- | --- | ||
| ≥70 years | 1.35 (1.24–1.48) | <0.001 | 1.15 (1.02–1.29) | 0.023 | --- | --- |
| Gender | ||||||
| Male | 1 | 1 | --- | --- | ||
| Female | 0.87 (0.81–0.93) | <0.001 | 0.90 (0.83–0.96) | 0.003 | --- | --- |
| Race | ||||||
| Non-Hispanic White | 1 | 1 | --- | --- | ||
| Non-Hispanic Black | 0.92 (0.83–1.02) | 0.106 | 0.92 (0.82–1.03) | 0.149 | --- | --- |
| Hispanic | 0.68 (0.59–0.79) | <0.001 | 0.73 (0.63–0.86) | <0.001 | --- | --- |
| Other | 0.88 (0.73–1.04) | 0.138 | 0.89 (0.74–1.07) | 0.210 | --- | --- |
| Facility Area | ||||||
| Metropolitan | 1 | 1 | --- | --- | ||
| Urban | 1.17 (1.05–1.30) | 0.003 | 1.12 (1.00–1.27) | 0.053 | --- | --- |
| Rural | 1.14 (0.86–1.51) | 0.351 | 1.18 (0.88–1.59) | 0.263 | --- | --- |
| Unknown | 1.27 (1.06–1.52) | 0.010 | 1.05 (0.83–1.31) | 0.704 | --- | --- |
| Facility Location | ||||||
| East | 1 | 1 | --- | --- | ||
| South | 0.99 (0.89–1.10) | 0.889 | 0.92 (0.82–1.04) | 0.179 | --- | --- |
| Central | 1.04 (0.93–1.16) | 0.498 | 0.99 (0.88–1.11) | 0.852 | --- | --- |
| West | 0.90 (0.79–1.03) | 0.130 | 0.87 (0.76–1.01) | 0.060 | --- | --- |
| Unknown | 0.75 (0.67–0.84) | <0.001 | 0.68 (0.59–0.79) | <0.001 | --- | --- |
| Facility Type | ||||||
| Non-Academic | 1 | 1 | --- | --- | ||
| Academic | 0.82 (0.76–0.89) | <0.001 | 0.84 (0.77–0.91) | <0.001 | --- | --- |
| Unknown | 0.68 (0.62–0.75) | <0.001 | --- | --- | ||
| Insurance | ||||||
| Commercial | 1 | 1 | --- | --- | ||
| Medicare | 1.34 (1.24–1.46) | <0.001 | 1.13 (1.01–1.25) | 0.026 | --- | --- |
| Medicaid | 0.96 (0.85–1.08) | 0.498 | 1.01 (0.89–1.14) | 0.891 | --- | --- |
| Uninsured | 1.03 (0.88–1.20) | 0.725 | 1.05 (0.90–1.24) | 0.520 | --- | --- |
| Other | 1.06 (0.86–1.32) | 0.563 | 1.05 (0.84–1.30) | 0.678 | --- | --- |
| Distance to Treatment Facility | ||||||
| ≤40 miles | 1 | 1 | --- | --- | ||
| >40 miles | 0.91 (0.84–0.99) | 0.036 | 0.93 (0.84–1.03) | 0.157 | --- | --- |
| Unknown | 1.50 (1.15–1.96) | 0.003 | 1.75 (0.59–5.17) | 0.309 | --- | --- |
| Zip Code Education Level | ||||||
| ≥21% | 1 | 1 | --- | --- | ||
| 13–20.9% | 1.09 (0.98–1.21) | 0.122 | 1.06 (0.95–1.19) | 0.304 | --- | --- |
| 7–12.9% | 1.09 (0.98–1.21) | 0.097 | 1.05 (0.93–1.20) | 0.423 | --- | --- |
| <7% | 1.03 (0.92–1.15) | 0.626 | 1.02 (0.88–1.19) | 0.757 | --- | --- |
| Unknown | 1.55 (1.18–2.04) | 0.002 | 0.57 (0.12–2.74) | 0.482 | --- | --- |
| Zip Code Income Level | ||||||
| <38,000 | 1 | 1 | --- | --- | ||
| 38,000–47,999 | 1.02 (0.92–1.14) | 0.673 | 1.01 (0.89–1.14) | 0.902 | --- | --- |
| 48,000–62,999 | 1.02 (0.92–1.14) | 0.708 | 0.95 (0.84–1.08) | 0.444 | --- | --- |
| ≥63,000 | 0.94 (0.85–1.04) | 0.240 | 0.89 (0.76–1.03) | 0.115 | --- | --- |
| Unknown | 1.47 (1.12–1.92) | 0.005 | 1.41 (0.44–4.46) | 0.564 | --- | --- |
| Charlson Deyo Score | ||||||
| 0 | 1 | 1 | --- | --- | ||
| 1 | 1.16 (1.05–1.29) | 0.003 | 1.08 (0.97–1.20) | 0.151 | --- | --- |
| 2 | 1.56 (1.27–1.92) | <0.001 | 1.39 (1.12–1.72) | 0.003 | --- | --- |
| 3 | 2.27 (1.52–3.39) | <0.001 | 2.48 (1.64–3.74) | <0.001 | --- | --- |
| Primary Site | ||||||
| Head and Neck | 1 | 1 | --- | --- | ||
| Upper Extremity | 0.78 (0.62–0.98) | 0.034 | 0.82 (0.65–1.04) | 0.105 | --- | --- |
| Lower Extremity | 0.75 (0.62–0.91) | 0.003 | 0.78 (0.64–0.95) | 0.014 | --- | --- |
| Thorax | 1.12 (0.91–1.38) | 0.281 | 1.02 (0.83–1.26) | 0.831 | --- | --- |
| Abdomen/Pelvis | 0.94 (0.77–1.13) | 0.495 | 0.93 (0.76–1.13) | 0.478 | --- | --- |
| Other/NOS | 0.98 (0.79–1.20) | 0.813 | 0.81 (0.65–1.00) | 0.050 | --- | --- |
| Histology | ||||||
| Unclassified | 1 | 1 | --- | --- | ||
| Undifferentiated Pleomorphic | 0.91 (0.77–1.07) | 0.247 | 0.91 (0.76–1.07) | 0.259 | --- | --- |
| Fibrosarcoma/Myxofibrosarcoma | 0.66 (0.53–0.82) | <0.001 | 0.78 (0.63–0.98) | 0.031 | --- | --- |
| Liposarcoma | 0.79 (0.68–0.91) | 0.001 | 0.86 (0.74–1.00) | 0.050 | --- | --- |
| Leiomyosarcoma | 0.68 (0.62–0.75) | <0.001 | 0.63 (0.57–0.69) | <0.001 | --- | --- |
| Synovial Sarcoma | 0.69 (0.61–0.79) | <0.001 | 0.89 (0.77–1.02) | 0.092 | --- | --- |
| Angiosarcoma | 1.12 (0.98–1.29) | 0.094 | 1.06 (0.92–1.22) | 0.440 | --- | --- |
| MPNST | 1.00 (0.84–1.20) | 0.976 | 1.20 (1.00–1.45) | 0.052 | --- | --- |
| Tumor Size | ||||||
| <5 cm | 1 | 1 | --- | --- | ||
| 5.1–10 cm | 1.13 (0.98–1.29) | 0.083 | 1.18 (1.03–1.36) | 0.017 | --- | --- |
| 10.1–15 cm | 1.15 (1.00–1.31) | 0.054 | 1.23 (1.06–1.42) | 0.005 | --- | --- |
| >15 cm | 1.16 (1.01–1.33) | 0.033 | 1.29 (1.12–1.49) | 0.001 | --- | --- |
| Unknown | 1.43 (1.25–1.63) | <0.001 | 1.31 (1.14–1.50) | <0.001 | --- | --- |
| Grade | ||||||
| I | 1 | 1 | --- | --- | ||
| II | 1.37 (0.98–1.92) | 0.068 | 1.48 (1.05–2.08) | 0.025 | --- | --- |
| III | 1.93 (1.43–2.61) | <0.001 | 1.98 (1.45–2.69) | <0.001 | --- | --- |
| Unknown | 1.86 (1.37–2.51) | <0.001 | 1.74 (1.28–2.37) | <0.001 | --- | --- |
| Year of Diagnosis | ||||||
| 2004–2007 | 1 | 1 | --- | --- | ||
| 2008–2011 | 0.90 (0.83–0.99) | 0.026 | 0.90 (0.82–0.98) | 0.021 | --- | --- |
| 2012–2015 | 0.90 (0.82–0.99) | 0.023 | 0.89 (0.80–0.98) | 0.014 | --- | --- |
Publisher’s Note: MDPI stays neutral with regard to jurisdictional claims in published maps and institutional affiliations. |
© 2021 by the authors. Licensee MDPI, Basel, Switzerland. This article is an open access article distributed under the terms and conditions of the Creative Commons Attribution (CC BY) license (http://creativecommons.org/licenses/by/4.0/).
Share and Cite
Reddy, V.K.; Jain, V.; Venigalla, S.; Nimgaokar, V.; Amurthur, A.; Lee, D.Y.; Sebro, R.A.; Maki, R.G.; Wilson, R.J., II; Weber, K.L.; et al. Definitive Local Therapy Is Associated with Improved Survival in Metastatic Soft Tissue Sarcomas. Cancers 2021, 13, 932. https://doi.org/10.3390/cancers13050932
Reddy VK, Jain V, Venigalla S, Nimgaokar V, Amurthur A, Lee DY, Sebro RA, Maki RG, Wilson RJ II, Weber KL, et al. Definitive Local Therapy Is Associated with Improved Survival in Metastatic Soft Tissue Sarcomas. Cancers. 2021; 13(5):932. https://doi.org/10.3390/cancers13050932
Chicago/Turabian StyleReddy, Vishruth K., Varsha Jain, Sriram Venigalla, Vivek Nimgaokar, Ashwin Amurthur, Daniel Y. Lee, Ronnie A. Sebro, Robert G. Maki, Robert J. Wilson, II, Kristy L. Weber, and et al. 2021. "Definitive Local Therapy Is Associated with Improved Survival in Metastatic Soft Tissue Sarcomas" Cancers 13, no. 5: 932. https://doi.org/10.3390/cancers13050932