1. Introduction
Skyrin (SKR; CAS No. 602-06-2; PubChem CID: 73071; C
H
O
; molecular weight: 538.5 g/mol) is a plant secondary metabolite that is structurally very similar to hypericin. It is probably involved in hypericin synthesis [
1,
2] or a molecule formed in parallel reactions [
3]. It was first isolated from
Penicillium islandicum in 1954 by Howard and Raistrick [
4]. Later, it was isolated from many other fungi, lichens and plants [
1,
5,
6,
7,
8,
9,
10,
11,
12,
13,
14,
15,
16,
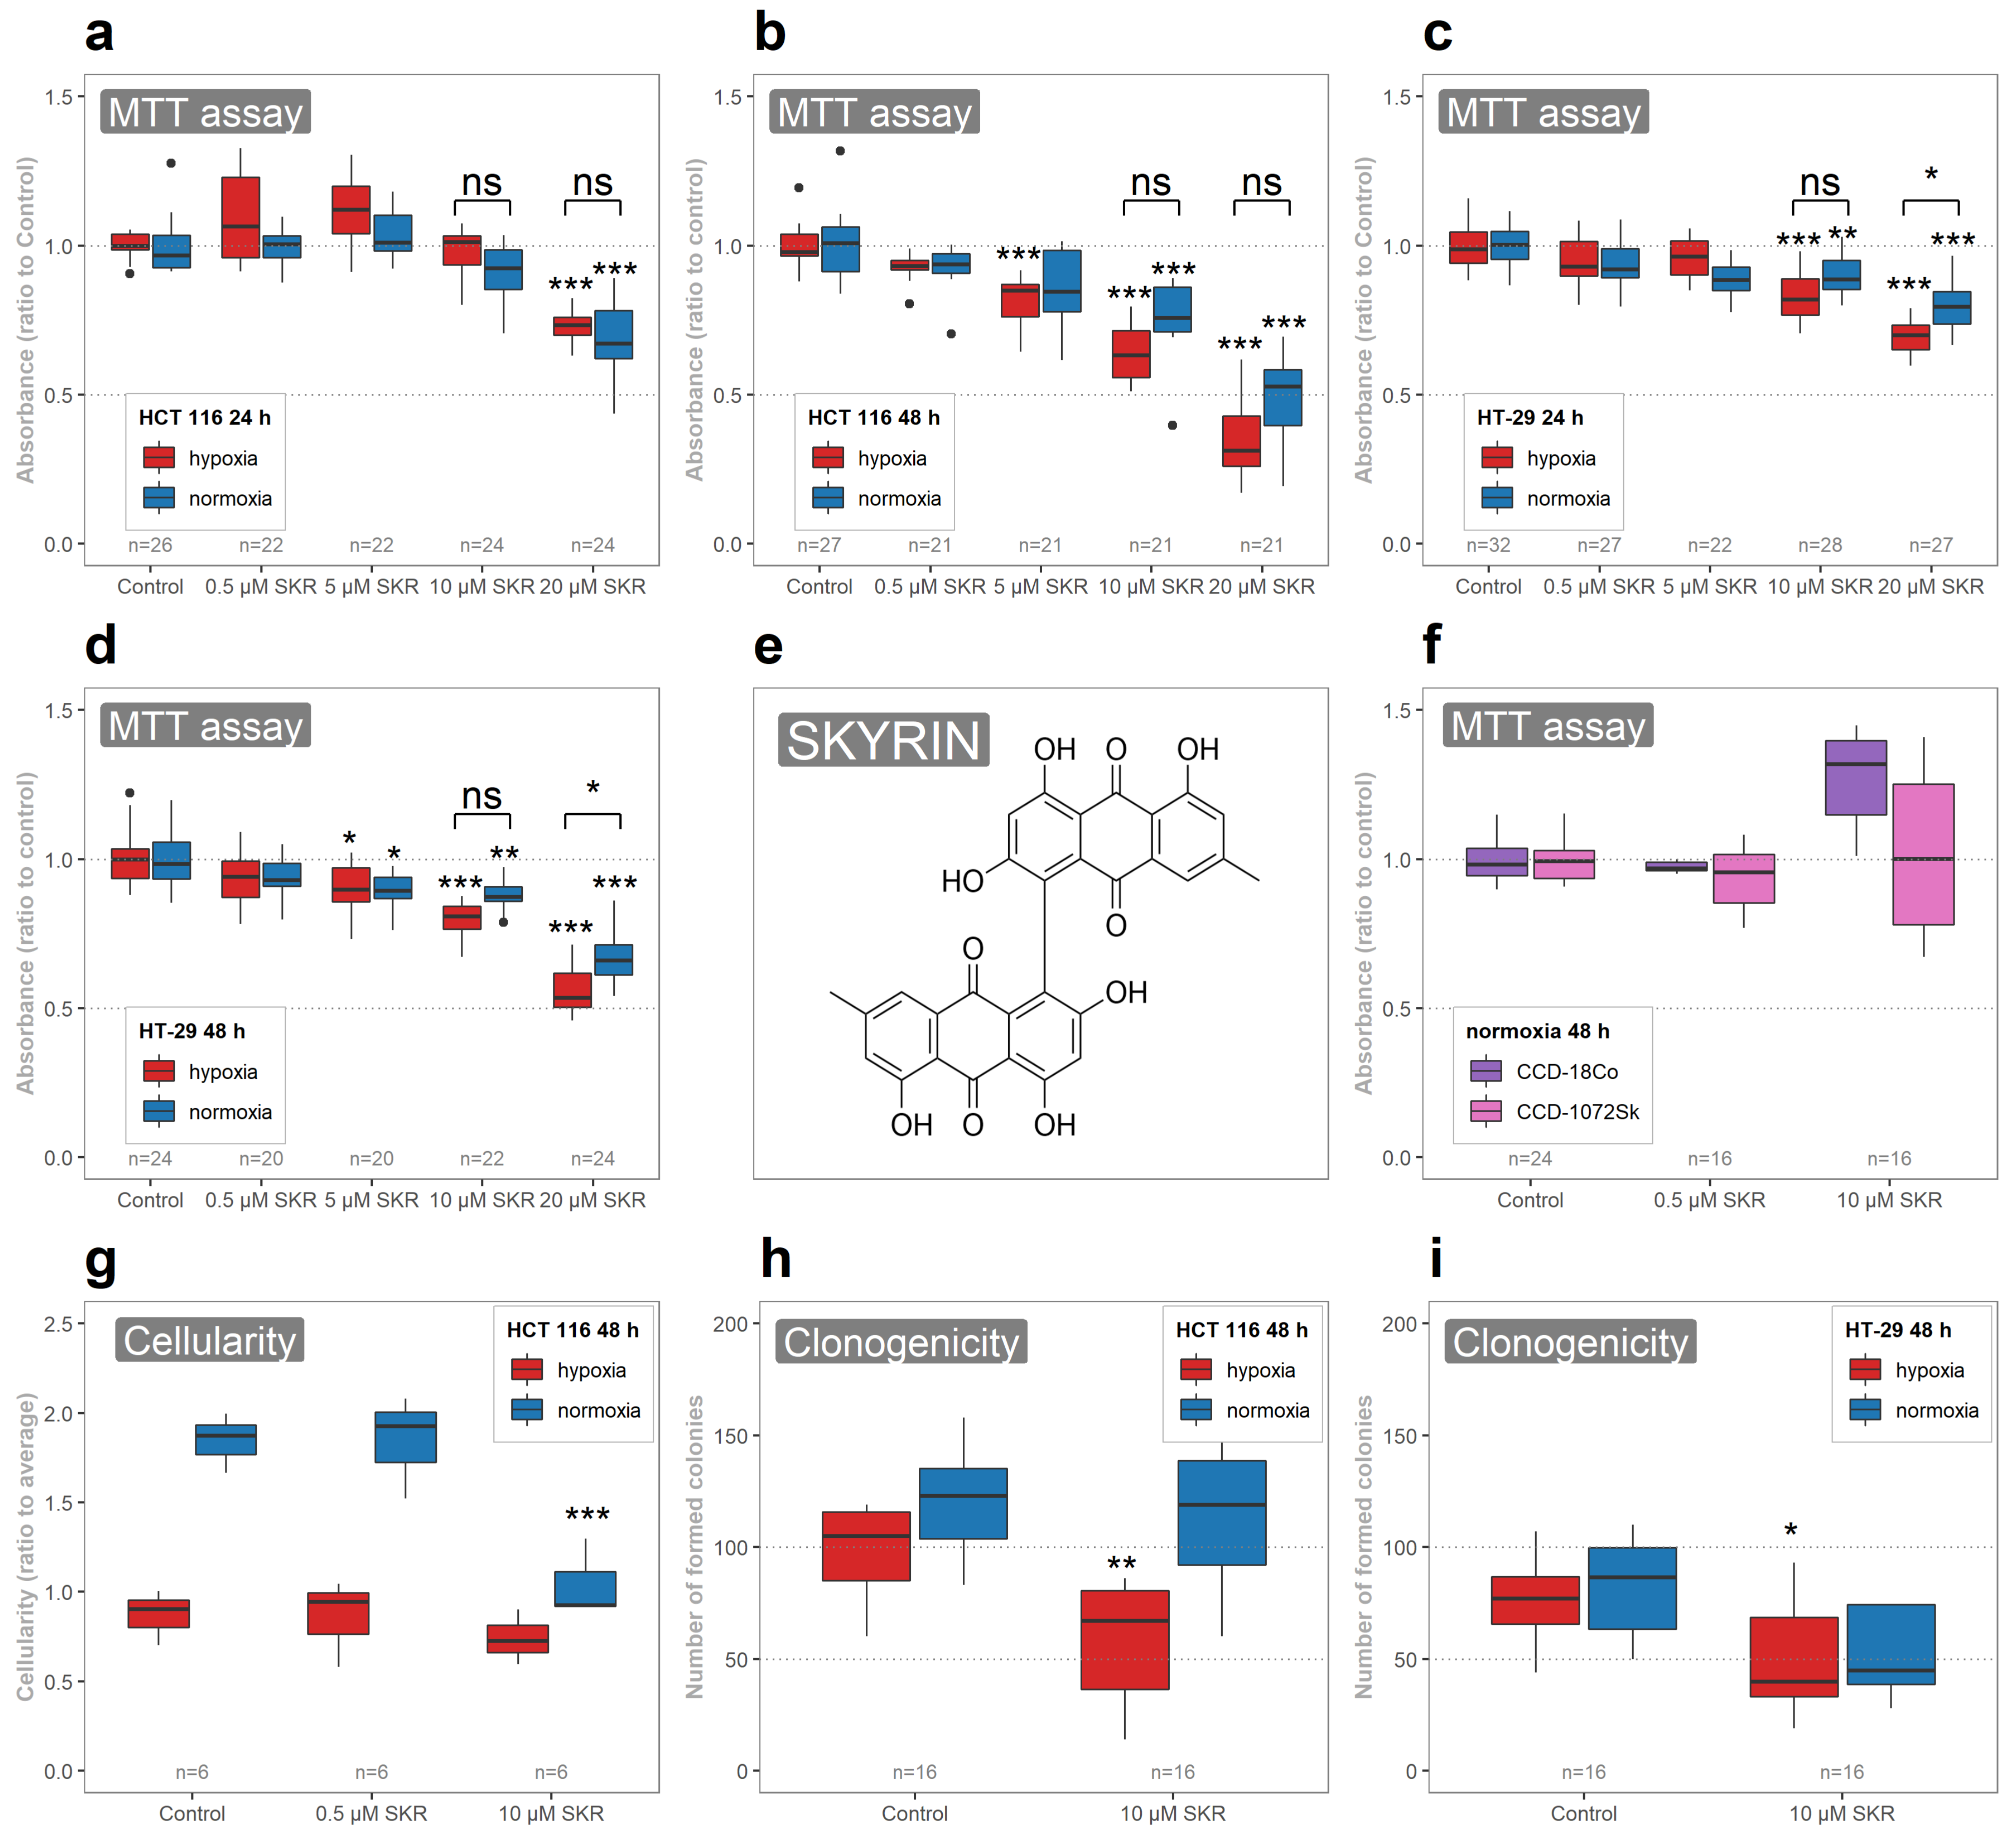
17]. It has a conformation of an emodin homodimer with a bisanthraquinone structure (
Figure 1e) [
5,
13,
14,
18].
The biological activity of SKR has been studied at several levels, from the inhibition of viral enzymes [
6], through antimicrobial activity against Gram-negative and Gram-positive bacteria [
19,
20] to cytotoxic activity against several cell lines [
8,
11,
12,
16,
21]. However, the mechanism of action of SKR is not fully understood. Kiyoshi et al. attributed the cytotoxic activity of SKR on mouse lymphocytic leukemia cell line L1210 to impaired adenosine triphosphate (ATP) synthesis in mitochondria [
5]. There was also observed DNA fragmentation with higher concentrations of SKR in the HL-60 cell line [
8]. SKR also interacts with casein kinase, estrogen receptor, dopamine beta-hydroxylase and glucagon receptor [
22]. Moreover,
I labeled SKR showed selective accumulation in necrotic tissue comparable to hypericin that makes it a suitable candidate as a radioisotopic drug in the therapy of solid tumors [
21]. This feature of SKR could be particularly interesting regarding solid tumors, which often possess a necrotic core that is closely related to the hypoxic area. Thus, SKR could preferentially accumulate and affect hypoxic cells that are related to the chemoresistant and invasive phenotype. Many plant secondary metabolites from the
Hypericum genus are used in the treatment of different types of cancer, although they are related to various side effects, as reviewed in [
23,
24].
Based on this, the interaction of SKR with biomolecules in hypoxic tissue, as well as the effect of SKR alone on those tumor cells that adapted to reduced oxygen, could be potentially interesting. Hypoxia is a condition in which a reduced oxygen content below a critical value is associated with the reduced function of organs and tissues [
25,
26,
27]. In solid tumors, hypoxic conditions occur for several reasons, in particular due to the increased distance of the cells from the oxygen source, to structural abnormalities of the tumor vasculature or to decreased microcirculation within a solid tumor [
25,
26,
28].
From the molecular point of view, cells in hypoxia undergo significant changes. The main reason is the elevated activity of the HIF-1 (hypoxia-inducible factor 1) complex as a result of the coupling of oxygen-sensitive subunit HIF-1α with HIF-1β [
29,
30]. HIF-1 regulates the expression of many genes involved in cell survival [
26,
28,
31,
32]. In cancer, HIF-1 activity is connected to angiogenesis, cell proliferation, metabolic adaptation or invasion and metastasis [
33]. Many other processes are also regulated by HIF transcription factors, especially those related to drug resistance or treatment failure [
33,
34,
35].
Death receptor 5 (DR5), known as Tumor necrosis factor-related apoptosis-inducing ligand (TRAIL) receptor 2 or Tumor necrosis factor receptor superfamily 10B or CD262 (DR5, TRAILR2 or TNFRSF10B; UniProt reference O14763) is a surface receptor that binds TRAIL and mediates apoptosis [
36,
37,
38,
39]. Moreover, HIF-2α can act as a promoter of DR5 expression [
40]. However, TRAIL-promoted apoptosis is attenuated in hypoxia [
41,
42]. Many drugs with a similar chemical structure to SKR upregulate DR5 [
43,
44,
45,
46,
47], but the mechanism is still unknown. In our study, we chose the colorectal cancer cell line, which represents a model of rapidly expanding cancer cells forming hypoxic central regions within the solid mass [
48,
49]. Hypoxia is also coupled with a poor prognosis to TRAIL-mediated treatment in cancer patients [
41,
42,
50]. The lack of oxygen in combination with the increase of anti-apoptotic Bcl-2 (B-cell lymphoma 2 protein) attenuates TRAIL-mediated therapy in hypoxic conditions [
41,
42,
51]. Thus, the sensitization of hypoxic tumors to TRAIL-mediated treatment represents a propsective anticancer strategy.
3. Discussion
To determine the effect and the molecular background of the action of SKR, different cell lines cultivated under different cultivation conditions and exposed to different treatment regimens were used in our study. To do so, we analyzed the metabolic activity of SKR-treated cells, evaluated their cellularity, colony-forming ability, cell cycle distribution and the occurrence of apoptosis and necrosis and performed comparative proteomics analysis.
In our study, two different human colorectal adenocarcinoma cell lines were used with distinct responses to SKR action and hypoxia. The main difference between these cell lines that could be manifested in their different sensitivity to SKR was that HCT 116 is a p53 wild-type cell line with defect DNA mismatch repair but without chromosomal instability [
52]. In contrast, HT-29 is a p53 mutant with intact mismatch repair and chromosomal instability [
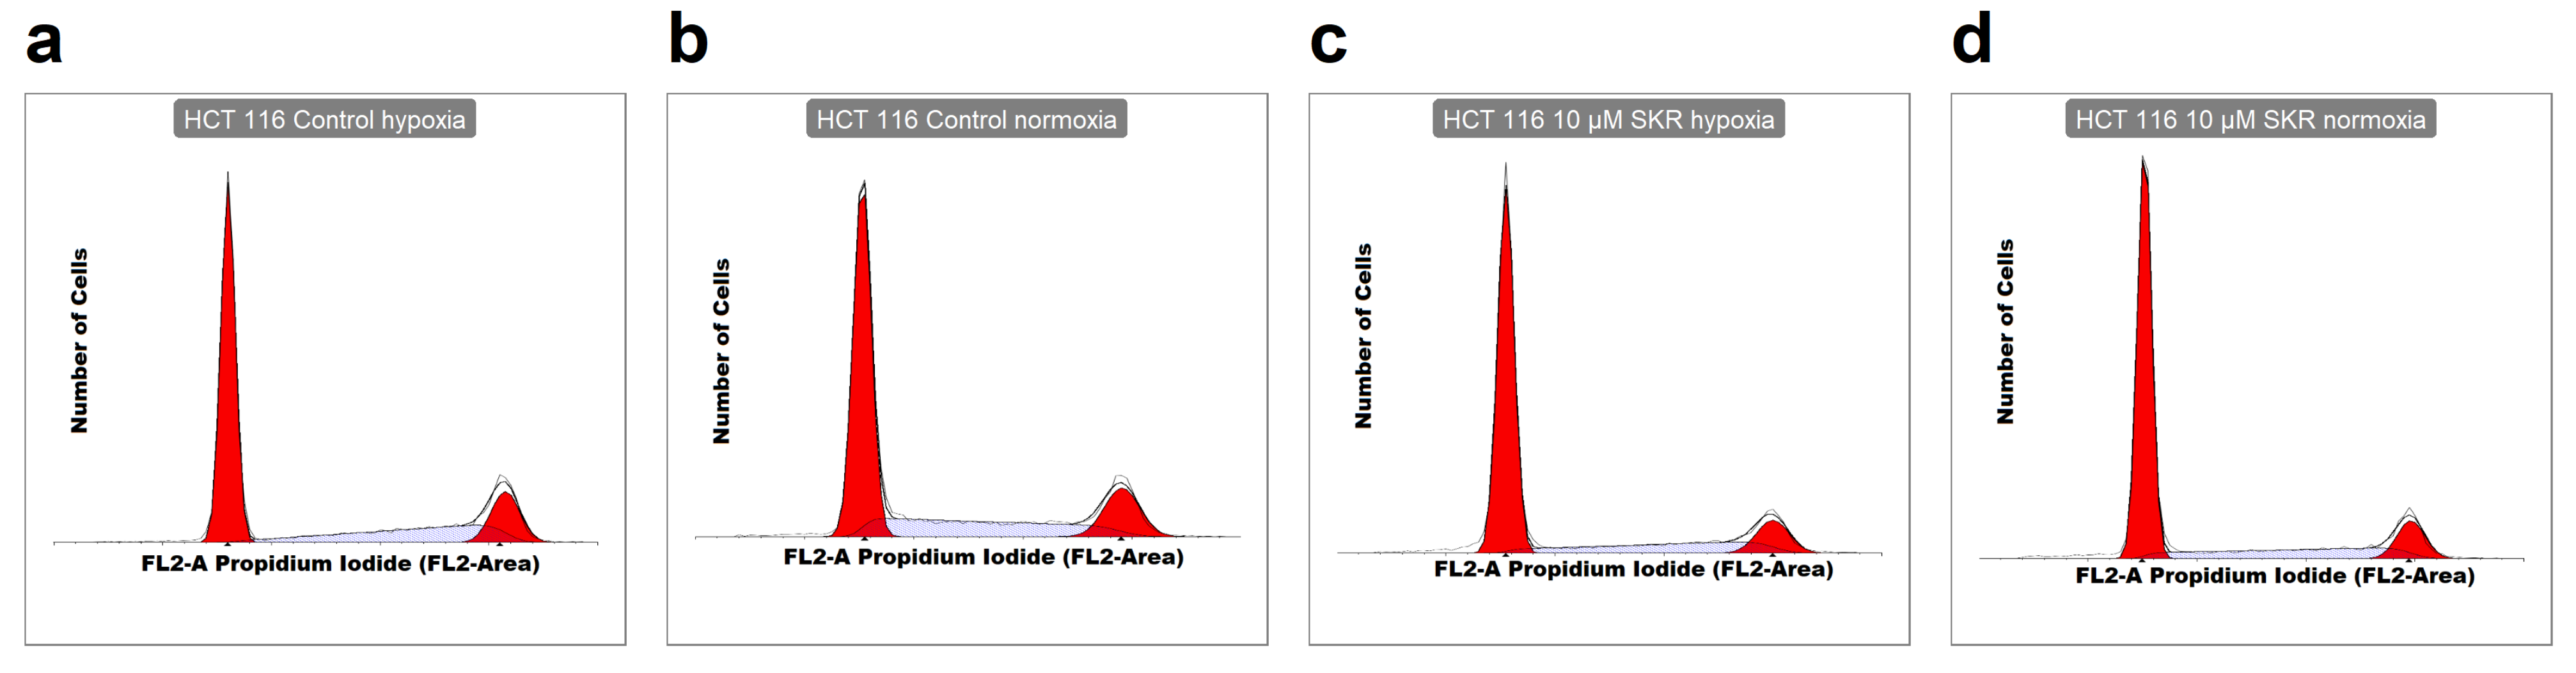
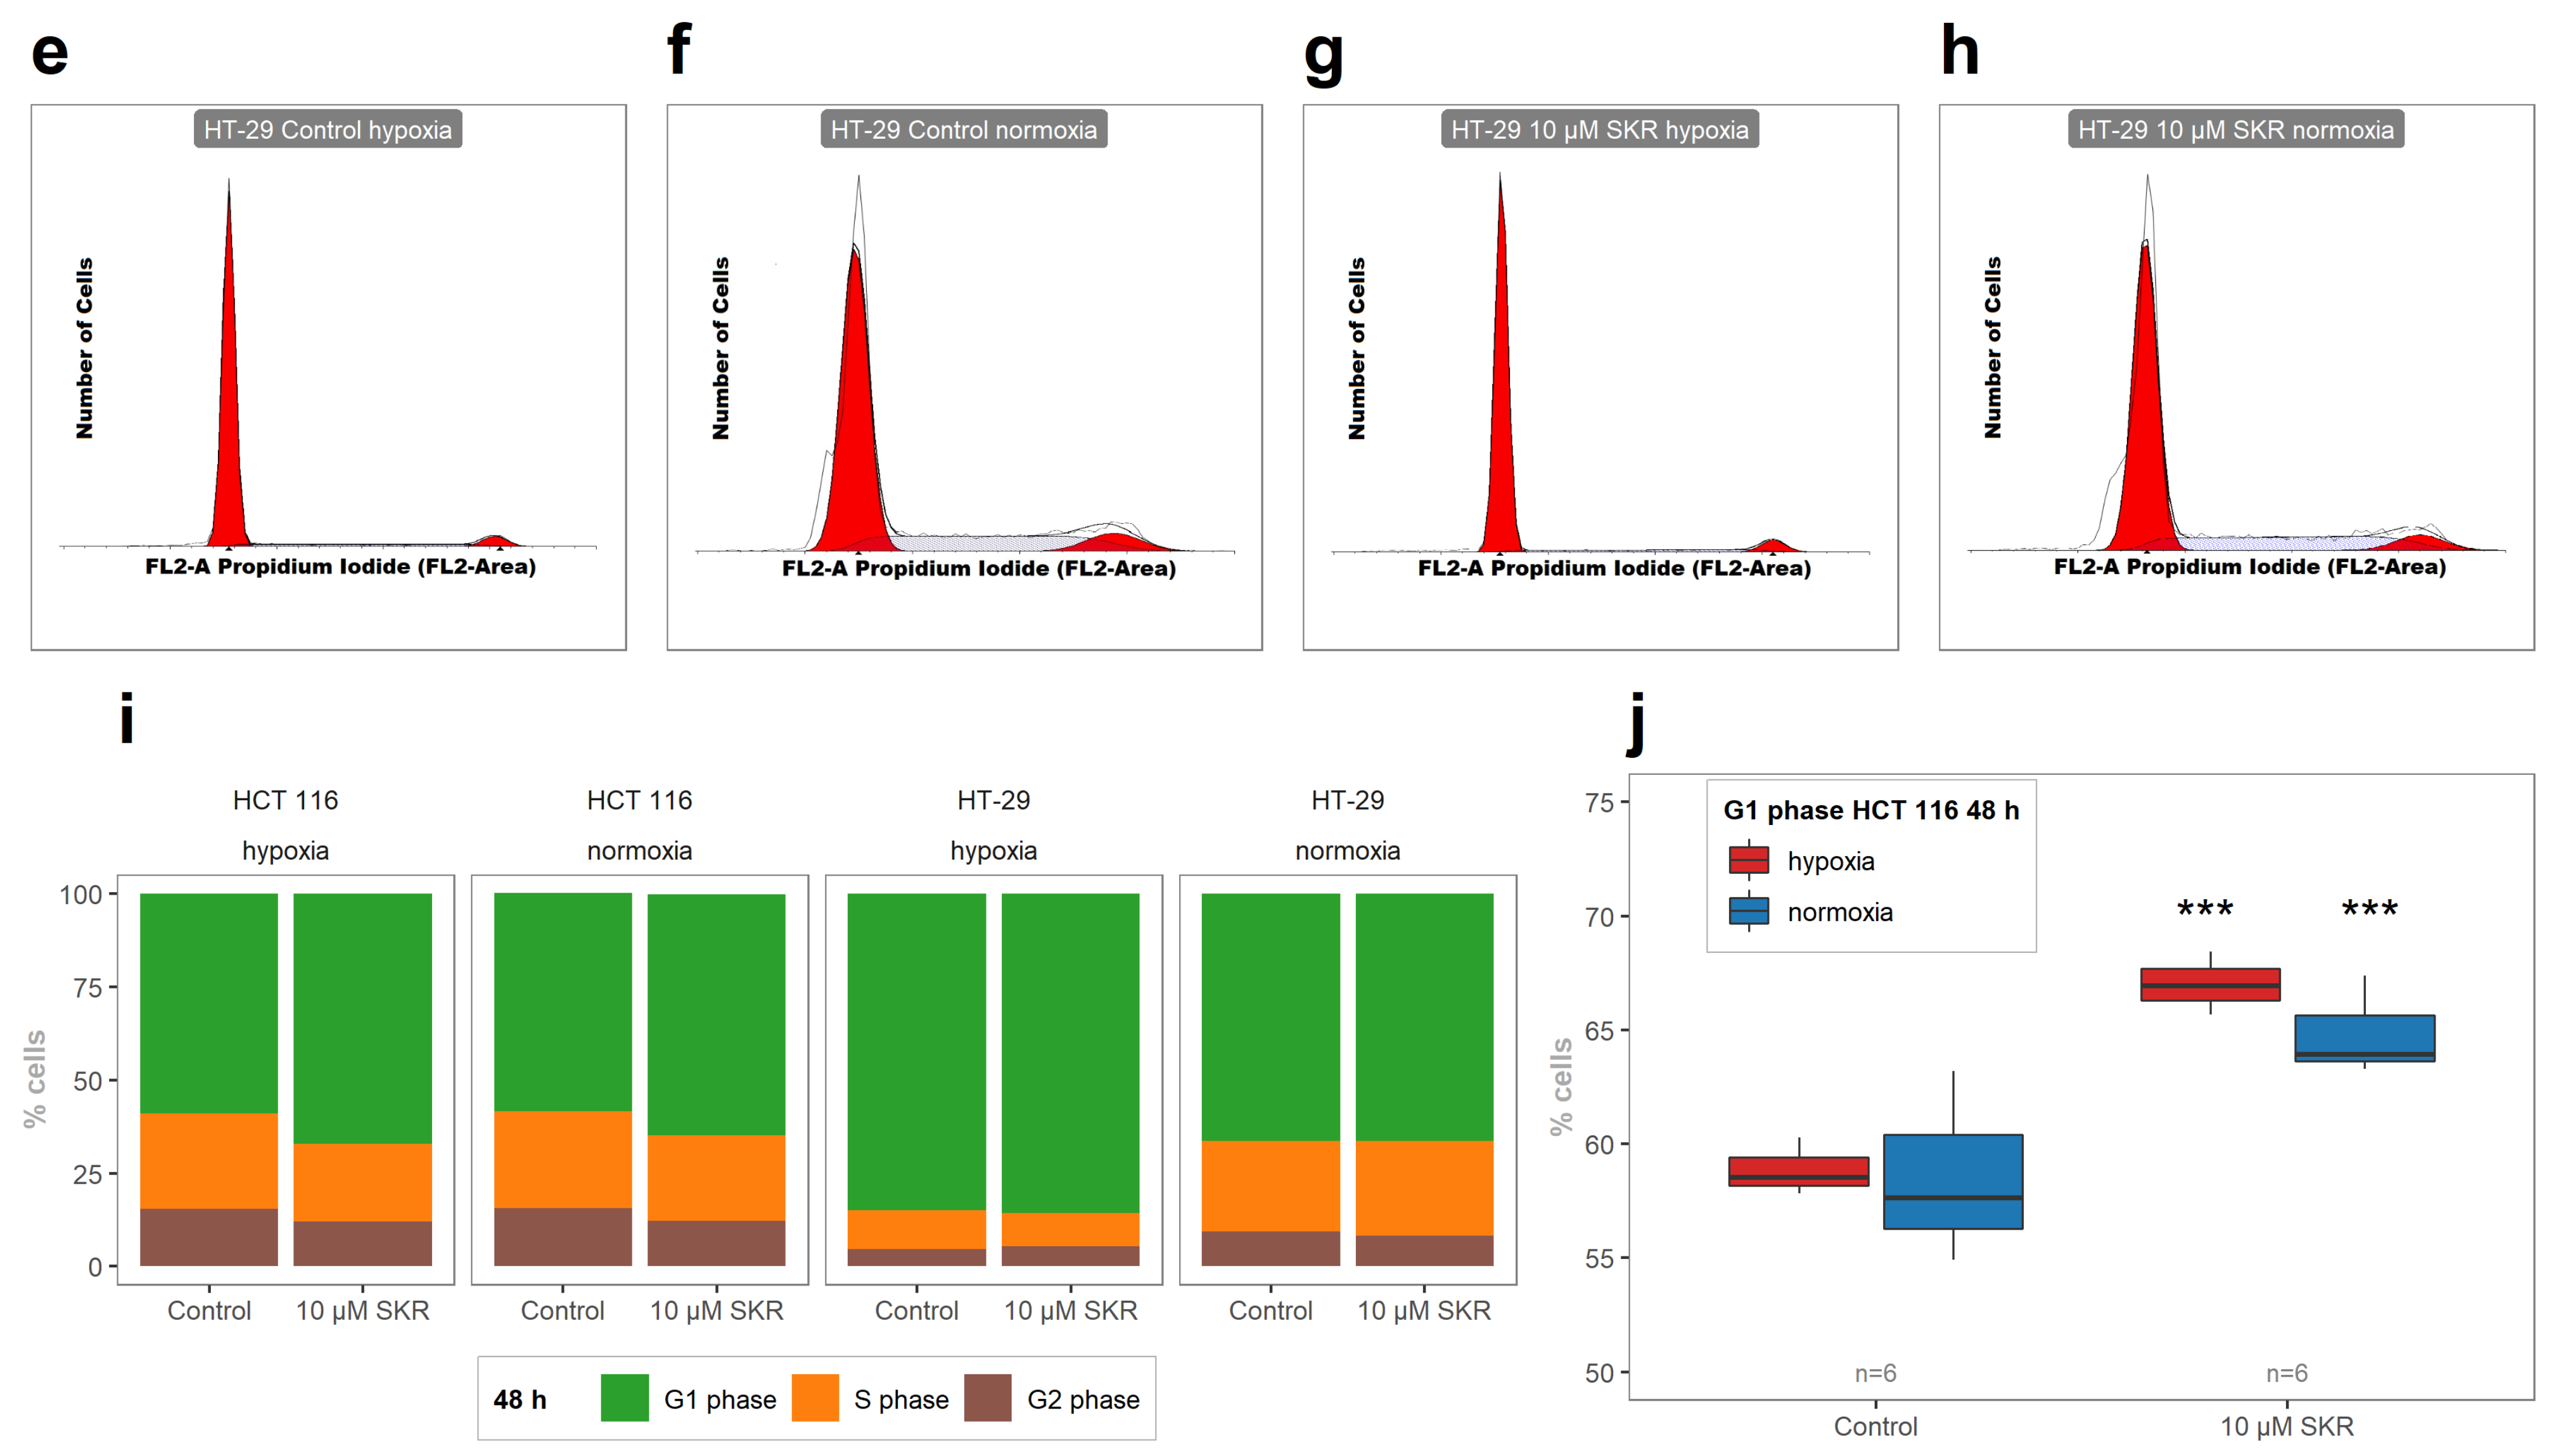
52]. In our study, a more pronounced effect of SKR on HCT 116 cells was observed, which was reflected by decreased metabolic activity, an increased number of apoptotic cells and the accumulation of cells in G1. It is known that p53 knocked-out cells are more sensitive to treatment leading to DNA damage [
53]. Moreover, HCT 116 cell line is more sensitive to apoptosis induced by 5-Fluorouracil and oxaliplatin because of the loss of Bax expression [
54]. Based on these facts, we hypothesize that the observed effect of SKR probably does not depend on DNA damage.
The attenuated effect of SKR seen in HT-29 cell line can be associated with an overexpression of ATP-binding cassette super-family G member 2 (ABCG2) [
55,
56]. Elevated ABCG2 levels are responsible for decreasing the intracellular accumulation and thus the efficiency of another anthraquinone derivate—hypericin—as was shown by the decreased efficacy of the hypericin-mediated treatment of adenocarcinoma cells [
56,
57,
58]. Many other anthraquinone derived drugs, such as mitoxantrone [
59,
60,
61,
62] or hypericin [
56,
57], are effluxed by ABCG2 transporter. Based on the chemical similarity of SKR to anthraquinone, we assume that SKR could be the substrate for ABCG2 transporter protein. This could explain the diminished impact of SKR on the metabolic activity of HT-29 cells (with overexpressed ABCG2) compared to HCT 116 cells (with low ABCG2 expression). Since SKR does not exhibit fluorescent properties, this needs to be further elucidated; e.g., using labeled SKR. Moreover, as our results show, HT-29 cells were not only more resistant to the effect of SKR but were also less impacted by hypoxia in general (when comparing HT-29 vs. HCT 116 but also untreated vs. treated HT-29). We assume that this could be mainly because HT-29 is more tolerant of the lack of oxygen than HCT 116 [
52]. Nevertheless, the long-term cultivation in discontinued hypoxia leads to a more aggressive phenotype of HCT 116 cells [
52]. Hypoxia induces several intracellular signaling pathways, such as hypoxia-inducible factor or PI3K/AKT/mTOR pathways [
26].
Since we performed only an MS analysis of HCT 116 cells, we cannot confirm this assumption. However, based on a great deal of evidence from other studies, hypoxia potentiates both the level and activity of ABC transporter proteins, among which are ABCG2 and P-gp through the activation of ERK pathway [
34,
63,
64]. Thus, the activity of efflux pumps should be significantly enhanced in hypoxia [
65,
66]. Despite that fact, a significant effect of SKR in hypoxia was noted in HCT 116, as well as in HT-29 with ABCG2 overexpression. Nevertheless, based on the literature, the upregulation of surface death receptors is associated with the inhibited efflux function of P-gp and downregulation of c-FLIP [
67].
The dose-dependent negative effect of SKR on metabolic activity was proven in both used cancer cell lines. The effect of SKR on metabolic activity corresponds with the results of other authors. IC50 values of SKR in normoxic conditions vary from 20
M in L1210 cells [
7] to 74
M in HL-60 cells [
8] and 70
M in A549 cells [
16]; thus, its effect is obviously highly dependent on cell type. The inhibition of the metabolic activity was observed in HeLa, Vero, K592, Raji, WISH, Calu-1 and HCT 116 cells. The IC50 of SKR for HCT 116 cells after 24 h presented in the literature was set to 59
M [
11,
16]. For comparison, the concentration that decreases metabolic activity to 25 % for HCT 116 cells in our study, based on an MTT assay, was set to 17.88 ± 1.56
M in normoxia after 24 h and to 6.70 ± 0.34
M in hypoxia after 48 h (
Table 1). The theoretically calculated values for a 50% decrease of metabolic activity based on an MTT assay (only partially extrapolated from the linearized model calculated from observed data—the highest used concentration was 20
M) are 33.27 ± 3.17
M for 24 h in normoxia, 19.68 ± 1.54
M for 48 h in normoxia, 38.03 ± 4.09
M for 24 h in hypoxia and 14.84 ± 0.55
M for 48 h in hypoxia. Moreover, we performed the analysis of the metabolic activity of pathologically unchanged cells in reaction to SKR treatment. We did not notice an inhibitory effect of SKR on healthy cells (
Figure 1c), leading us to assume that SKR selectively affects cancer cells. Regarding the long-term effect of SKR on cell survival, similar to the attenuated colony-forming ability seen in MIA PaCa-2 cells in normoxia [
16], we noticed a significantly decreased number of formed colonies in both cancer cell lines treated with SKR in hypoxia.
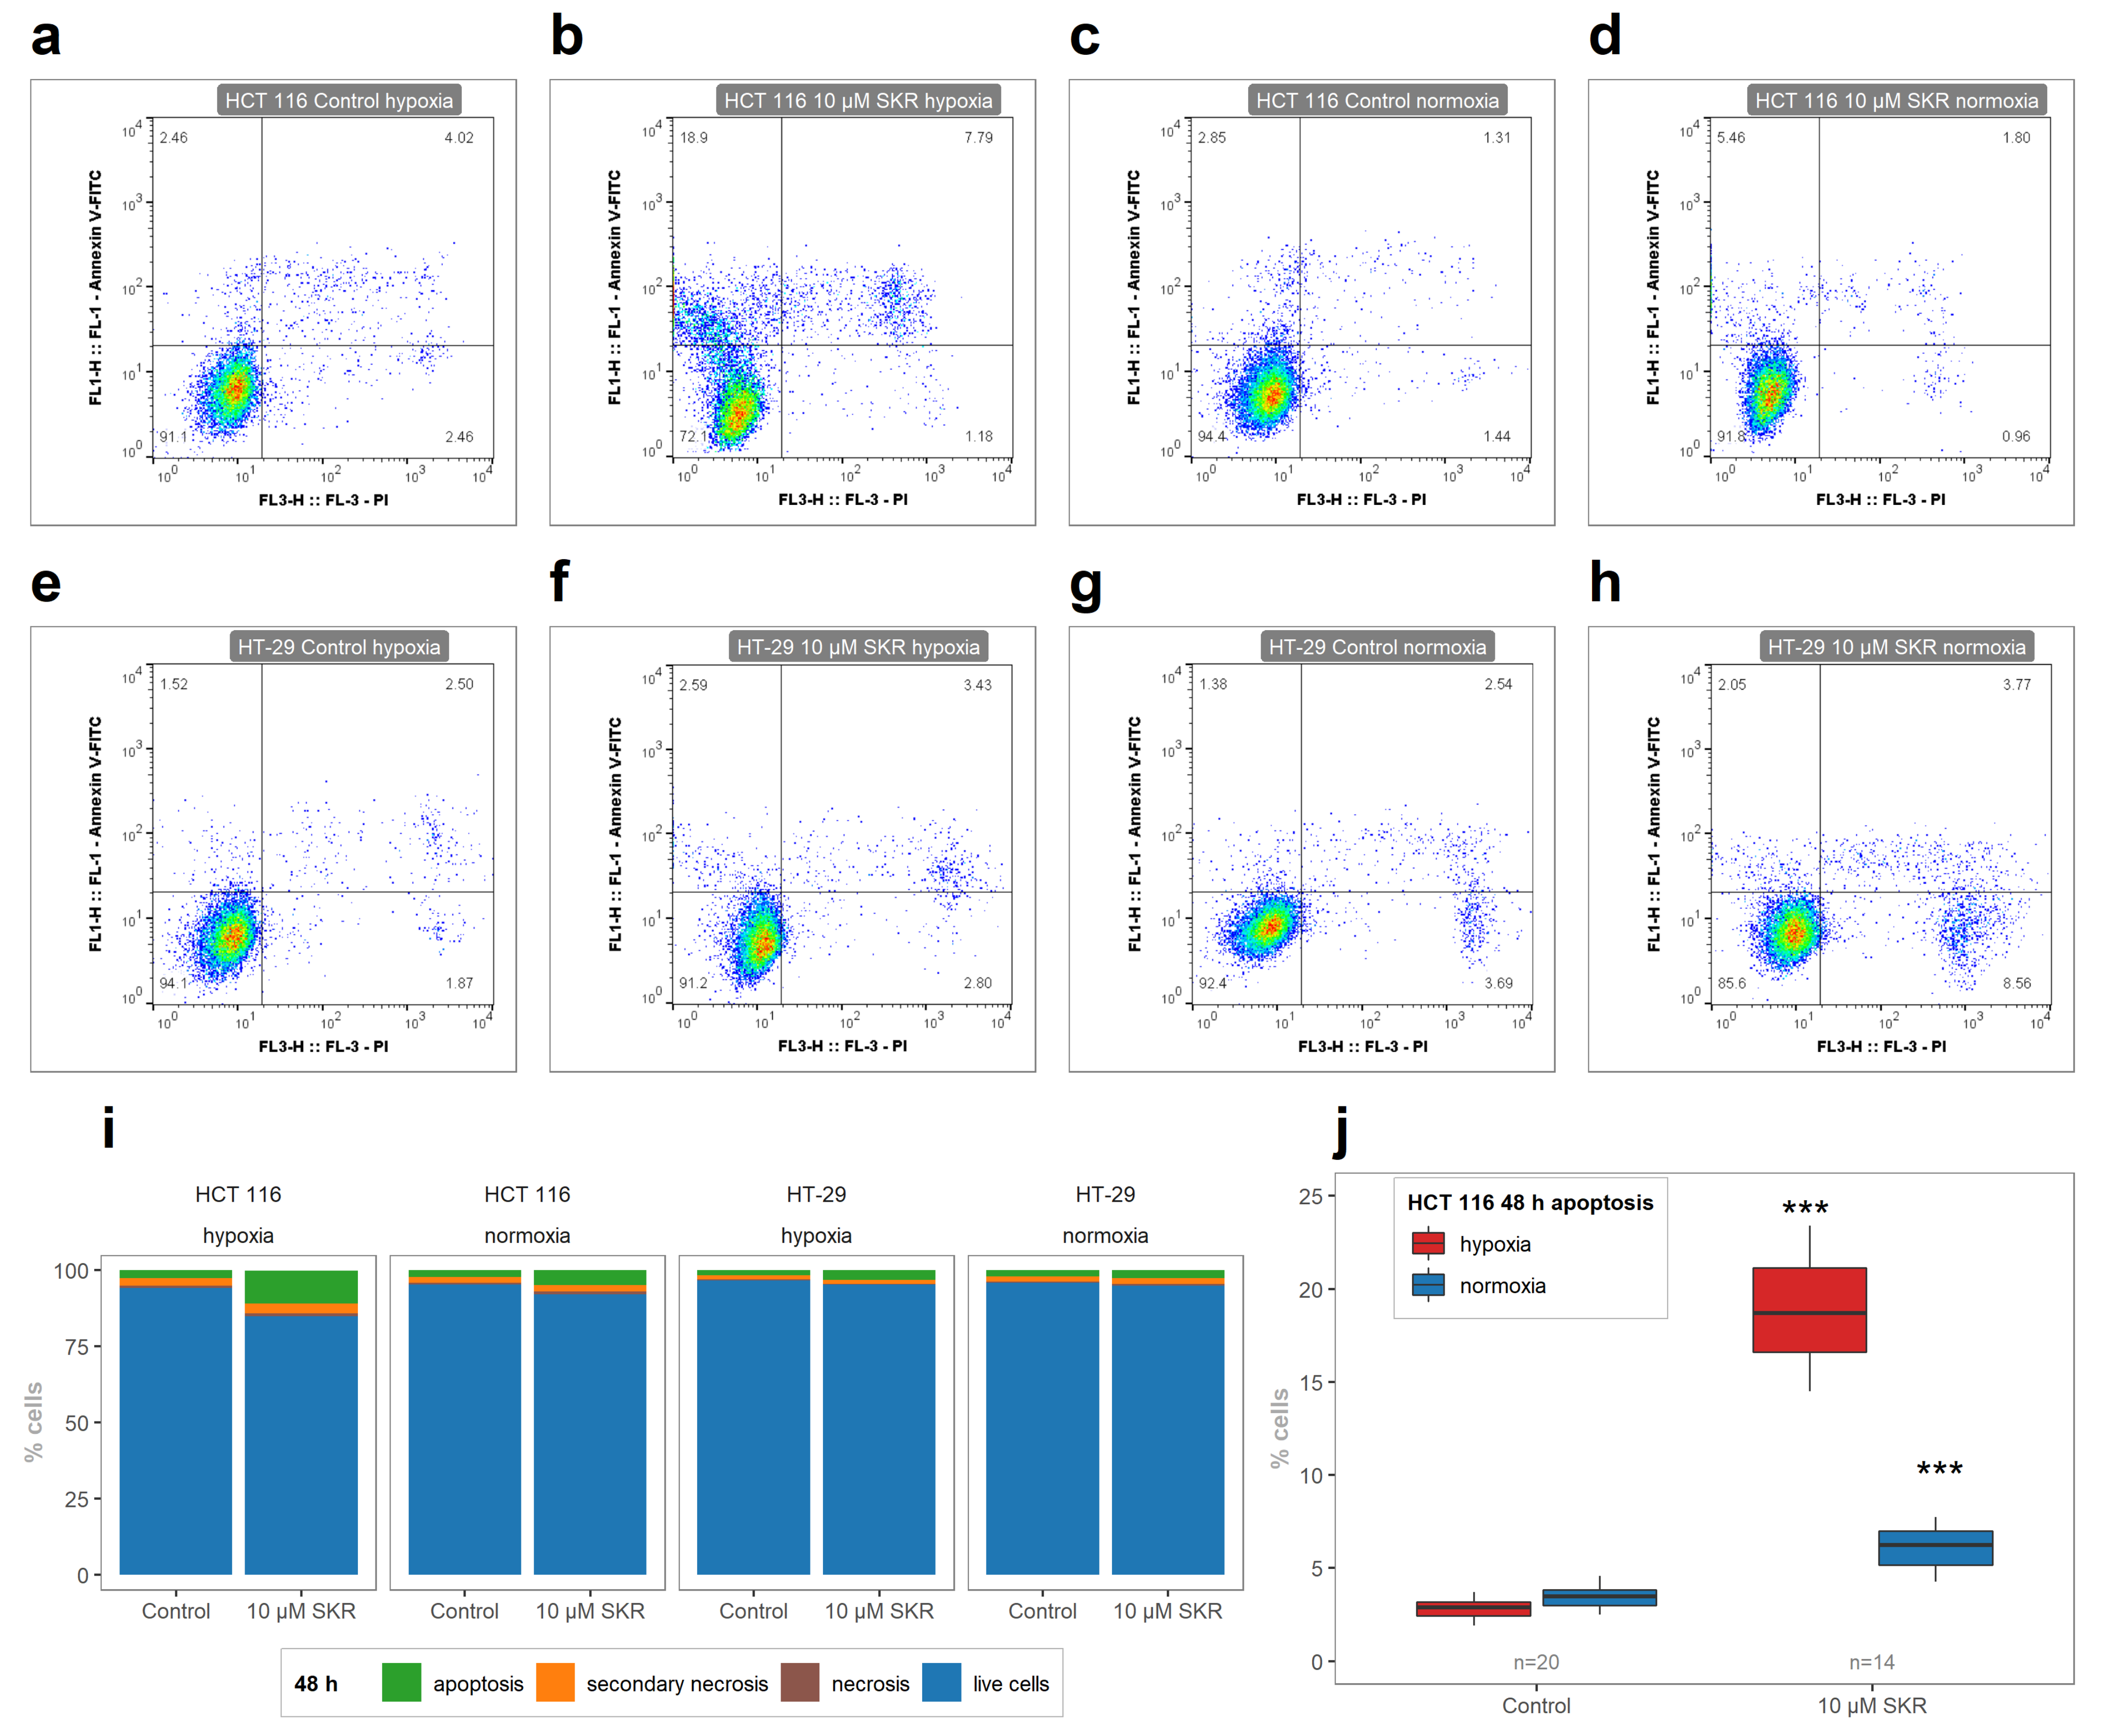
The level of apoptosis induced by SKR treatment can also be compared with the results of other authors. MIA PaCa-2 cells were treated with SKR in a concentration of 18 μM, and a significant increase of the number of apoptotic cells was observed by fluorescent microscopy via the detection of phosphatidylserine externalization with Annexin V [
16]. In our study, the significant increase of apoptotic cells was observed in a 10 μM concentration of SKR in HCT 116 cells (
Figure 2). There were no changes in the number of apoptotic cells in HT-29 cell line after SKR treatment. The comparison of healthy cells without decreased metabolic activity and cancer cell lines with an increased apoptosis rate together with the upregulation of DR5 leads us to the assumption that the effect of SKR can be caused by the higher sensitivity of cells to TRAIL.
TRAIL also known as APOL2L (Apolipoprotein L2 ligand) or CD253, is a molecule that stimulates apoptosis in cancer cells but not in normal, nontransformed cells [
36,
37,
68,
69,
70,
71,
72]. TRAIL is also an important immune effector agent regulating the growth of tumors [
38]. However, the TRAIL resistance of tumor cells is a very common problem [
70,
72]. TRAIL resistance can be caused by a mutation in p53 [
36] as well as the downregulation of DRs or upregulation of anti-apoptotic proteins [
37]. A large number of drugs have been shown to overcome TRAIL resistance. The upregulation of its receptor, DR5, is the common way of sensitizing cells to treatment; for example, with doxorubicin [
43,
44], goniothalamin [
73], emodin [
45], ibuprofen [
46], mitoxantrone [
47], apigenin [
74], Hsp90 inhibitors [
75], resveratrol [
76], indirubin-3-monoxime [
77] or cyclopamine [
78].
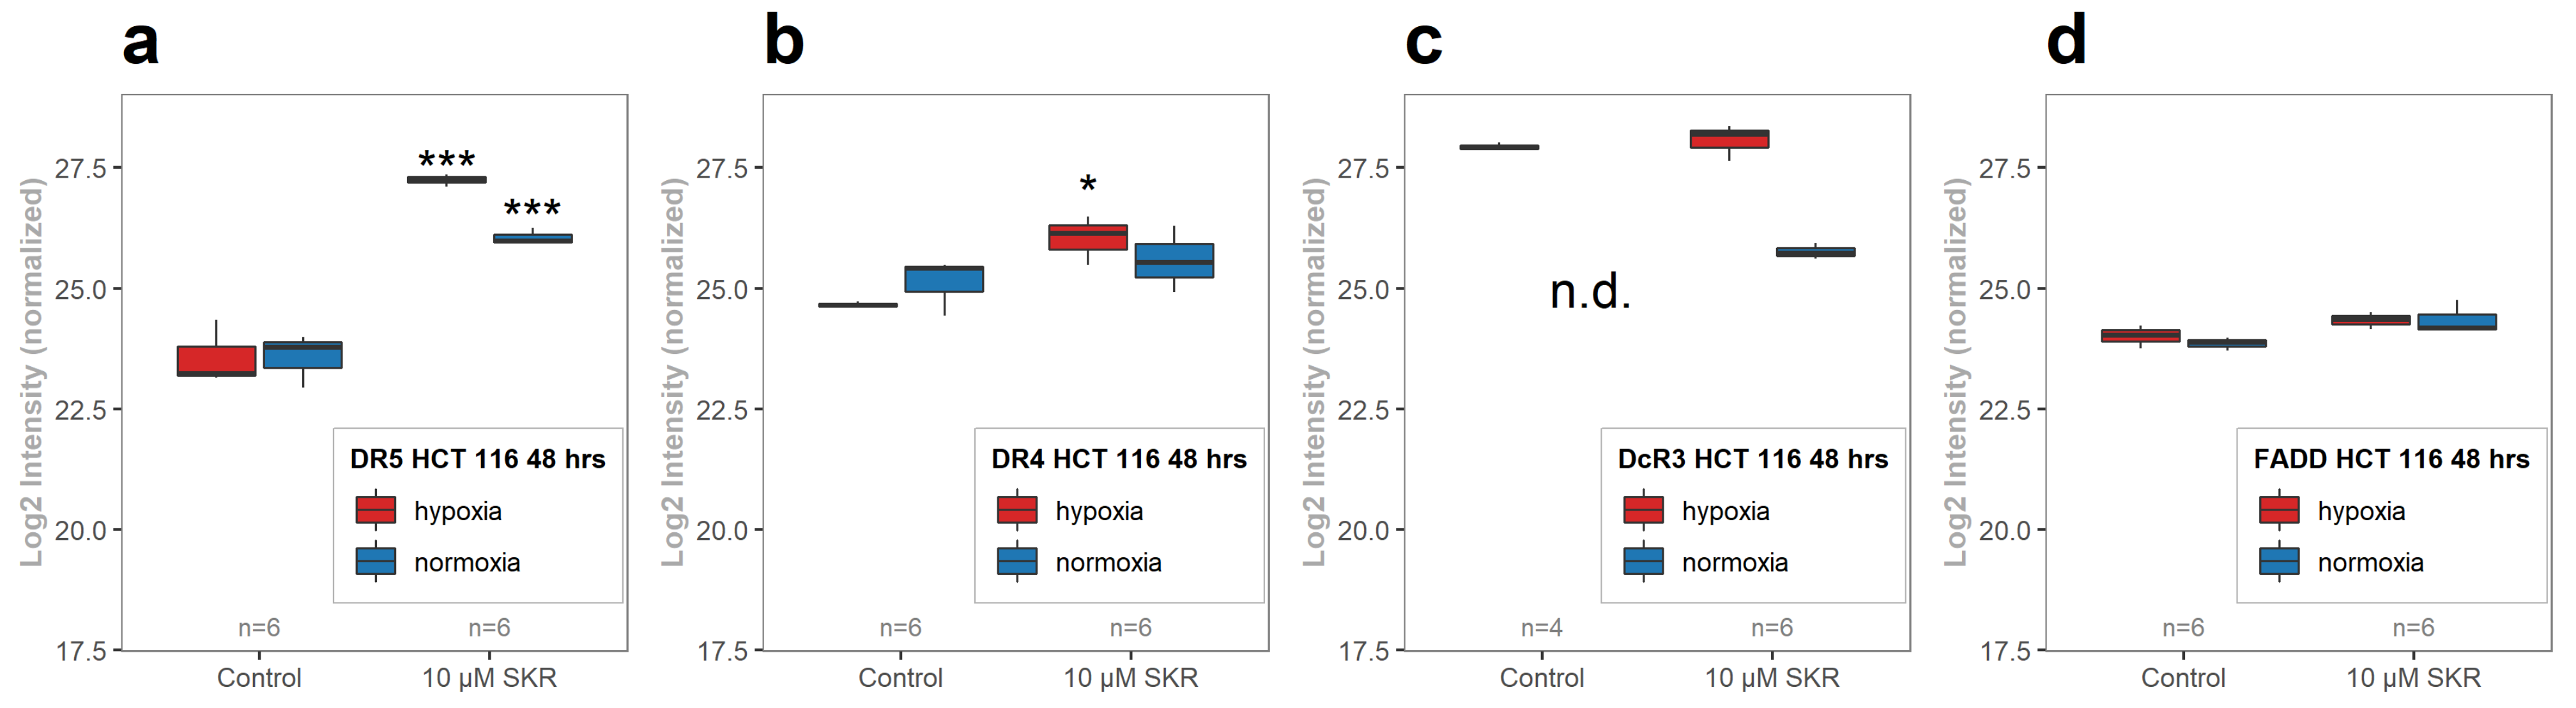
To verify the effect of SKR on TRAIL resistance, we also performed phosphatidylserine externalization analyses of samples with TRAIL treatment and a combination of SKR and TRAIL. HT-29 cell line is TRAIL-resistant, which correlates with a notably lower basal expression of DR5 as well as DR4 (
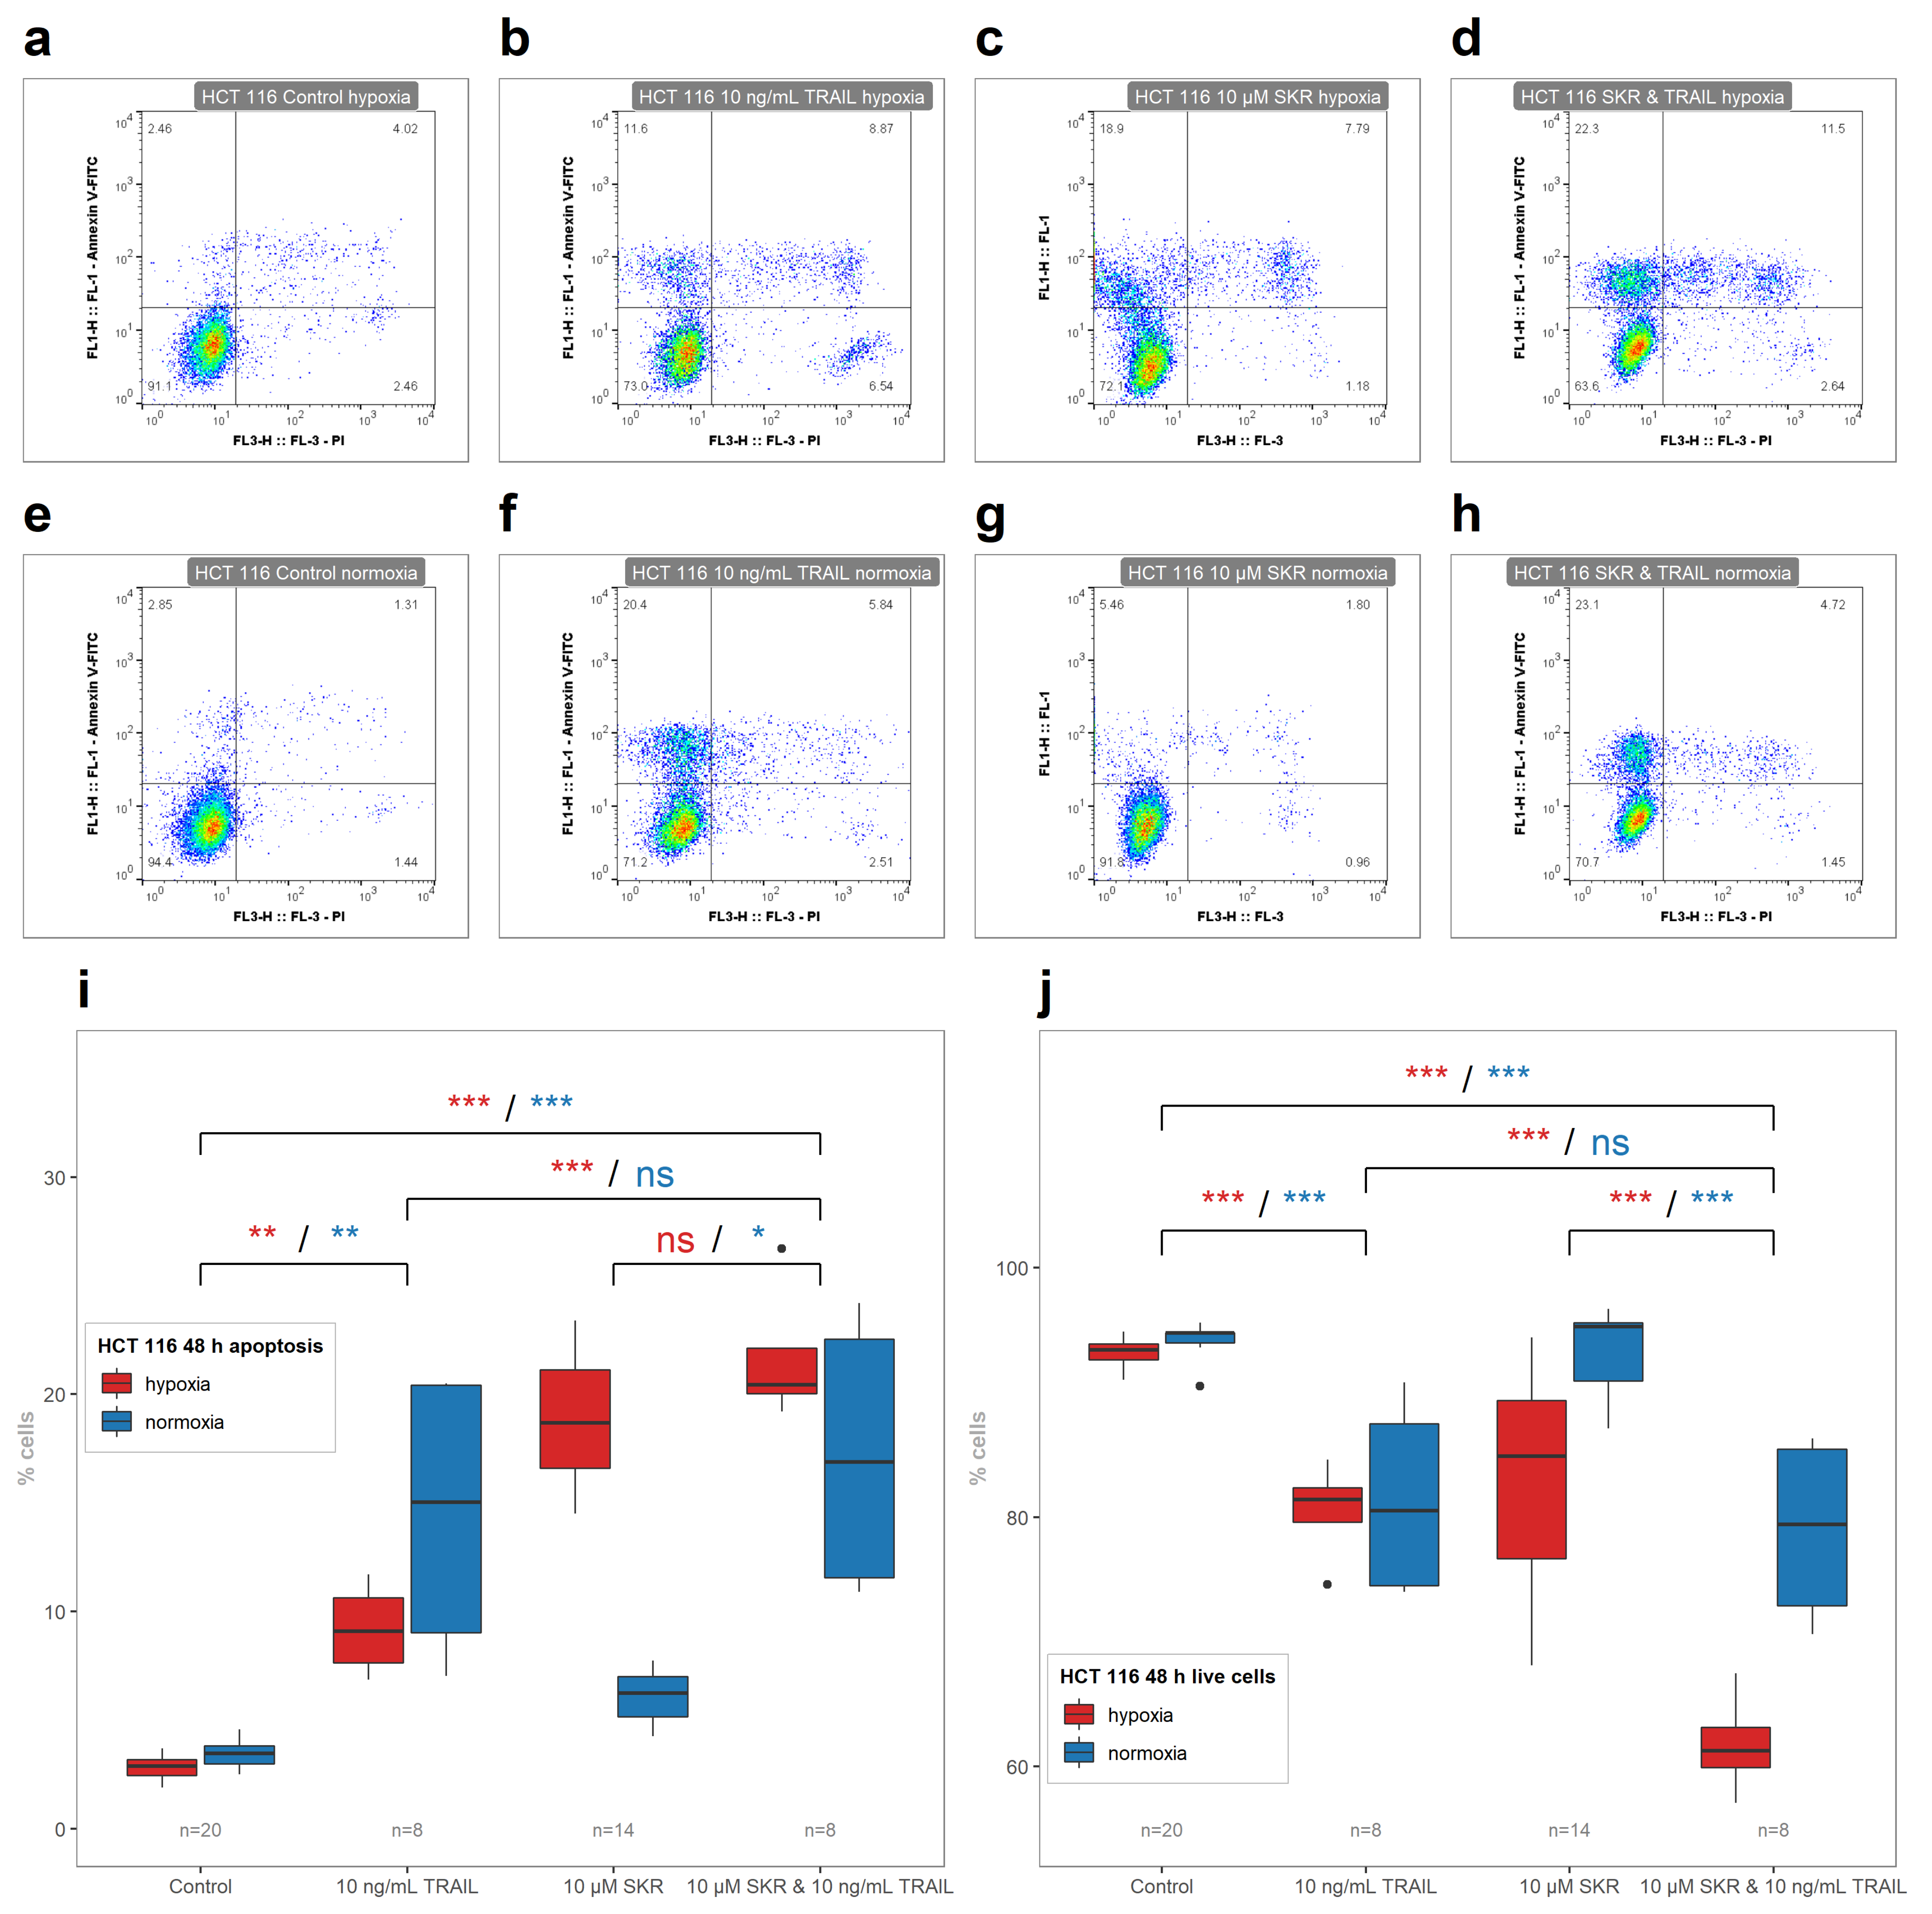
Figure 6b,c,e,f,h,i). In samples with TRAIL only, the effect in HT-29 was more pronounced in hypoxia, which was opposite to HCT 116 cell line, with a more prominent effect in normoxia. The effect of many TRAIL-targeted therapies is attenuated in hypoxia [
74,
78]. Furthermore, HCT 116 cells exposed to hypoxia are less susceptible to TRAIL than cells in normoxia, mainly because of the increase of anti-apoptotic Bcl-2 [
41,
42] and because of the attenuated apoptosis signal due to mitochondria damage during oxygen deprivation [
51]. However, TRAIL-induced apoptosis can bypass the intrinsic apoptosis pathway controlled by Bcl-2 in cancer [
79].
TRAIL in combination with SKR has a cooperative effect in hypoxia on HCT 116 cell line based on the decreased number of live cells (
Figure 7j). In normoxia, the effect of SKR and TRAIL was on the level of TRAIL. We assume that the lack of an increase of apoptotic cells can be caused by the relative overabundance of DR5, as well as in HCT 116 cells without SKR pretreatment, where the amount of naturally present TRAIL in the medium is sufficient for apoptosis to be switched on.
There was also an enhanced effect of TRAIL on apoptosis induction in SKR-pretreated cells in HT-29 cell line in hypoxia as well in normoxia (
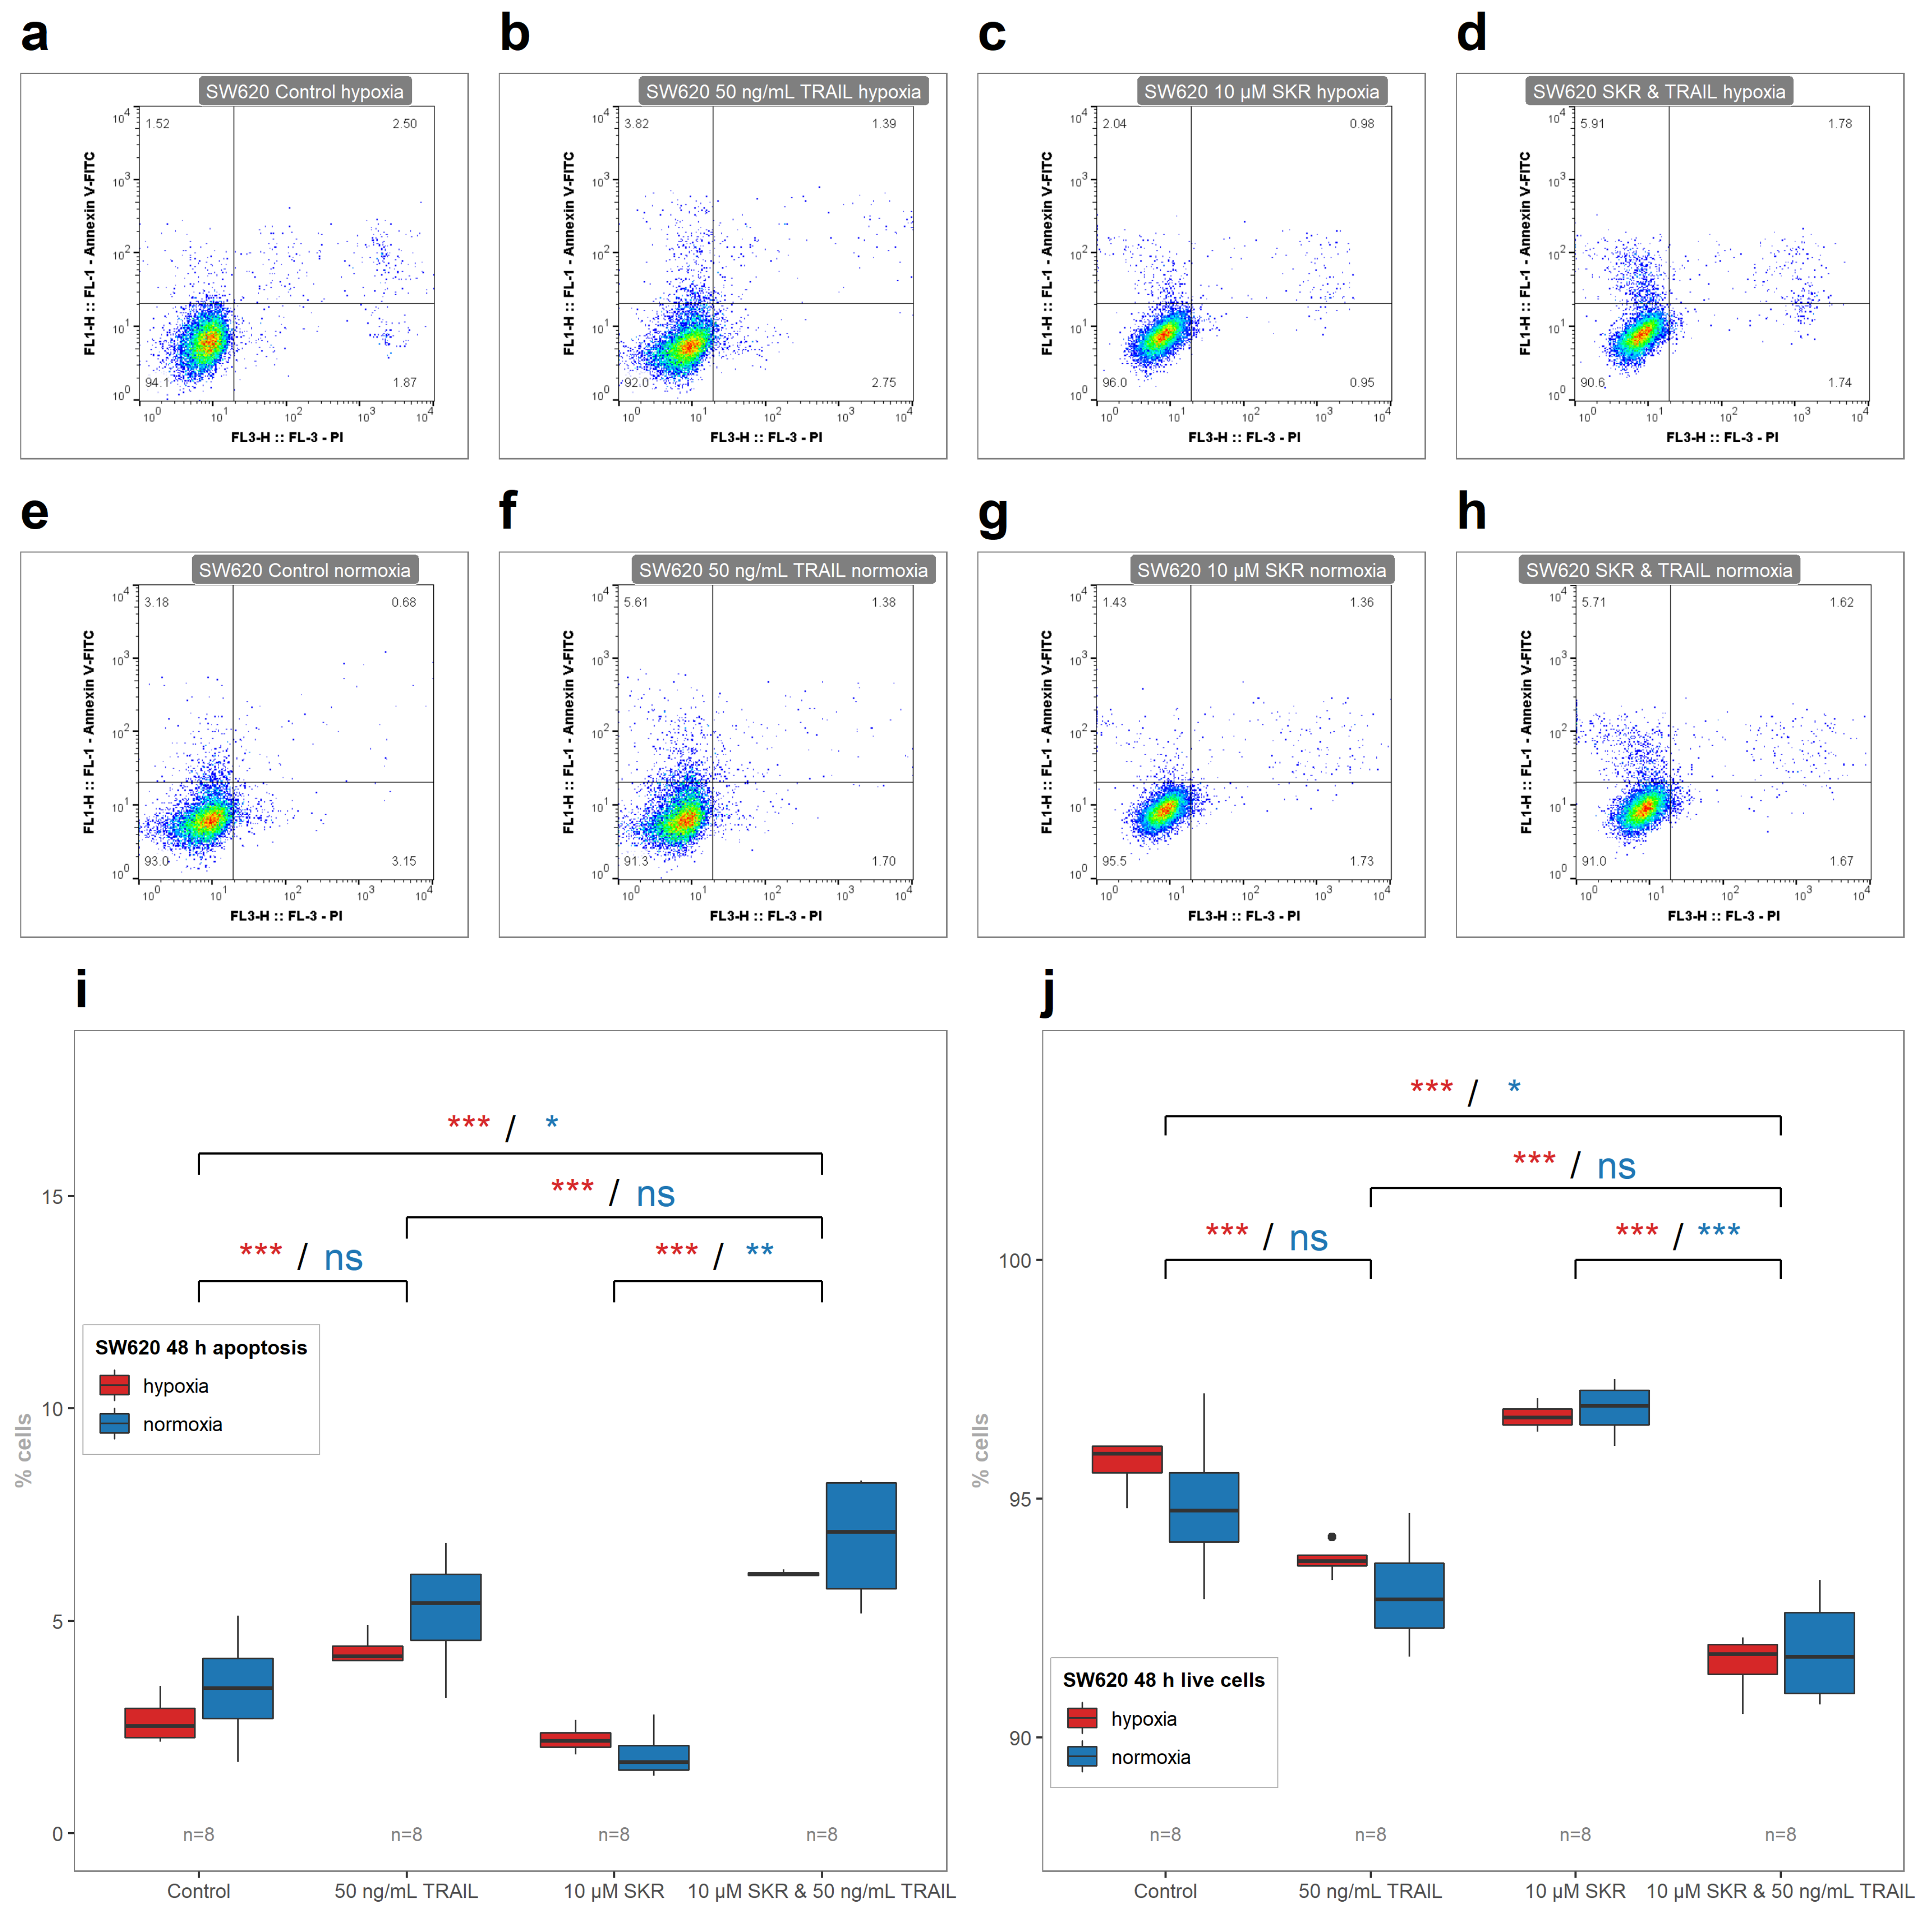
Figure 8). In SW620 cell line, the only noted effect was that the hypoxia-based TRAIL resistance was reversed; in normoxia, only a non-significant increase was observed (
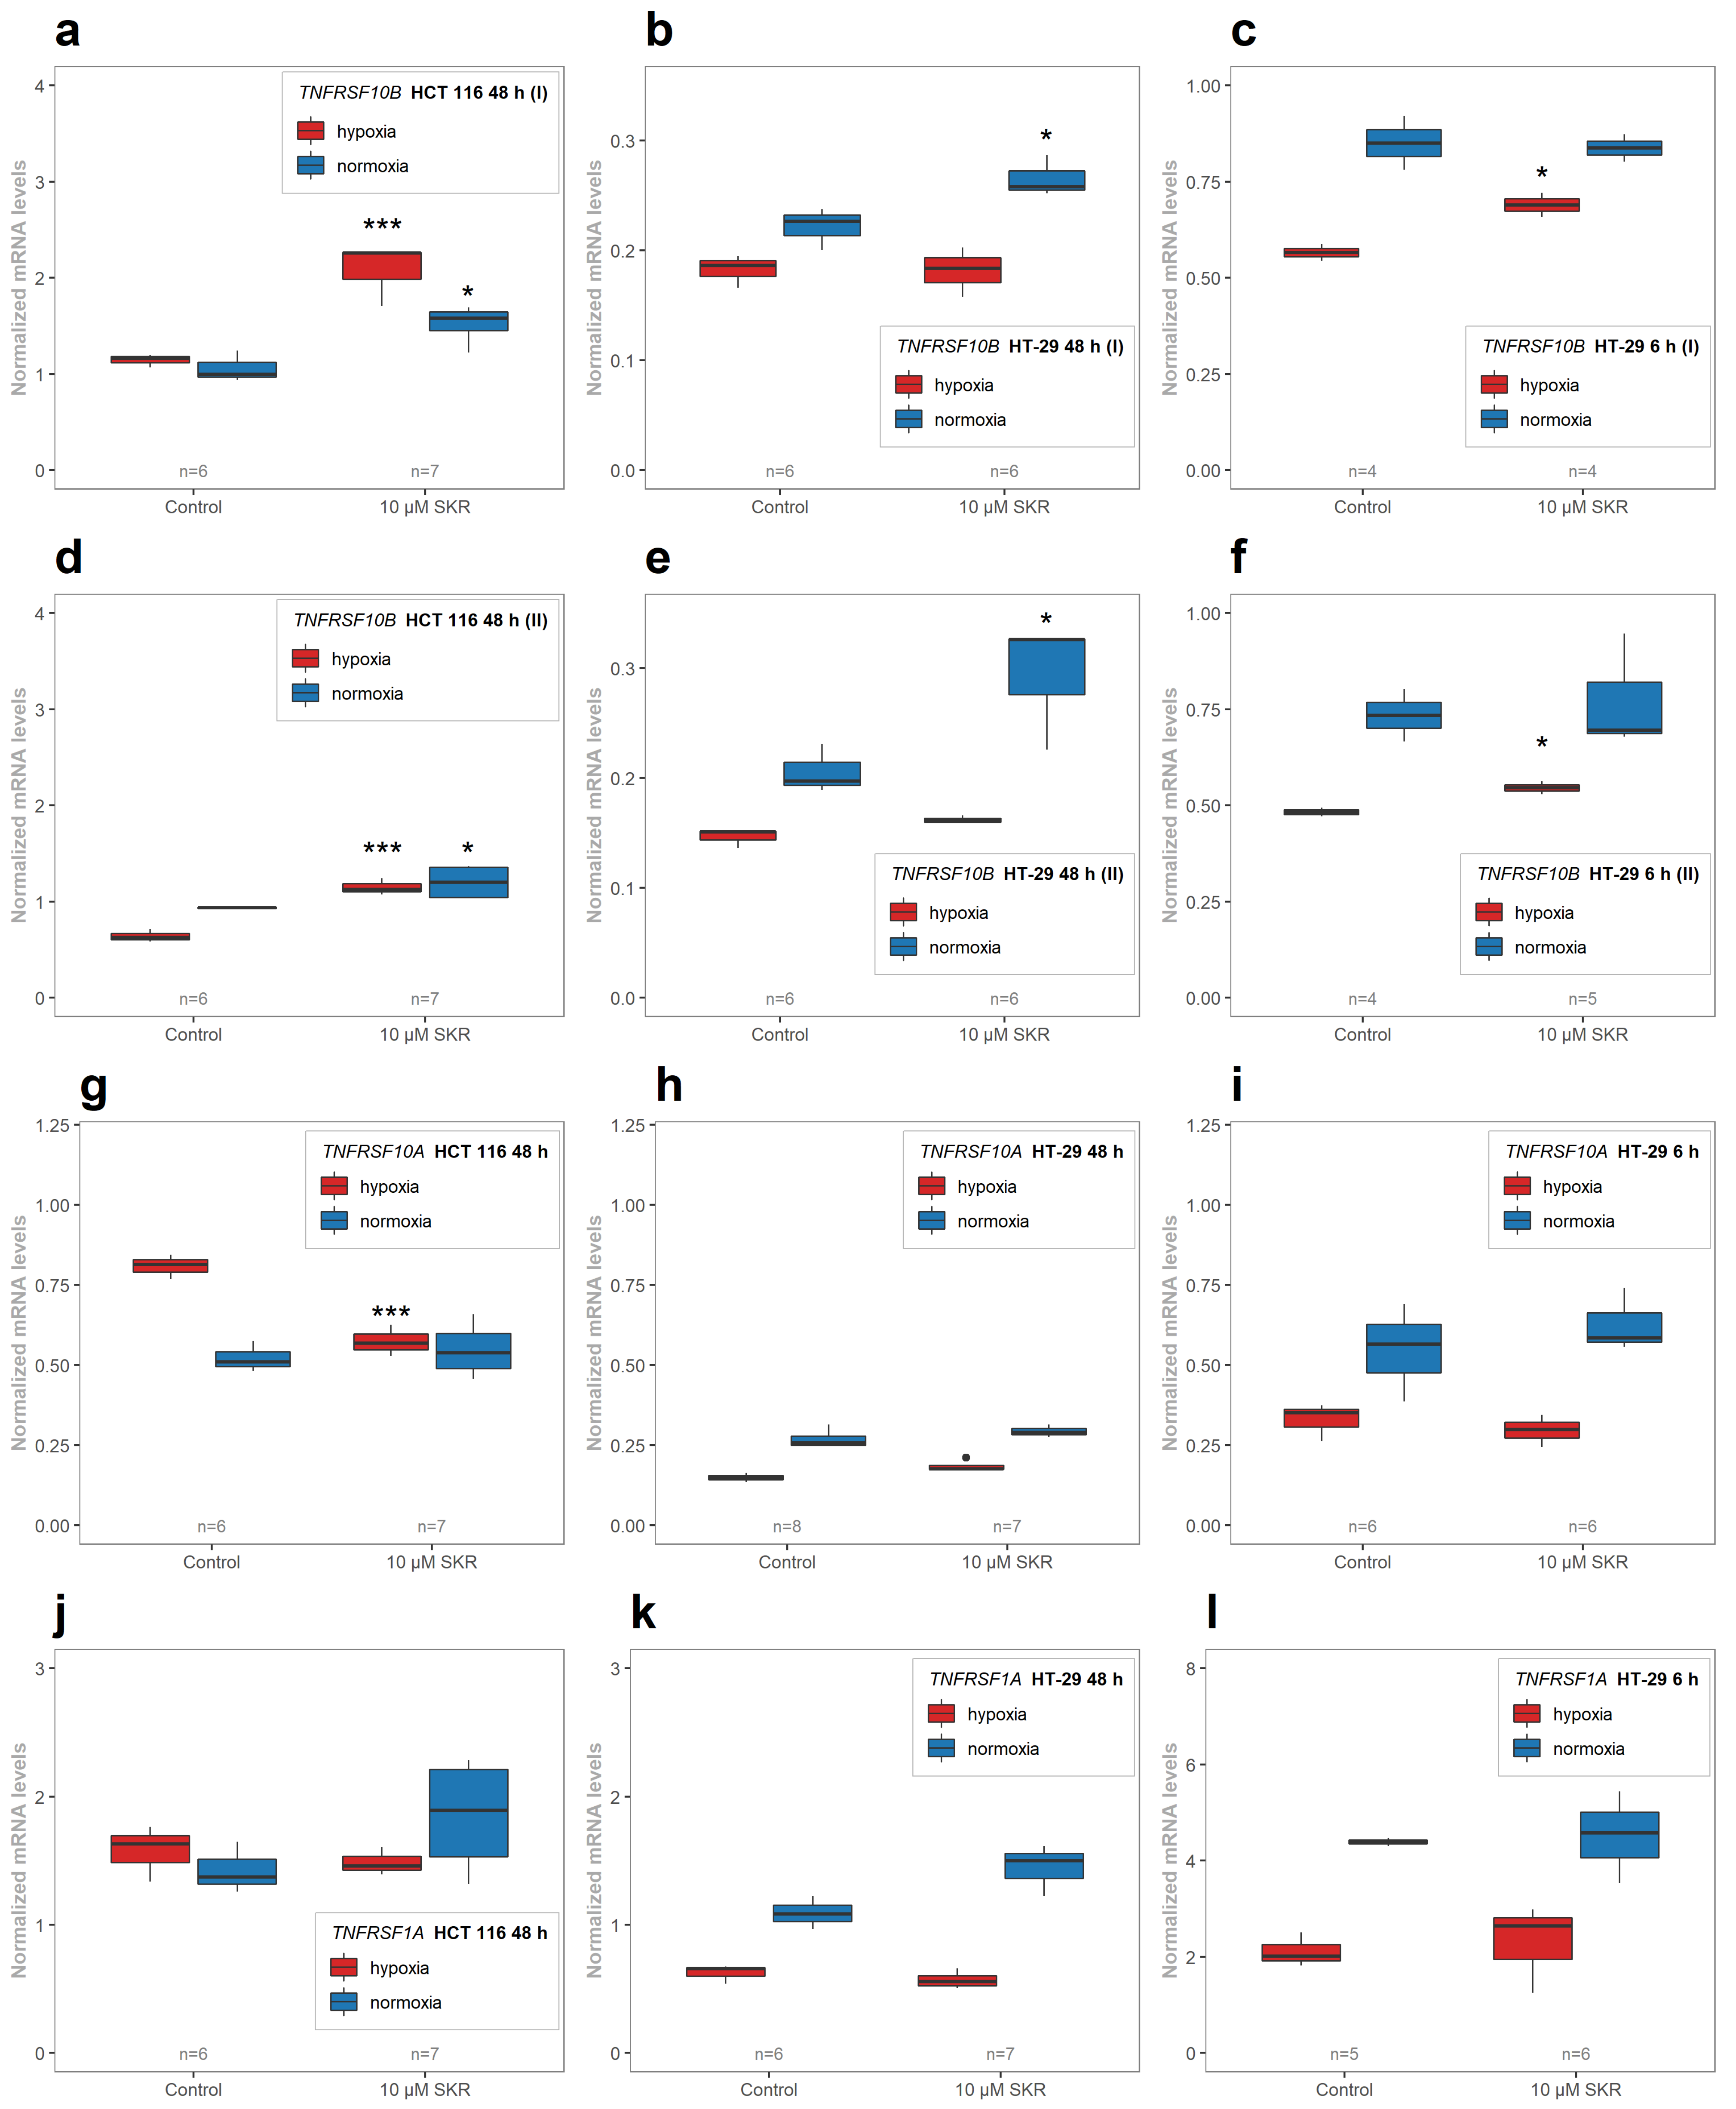
Figure 9). In both resistant cancer cell lines, the upregulation of DR5 was reported. In HT-29, there was a significant increase in both isoforms of
TNFRSF10B with different mRNA level kinetics. After 6 h, the upregulation was observed in hypoxia, without a change in normoxia, as in the SW620 cell line. In normoxia, the upregulation of DR5 on the mRNA level was observed in HT-29 in both isoforms after 48 h but without the changes in normoxia. The upregulation of death receptors (DR4 or DR5) induces apoptosis [
73,
80]. On the other hand, we assume that the lack of an effect of a single SKR treatment on the apoptosis of HT-29 and SW620 can be caused by an insufficient amount of naturally present TRAIL ligand [
81] in cultivation media for the induction of apoptosis; i.e., an amount below the apoptosis-inducing threshold.
In TRAIL-resistant cancer cell lines (HT-29 and SW620), the effect of SKR and TRAIL in combination was significantly cooperative. The upregulation of the receptor can be connected to the higher sensitivity of the cell to the ligand; in this case, TRAIL, which results in the induction of apoptosis through caspase-8 activity and Bid cleavage [
82]. We also confirmed the upregulated levels of
TNFRSF10B mRNA in all cell lines after SKR treatment.
To complete the overall view of the effect of SKR on cells, the RT-qPCR analysis of other TNF-related genes was performed. TNF (TNF alpha) as well as TNFRSF1B (TNFR2) were below the limit of quantification, which corresponded with the available data from the databases. The absence of significant changes in normalized mRNA levels of TNFRSF1A (TNFR1) and TNFRSF6B (DcR3) leads us to the assumption that the effect of SKR is not mediated by TNF alpha.
For a confirmation of TRAIL pathway activation in cells after treatment with SKR, we compared the expected proteomic changes with observed changes acquired from the quantitative mass spectrometry data. According to the literature, the TRAIL signaling pathway is triggered by the binding of a ligand to DR5 and results in a cascade of reactions. For example, the nuclear factor kappa B (NF-
B) pathway is downregulated, which is connected to the decrease of cell survival and activation of genes involved in immune reaction and inflammation. The key regulatory protein of this cascade is NF-
B essential modulator (NEMO), which is upregulated as a result of TRAIL pathway activation [
83,
84]. In our study, NEMO, the regulatory subunit of the inhibitor I
B kinase complex, which activates the NF-
B pathway, was significantly upregulated after the treatment with SKR in hypoxia (Log2FC = 1.45). In normoxia, we observed only a nonsignificant increase of NEMO. The difference between hypoxia and normoxia can be also demonstrated by the comparison of control samples, where NEMO is significantly downregulated in hypoxia compared to normoxia. Additionally, the inhibition of the PI3K pathway sensitized tumor cells to TRAIL treatment [
85]. The deactivation of PI3K leads to the deactivation of mTOR and further deregulation of p70 protein. In our study, the p70 was not significantly reduced after the treatment with SKR. Moreover, the BIRC6 protein, known as Livin, was downregulated in hypoxia (Log2FC = −0.94) as well as normoxia (Log2FC = −0.43). The downregulation of BIRC6 is related to TRAIL pathway activation [
86]. Likewise, NEDD4 regulates the tumor-suppressor PTEN by ubiquitin-mediated proteasomal degradation [
70,
87,
88]. Thus, the downregulation of NEDD4 by SKR in hypoxia and normoxia (Log2FC = −3.70 and −3.94) could be responsible for decreased PTEN degradation, leading to the impedence of cell growth and migration and promotion of apoptosis. TRAIL signalization in hypoxia partially leads to necrosis at the expense of apoptosis. This mechanism is controlled by low extracellular pH [
89]. The key proteins are RIPK1 and PARP-1. Their inhibition is connected to decreased necrosis due to the switched TRAIL pathway [
84,
89,
90]. In our samples, there was no change in the regulation of RIPK1 in normoxia after SKR treatment; in hypoxia alone, this protein was not significantly upregulated.
The analysis of the metabolic activity, cellularity and colony-forming ability of cells after SKR treatment was used to determine the overall effect of SKR on cells. HCT 116 cell line, which expresses only a low level of the potential SKR transporter ABCG2 and is less tolerant to hypoxia, showed higher sensitivity to SKR treatment. This was demonstrated by a decreased metabolic activity, cellularity and accumulation of cells in the G1 phase. We did not observe the effect of SKR on healthy cells. Moreover, the increased number of apoptotic cells after treatment with SKR in HCT 116 cell line correlated with the observations from MS. These data indicate that the potential mechanism of SKR action can be mediated by the upregulation of DR5. This was also confirmed by RTq-PCR and changes in downstream of TRAIL-activated cascade after DR5 stimulation. SKR also reverses TRAIL resistance in HT-29 cell line in hypoxia and normoxia as well as eliminating the lack of an effect of TRAIL to HCT 116 and SW620 cells in hypoxia.
4. Materials and Methods
4.1. Reagents
SKR (CAS no: 602-06-2, Sigma-Aldrich, St. Louis, MO, USA) stock solution (c = 5 mM) was prepared in dimethylsulfoxide (DMSO) and further diluted to freshly prepared working solutions immediately before addition to cell cultures. In experiments, the control sample with the same concentration of DMSO as the sample with 10 M was used to establish the effect of the carrier. Recombinant TRAIL protein (Abcam, Cambridge, UK; ab9960) stock solution (0.5 mg/mL) was prepared by the reconstitution of lyophilized powder in pure water and further diluted to freshly prepared working solutions immediately before use.
4.2. Cell Cultures
HT-29, HCT 116, SW620, CCD-18Co and CCD-1072Sk cell cultures were purchased from American Type Culture Collection (ATCC, Rockville, MD, USA). HT-29 and SW620 cells were cultured in complete RPMI-1640 medium (Sigma-Aldrich, St. Louis, MO, USA), HCT 116 cells in McCoy’s medium (PAN-Biotech GmbH, Aidenbach, Germany), CCD-18Co and CCD-1072Sk in MEM medium (Biosera, Nuaille, France). All cultivation media were supplemented with 10% fetal bovine serum (Biosera, Nuaille, France) and antibiotics (1% antibiotic-antimycotic 100 and 50 μg/mL gentamicin; Biosera, Nuaille, France).
4.3. Cultivation Conditions and Experimental Design
To compare the effect of SKR on cancer cells under different oxygen concentrations, cells were cultivated in a glove box under controlled conditions (Coy Laboratory Products, Inc., Grass Lake, MI, USA) with two separate cabinets. The oxygen concentration in the hypoxic cabinet was set to 1% (partially 1% of O, 5% of CO, 94% of N) and in the normoxic cabinet to 20% (partially 20% of O, 5% of CO, 75% of N). Humidity and temperature were the same for both cabinets; i.e., 95% and 37 , respectively.
After seeding, cells were allowed to settle for 8 h at standard conditions in an incubator. Subsequently, cells were moved to hypoxic or normoxic chambers and cultivated for 16 h. Then, SKR solutions (from 0.5 M to 20 M) were added to cells for 24 or 48 h with subsequent analysis. All experiments (except the mass spectrometry analysis, RT-qPCR analysis and phosphatidylserine externalization analysis in combination with TRAIL) were performed at least in three independent technical and biological replicates for all measured factors: (1) cell lines: HT-29 and HCT 116; (2) oxygen content: 1% and 20%; and (3) time of cultivation: 24 and 48 h.
4.4. Metabolic Activity Assay
Metabolic activity assays (MTT) were performed as reported previously [
49] to evaluate changes in the metabolic activity of cells after treatment with SKR. Solutions of SKR (from 0.5
M to 20
M) were added to cells in a 96-well plate (TPP Techno Plastic Products AG, Trasadingen, Switzerland) to examine the SKR effect on metabolic activity based on MTT assay and to determine SKR concentrations for further experiments. Of note, IC50 values can be only extrapolated, because of the relatively low inhibition rate of SKR after the shorter incubation period. After 24 and 48 h, MTT (3-[4,5-dimethylthiazol-2-yl]-2,5-diphenyltetrazolium bromide) (Sigma-Aldrich, St. Louis, MO, USA) from a stock solution (5 mg/mL) was added to the cells in a 96-well plate. The reaction was stopped after 4 h incubation and the insoluble formazan was dissolved by the addition of SDS at a final concentration of 3.3%. The absorbance of metabolized formazan (λ = 584 nm) was measured using a BMG FLUOstar Optima (BMG Labtech GmbH, Offenburg, Germany). Results were evaluated as the ratio of the absorbance of the treated sample to the untreated matching control. The experimental groups were compared with the matching control groups (normoxic control or hypoxic control).
4.5. Analysis of Cellularity and Cell Size
The analysis of cellularity (the total number of cells in the sample) and cell size was performed using the Vi-CELL XR Cell Viability Analyzer (Beckman Coulter, Indianapolis, IN, USA). Floating and adherent cells were harvested for analysis by trypsinization at scheduled time points, washed with PBS and analyzed. Cellularity is presented as the ratio of total cell numbers to the average total number of cells from all samples of the experiment. Cell size was evaluated automatically as the average diameter of cells in μm in the analyzed cell suspension. The experimental groups were compared with the matching control groups (normoxic control or hypoxic control).
4.6. Phosphatidylserine Externalization Analysis
For the measurement of the viability and phosphatidylserine externalization as a marker of apoptosis, a BD Pharmingen FITC Annexin V Apoptosis Detection Kit I (BD Biosciences, San Jose, CA, USA) was used according to the manufacturer’s instructions. Total cells were harvested 24 and 48 h after SKR addition. Cells were washed with PBS, centrifuged and stained with Annexin V-FITC for 20 min at room temperature in the dark and subsequently stained with propidium iodide (PI) for 5 min before the measurement. A total number of 10,000 cells per sample were analyzed using a BD FACSCalibur flow cytometer (BD Biosciences, San Jose, CA, USA). Fluorescence was detected via a 530/30 nm band-pass filter (FL-1; Annexin V—FITC) and a 670 nm long-pass filter (FL-3; PI). Raw files were analyzed using FlowJo software (Tree Star Inc., Ashland, OR, USA). Only debris-free single cells were analyzed. Examples of gating strategies are presented in the
Supplementary Materials (Figures S6–S29). An apoptotic cell was considered as Annexin V
/PI
, a secondary necrotic cell was Annexin V
/PI
, a necrotic cell was an Annexin V
/PI
cell and a live cell was Annexin V
/PI
. Results are presented as the average percentage of cells from three independent experiments. The experimental groups were compared with the matching control groups (normoxic control or hypoxic control) or with other samples.
4.7. Analysis of Cell Cycle Distribution
To analyze the effect of SKR on the whole population of cells, the cell cycle distribution of cells was examined. Adherent cells were harvested by trypsinization and together with floating cells were washed with cold PBS, centrifuged, fixed in cold 70% ethanol and stored at −20
(at least overnight) for further analysis. Fixed cells were subsequently centrifuged, washed with PBS, and stained with staining solution (20
g/mL PI, 137
g/mL RNAse A and 0.1% Triton X-100 in PBS). After 30 min incubation in the dark, samples were measured with BD FACSCalibur flow cytometer (BD Biosciences, San Jose, CA, USA). To analyze the raw files, ModFit 3.0 (Verity Software House, Topsham, ME, USA) was used. Only debris-free single cells were analyzed. Examples of gating strategies are presented in the
Supplementary Materials (Figures S30–S37). The results are presented as the average ratio of cells in the individual phase to all cells from three independent experiments. The experimental groups were compared with the matching control groups (normoxic control or hypoxic control).
4.8. Colony Forming Assay
For the analysis of the colony-forming ability, HCT 116 and HT-29 cells from hypoxia and normoxia were harvested by trypsinization, washed with PBS, centrifuged and resuspended in PBS. Then, cells were counted using Vi-CELL XR Cell Viability Analyzer (Beckman Coulter, Indianapolis, IN, USA) and seeded as 500 cells per well in fresh medium in a six-well plate (TPP Techno Plastic Products AG, Trasadingen, Switzerland). After 8 days of incubation, the medium was removed and formed colonies were washed with PBS and stained with methylene blue dye in methanol (0.8%). Afterwards, the dye was removed and the colonies were washed with PBS and subsequently scanned. All independent experiments were performed in technical duplicate (two wells from each sample) in three independent experiments. Colonies were counted using ImageJ (version 1.8.0; NIH, Bethesda, MA, USA) using the Colony Counter plugin (version 0.9), manually checked and corrected as needed. The results are presented as the number of colonies. Values are presented as technical duplicates from biological triplicates for each sample. To avoid the effect of the solvent, the control sample contained the same amount of DMSO as a sample with a higher concentration of SKR. The experimental groups were compared with the matching control groups (normoxic control or hypoxic control).
4.9. Mass Spectrometry
Mass spectrometry analysis (MS) was performed in the Proteomic Core Facility of Central European Institute of Technology (CEITEC), Brno, Czech Republic. Based on our previous results, HCT 116 cell line treated with SKR (10 M) for 48 h in normoxia or hypoxia and a matching control were chosen for this analysis. Biological triplicates of all samples were prepared.
4.9.1. Sample Preparation
Samples were washed three times with ice-cold PBS to prevent the contamination of samples with serum proteins in cultivation media. Then, cells were harvested by scraping in ice-cold PBS and subsequently centrifuged. Pellets were resuspended in 50 L of SDT lysis buffer (4% sodium dodecyl sulfate (SDS), 0.1% dithiothreitol (DTT) in Tris/HCl pH 7.6) and homogenized for 120 min at 95 on aThermoMixer (Eppendorf, Hamburg, Germany). After perfect homogenization, samples were stored at −80 . Samples for LC-MS analyses were prepared using filter-assisted sample preparation (FASP; Merck Millipore, Burlington, MA, USA) from 5 L of the protein mixture. Protein reduction and alkylation with iodoacetamide and 30 kDa cut-off filters were used. Samples were incubated for 18 h with trypsin at 37 , and resulting peptides were extracted into 15 L of the final solution.
4.9.2. MS Measurement and Analysis
Mass spectrometry analysis of the peptide mixture was done using the RSLCnano system, which was connected online to an Orbitrap Q-Exactive HF-X system (Thermo Fisher Scientific, Waltham, MA, USA). Prior to LC separation, tryptic digests were concentrated and desalted online using a cartridge trapping column (300 m 5 mm) filled with 5 m particles C18 PepMap100 sorbent (Thermo Fisher Scientific, Waltham, MA, USA). The peptides were eluted from the trapping column onto an Acclaim Pepmap100 C18 analytical column (3-m particles, 75 m 500 mm; Thermo Fisher Scientific, Waltham, MA, USA) and separated by the following gradient program: mobile phase A: 0.1% formic acid in 5% DMSO water; mobile phase B: 0.1% formic acid and 5% DMSO in 80% acetonitrile, flow rate 300 nL/min. The gradient elution started at 2% (0–5th min) of mobile phase B, increased from 2% to 35% (5th–105th min), then increased linearly to 90% (105th–110th min) of mobile phase B and remained at this state for the next 10 min. The equilibration of the trapping column and the column was done prior to sample injection to the sample loop. For quality control purposes, Biognosys iRT peptides (Biognosys AG, Schlieren, Switzerland) were added during each analysis. The samples were measured in a random order with a blank analysis for the samples. Approximately 2000 ng was subjected to LC-MS analysis per sample. The analytical column outlet was directly linked to the Digital PicoView 550 (New Objective, Woburn, MA, USA) ion source with sheath gas option and SilicaTip emitter (FS360-20-15-N-20-C12; New Objective, Woburn, MA, USA) utilization. An ABIRD (Active Background Ion Reduction Device; ESI Source Solutions, Woburn, MA, USA) was installed. MS data were acquired in a data-dependent strategy, selecting up to the top 20 precursors based on precursor abundance in the survey scan (350–2000 m/z). The resolution of the survey scan was 120,000 (at 200 m/z) with a target value of 3 × 10⁶ ions and a maximum injection time of 100 ms. HCD MS/MS spectra were acquired with a target value of 1 × 10⁵ and resolution of 15,000 (at 200 m/z). The maximum injection time for MS/MS was 50 ms. Dynamic exclusion was enabled for 40 s after one MS/MS spectrum acquisition. The isolation window for MS/MS fragmentation was set to 1.2 m/z.
LC-MS data processing was done using MaxQuant software (version 1.6.2.10; Max Planck Institute of Biochemistry, Martinsried, Germany) with Andromeda search engine [
91,
92]. UniProtKB database (taxonomy: human; taxon ID: 9606; version 180912) and MaxQuant contaminant database of 247 protein sequences were used. Matches between runs were used across biological replicates datasets to improve peptide matching. Results were set to follow a 1% false discovery rate of peptide-to-spectrum matches and protein levels. The minimal number of unique and razor peptides was set to 1. The mass spectrometry proteomics data have been deposited to the ProteomeXchange Consortium via the PRIDE partner repository with the dataset identifier PXD019995. Intensities of identified proteins were normalized across all samples prior to further data evaluation. Several normalization approaches were tested and the LoessF normalization was finally selected. Log2 intensities were calculated and used for further analysis. In addition, Pearson’s pairwise correlation coefficients were calculated, using data for all protein groups with a non-zero protein group area for the given pair of samples for sample cluster analysis. Comparative proteomics was performed by the LIMMA test and the Benjamini Hochberg method. Fold change (FC) and Log2FC values were also calculated and exported as CSV data. This analysis was performed in the KNIME analytics platform (KNIME AG, Zurich, Switzerland) using the KNIME proteomic workflow created by the CEITEC MU Proteomics laboratory (available under GPL-3.0 license at
https://github.com/OmicsWorkflows, accessed on 27 August 2019). For the final report, the following parameters were set as follows: changed proteins needed to have a Log2FC higher than 1.0 or lower than −1.0 between treated samples to control samples and to be significantly changed simultaneously in both conditions (hypoxia and normoxia).
4.10. RT-qPCR Analysis
The normalized relative mRNA levels of all analyzed genes (
Table 5) were quantified by real-time RT-qPCR with SYBR Green I detection of the amplicons. The levels of the studied genes were normalized with the reference gene
PMM1 (Gene ID: 5372). The cDNA template for RT-qPCR was prepared from total RNA by RevertAid-MuLV Reverse Transcriptase (RevertAid First Strand cDNA Synthesis Kit, Thermo Fisher Scientific Inc., Waltham, MA, USA) and a random primer mix (a mixture of anchored-dT and random hexamer primers; NEB, Ipswich, MA, USA). Total RNA was isolated by TRI Reagent (MRC Inc, Cincinnati, OH, USA) according to the manufacturer’s instructions. RNA integrity was verified by agarose gel electrophoresis and the amount of RNA/μL was determined using a BioSpec nano-spectrophotometer (Shimadzu, Kyoto, Japan). Only samples with distinct 28S/18S RNA bands were used for cDNA transcription. Human-specific primers for the respective genes were designed by PrimerBLAST [
93] hosted at the NCBI web page. The primers either spanned two neighboring exons or were bound to different exons. Primer pairs with no secondary structures and the best delta G values were chosen by Unipro UGENE v1.20.0 software [
94].
RT-qPCR experiments were performed using a CFX96 Touch Real-Time PCR Detection System (BioRad Laboratories, Hercules, CA, USA). For amplification reactions, Xceed qPCR SG Mix, Lo-Rox (IAB, Prague, Czech Republic), 0.5 μM For/Rev primers and 15 ng of RNA/cDNA were used. The conditions for RT-qPCR were according to Majernik et al. [
49]. The amplification of single and specific gene fragments in the RT-qPCR was confirmed by melt curve analysis and by checking the size of the amplicon by agarose gel electrophoresis. The melt curves for all used primer pairs used are shown in the
Supplementary Materials (Figures S38–S46). All samples were analyzed in biological triplicates from independently repeated experiments. The resulting values of target mRNA levels were normalized to the levels of
PMM1, which was shown to be an accurate internal reference control in HCT 116, HT-29 and SW620 cell lines. The results are presented as the
PMM1-normalized mRNA level. The experimental groups were compared with the matching control groups (normoxic control or hypoxic control).
4.11. Statistical Analysis
Data were analyzed and visualized using in the R environment [
95] (version 4.0.3) using the standard library and libraries noted listed in
Table S1 in the Supplementary Materials [
95,
96,
97,
98,
99,
100,
101,
102,
103,
104,
105,
106,
107,
108]. Significance between samples was assessed by a one-way ANOVA with Tukey’s post-test. Significance levels are presented as follows: *
p < 0.05, **
p < 0.01, ***
p < 0.001. For comparative proteomics, the LIMMA test and the Benjamini Hochberg method was performed. Significance levels are indicated in the capture for each figure.


 ,
, 


