3.1. MDM2 Contributes Chemoresistance in MM
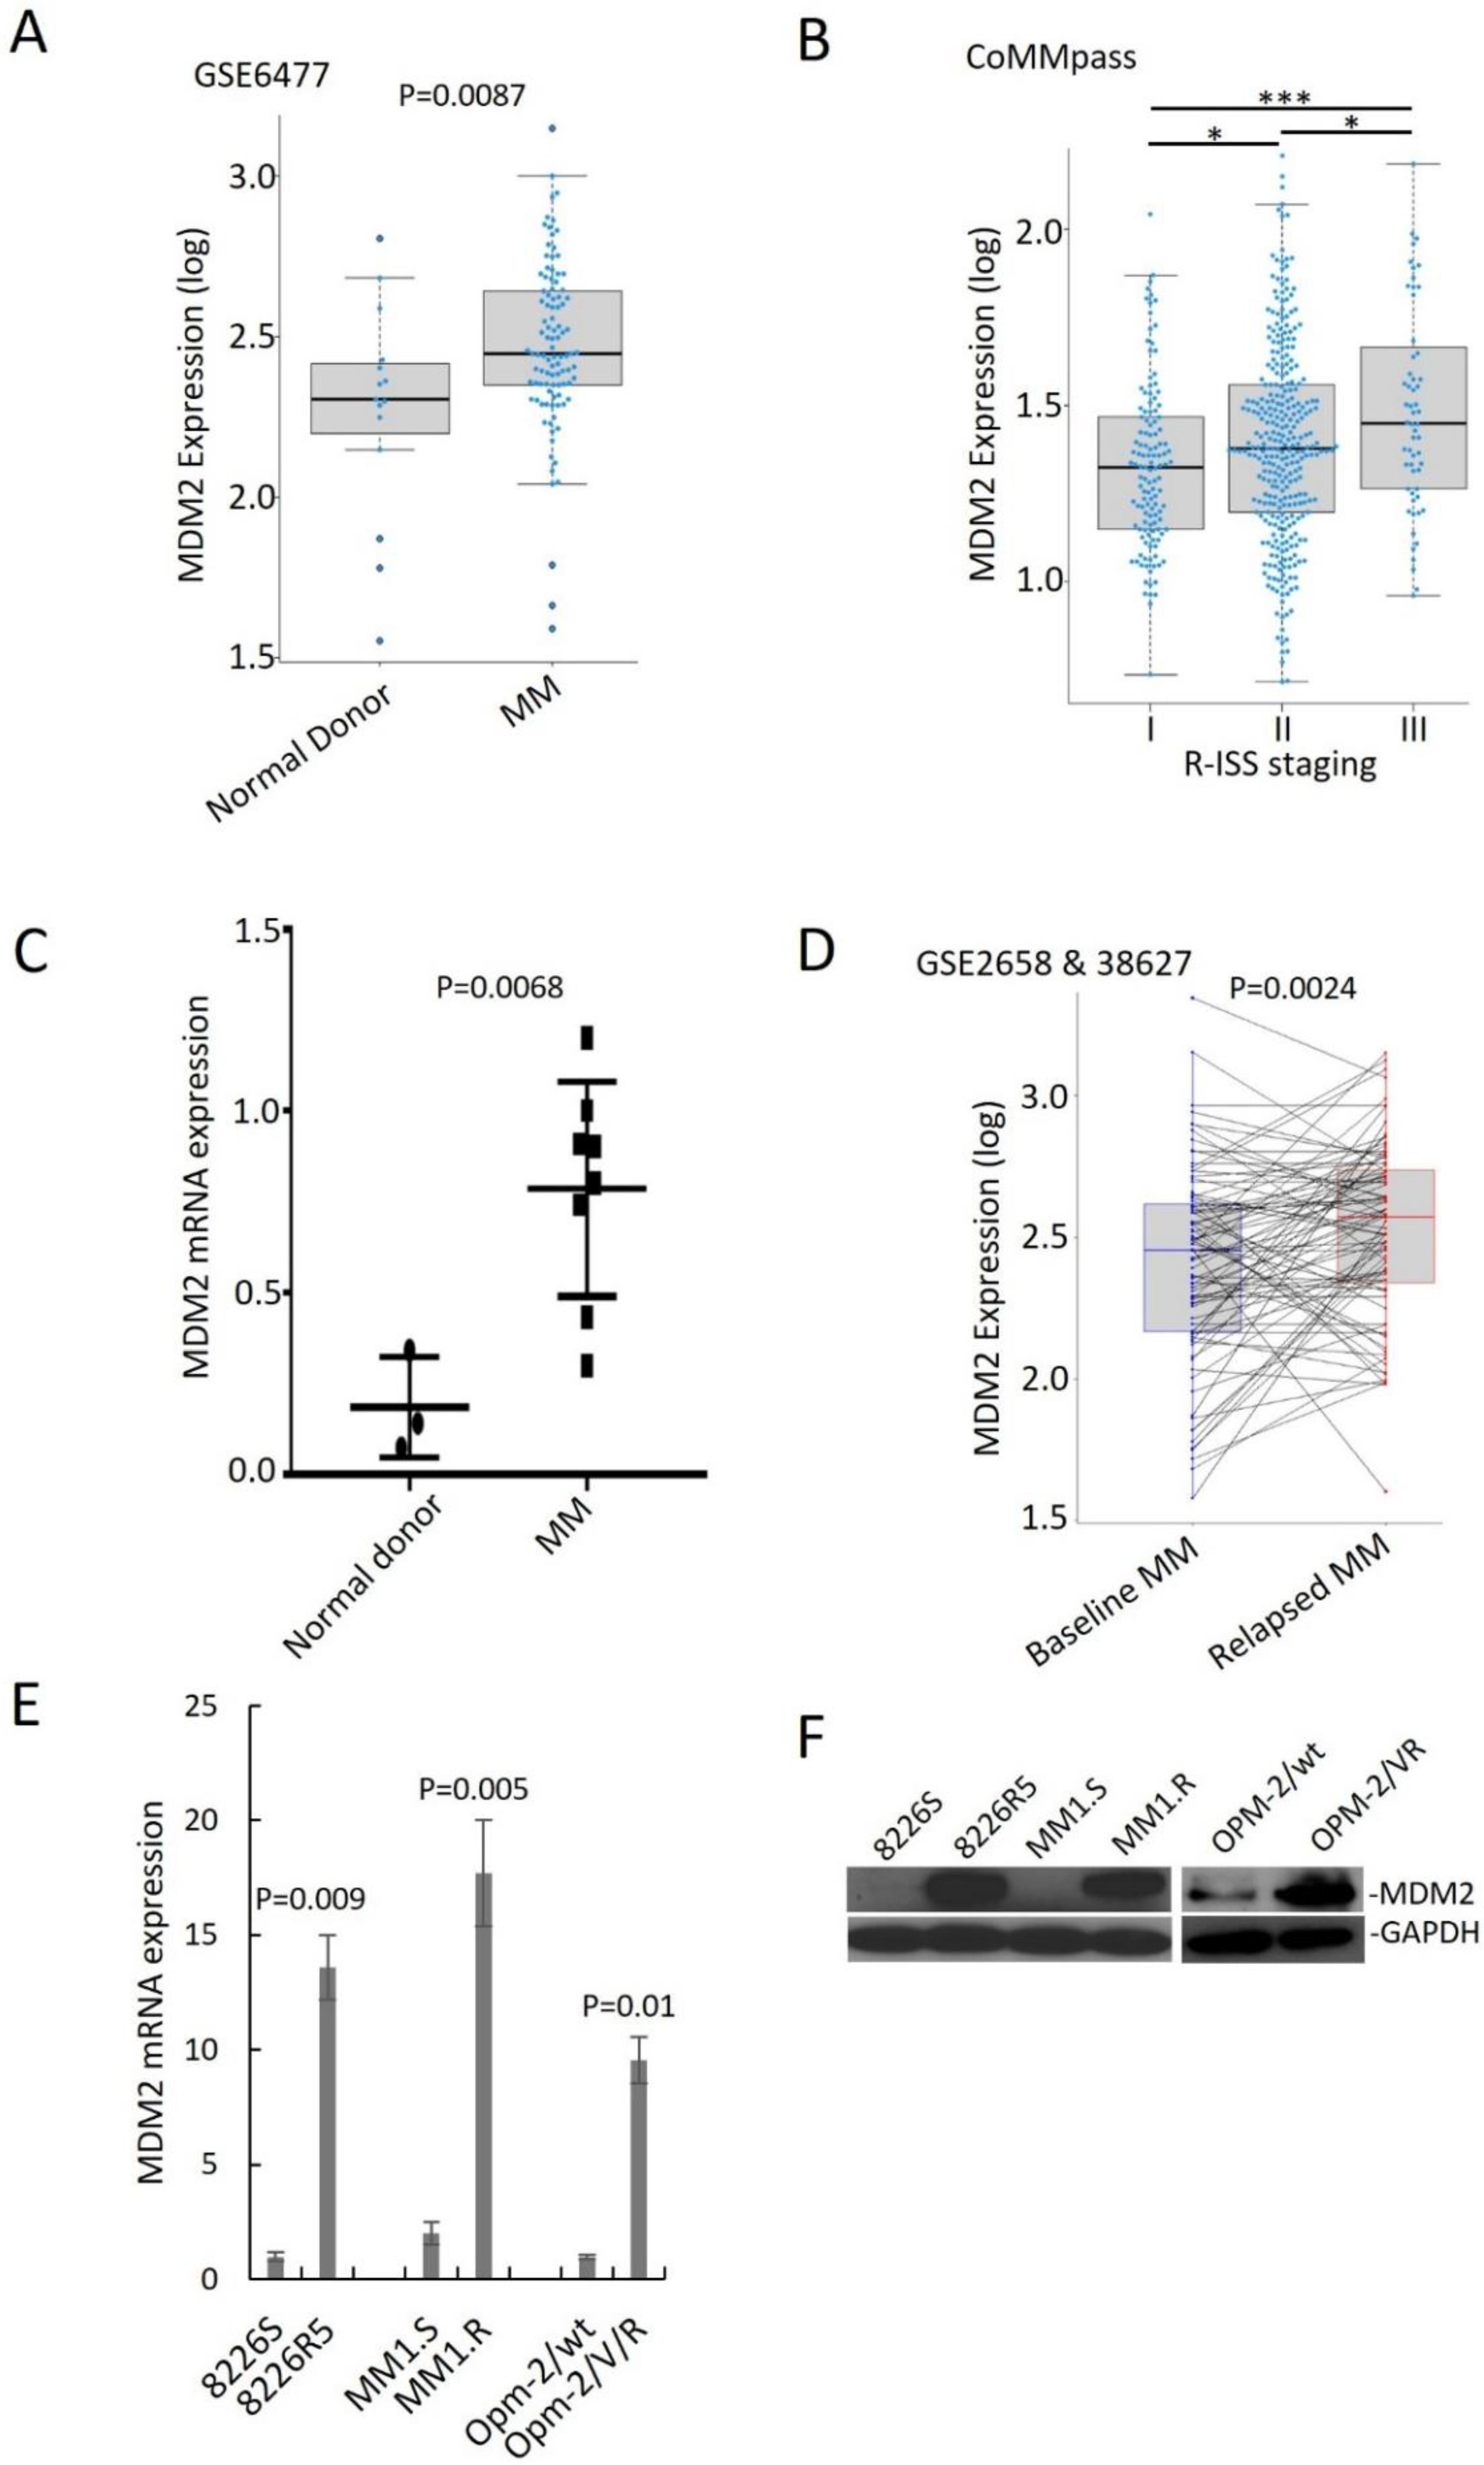
To assess the clinical outcomes associated with MDM2 upregulation in MM, we analyzed published gene expression profiles of plasma cells from MM patients. MDM2 was significantly upregulated in MM patient samples compared to normal donor samples and in advanced stage of MM diseases (
Figure 1A,B). To confirm that MDM2 is upregulated in MM, we quantified RNA from normal donor and MM patient plasma cells isolated by CD138+ selection. We found that MDM2 was at a higher level in MM patient samples compared to normal donor samples (
Figure 1C). Moreover, overexpression of MDM2 was correlated with shorter overall survival and progression-free survival in MM patients (
Supplemental Figure S1A–D). These findings suggest that overexpression of MDM2 is associated with poor clinical features in MM patients.
Furthermore, we analyzed gene expression profiling (GSE2658 and GSE38627) of 88 paired samples from MM patients at diagnosis and relapse and found that MDM2 was significantly higher in relapsed MM (
Figure 1D). We confirmed this finding in an independent dataset (
Supplemental Figure S1E). To determine the endogenous MDM2 expression in MM cells, we performed immunoblotting and qRT-PCR on paired drug-sensitive (MM1.S, 8226S and OPM-2/wt) and drug-resistant (MM1.R, 8226R5 and OPM-2/VR) MM cell lines. MDM2 was significantly higher in drug-resistant MM cells compared to their parental drug-sensitive counterparts (
Figure 1E,F). These findings suggest that MDM2 contributes to drug resistance in MM.
3.2. Silencing MDM2 Induces Apoptosis via p53-Dependent/Independent Pathways in Drug-resistant MM Cells and Re-Sensitizes MM Cells to Conventional Chemotherapy
To assess the utility of targeting MDM2 in MM, we knocked down (KD) MDM2 in two drug-resistant MM cell lines (MM1.R, p53
wt; 8226R5, p53
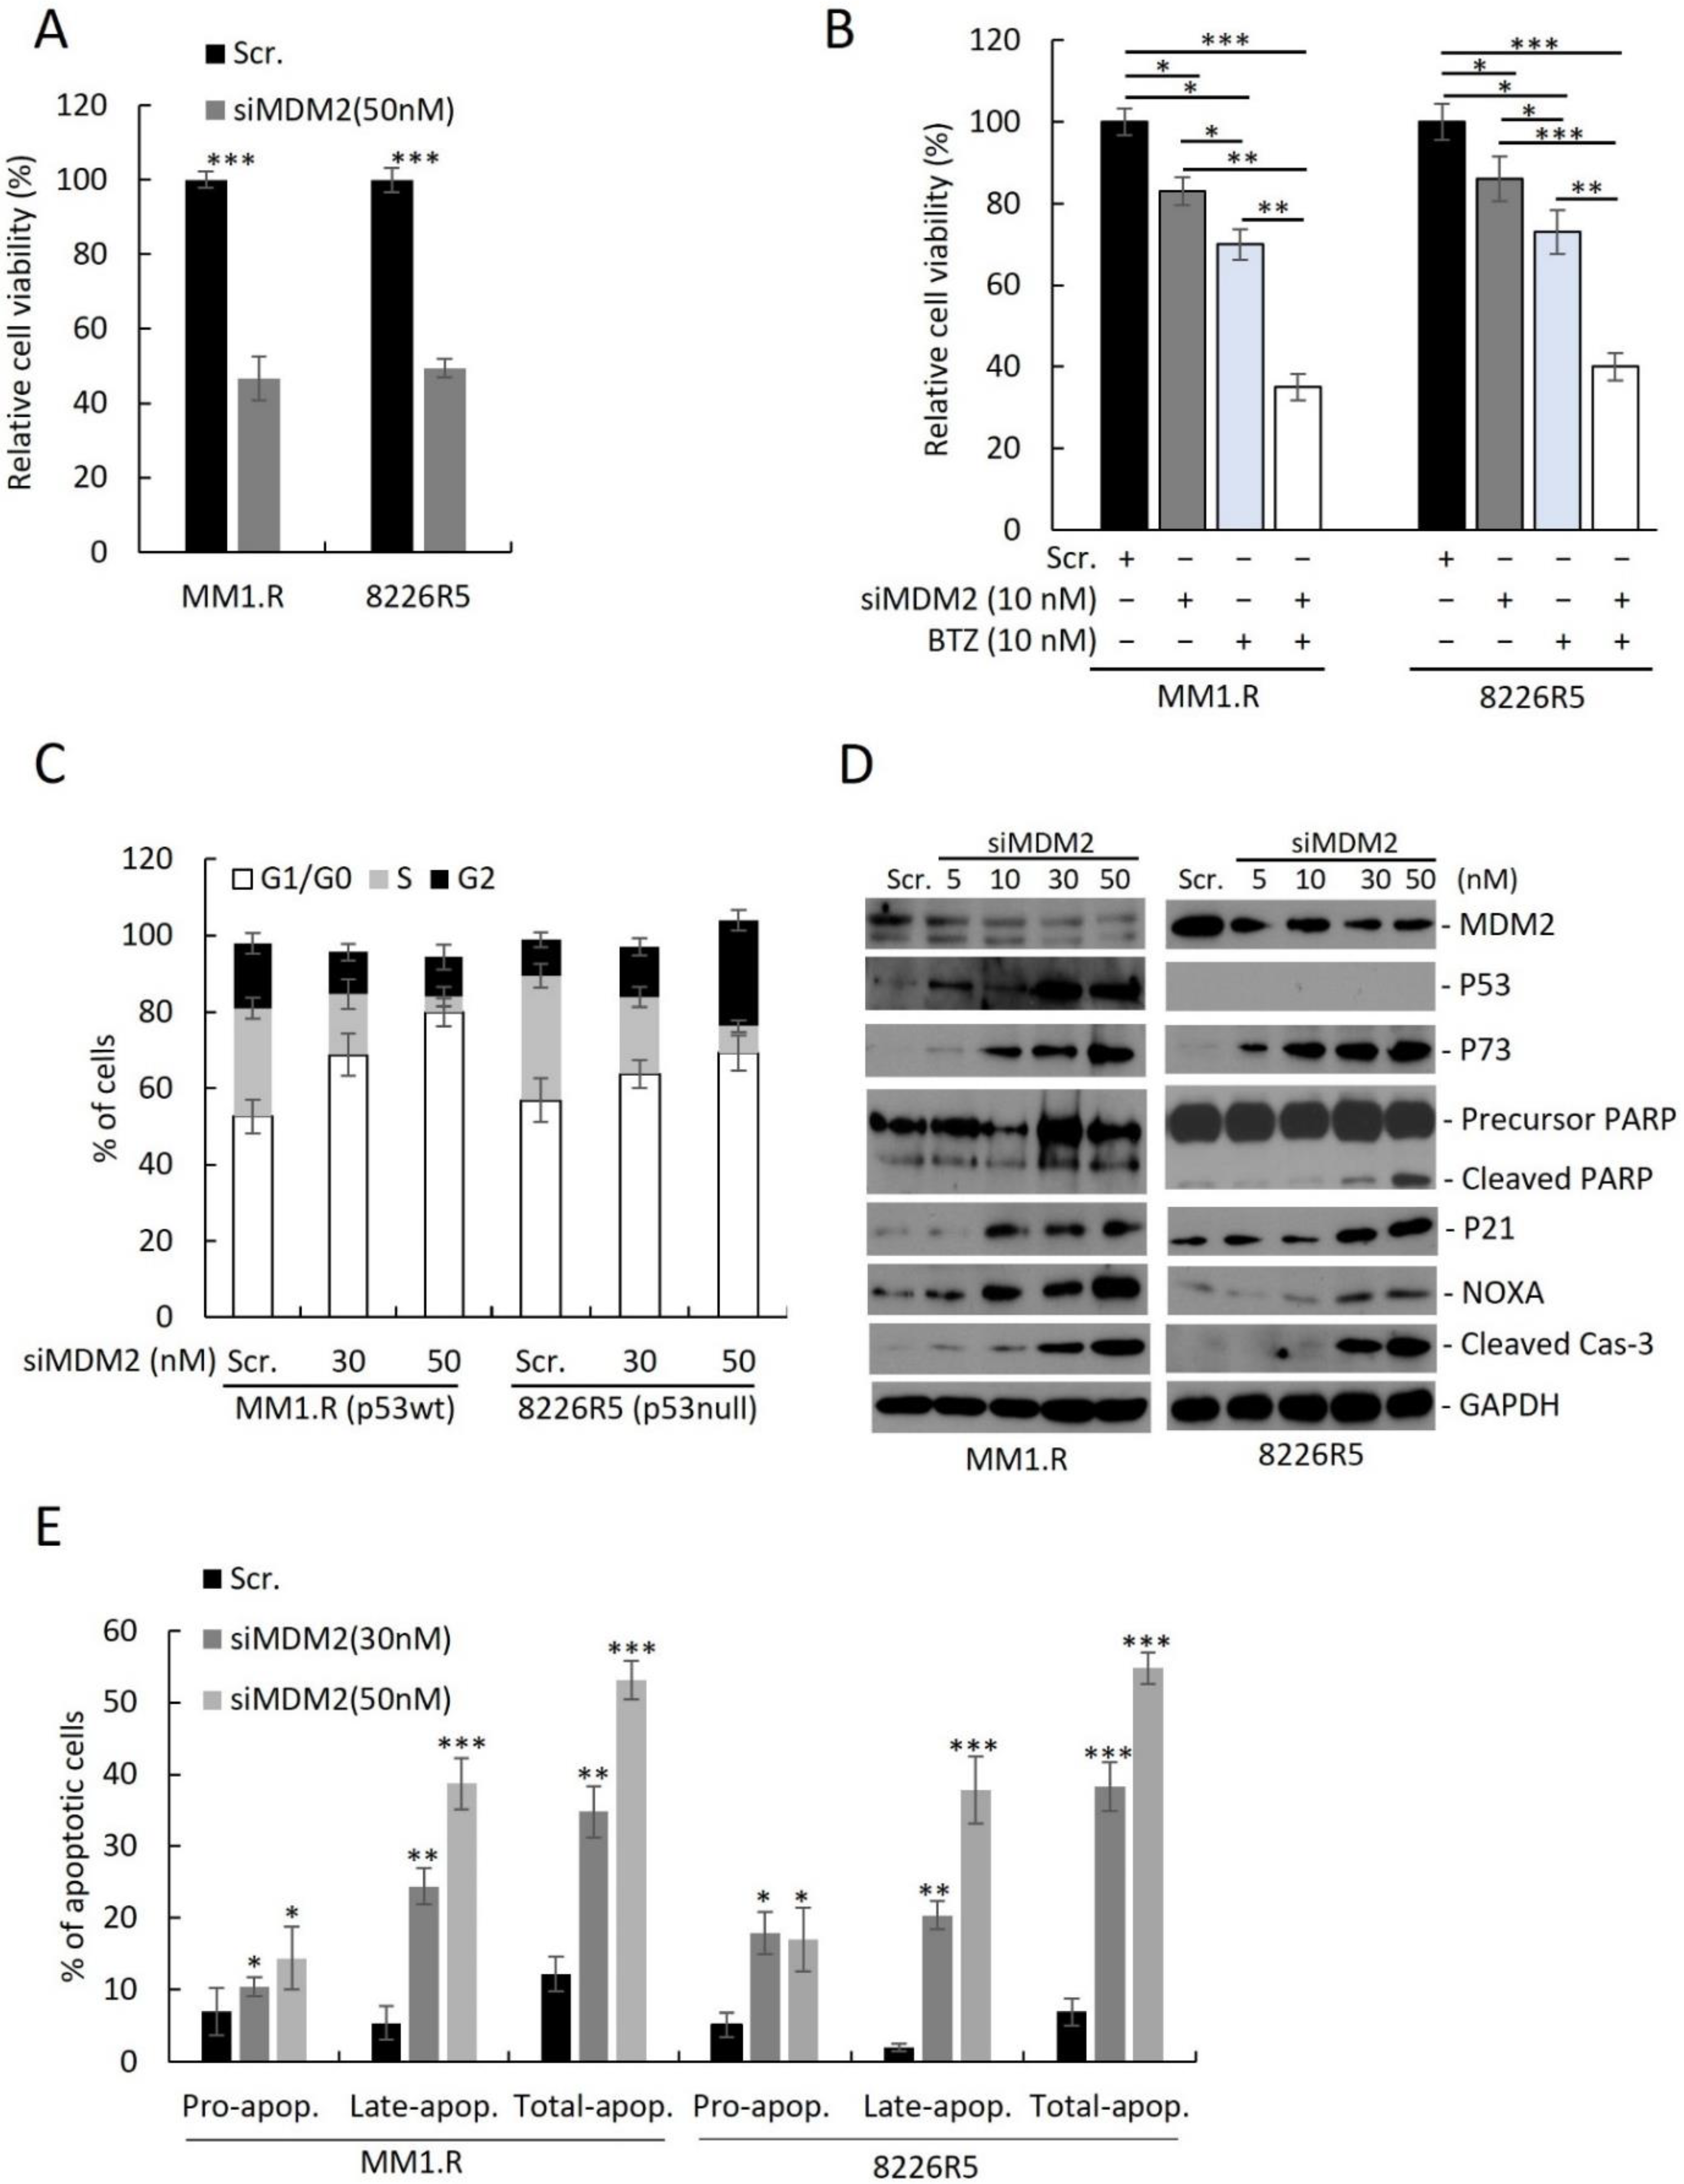
null) by siRNA and measured cell viability. Transfection with 50 nM of siMDM2 significantly reduced MM1.R and 8226R5 cell viability (
Figure 2A) and mRNA of MDM2 (
Supplemental Figure S2A). Since MDM2 upregulation was correlated with MM drug resistance, we sought to test if depleting MDM2 could re-sensitize drug resistant MM cells to frontline anti-myeloma agents. The combination of low dose BTZ (10 nM) and siMDM2 (10 nM) significantly impaired MM1.R and 8226R5 cell viability, whereas the exposure to siRNA or drug alone did not significantly impair MM cell viability (
Figure 2B). Consistently, MDM2 KD significantly enhanced the cytotoxic effect of Len (5 µM), Dex (10 µM), and Dox (1 µM) in 8226R5 and MM1.R cells (
Supplementary Figure S2B). Together, these results indicate that silencing MDM2 inhibits MM cell growth and re-sensitizes drug-resistant MM cells to current anti-myeloma agents irrespective of p53 status.
To determine if MDM2 KD can influence the cell cycle distribution of MM cells, we silenced MDM2 by siRNA in MM cell lines and performed FACS analysis with propidium iodide (PI) staining. MDM2 KD in MM1.R (p53
wt) cells resulted in an accumulation of G1/G0 phase cells (
Figure 2C; Scr. (52.6 ± 1.3%) vs. 30 nM (68.8 ± 2.8%) vs. 50 nM (9.2 ± 2.5%);
Supplementary Figure S2C). Conversely MDM2 KD in 8226R5 (p53
null) resulted in an accumulation of both G1/G0 and G2 phase cells (
Figure 2C; Scr. (53.2 ± 2.2%) vs. 30 nM (59.6 ± 3.3%) vs. 50 nM (64.8 ± 3.5%);
Supplementary Figure S2D). The cell cycle analysis (
Figure 2C) shows that MDM2 depletion results in accumulation of cells in G1 in p53wt and to a lesser extent in p53 null MM cells. Interestingly, while in p53wt MM cells, the increase in G1 was at the expense of reduced S and G2 phases, in p53 null cells, S phase decreased whereas G2 has dramatically increased. These results indicate that MDM2 silencing had differential impact on the cell cycle progression, or on the stage in the cell cycle in which these p53-proficient vs. p53-defcient cells die. However, this distinct cell cycle accumulation did not significantly change the kinetics of cell death as evident from caspase-3 cleavage (
Figure 2D), which is observed at 10 uM in both cell lines at similar intensity.
Next, to determine if MDM2 KD activates p53-dependent and independent pathways leading to apoptosis, we measured protein levels of key pro-apoptotic factors. We observed a dose-dependent upregulation of p73, cleaved PARP, p21, NOXA, and cleaved caspase-3 in both MM1.R and 8226R5 cells, as well as p53 in MM1.R cells (
Figure 2D). To confirm, that MDM2 KD can induce apoptosis in MM cells, we silenced MDM2 in MM cell lines and performed FACS analysis with PI/annexin V staining. MDM2 KD in MM1.R cells resulted in an increased proportion of apoptotic cells (
Figure 2E; Scr. (12.3 ± 3.5%) vs. 30 nM (24.1 ± 3.1%) vs. 50 nM (53.1 ± 1.8%);
Supplementary Figure S2E). Similar results were seen after MDM2 KD in 8226R5 cells (
Figure 2E,
Supplementary Figure S2F). Altogether, these results suggest that depleting MDM2 inhibits MM cell cycle progression and induces apoptosis in MM cells irrespective of p53 status.
3.3. MX69 Inhibits the Growth of Drug-Resistant MM Cells through Induction of p53-Dependent and Independent Pathways
To translate the findings from our MDM2 KD studies to develop novel treatments for MM, we evaluated the anti-myeloma effects of MX69 (
Figure 3A,
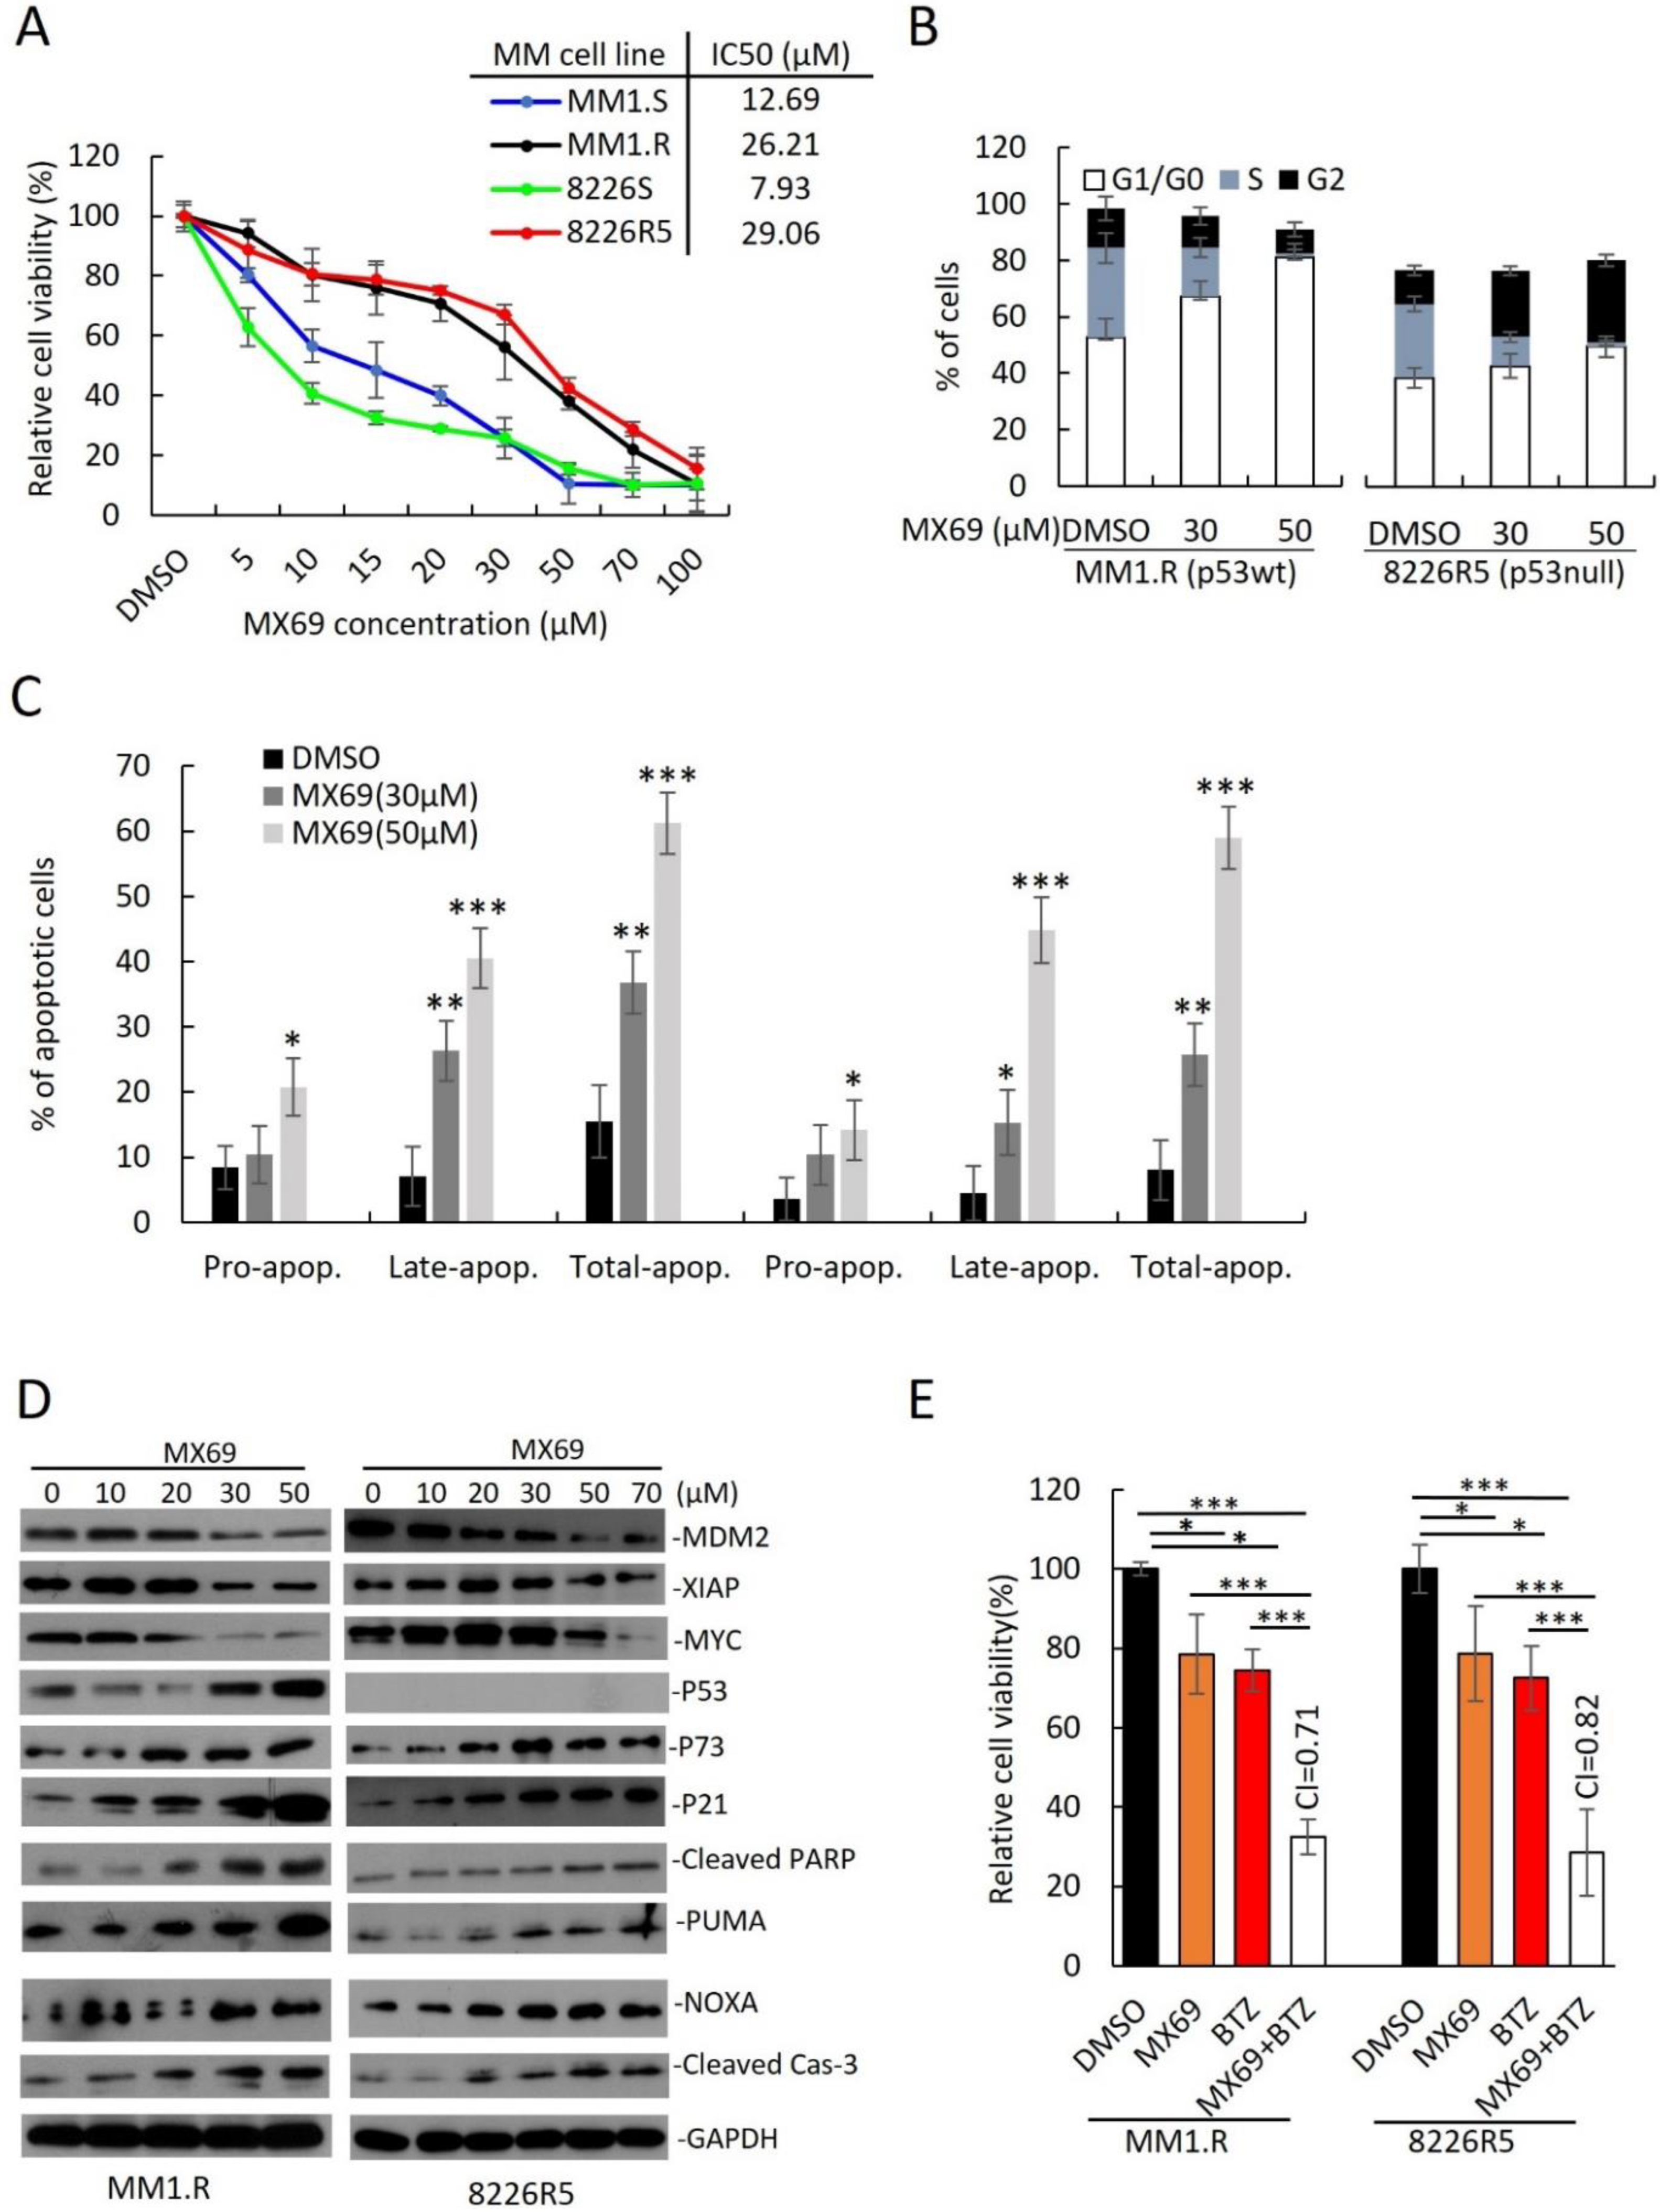
Supplemental Figure S3A). We treated a panel of drug-sensitive and drug-resistant MM cell lines with MX69 and performed cell viability assay. All MM cell lines were sensitive to MX69 regardless of p53 status (
Supplementary Figure S3B). While MX69 treatment reduced viability in all MM cell lines, drug-resistant MM cells also showed a hyperbolic dose-response curve and have a two-to-five-fold higher IC50 than their parental drug-sensitive cells, in line with their higher MDM2 basal levels (
Figure 3A,
Supplementary Figure S3B).
Next, we sought to evaluate whether MX69 can influence the cell cycle distribution of MM cells. MX69 resulted in an accumulation of MM1.R (TP53
wt) cells in G1/G0 phase (
Figure 3B; DMSO (52.8 ± 2.4%) vs. 30 μM (67.2 ± 3.5%) vs. 50 μM (81.2 ± 1.5%);
Supplementary Figure S3C). Conversely, MX69 treatment resulted in an accumulation of 8226R5 (p53
null) cells in G1/G0 and G2 phase (
Figure 3B; DMSO (47.8 ± 2.5%) vs. 30 μM (51.5 ± 2.8%) vs. 50 μM (59.4 ± 1.1%);
Supplementary Figure S3D). Furthermore, to determine if MX69 treatment can induce apoptosis in MM cells, we performed apoptosis assay. MX69 treatment increased the proportion of apoptotic MM1.R cells (
Figure 3C; DMSO (15.4 ± 2.8%) vs. 30 μM (36.03 ± 1.8%) vs. 50 μM (60.4 ± 2.0%);
Supplementary Figure S3E). Similar results were seen after treatment with MX69 in 8226R5 cells (
Figure 3C;
Supplementary Figure S3F). We also observed a dose- and time-dependent upregulation of p21, p73, NOXA, PUMA, cleaved PARP and cleaved Caspase-3 in both MM1.R and 8226R5 cells, as well as p53 in MM1.R cells (
Figure 3D,
Supplementary Figure S4A). Since MDM2 has been shown to stabilize MYCN mRNA and enhance MYCN translation [
18], we hypothesized that MDM2 could also interact similarly with the MYCN homologue c-Myc to induce c-Myc expression. Interestingly, we observed a time- and dose-dependent downregulation of c-Myc protein levels after MX69 treatment (
Figure 3D,
Supplementary Figure S4A). These results indicate that MX69 inhibits cell cycle progression and induces apoptosis in MM cells irrespective of p53 status.
To confirm the mechanism of action of MX69 as a promoter of MDM2 homodimerization, autoubiquitination and self-degradation, CHX pulse-chase assay confirmed that MX69 promoted MDM2 degradation since the half-life of MDM2 after MX69 treatment (<90 min) was shorter than in DMSO-treated control (>90 min) (
Supplemental Figure S4B).
Next, we examined the effects of MX69 on colony-forming and migratory potential of MM cells. Treatment of MM1.R and 8226R5 cells with MX69 significantly inhibited MM colony formation (
Supplemental Figure S4C,D) and migration (
Supplemental Figure S4E,F). These differences were not due to cytotoxicity as MM cells treated at the indicated doses showed ∼60% viability when cell viability assayed in parallel. These findings suggest that MX69 suppresses the clonogenic and migratory potential of MM cells. Since the standard of care of MM involves combination therapy, we evaluated whether MX69 can synergize with anti-myeloma drugs. Treatment of drug-resistant MM cell lines MM1.R and 8226R5 with suboptimal doses of MX69 (20 µM) or BTZ (5 nM) alone did not significantly decrease MM cell viability, however, combined treatment significantly decreased viability (
Figure 3E). Drug synergy by CompuSyn analysis confirmed that MX69 synergized with BTZ with combination index values < 0.9 (
Figure 3E). Similarly, single treatment with Len (5 µM), Dex (2.5 µM), and Dox (1 µM) did not significantly reduce MM1.R and 8226R5 cell viability, but there was significant growth inhibition in MM cells when combined with MX69 (
Supplemental Figure S5A,B). Drug synergy analysis confirmed that MX69 exerted synergism with Len, Dex, and Dox. These results suggest that MX69 re-sensitizes drug-resistant MM cells to frontline anti-myeloma drugs.
Since MX69 demonstrated synergism with BTZ, we next examined if MX69 treatment could circumvent chemoresistance and enhance the pro-apoptotic effects of BTZ. Combination treatment with MX69 (20 µM) + BTZ (10 nM) resulted in an increase in the proportion of apoptotic MM1.R and 8226R5 cells (
Supplemental Figure S5C,D). To confirm that combination treatment with MX69 (20 µM) + BTZ (10 nM) or MX69 (20 µM) + Len (5 µM) activated apoptotic pathways leading to MM cell death, we measured the expression of pro- and anti-apoptotic factors. Immunoblotting revealed that combination treatment with MX69 + BTZ or MX69 + Len downregulated MDM2, XIAP and c-Myc in both MM1.R and 8226R5 cells. We also observed an upregulation in p73, p21, cleaved Caspase-3 and NOXA in both MM1.R and 8226R5 cells, as well as p53 in MM1.R cells (
Supplemental Figure S5E). These results indicate that MX69 effectively induces apoptosis in combination with current anti-myeloma agent BTZ [
24].
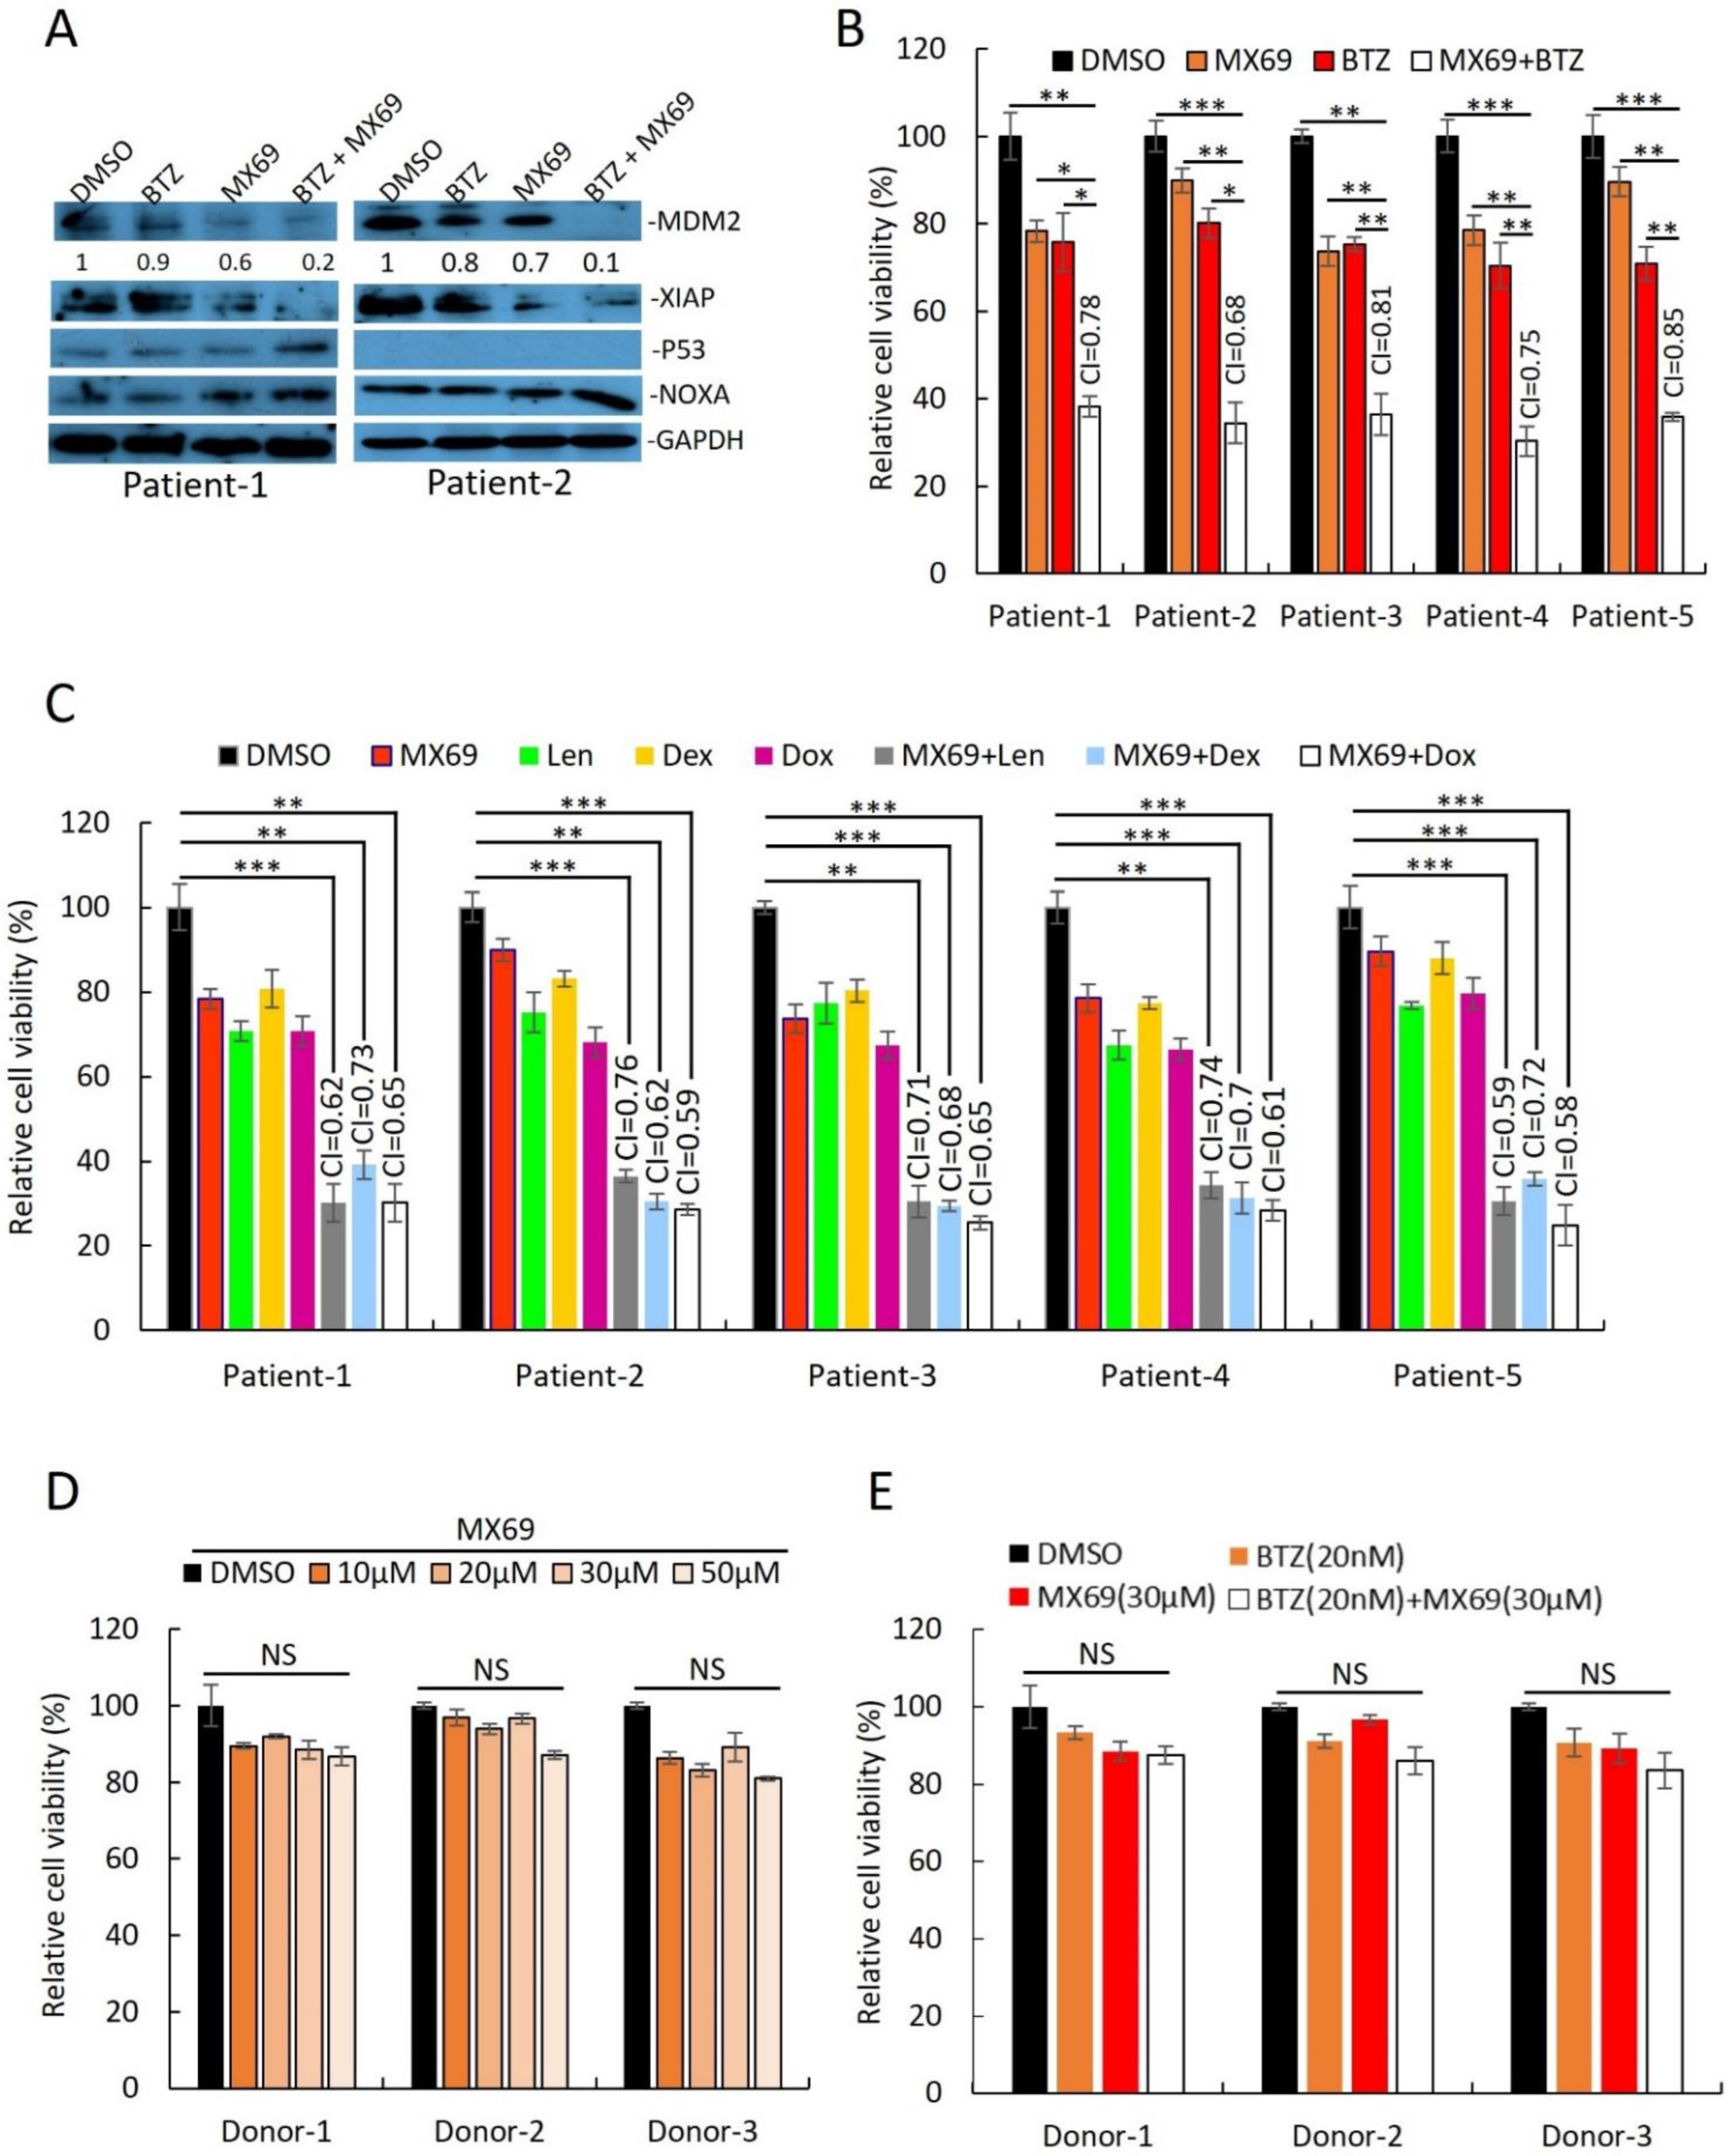
Supporting the results from MM cell lines, MX69 had cytotoxic effects in MM patient plasma cells isolated by CD138+ selection. Immunoblotting of cell lysates from two primary MM samples revealed that combination treatment with BTZ (10 nM) + MX69 (20 µM) downregulated MDM2 and XIAP, and upregulated NOXA (
Figure 4A). MX69 (20 µM) had synergistic effects when used in combination with BTZ (10 nM), Dex (10 µM), Dox (1 µM), and Len (5 µM) (
Figure 4B,C). To rule out off-target cytotoxic effects of MX69, we performed cell viability assay of PBMC obtained from healthy donors following treatment with MX69 and/or BTZ. The cell viability of healthy PBMCs was not significantly impacted by drug concentrations effective against MM cells (
Figure 4D,E). Altogether, these results suggest that MX69 is a potential anti-myeloma agent with selective cytotoxic effects in MM cells.
3.4. MX69 Inhibits c-Myc mRNA Potentially by Attenuating MDM2-cMYC mRNA Interaction
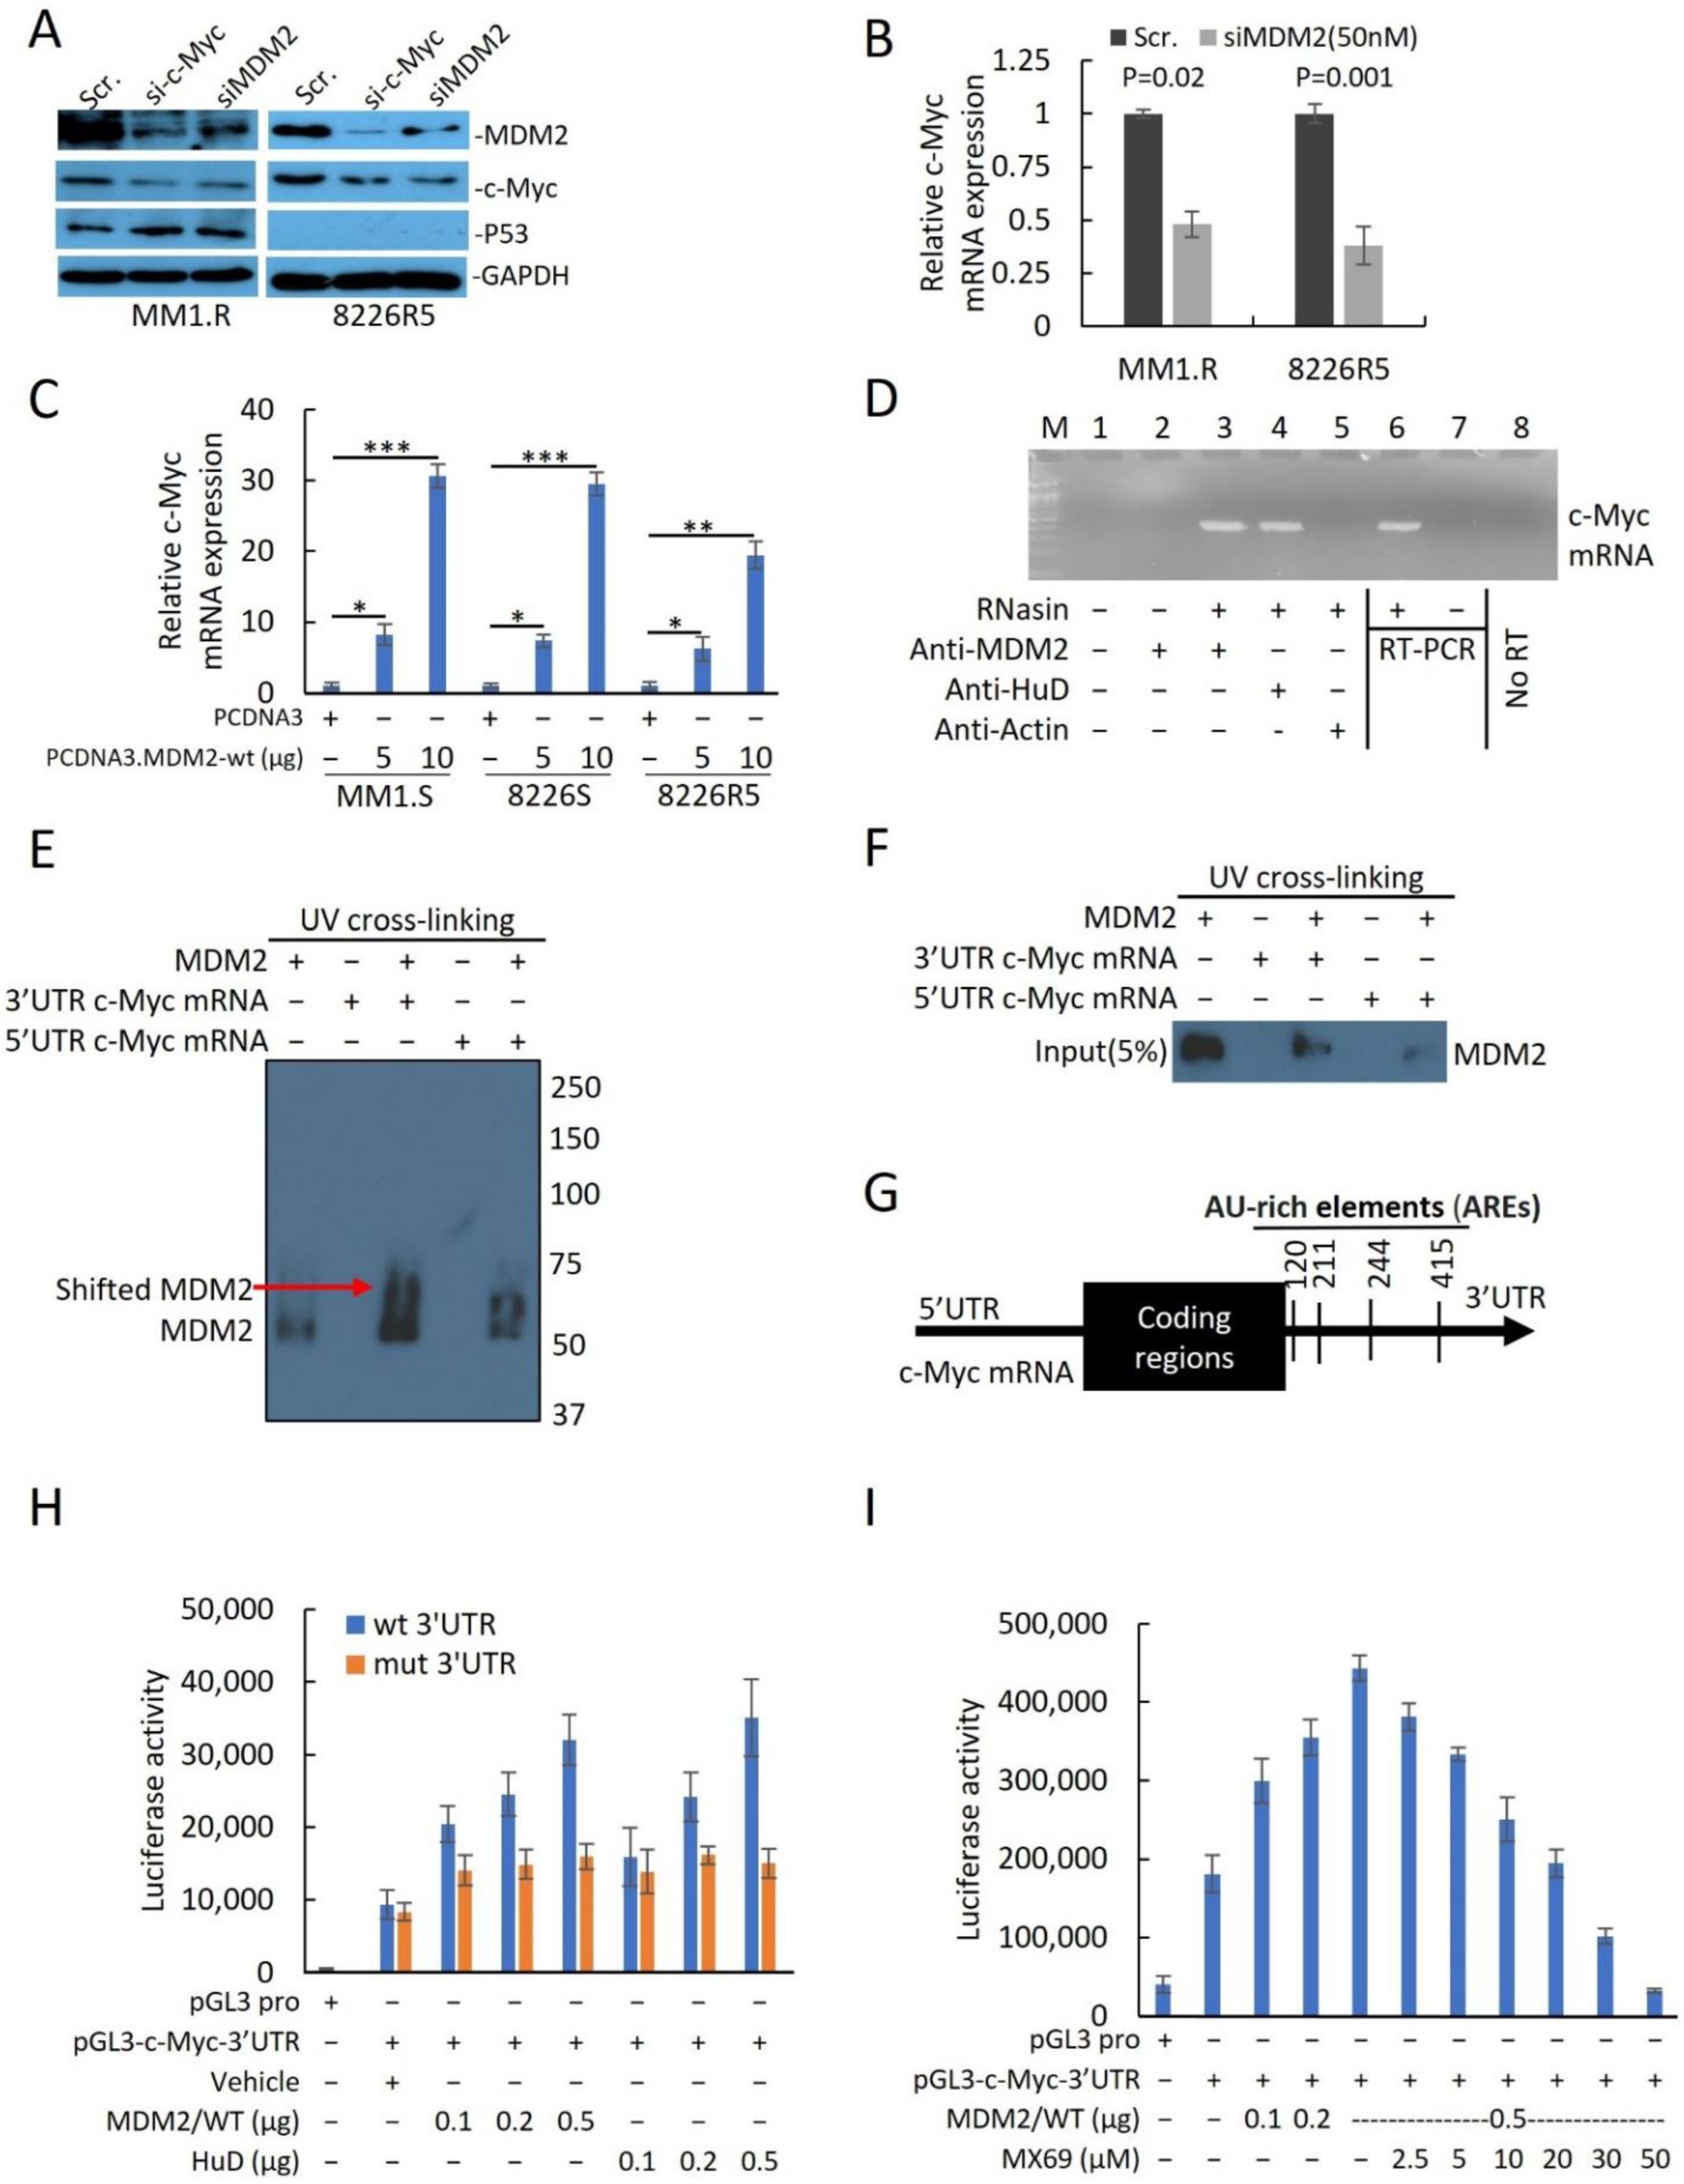
Given that MX69 treatment resulted in the downregulation of c-Myc, we sought to investigate the relationship between MDM2 and c-Myc expression. To confirm the positive association between MDM2 and c-Myc expression levels, we evaluated the effects of MDM2 or c-Myc knockdown in 8226R5 and MM1.R cell lines. Interestingly, we found that knockdown of MDM2 reduced c-Myc protein expression, while knockdown of c-Myc reduced MDM2 protein expression (
Figure 5A). Furthermore, knockdown of MDM2 or MX69 treatment resulted in downregulation of c-Myc mRNA levels in 8226R5 and MM1.R cells (
Figure 5B,
Supplemental Figure S6A–D). We performed qRT-PCR to evaluate the effects of modulating MDM2 expression on c-Myc mRNA levels. Ectopic overexpression of MDM2 resulted in the dose-dependent upregulation of c-Myc mRNA levels in MM1.S, 8226S, and 8226R5 cells (
Figure 5C,
Supplemental Figure S6E).
To find evidence of the association between MDM2 and c-Myc, we performed correlation analysis of MDM2 in this GSE6477 dataset. MDM2 had a significant correlation with genes (data not shown) in relapsed MM samples, including c-Myc (
Supplemental Figure S6F). We confirmed this finding in an independent dataset (
Supplemental Figure S6G). To gain insight into the biological significance of the alterations in MDM2 gene expression level, we performed gene set enrichment analysis (GSEA) to identify the specific biological processes, molecular functions, or cellular components which are over-/under-represented in the context of MDM2 overexpression [
25]. We stratified the patient sets based on the median MDM2 expression value from GSE6477 resistant MM patient samples. GSEA analysis revealed that MDM2 overexpression phenotype was associated with enrichment of ten hallmark cancer gene sets (
Supplemental Figure S6H). Among these ten hallmark gene sets, MYC_TARGETS_V1 and MYC_TARGETS_V2 were enriched in the MDM2 overexpression group (
Supplemental Figure S6I,J). These findings suggest that c-Myc and MDM2 expression levels are positively correlated.
Since c-Myc activation contributes to the development of hematological malignancies including MM [
26], we investigated the clinical characteristics associated with c-Myc overexpression. Relapsed MM patients’ plasma cells had higher levels of c-Myc compared to newly diagnosed MM, while both groups had higher c-Myc expression compared to normal donor (
Supplemental Figure S6K). We further confirmed that relapsed MM patient samples had higher expression levels of c-Myc compared to newly diagnosed MM in an independent dataset (
Supplemental Figure S6L). Our findings affirm that c-Myc correlates with MM disease advancement and is a potential therapeutic target in MM.
To further confirm the positive association between MDM2 and c-Myc expression levels, we ectopically overexpressed MDM2 in MM cell lines expressing low endogenous levels of MDM2. Overexpression of MDM2 in drug sensitive (MM1.S and 8226S) cells resulted in upregulated c-Myc expression, which was reversed by MDM2 KD or MX69 treatment (
Supplemental Figure S7A,B). In parallel, we performed cell viability assay and found that overexpression of MDM2 resulted in increased viability which was reversed by concurrent siMDM2 transfection or MX69 treatment (
Supplemental Figure S7A(below),B(below)). Of note, immunoblotting of p53 in 8226S cells showed MDM2 expression levels had no effect on mutant p53 expression since MDM2 cannot target mutant p53 (
Supplemental Figure S7B). Conversely, overexpression of c-Myc in MM1.S and 8226S cells increased MDM2 expression, which was reversed by concurrent si-c-Myc transfection or MX69 treatment (
Supplemental Figure S7C,D). In parallel, overexpression of c-Myc resulted in increased MM cell viability, which was reversed by concurrent si-c-Myc transfection or MX69 treatment (
Supplemental Figure S7C(below),D(below)). Of note, immunoblotting of 8226S cells showed that c-Myc expression level had no effect on mutant p53 expression (
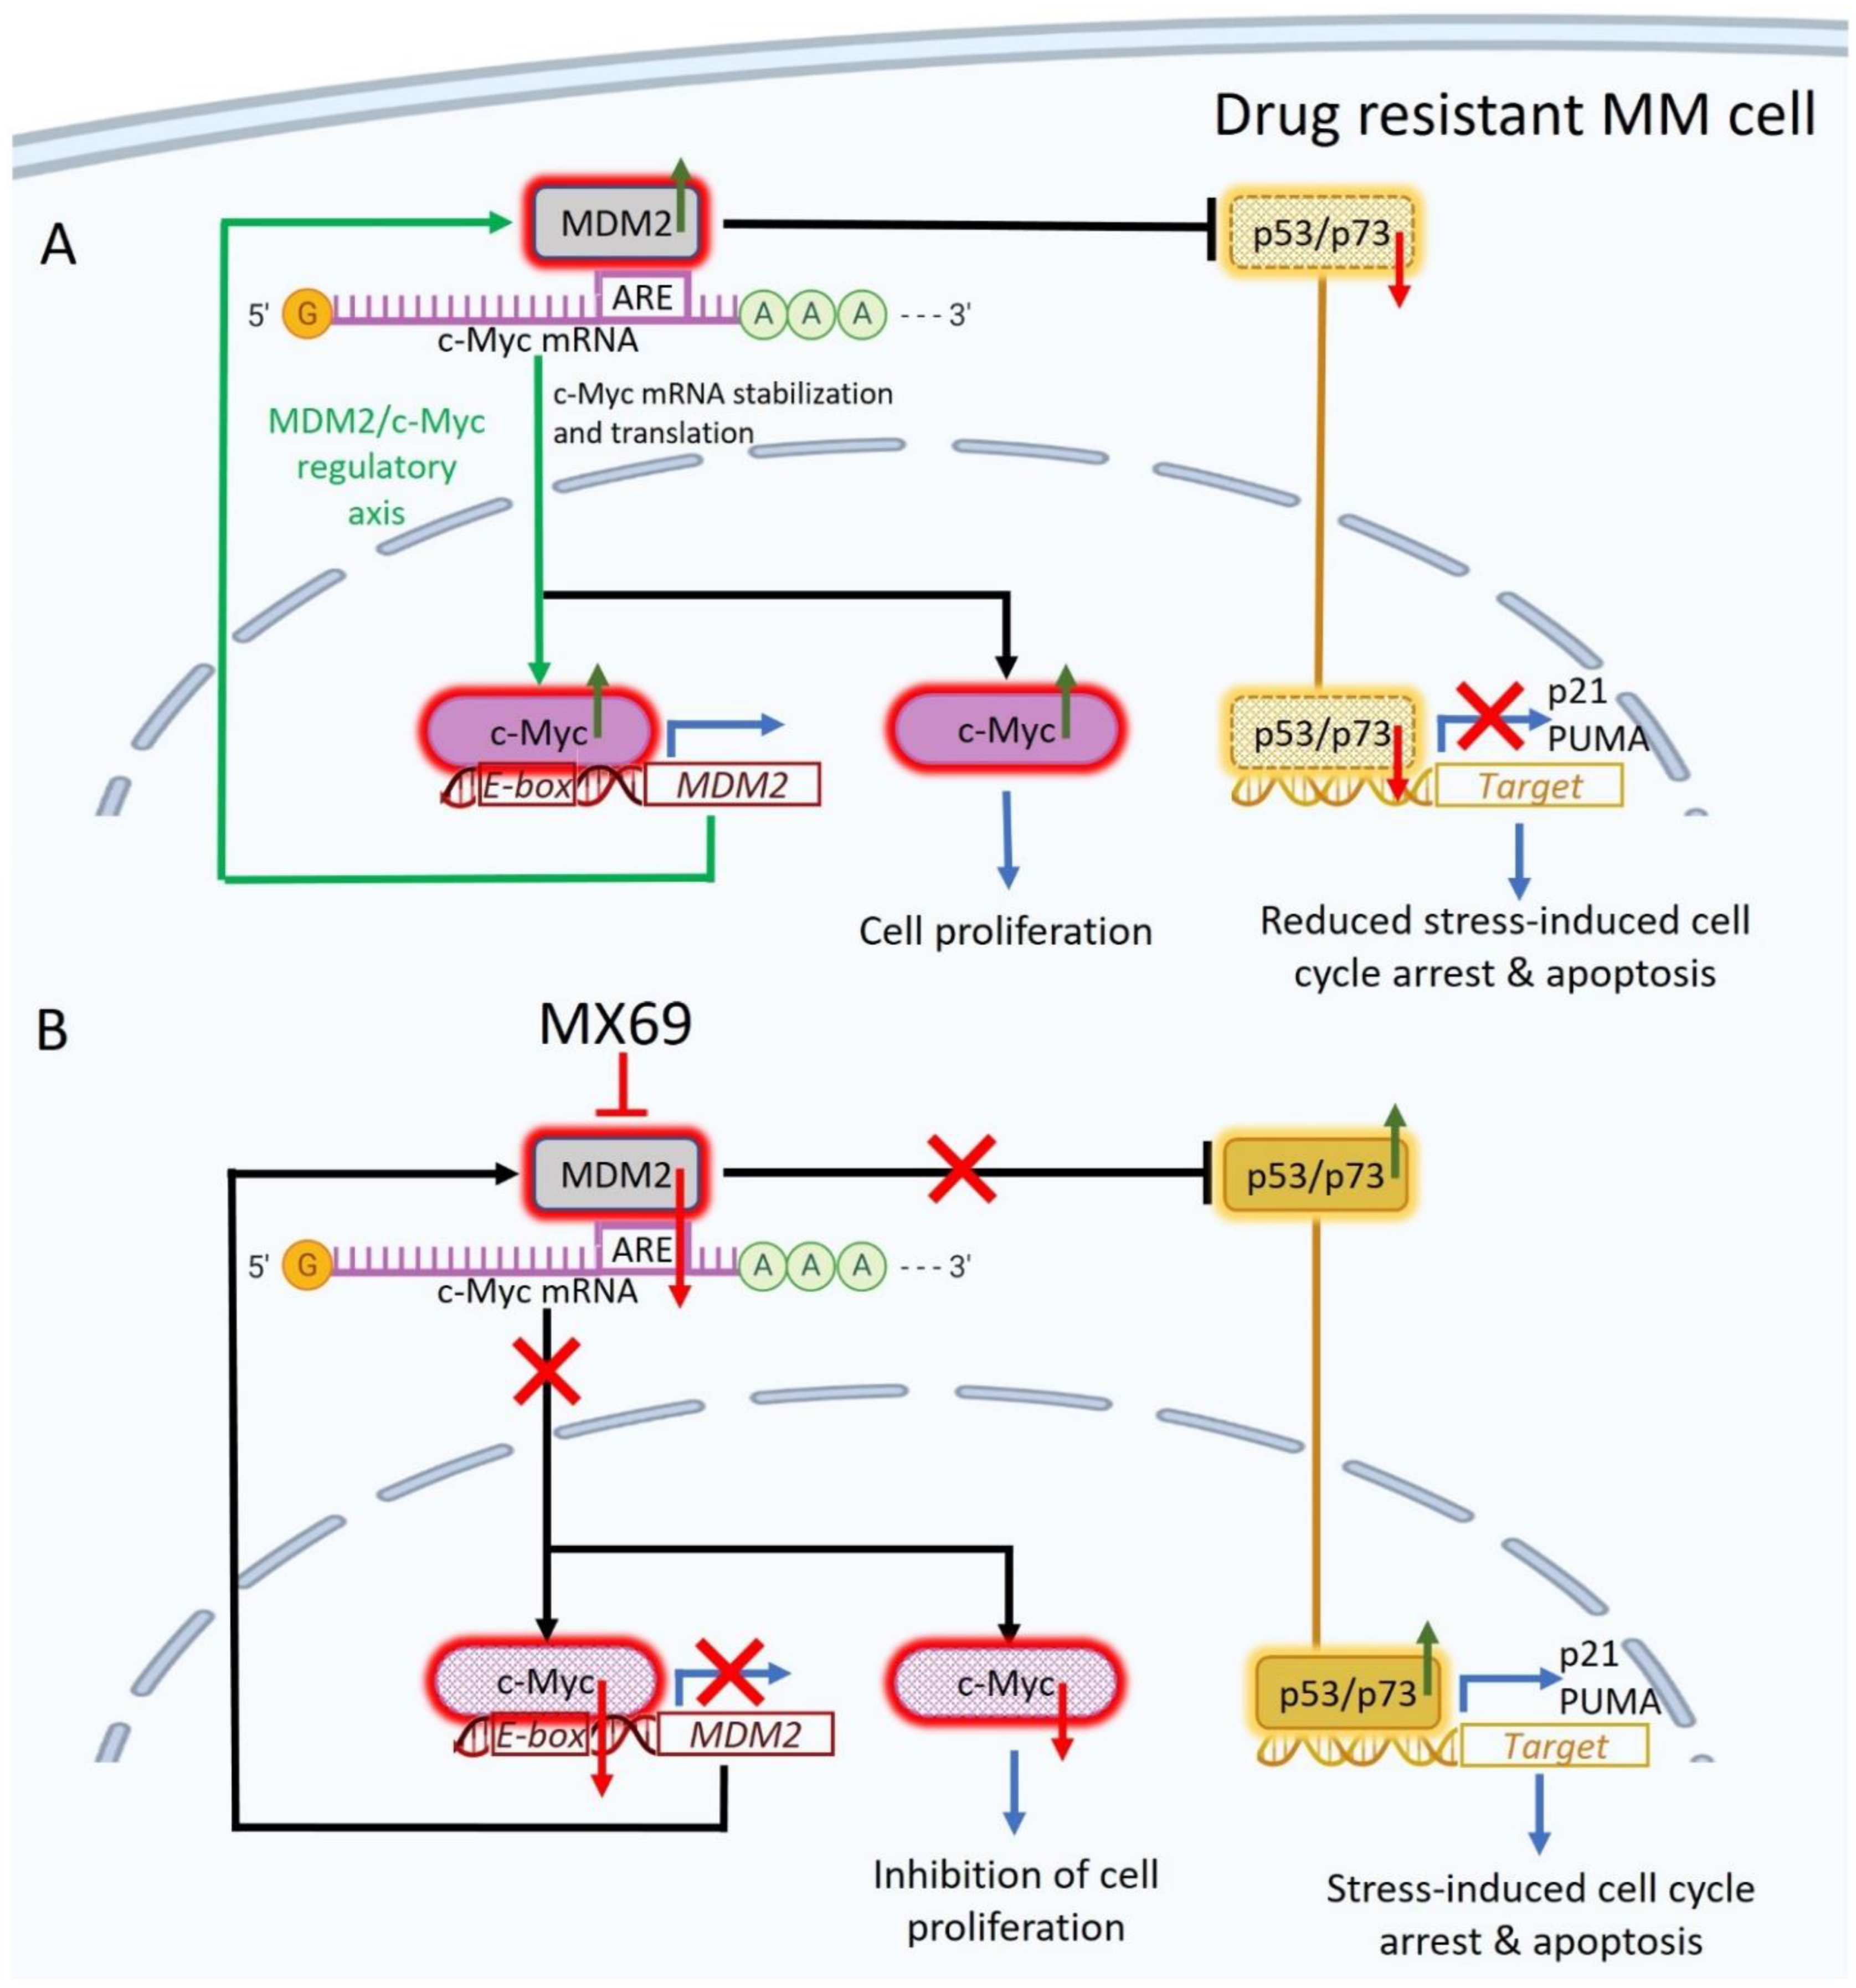
Supplemental Figure S7D). These results confirm that the expression of MDM2 and c-Myc are positively correlated and suggest that MDM2 and c-Myc form a reciprocal regulatory loop.
Next, we sought out to investigate the molecular mechanisms underlying the association between MDM2 and c-Myc expression levels. Since MDM2 stabilizes MYCN mRNA transcript [
18] and our results revealed that MDM2 and c-Myc expression levels are correlated, we sought to test whether MDM2 can stabilize c-Myc transcripts. We performed quantitative RT-PCR for after treatment with actinomycin-D to inhibit mRNA synthesis to measure c-Myc mRNA turnover [
27]. MDM2 KD significantly reduced the stability of c-Myc mRNA with concurrent treatment with actinomycin-D (
Supplemental Figure S8A). This result suggests that MDM2 stabilizes c-Myc mRNA.
To investigate whether MDM2 protein can directly bind to and stabilize c-Myc mRNA, we performed a protein–RNA binding assay to search for possible physical associations between MDM2 protein and c-Myc mRNA. After pulldown of MDM2 or mRNA binding protein like HuD [
28] and RT-PCR, revealed that MDM2, like HuD, was able to bind to c-Myc Mrna (
Figure 5D). Since MDM2 protein binds either the 3′UTR or 5′UTR mRNA sequence to regulate gene expression at the translational level, we further investigated whether MDM2 binds specifically to the c-Myc 3′UTR or 5′UTR. We performed UV crosslinking of c-Myc 3′UTR or 5′UTR probes with MDM2 protein for gel shift assay. Results indicated that 3′UTR c-Myc mRNA showed greater shift with MDM2 protein compared to 5′UTR c-Myc RNA suggesting that MDM2 binds to the 3′UTR of c-Myc mRNA (
Figure 5E). To further confirm that MDM2 binds specifically to the 3′UTR of c-Myc mRNA, we performed UV-crosslinking of UTP-biotinylated c-Myc 3′UTR and 5′UTR RNA probes with 8226R5 cells extracts. RNA-protein complexes that were pulled down revealed that MDM2 binds to the c-Myc 3′UTR RNA probe, but not to the c-Myc 5′UTR RNA probe (
Figure 5F). To rule out the possibility that MDM2 binds to c-Myc mRNA through its interaction with endogenous HuD in extracts, we performed co-immunoprecipitation and found no binding interaction between MDM2 and HuD (
Supplemental Figure S8B).
To further investigate the binding mechanism between MDM2 and the 3′UTR of c-Myc mRNA, we analyzed the c-Myc 3′UTR sequence and found four AU-rich elements (AREs) (
Figure 5G) and hypothesized that MDM2 stabilizes c-Myc mRNA by binding its AREs. To confirm that MDM2 induces c-Myc translation and ascertain whether the translational effect is exerted through the 3′UTR, we constructed a firefly luciferase reporter plasmid containing the c-Myc 3′UTR in a pGL3-promoter (pGL3-c-Myc-3′UTR) and ARE mutations plasmids. Insertion and mutations were confirmed by Sanger Sequencing. Co-transfection of reporter plasmid with MDM2 and HuD (Positive control which binds to 3′UTR AREs) plasmids increased luciferase activity from the c-Myc 3′UTR reporter (
Figure 5H). Conversely, cells transfected with ARE mutant plasmid did not show an increased luciferase intensity after co-transfection with MDM2 or HuD plasmid (
Figure 5H). Silencing MDM2 reduced the luciferase activity from the c-Myc 3′UTR reporter in MM cells transfected with the pGL3-c-Myc-3′UTR plasmid (
Supplemental Figure S8C). Next, we evaluated whether MX69 abrogates MDM2/c-Myc 3′UTR physical interaction to downregulate c-Myc. MX69 reduced luciferase activity from the c-Myc 3′UTR reporter in a dose-dependent manner (
Figure 5I). Finally, we sought to rule out other potential mechanisms by which MDM2 regulates c-Myc. We performed a pulse-chase assay to rule out a post-translational mechanism whereby MDM2 regulates c-Myc protein stability. The half-life of the c-Myc protein in siMDM2-transfected cells was comparable to that of control cells (
Supplemental Figure S8D). Collectively, these results indicate that MDM2 regulates c-Myc expression through stabilization of the 3′UTR of c-Myc mRNA, and MX69 inhibits MDM2 mediated c-Myc downregulation.
3.5. MDM2 Is a Direct Transcriptional Target of c-Myc in MM
Since modulation of c-Myc expression levels resulted in reciprocal change in MDM2 expression levels, we hypothesized that MDM2 is a direct transcriptional target of c-Myc. Bioinformatics studies identified DNase I hypersensitive sites (open chromatic regions of DNA) and high levels of H3K27Ac in the promoter region of MDM2 at predicted c-Myc binding sites, suggesting that c-Myc activates transcription of MDM2 (
Supplemental Figure S9A). ENCODE also confirmed MDM2 is recruited to the c-Myc promoter (
Supplemental Figure S9B). For further confirmation of c-Myc binding to the MDM2 promoter, in silico phylogenetic foot printing was used to identify conserved motifs in those orthologous regions [
29]. We identified four c-Myc binding motifs (motifs 1–4) on the MDM2 promoter region that contained canonical enhancer box (E-box) sequences (CACGTG) (
Supplemental Figure S10A), which can be bound by Myc, Myc/Max and other transcription factors [
30,
31].
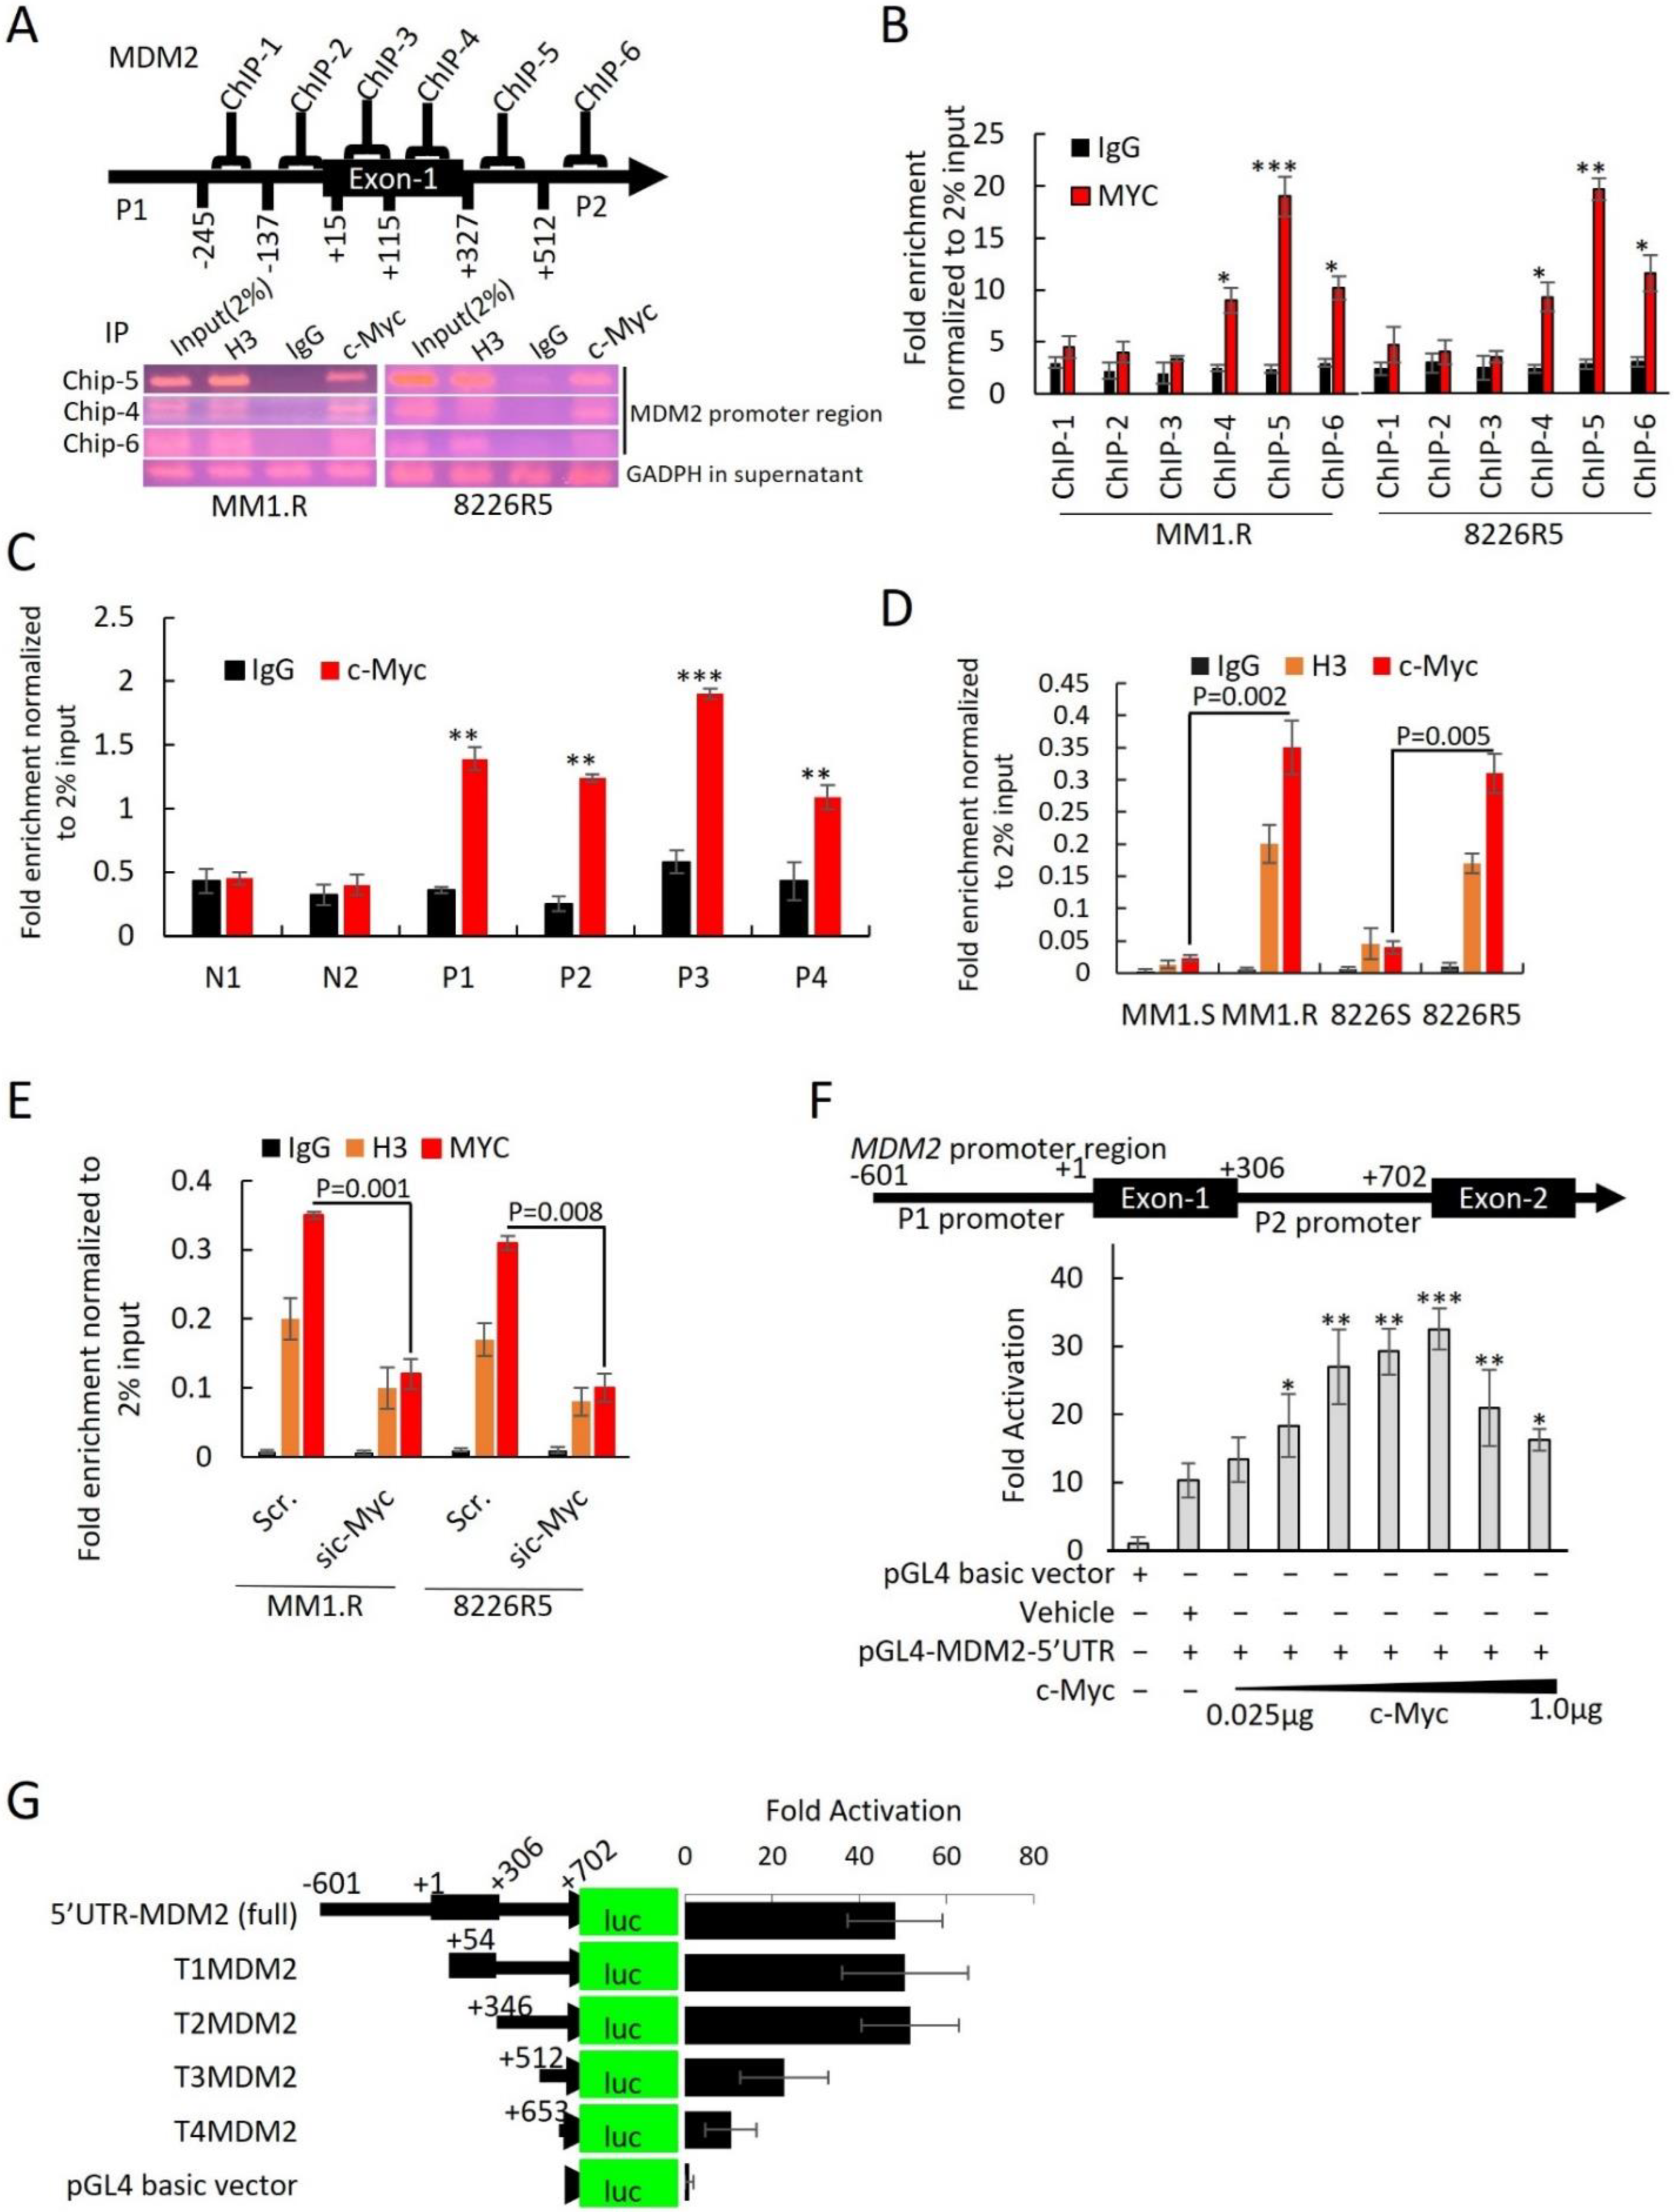
To identify potential c-Myc regulatory sites, we performed ChIP assay. We focused on a ~1300 bp region on the
MDM2 promoter that covered all four predicted c-Myc binding motifs. Six primer ChIP pairs (ChIP-1 to ChIP-6) were designed to cover this region (
Supplementary Table S1). After immunoprecipitation of c-Myc-bound DNA in MM1.R and 8226R5, we found that ChIP5, which contained c-Myc binding motif 3, was enriched with c-Myc (
Figure 6A). ChIP-qRT-PCR of c-Myc bound DNA found that only ChIP-5 was significantly more enriched with c-Myc compared to control (
Figure 6B). To confirm that c-Myc binds to the MDM2 promoter in MM cells, we re-performed ChIP assay on four primary MM patient samples and two normal donor samples and found that c-Myc was enriched on the MDM2 promoter of MM patient samples but not normal donor samples, suggesting that c-Myc is involved in the upregulation of MDM2 in MM pathogenesis (
Figure 6C). Furthermore, ChIP-qRT-PCR on paired drug-sensitive and drug-resistant MM cells revealed that the binding of c-Myc on the MDM2 promoter was significantly increased in drug-resistant MM cells, suggesting that c-Myc is involved in the upregulation of MDM2 in drug resistance (
Figure 6D). Moreover, silencing of c-Myc in drug-resistant MM cells showed less c-Myc enrichment on the MDM2 promoter in comparison to control (
Figure 6E). These results indicate that c-Myc binds to the MDM2 promoter in MM cells to regulate the expression ofMDM2. To confirm that MDM2 is a direct transcriptional target of c-Myc, we cloned the MDM2 promoter region (covering promoter regions 1 and 2) into the null promoter pGL4-basic vector and performed gene transfection and reporter assays. Co-transfection with various concentrations of c-Myc expression plasmid stimulated the MDM2 promoter-mediated luciferase activity in 293T cells, suggesting that c-Myc regulates MDM2 transcription (
Figure 6F).
To identify the c-Myc binding motifs in the MDM2 promoter responsible for c-Myc regulation of MDM2 expression, we carried out sequential truncation of the ~1300 bp upstream region and generated luciferase vectors. Vectors with deletions of c-Myc binding motifs 1 (T1MDM2) and 2 (T2MDM2) but with intact binding motifs 3 and 4 produced the same luciferase intensity as the vector containing the entire ~1300 bp region (5′UTR-MDM2) (
Figure 6G). Conversely, we found that sequential removal of c-Myc binding motifs 3 (T3MDM2) and 4 (T4MDM2) significantly reduced luciferase intensity compared to full construct (
Figure 6G). Further reporter assays demonstrated that ectopic overexpression of c-Myc resulted in an increase in MDM2 promoter activity with intact motifs as evidenced by increased luciferase activity from T1MDM2 (containing motifs 2, 3, and 4) and T2MDM2 (containing motifs 3 and 4) (
Supplemental Figure S10B). Conversely, overexpression of c-Myc could not increase the MDM2 promoter activation from T3MDM2 (containing motif 4) or T4MDM2 (containing no motifs) (
Supplemental Figure S10C). To further implicate c-Myc as a transcription factor forMDM2, we performed reporter assays using a T2MDM2 construct with mutated c-Myc binding motif 3. The mutated T2MDM2 construct had significantly reduced MDM2 promoter activity (~78% reduction) compared to full construct (
Supplemental Figure S10D). Of note, we did not observe an increase in the activation of the mutated MDM2 promoter in the context of c-Myc ectopic overexpression (
Supplemental Figure S10D). Altogether, these results indicate that c-Myc binds to the MDM2 promoter, specifically at E-box binding motifs, in MM cells to regulate the expression ofMDM2.
3.6. MX69 Inhibits Tumorigenesis in a MM Xenograft Model
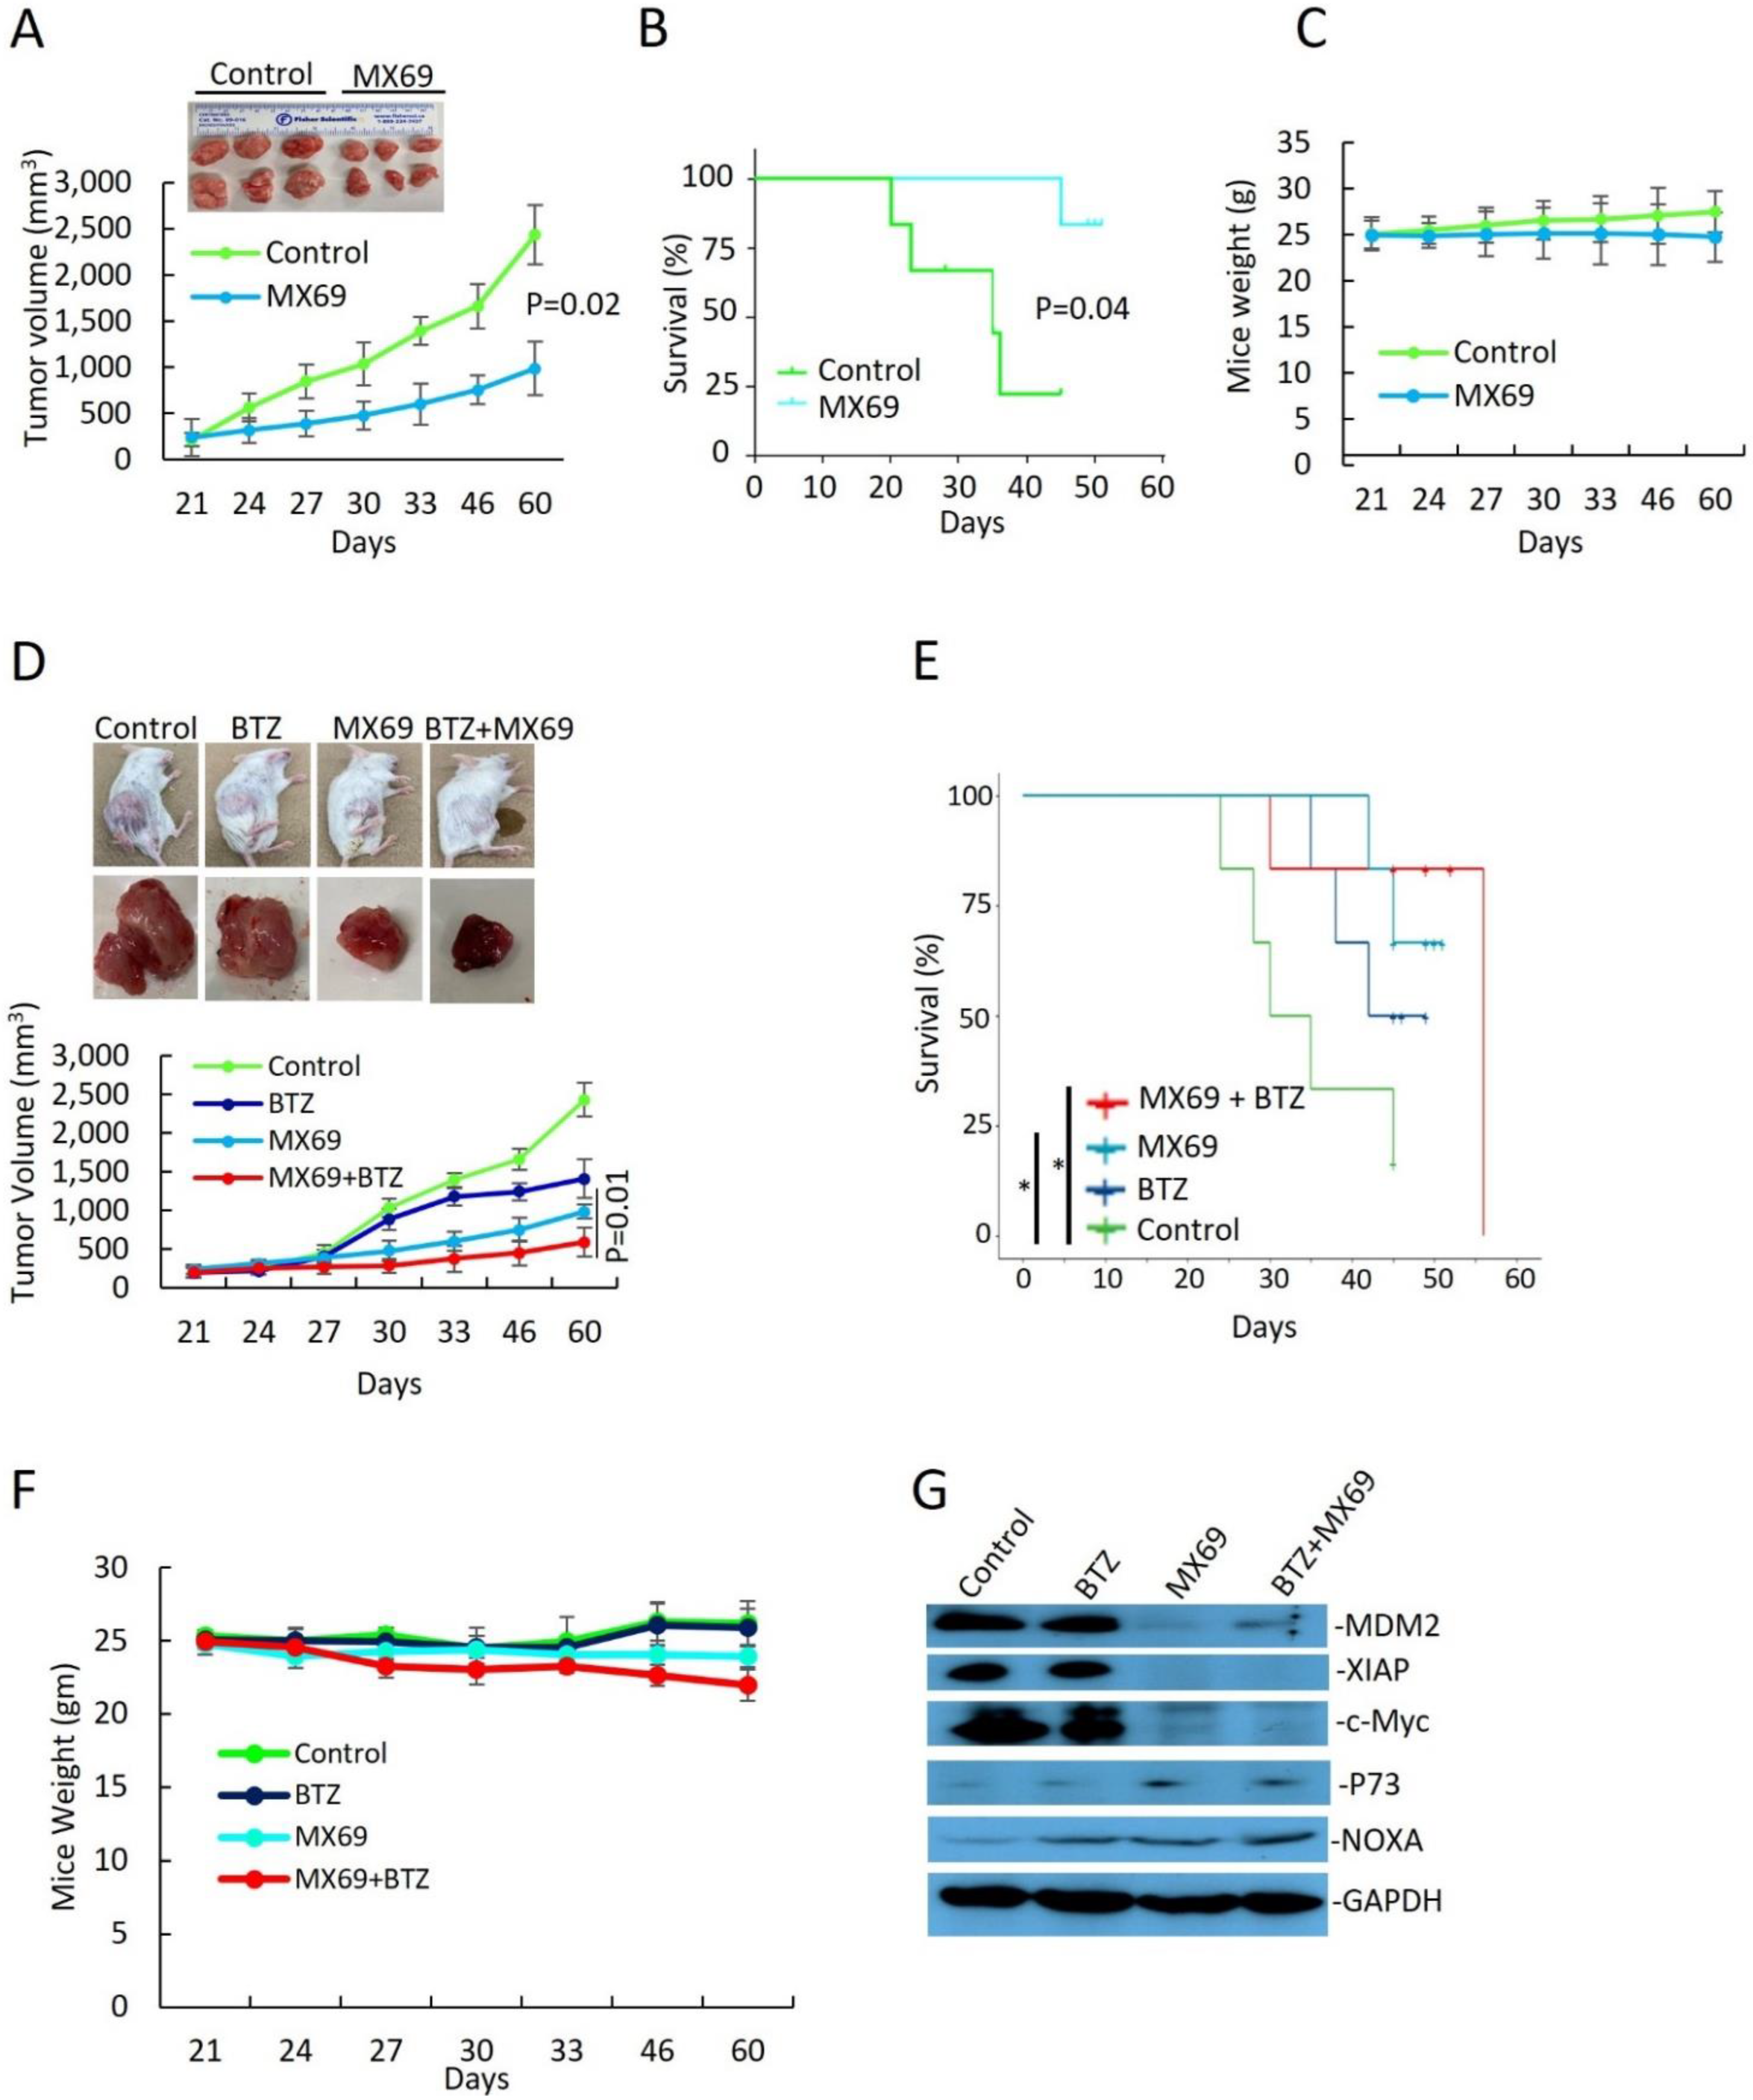
To evaluate the in vivo effects of MDM2 inhibition by MX69 in MM, we generated a MM model using SCID mice xenografted with 8266R5 cells. Treatment three times a week with 50 mg/kg MX69 alone significantly reduced tumor growth compared to vehicle control (
Figure 7A,
p = 0.02). MX69 treatment also improved survival of mice, evidenced by first death at day 24 in the control group versus day up to 60 in the treated group (
Figure 7B;
p = 0.041).
Finally, to examine if MX69 could further exert anti-myeloma effects with BTZ, we treated xenograft mice through intraperitoneal injection twice a week with 0.5 mg/kg BTZ alone, three times a week with 50 mg/kg MX69 alone or combined with 0.5 mg/kg BTZ, or an equal volume of vehicle for 21 days. Combination treatment with MX69 and BTZ was most effective at inhibiting tumor growth compared and resulted in prolonged survival compared to control or single agent treated animals (
Figure 7D; on day 22
p = 0.012). (
Figure 7E; MX69 + BTZ vs. vehicle control
p = 0.027). When we examined isolated tumor tissues, immunoblotting demonstrated that MX69-treated groups had reduced expression ofMDM2, XIAP, and c-Myc and increased expression of pro-apoptotic factor NOXA (
Figure 7G). In addition, treatment with MX69 and/or BTZ did not affect body weight, indicating the doses used for the treatment were tolerable to the mice (
Figure 7C,F).
IHC staining analysis of tumor sections showed that combination treatment with MX69 and BTZ resulted in a decrease in the Ki67 proliferation index and an increase in the TUNEL apoptotic index compared to single treatment (
Supplemental Figure S11A–C). Collectively, these findings indicate that in vivo targeting of MDM2 by MX69 sensitizes chemo-resistant MM cells to BTZ treatment, induces apoptosis in MM cells and suppresses MM tumor growth.


 ,
, 


