

Characterization of Patient Activation among Childhood Cancer Survivors in the St. Jude Lifetime Cohort Study (SJLIFE)

 , ,
, ,  , , ,
, , ,
Abstract
:Simple Summary
Abstract
1. Introduction
2. Materials and Methods
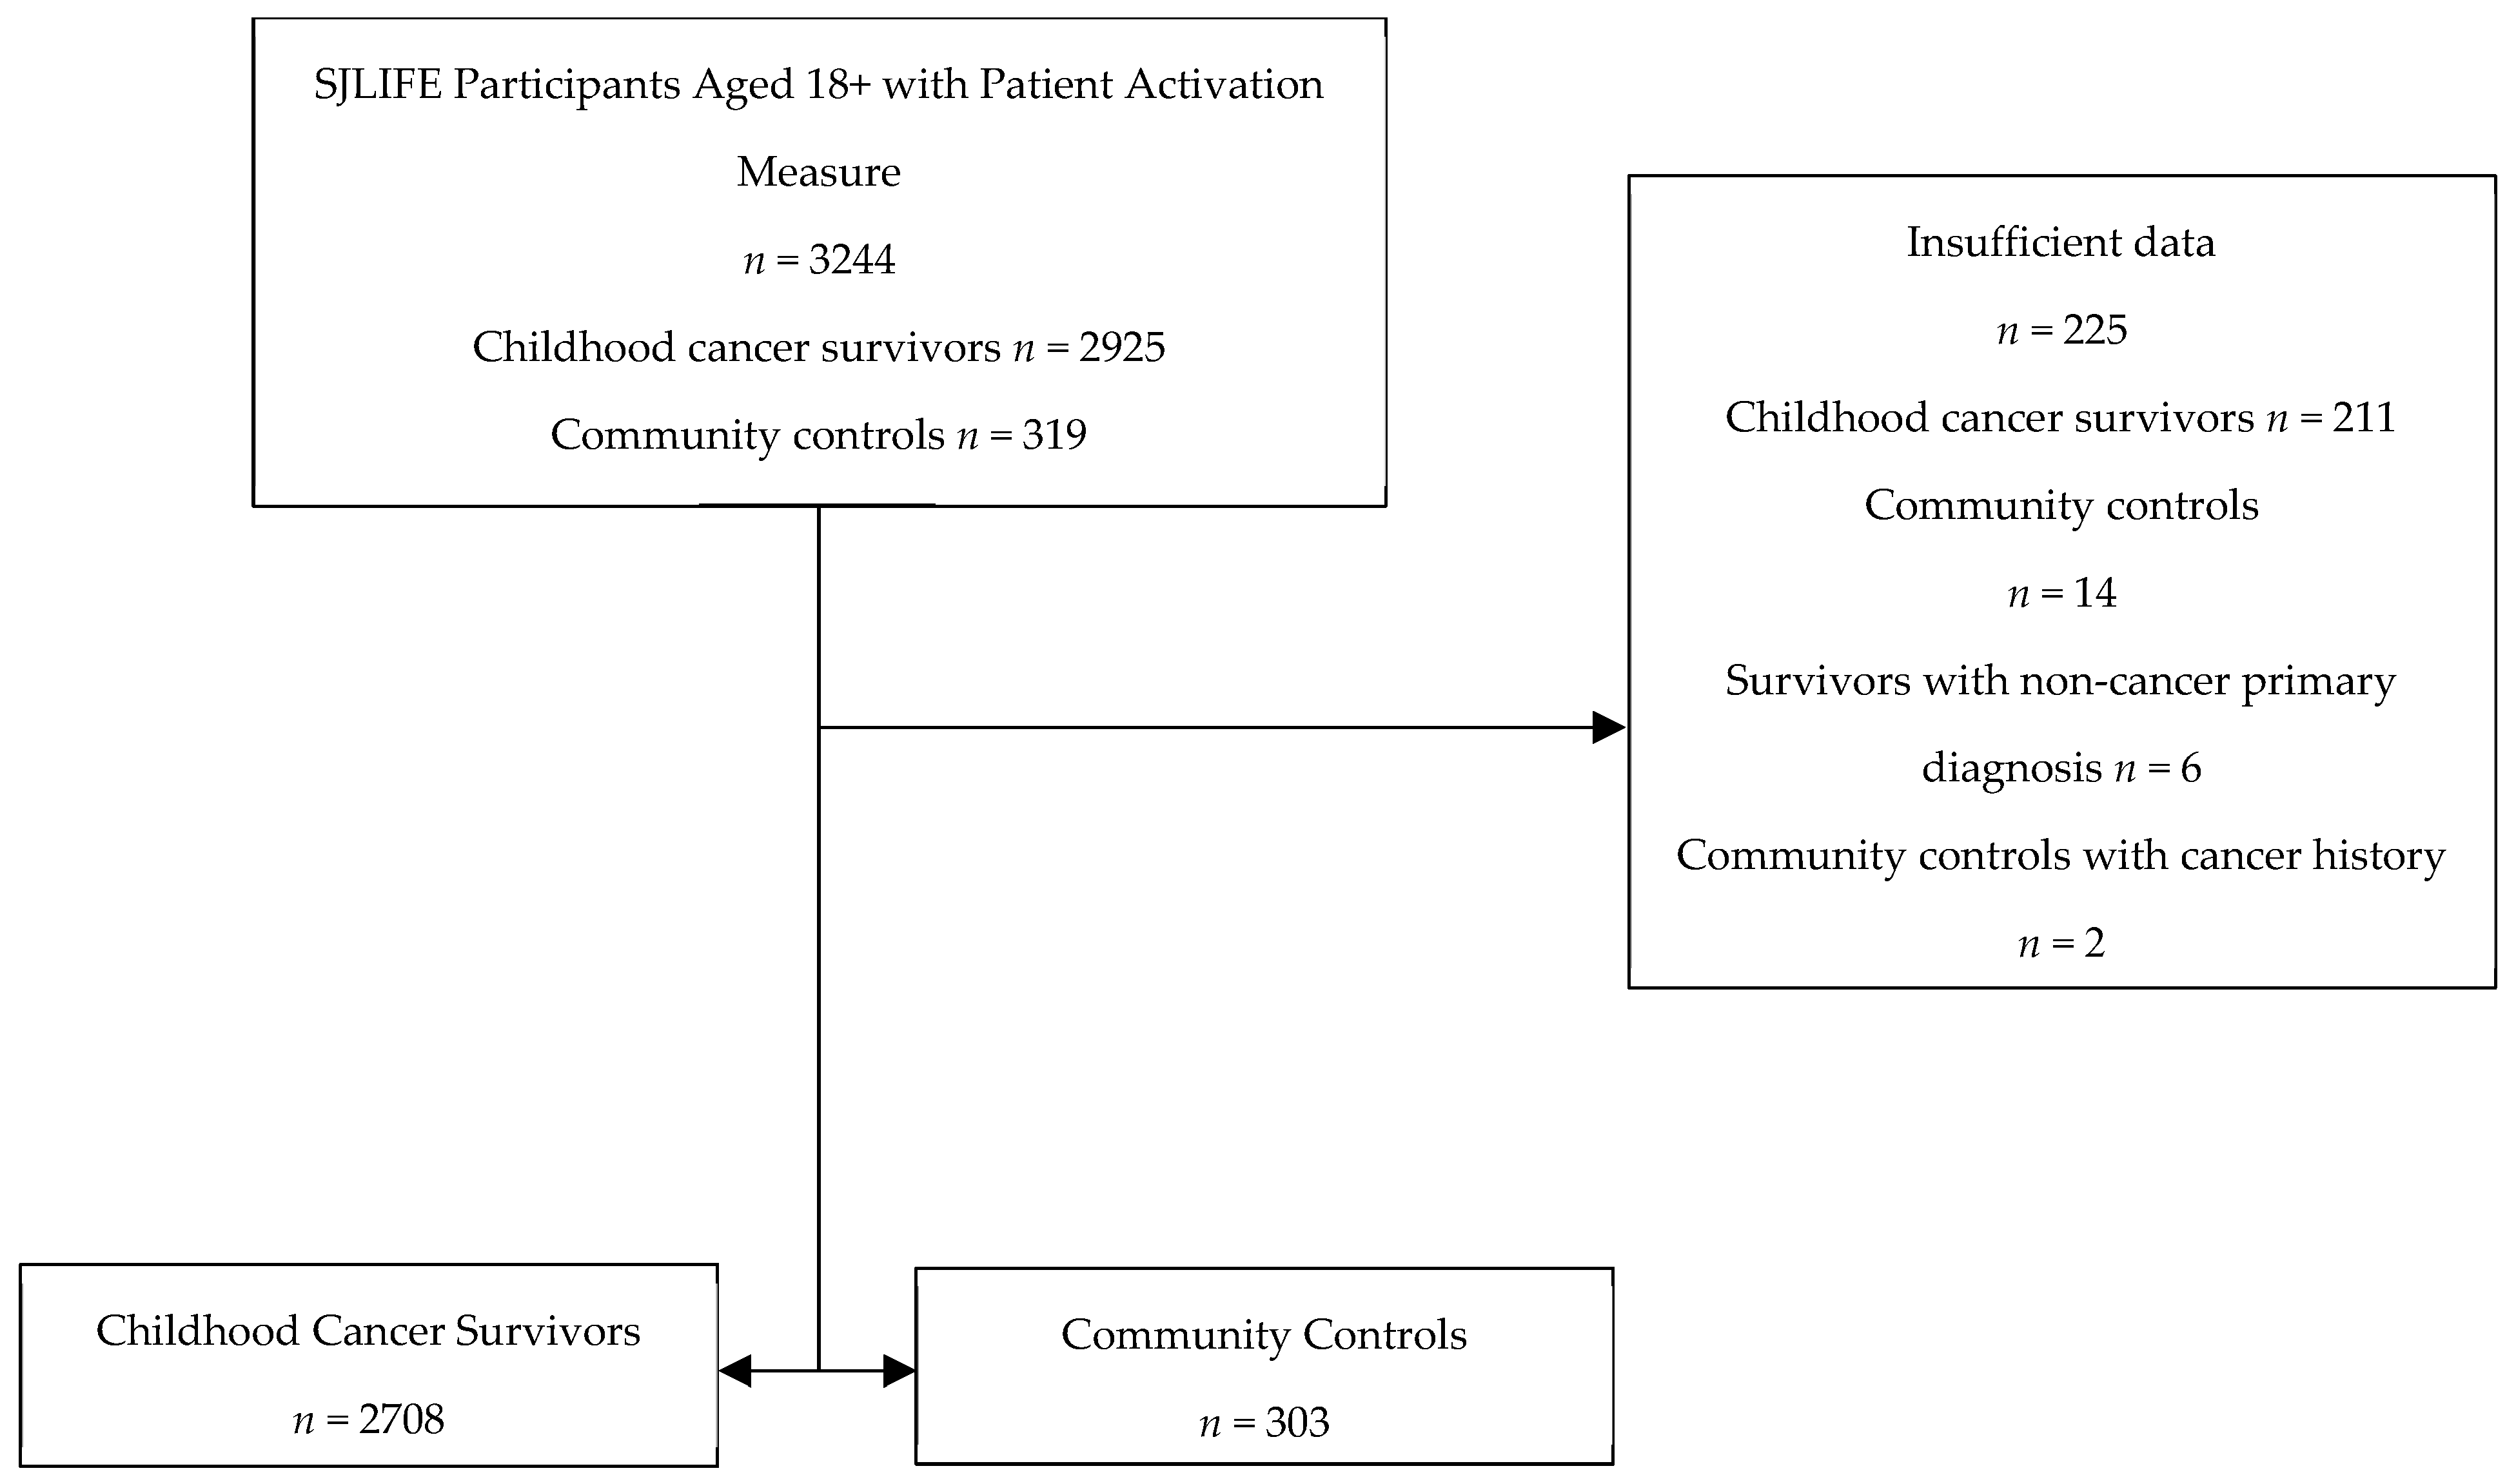
2.1. Participants
2.2. Measures
2.2.1. Patient Activation
2.2.2. Psychological Factors
2.2.3. Health Behavior
2.2.4. Sociodemographic and Clinical Covariates
2.2.5. Cognitive Function Assessments
2.3. Analyses
3. Results
4. Discussion
5. Conclusions
Supplementary Materials
Author Contributions
Funding
Institutional Review Board Statement
Informed Consent Statement
Data Availability Statement
Conflicts of Interest
References
- Schmiegelow, K.; Forestier, E.; Hellebostad, M.; Heyman, M.; Kristinsson, J.; Söderhäll, S.; Taskinen, M. Long-term results of NOPHO ALL-92 and ALL-2000 studies of childhood acute lymphoblastic leukemia. Leukemia 2010, 24, 345–354. [Google Scholar] [CrossRef] [PubMed]
- Pritchard-Jones, K.; Pieters, R.; Reaman, G.H.; Hjorth, L.; Downie, P.; Calaminus, G.; Naafs-Wilstra, M.C.; Steliarova-Foucher, E. Sustaining innovation and improvement in the treatment of childhood cancer: Lessons from high-income countries. Lancet Oncol. 2013, 14, e95–e103. [Google Scholar] [CrossRef] [PubMed]
- Oeffinger, K.C.; Mertens, A.C.; Sklar, C.A.; Kawashima, T.; Hudson, M.M.; Meadows, A.T.; Friedman, D.L.; Marina, N.; Hobbie, W.; Kadan-Lottick, N.S. Chronic health conditions in adult survivors of childhood cancer. N. Engl. J. Med. 2006, 355, 1572–1582. [Google Scholar] [CrossRef] [PubMed]
- Landier, W.; Armenian, S.; Bhatia, S. Late effects of childhood cancer and its treatment. Pediatr. Clin. 2015, 62, 275–300. [Google Scholar] [CrossRef] [PubMed]
- Fidler, M.M.; Reulen, R.C.; Winter, D.L.; Kelly, J.; Jenkinson, H.C.; Skinner, R.; Frobisher, C.; Hawkins, M.M. Long term cause specific mortality among 34 489 five year survivors of childhood cancer in Great Britain: Population based cohort study. BMJ 2016, 354, 4351. [Google Scholar] [CrossRef]
- Mertens, A.C.; Yasui, Y.; Neglia, J.P.; Potter, J.D.; Nesbit Jr, M.E.; Ruccione, K.; Smithson, W.A.; Robison, L.L. Late mortality experience in five-year survivors of childhood and adolescent cancer: The Childhood Cancer Survivor Study. J. Clin. Oncol. 2001, 19, 3163–3172. [Google Scholar] [CrossRef]
- Brinkman, T.M.; Li, C.; Vannatta, K.; Marchak, J.G.; Lai, J.S.; Prasad, P.K.; Kimberg, C.; Vuotto, S.; Di, C.; Srivastava, D.; et al. Behavioral, Social, and Emotional Symptom Comorbidities and Profiles in Adolescent Survivors of Childhood Cancer: A Report From the Childhood Cancer Survivor Study. J. Clin. Oncol. 2016, 34, 3417–3425. [Google Scholar] [CrossRef]
- Brinkman, T.M.; Zhu, L.; Zeltzer, L.; Recklitis, C.; Kimberg, C.; Zhang, N.; Muriel, A.; Stovall, M.; Srivastava, D.; Robison, L. Longitudinal patterns of psychological distress in adult survivors of childhood cancer. Br. J. Cancer 2013, 109, 1373–1381. [Google Scholar] [CrossRef]
- Fisher, R.S.; Rausch, J.R.; Ferrante, A.C.; Prussien, K.V.; Olshefski, R.S.; Vannatta, K.A.; Compas, B.E.; Gerhardt, C.A. Trajectories of health behaviors across early childhood cancer survivorship. Psychooncology 2019, 28, 68–75. [Google Scholar] [CrossRef]
- Ford, J.S.; Barnett, M.; Werk, R. Health Behaviors of Childhood Cancer Survivors. Children 2014, 1, 355–373. [Google Scholar] [CrossRef]
- Tonorezos, E.S.; Ford, J.S.; Wang, L.; Ness, K.K.; Yasui, Y.; Leisenring, W.; Sklar, C.A.; Robison, L.L.; Oeffinger, K.C.; Nathan, P.C. Impact of exercise on psychological burden in adult survivors of childhood cancer: A report from the Childhood Cancer Survivor Study. Cancer 2019, 125, 3059–3067. [Google Scholar] [CrossRef]
- Brinkman, T.M.; Recklitis, C.J.; Michel, G.; Grootenhuis, M.A.; Klosky, J.L. Psychological symptoms, social outcomes, socioeconomic attainment, and health behaviors among survivors of childhood cancer: Current state of the literature. J. Clin. Oncol. 2018, 36, 2190. [Google Scholar] [CrossRef]
- Ness, K.K.; Leisenring, W.M.; Huang, S.; Hudson, M.M.; Gurney, J.G.; Whelan, K.; Hobbie, W.L.; Armstrong, G.T.; Robison, L.L.; Oeffinger, K.C. Predictors of inactive lifestyle among adult survivors of childhood cancer: A report from the Childhood Cancer Survivor Study. Cancer 2009, 115, 1984–1994. [Google Scholar] [CrossRef] [PubMed]
- Zhang, F.F.; Ojha, R.P.; Krull, K.R.; Gibson, T.M.; Lu, L.; Lanctot, J.; Chemaitilly, W.; Robison, L.L.; Hudson, M.M. Adult survivors of childhood cancer have poor adherence to dietary guidelines. J. Nutr. 2016, 146, 2497–2505. [Google Scholar] [CrossRef] [PubMed]
- Hibbard, J.H.; Stockard, J.; Mahoney, E.R.; Tusler, M. Development of the Patient Activation Measure (PAM): Conceptualizing and Measuring Activation in Patients and Consumers. Health Serv. Res. 2004, 39, 1005–1026. [Google Scholar] [CrossRef] [PubMed]
- Hibbard, J.H.; Greene, J. What the evidence shows about patient activation: Better health outcomes and care experiences; fewer data on costs. Health Aff. 2013, 32, 207–214. [Google Scholar] [CrossRef] [PubMed]
- Mosen, D.M.; Schmittdiel, J.; Hibbard, J.; Sobel, D.; Remmers, C.; Bellows, J. Is patient activation associated with outcomes of care for adults with chronic conditions? J. Ambul. Care Manag. 2007, 30, 21–29. [Google Scholar] [CrossRef]
- Hibbard, J.H.; Mahoney, E.R.; Stockard, J.; Tusler, M. Development and Testing of a Short Form of the Patient Activation Measure. Health Serv. Res. 2005, 40, 1918–1930. [Google Scholar] [CrossRef]
- Hibbard, J.H.; Mahoney, E.R.; Stock, R.; Tusler, M. Do increases in patient activation result in improved self-management behaviors? Health Serv. Res. 2007, 42, 1443–1463. [Google Scholar] [CrossRef]
- Rokitka, D.A.; Curtin, C.; Heffler, J.E.; Zevon, M.A.; Attwood, K.; Mahoney, M.C. Patterns of Loss to Follow-Up Care Among Childhood Cancer Survivors. J. Adolesc. Young Adult Oncol. 2017, 6, 67–73. [Google Scholar] [CrossRef]
- Halfon, N.; Hochstein, M. Life course health development: An integrated framework for developing health, policy, and research. Milbank Q. 2002, 80, 433–479. [Google Scholar] [CrossRef] [PubMed]
- Docherty, S.L.; Kayle, M.; Maslow, G.R.; Santacroce, S.J. The Adolescent and Young Adult with Cancer: A Developmental Life Course Perspective. Semin. Oncol. Nurs. 2015, 31, 186–196. [Google Scholar] [CrossRef] [PubMed]
- Hudson, M.M.; Ness, K.K.; Nolan, V.G.; Armstrong, G.T.; Green, D.M.; Morris, E.B.; Spunt, S.L.; Metzger, M.L.; Krull, K.R.; Klosky, J.L. Prospective medical assessment of adults surviving childhood cancer: Study design, cohort characteristics, and feasibility of the St. Jude Lifetime Cohort study. Pediatr. Blood Cancer 2011, 56, 825–836. [Google Scholar] [CrossRef] [PubMed]
- Howell, C.R.; Bjornard, K.L.; Ness, K.K.; Alberts, N.; Armstrong, G.T.; Bhakta, N.; Brinkman, T.; Caron, E.; Chemaitilly, W.; Green, D.M.; et al. Cohort Profile: The St. Jude Lifetime Cohort Study (SJLIFE) for paediatric cancer survivors. Int. J. Epidemiol. 2020, 50, 39–49. [Google Scholar] [CrossRef] [PubMed]
- Krebs-Smith, S.M.; Pannucci, T.E.; Subar, A.F.; Kirkpatrick, S.I.; Lerman, J.L.; Tooze, J.A.; Wilson, M.M.; Reedy, J. Update of the healthy eating index: HEI-2015. J. Acad. Nutr. Diet. 2018, 118, 1591–1602. [Google Scholar] [CrossRef]
- Insignia Health. Patient Activation Measure (PAM) License Package; Insignia Health: Portland, OR, USA, 2007. [Google Scholar]
- Yu, L.; Buysse, D.J.; Germain, A.; Moul, D.E.; Stover, A.; Dodds, N.E.; Johnston, K.L.; Pilkonis, P.A. Development of short forms from the PROMIS™ sleep disturbance and sleep-related impairment item banks. Behav. Sleep Med. 2012, 10, 6–24. [Google Scholar] [CrossRef]
- Derogatis, L.R.; Melisaratos, N. The Brief Symptom Inventory: An introductory report. Psychol. Med. 1983, 13, 595–605. [Google Scholar] [CrossRef]
- Ware, J.E., Jr.; Sherbourne, C.D. The MOS 36-ltem Short-Form Health Survey (SF-36): I. Conceptual Framework and Item Selection. Med. Care 1992, 30, 473–483. [Google Scholar] [CrossRef]
- Ware, M.E.; Delaney, A.; Krull, K.R.; Brinkman, T.M.; Armstrong, G.T.; Wilson, C.L.; Mulrooney, D.A.; Wang, Z.; Lanctot, J.Q.; Krull, M.R.; et al. Cancer-Related Worry as a Predictor of 5-yr Physical Activity Level in Childhood Cancer Survivors. Med. Sci. Sports Exerc. 2023, 55, 1584–1591. [Google Scholar] [CrossRef]
- U.S. Department of Health and Human Services. Physical Activity Guidelines Advisory Committee Scientific Report. 2018. Available online: https://health.gov/sites/default/files/2019-09/PAG_Advisory_Committee_Report.pdf (accessed on 18 September 2024).
- Singh, G.K. Area Deprivation and Widening Inequalities in US Mortality, 1969–1998. Am. J. Public Health 2003, 93, 1137–1143. [Google Scholar] [CrossRef]
- Hudson, M.M.; Ehrhardt, M.J.; Bhakta, N.; Baassiri, M.; Eissa, H.; Chemaitilly, W.; Green, D.M.; Mulrooney, D.A.; Armstrong, G.T.; Brinkman, T.M.; et al. Approach for Classification and Severity Grading of Long-term and Late-Onset Health Events among Childhood Cancer Survivors in the St. Jude Lifetime Cohort. Cancer Epidemiol. Biomark. Prev. 2017, 26, 666–674. [Google Scholar] [CrossRef] [PubMed]
- Hahn, E.A.; DeWalt, D.A.; Bode, R.K.; Garcia, S.F.; DeVellis, R.F.; Correia, H.; Cella, D. New English and Spanish social health measures will facilitate evaluating health determinants. Health Psychol. 2014, 33, 490–499. [Google Scholar] [CrossRef] [PubMed]
- Wechsler, D. Wechsler Abbreviated Scale of Intelligence; Psychological Corporation: San Antonio, TX, USA, 1999. [Google Scholar]
- Strauss, E.; Sherman, E.M.S.; Spreen, O. A Compendium of Neuropsychological Tests: Administration, Norms, and Commentary, 3rd ed.; Oxford University Press: New York, NY, USA, 2006; p. xvii, 1216. [Google Scholar]
- Conners, K.C.; Staff, M. Conners’ Continuous Performance Test II. CPT II.; Multi-Health Systems: North Tonawanda, NY, USA, 2004. [Google Scholar]
- Drozdick, L.W.; Raiford, S.E.; Wahlstrom, D.; Weiss, L.G. The Wechsler Adult Intelligence Scale—Fourth Edition and the Wechsler Memory Scale—Fourth Edition. In Contemporary Intellectual Assessment: Theories, Tests, and Issues, 4th ed.; The Guilford Press: New York, NY, USA, 2018; pp. 486–511. [Google Scholar]
- Delis, D.C.; Kramer, J.H.; Kaplan, E.; Ober, B.A. California Verbal Learning Test: Assessment; Psychological Corporation: San Antonio, TX, USA, 2000. [Google Scholar]
- Krull, K.R.; Brinkman, T.M.; Li, C.; Armstrong, G.T.; Ness, K.K.; Srivastava, D.K.; Gurney, J.G.; Kimberg, C.; Krasin, M.J.; Pui, C.-H. Neurocognitive outcomes decades after treatment for childhood acute lymphoblastic leukemia: A report from the St Jude lifetime cohort study. J. Clin. Oncol. 2013, 31, 4407. [Google Scholar] [CrossRef] [PubMed]
- Brinkman, T.M.; Ness, K.K.; Li, Z.; Huang, I.-C.; Krull, K.R.; Gajjar, A.; Merchant, T.E.; Klosky, J.L.; Partin, R.E.; Olsson, I.T. Attainment of functional and social independence in adult survivors of pediatric CNS tumors: A report from the St Jude Lifetime Cohort Study. J. Clin. Oncol. 2018, 36, 2762. [Google Scholar] [CrossRef] [PubMed]
- Brinkman, T.M.; Krasin, M.J.; Liu, W.; Armstrong, G.T.; Ojha, R.P.; Sadighi, Z.S.; Gupta, P.; Kimberg, C.; Srivastava, D.; Merchant, T.E. Long-term neurocognitive functioning and social attainment in adult survivors of pediatric CNS tumors: Results from the St Jude Lifetime Cohort Study. J. Clin. Oncol. 2016, 34, 1358. [Google Scholar] [CrossRef]
- Ehrhardt, M.J.; Mulrooney, D.A.; Li, C.; Baassiri, M.J.; Bjornard, K.; Sandlund, J.T.; Brinkman, T.M.; Huang, I.C.; Srivastava, D.K.; Ness, K.K.; et al. Neurocognitive, psychosocial, and quality-of-life outcomes in adult survivors of childhood non-Hodgkin lymphoma. Cancer 2018, 124, 417–425. [Google Scholar] [CrossRef]
- Hibbard, J.H.; Cunningham, P.J. How Engaged Are Consumers in Their Health and Health Care, and Why Does It Matter? Center for Studying Health System Change: Washington, DC, USA, 2008; Volume 8. [Google Scholar]
- McNeely, E.L.; Sachdev, R.; Rahman, R.; Zhang, B.; Skolasky, R.L. Associations of depression and sociodemographic characteristics with patient activation among those presenting for spine surgery. J. Orthop. 2021, 26, 8–13. [Google Scholar] [CrossRef]
- Alexander, J.A.; Hearld, L.R.; Mittler, J.N.; Harvey, J. Patient-physician role relationships and patient activation among individuals with chronic illness. Health Serv. Res. 2012, 47, 1201–1223. [Google Scholar] [CrossRef]
- Greene, J.; Hibbard, J.H.; Tusler, M. How Much Do Health Literacy and Patient Activation Contribute to Older Adults’ Ability to Manage Their Health? AARP Public Policy Institute: Washington, DC, USA, 2005. [Google Scholar]
- Skolasky, R.L.; Green, A.F.; Scharfstein, D.; Boult, C.; Reider, L.; Wegener, S.T. Psychometric properties of the patient activation measure among multimorbid older adults. Health Serv. Res. 2011, 46, 457–478. [Google Scholar] [CrossRef]
- McCabe, P.J.; Stuart-Mullen, L.G.; McLeod, C.J.; O Byrne, T.; Schmidt, M.M.; Branda, M.E.; Griffin, J.M. Patient activation for self-management is associated with health status in patients with atrial fibrillation. Patient Prefer. Adherence 2018, 12, 1907–1916. [Google Scholar] [CrossRef]
- Bolen, S.D.; Chandar, A.; Falck-Ytter, C.; Tyler, C.; Perzynski, A.T.; Gertz, A.M.; Sage, P.; Lewis, S.; Cobabe, M.; Ye, Y.; et al. Effectiveness and safety of patient activation interventions for adults with type 2 diabetes: Systematic review, meta-analysis, and meta-regression. J. Gen. Intern. Med. 2014, 29, 1166–1176. [Google Scholar] [CrossRef] [PubMed]
- Safford, M.M.; Andreae, S.; Cherrington, A.L.; Martin, M.Y.; Halanych, J.; Lewis, M.; Patel, A.; Johnson, E.; Clark, D.; Gamboa, C.; et al. Peer Coaches to Improve Diabetes Outcomes in Rural Alabama: A Cluster Randomized Trial. Ann. Fam. Med. 2015, 13 (Suppl. S1), S18–S26. [Google Scholar] [CrossRef] [PubMed]
- Wolever, R.Q.; Dreusicke, M.; Fikkan, J.; Hawkins, T.V.; Yeung, S.; Wakefield, J.; Duda, L.; Flowers, P.; Cook, C.; Skinner, E. Integrative Health Coaching for Patients With Type 2 Diabetes. Diabetes Educ. 2010, 36, 629–639. [Google Scholar] [CrossRef]
- Odnoletkova, I.; Goderis, G.; Nobels, F.; Fieuws, S.; Aertgeerts, B.; Annemans, L.; Ramaekers, D. Optimizing diabetes control in people with Type 2 diabetes through nurse-led telecoaching. Diabet. Med. 2016, 33, 777–785. [Google Scholar] [CrossRef] [PubMed]
- Melissant, H.C.; Verdonck-de Leeuw, I.M.; Lissenberg-Witte, B.I.; Konings, I.R.; Cuijpers, P.; Van Uden-Kraan, C.F. ‘Oncokompas’, a web-based self-management application to support patient activation and optimal supportive care: A feasibility study among breast cancer survivors. Acta Oncol. 2018, 57, 924–934. [Google Scholar] [CrossRef]
- Knoerl, R.; Lee, D.; Yang, J.; Bridges, C.; Kanzawa-Lee, G.; Lita Smith, G.; Lavoie Smith, E.M. Examining the impact of a web-based intervention to promote patient activation in chemotherapy-induced peripheral neuropathy assessment and management. J. Cancer Educ. 2018, 33, 1027–1035. [Google Scholar] [CrossRef]
- Meng, K.; Musekamp, G.; Schuler, M.; Seekatz, B.; Glatz, J.; Karger, G.; Kiwus, U.; Knoglinger, E.; Schubmann, R.; Westphal, R.; et al. The impact of a self-management patient education program for patients with chronic heart failure undergoing inpatient cardiac rehabilitation. Patient Educ. Couns. 2016, 99, 1190–1197. [Google Scholar] [CrossRef]
- Tousman, S.A.; Zeitz, H.; Bond, D.; Stewart, D.; Rackow, R.; Greer, R.; Hatfield, S.; Layman, K.; Ganjwala, P. A Randomized Controlled Behavioral Trial of a New Adult Asthma Self-management Program. J. Asthma Allergy Educ. 2011, 2, 91–96. [Google Scholar] [CrossRef]
- McGowan, P. The Efficacy of Diabetes Patient Education and Self-Management Education in Type 2 Diabetes. Can. J. Diabetes 2011, 35, 46–53. [Google Scholar] [CrossRef]
- Cortez, D.N.; Macedo, M.M.L.; Souza, D.A.S.; dos Santos, J.C.; Afonso, G.S.; Reis, I.A.; Torres, H.d.C. Evaluating the effectiveness of an empowerment program for self-care in type 2 diabetes: A cluster randomized trial. BMC Public. Health 2017, 17, 41. [Google Scholar] [CrossRef]
- Jonsdottir, H.; Amundadottir, O.R.; Gudmundsson, G.; Halldorsdottir, B.S.; Hrafnkelsson, B.; Ingadottir, T.S.; Jonsdottir, R.; Jonsson, J.S.; Sigurjonsdottir, E.D.; Stefansdottir, I.K. Effectiveness of a partnership-based self-management programme for patients with mild and moderate chronic obstructive pulmonary disease: A pragmatic randomized controlled trial. J. Adv. Nurs. 2015, 71, 2634–2649. [Google Scholar] [CrossRef] [PubMed]
- Lynch, E.B.; Liebman, R.; Ventrelle, J.; Avery, E.F.; Richardson, D. A Self-Management Intervention for African Americans With Comorbid Diabetes and Hypertension: A Pilot Randomized Controlled Trial. Prev. Chronic Dis. 2014, 11, E90. [Google Scholar] [CrossRef] [PubMed]
- Escoffery, C.; Gilleland Marchak, J.; Haardörfer, R.; Meacham, L.; Williamson Lewis, R.; Udelson, H.; Edwards, P.; Mertens, A.C. Scalability of cancer SurvivorLink™: A cluster randomized trial among pediatric cancer clinics. Contemp. Clin. Trials 2019, 85, 105819. [Google Scholar] [CrossRef] [PubMed]
- Henderson, T.O.; Bardwell, J.K.; Moskowitz, C.S.; McDonald, A.; Vukadinovich, C.; Lam, H.; Curry, M.; Oeffinger, K.C.; Ford, J.S.; Elkin, E.B.; et al. Implementing a mHealth intervention to increase colorectal cancer screening among high-risk cancer survivors treated with radiotherapy in the Childhood Cancer Survivor Study (CCSS). BMC Health Serv. Res. 2022, 22, 691. [Google Scholar] [CrossRef]
- Geller, A.C.; Coroiu, A.; Keske, R.R.; Haneuse, S.; Davine, J.A.; Emmons, K.M.; Daniel, C.L.; Gibson, T.M.; McDonald, A.J.; Robison, L.L. Advancing Survivors Knowledge (ASK Study) of Skin Cancer Surveillance After Childhood Cancer: A Randomized Controlled Trial in the Childhood Cancer Survivor Study. J. Clin. Oncol. 2023, 41, 2269–2280. [Google Scholar] [CrossRef]
- Deakin, T.A.; Cade, J.E.; Williams, R.; Greenwood, D.C. Structured patient education: The Diabetes X-PERT Programme makes a difference. Diabet. Med. 2006, 23, 944–954. [Google Scholar] [CrossRef]
- Döbler, A.; Herbeck Belnap, B.; Pollmann, H.; Farin, E.; Raspe, H.; Mittag, O. Telephone-delivered lifestyle support with action planning and motivational interviewing techniques to improve rehabilitation outcomes. Rehabil. Psychol. 2018, 63, 170–181. [Google Scholar] [CrossRef]
- Walker, E.A.; Shmukler, C.; Ullman, R.; Blanco, E.; Scollan-Koliopoulus, M.; Cohen, H.W. Results of a Successful Telephonic Intervention to Improve Diabetes Control in Urban Adults: A randomized trial. Diabetes Care 2011, 34, 2–7. [Google Scholar] [CrossRef]
- Glasgow, R.E.; Kurz, D.; King, D.; Dickman, J.M.; Faber, A.J.; Halterman, E.; Woolley, T.; Toobert, D.J.; Strycker, L.A.; Estabrooks, P.A.; et al. Twelve-month outcomes of an Internet-based diabetes self-management support program. Patient Educ. Couns. 2012, 87, 81–92. [Google Scholar] [CrossRef]

| Characteristic | Survivors (n = 2708) | Controls (n = 303) | p Value |
|---|---|---|---|
| No. (%) | No (%) | ||
| Sex | 0.0003 | ||
| Male | 1370 (50.6) | 126 (41.6) | |
| Female | 1338 (49.4) | 177 (58.4) | |
| Race and Ethnicity | <0.0001 | ||
| Non-Hispanic White | 2220 (82.0) | 243 (80.2) | |
| Non-Hispanic Black | 380 (14.0) | 20 (6.6) | |
| Others | 108 (4.0) | 40 (13.2) | |
| Primary Cancer Diagnosis | |||
| Leukemia | 867 (32.0) | -- | |
| Lymphoma | 464 (18.2) | -- | |
| Sarcoma | 358 (13.2) | -- | |
| CNS Tumor | 423 (15.6) | -- | |
| Embryonal | 337 (12.4) | -- | |
| Others | 229 (8.5) | -- | |
| Radiation | |||
| Yes | 1452 (53.6) | -- | |
| No | 1256 (46.4) | -- | |
| Chemotherapy | |||
| Yes | 2267 (83.7) | -- | |
| No | 441 (16.3) | -- | |
| Surgery | |||
| Yes | 2531 (83.7) | -- | |
| No | 177 (6.5) | -- | |
| CTCAE 1 Grade 3+ Conditions | |||
| Cardiovascular | <0.0001 | ||
| Yes | 232 (8.6) | 5 (1.7) | |
| No | 2476 (91.4) | 298 (98.3) | |
| Endocrine | <0.0001 | ||
| Yes | 1015 (37.5) | 75 (24.8) | |
| No | 1693 (62.5) | 228 (75.2) | |
| Pulmonary | 0.32 | ||
| Yes | 203 (7.5) | 18 (5.9) | |
| No | 2505 (92.5) | 285 (94.1) | |
| Musculoskeletal | 0.50 | ||
| Yes | 23 (0.8) | 1 (0.3) | |
| No | 2685 (99.2) | 302 (99.7) | |
| Neurological | 0.04 | ||
| Yes | 158 (5.8) | 9 (3.0) | |
| No | 2550 (94.2) | 294 (97.0) | |
| Auditory | <0.0001 | ||
| Yes | 346 (12.8) | 6 (2.0) | |
| No | 2362 (87.2) | 297 (98.0) | |
| Gastrointestinal | 0.17 | ||
| Yes | 38 (1.4) | 1 (0.3) | |
| No | 2670 (98.6) | 302 (99.7) | |
| Hematologic | 1.00 | ||
| Yes | 8 (0.3) | 0 (0.0) | |
| No | 2700 (99.7) | 303 (100.00) | |
| Immunologic | 1.00 | ||
| Yes | 24 (0.9) | 2 (0.7) | |
| No | 2684 (99.1) | 301 (99.3) | |
| Ocular | <0.0001 | ||
| Yes | 286 (10.6) | 6 (2.0) | |
| No | 2442 (89.4) | 297 (98.0) | |
| Renal | 0.07 | ||
| Yes | 31 (1.1) | 0 (0.0) | |
| No | 2677 (98.9) | 303 (100.0) | |
| Reproductive | <0.0001 | ||
| Yes | 270 (10.0) | 3 (1.0) | |
| No | 2438 (99.0) | 300 (99.0) | |
| Subsequent neoplasm | 0.16 | ||
| Yes | 24 (0.9) | 0.0 (0.0) | |
| No | 2684 (99.1) | 303 (100.0) | |
| Educational Attainment | <0.0001 | ||
| High school or less | 665 (26.0) | 38 (12.8) | |
| Some post-high school | 847 (33.1) | 86 (29.1) | |
| College degree or higher | 1047 (40.9) | 172 (58.1) | |
| Insurance Coverage | 0.43 | ||
| Insured | 2379 (88.5) | 272 (90.1) | |
| Uninsured | 308 (11.5) | 30 (9.9) | |
| ADI 2 Quartiles | <0.0001 | ||
| Quartile 1 | 631 (23.3) | 110 (36.3) | |
| Quartile 2 | 679 (25.1) | 84 (27.7) | |
| Quartile 3 | 707 (26.1) | 64 (21.1) | |
| Quartile 4 | 691 (25.5) | 45 (14.9) | |
| Patient Activation Level | <0.0001 | ||
| Level 1 3 | 304 (11.3) | 14 (4.7) | |
| Level 2 4 | 371 (13.8) | 29 (9.7) | |
| Level 3 5 | 800 (29.7) | 72 (24.1) | |
| Level 4 6 | 1220 (45.3) | 184 (61.5) | |
| Mean (SD) | Mean (SD) | ||
| Age at diagnosis (y) | 8.9 (5.8) | -- | -- |
| Age at evaluation | 33.8 (10.5) | 30.7 (9.8) | <0.0001 |
| Characteristic | Level 1 (n = 304) | Level 2 (n = 371) | Level 3 (n = 800) | Level 4 (n = 1220) | p Value |
|---|---|---|---|---|---|
| No. (%) | No (%) | No (%) | No. (%) | ||
| Sex | 0.33 | ||||
| Male | 150 (49.3) | 194 (52.3) | 421 (52.6) | 596 (48.9) | |
| Female | 154 (50.7) | 177 (47.7) | 379 (47.4) | 624 (51.1) | |
| Race and Ethnicity | |||||
| Non-Hispanic White | 250 (82.2) | 302 (81.4) | 664 (83.0) | 995 (81.6) | |
| Non-Hispanic Black | 44 (14.5) | 52 (14.0) | 104 (13.0) | 176 (14.4) | |
| Others | 10 (3.3) | 17 (4.6) | 32 (4.0) | 49 (4.0) | 0.95 |
| Primary Cancer Diagnosis | <0.0001 | ||||
| Leukemia | 80 (26.3) | 130 (35.0) | 260 (32.5) | 393 (32.2) | |
| Lymphoma | 59 (19.4) | 62 (16.7) | 140 (17.5) | 230 (18.9) | |
| Sarcoma | 34 (11.2) | 57 (15.4) | 107 (13.4) | 159 (13.0) | |
| CNS Tumor | 83 (27.3) | 55 (14.8) | 121 (15.1) | 161 (13.2) | |
| Embryonal | 34 (11.2) | 35 (9.4) | 105 (13.1) | 163 (13.4) | |
| Others | 14 (4.6) | 32 (8.6) | 67 (8.4) | 114 (9.3) | |
| Radiation | 0.01 | ||||
| Yes | 183 (60.2) | 211 (56.9) | 430 (53.8) | 620 (50.8) | |
| No | 121 (39.8) | 160 (43.1) | 370 (46.3) | 600 (49.2) | |
| Chemotherapy | 0.11 | ||||
| Yes | 247 (81.3) | 323 (87.1) | 658 (82.3) | 1029 (84.3) | |
| No | 57 (18.8) | 48 (12.9) | 142 (17.8) | 191 (15.7) | |
| Surgery | 0.23 | ||||
| Yes | 287 (94.4) | 354 (95.4) | 739 (92.4) | 1139 (93.4) | |
| No | 17 (5.6) | 17 (4.6) | 61 (7.6) | 81 (6.6) | |
| CTCAE 1 Grade 3+ Conditions | |||||
| Cardiovascular | 0.004 | ||||
| Yes | 24 (7.9) | 44 (11.9) | 81 (10.1) | 82 (6.7) | |
| No | 280 (92.1) | 327 (88.1) | 719 (89.9) | 1138 (93.3) | |
| Endocrine | 0.005 | ||||
| Yes | 130 (42.8) | 161 (43.4) | 290 (36.3) | 427 (35.0) | |
| No | 174 (57.2) | 210 (56.6) | 510 (63.8) | 793 (65.0) | |
| Pulmonary | 0.07 | ||||
| Yes | 33 (10.9) | 29 (7.8) | 60 (7.5) | 78 (6.4) | |
| No | 271 (89.1) | 342 (92.2) | 740 (92.5) | 1142 (93.6) | |
| Musculoskeletal | 0.90 | ||||
| Yes | 3 (1.0) | 3 (0.8) | 8 (1.0) | 9 (0.7) | |
| No | 301 (99.0) | 368 (99.2) | 792 (99.0) | 1211 (99.3) | |
| Neurological | <0.0001 | ||||
| Yes | 42 (13.8) | 17 (4.6) | 49 (6.1) | 47 (3.9) | |
| No | 262 (86.2) | 354 (95.4) | 751 (93.9) | 1173 (96.1) | |
| Auditory | <0.0001 | ||||
| Yes | 67 (22.0) | 49 (13.2) | 103 (12.9) | 126 (10.3) | |
| No | 237 (78.0) | 322 (86.8) | 697 (87.1) | 1094 (89.7) | |
| Gastrointestinal | 0.82 | ||||
| Yes | 5 (1.6) | 6 (1.6) | 9 (1.1) | 18 (1.5) | |
| No | 299 (98.4) | 365 (98.4) | 791 (98.9) | 1202 (98.5) | |
| Hematologic | 0.48 | ||||
| Yes | 1 (0.3) | 1 (0.3) | 4 (0.5) | 2 (0.2) | |
| No | 303 (99.7) | 370 (99.7) | 796 (99.5) | 1218 (99.8) | |
| Immunologic | 0.01 | ||||
| Yes | 3 (1.0) | 9 (2.4) | 6 (0.8) | 6 (0.5) | |
| No | 301 (99.0) | 362 (97.6) | 794 (99.3) | 1214 (99.5) | |
| Ocular | 0.28 | ||||
| Yes | 32 (10.5) | 41 (11.1) | 97 (12.1) | 115 (9.4) | |
| No | 272 (89.5) | 330 (88.9) | 703 (87.9) | 1105 (90.6) | |
| Renal | 0.70 | ||||
| Yes | 4 (1.3) | 6 (1.6) | 9 (1.1) | 12 (1.0) | |
| No | 300 (98.7) | 365 (98.4) | 791 (98.9) | 1208 (99.0) | |
| Reproductive | 0.83 | ||||
| Yes | 34 (11.2) | 35 (9.4) | 83 (10.4) | 118 (9.7) | |
| No | 270 (88.8) | 336 (90.6) | 717 (89.6) | 1102 (90.3) | |
| Subsequent neoplasm | 0.84 | ||||
| Yes | 3 (1.0) | 3 (0.8) | 5 (0.6) | 12 (1.0) | |
| No | 301 (99.0) | 368 (99.2) | 795 (99.4) | 1208 (99.0) | |
| Educational Attainment | <0.0001 | ||||
| High school or less | 116 (41.9) | 100 (28.3) | 223 (29.3) | 221 (19.1) | |
| Some post-high school | 94 (33.9) | 129 (36.5) | 273 (35.8) | 348 (30.0) | |
| College degree or higher | 67 (24.2) | 124 (35.1) | 266 (34.9) | 590 (50.9) | |
| Insurance Coverage | 0.01 | ||||
| Insured | 261 (87.0) | 321 (87.2) | 688 (86.3) | 1098 (90.8) | |
| Uninsured | 39 (13.0) | 47 (12.8) | 109 (13.7) | 111 (9.2) | |
| ADI 2 Quartiles | <0.0001 | ||||
| Quartile 1 | 51 (16.8) | 73 (19.7) | 171 (21.4) | 335 (27.5) | |
| Quartile 2 | 77 (25.3) | 95 (25.6) | 187 (23.4) | 318 (26.1) | |
| Quartile 3 | 81 (26.6) | 94 (25.3) | 235 (29.4) | 293 (24.0) | |
| Quartile 4 | 95 (31.3) | 109 (29.4) | 207 (25.9) | 274 (22.5) | |
| Mean (SD) | Mean (SD) | Mean (SD) | Mean (SD) | ||
| Age at diagnosis (y) | 8.7 (5.6) | 9.5 (5.9) | 8.8 (5.7) | 8.9 (5.7) | 0.17 |
| Age at evaluation | 33.6 (10.3) | 35.3 (11.3) | 33.7 (10.8) | 33.5 (10.1) | 0.04 |
| Domain | Level 1 | Level 2 | Level 3 | Level 4 | p Value |
|---|---|---|---|---|---|
| No. (%) | No (%) | No (%) | No. (%) | ||
| Intelligence | <0.0001 | ||||
| No impairment | 180 (65.5) | 282 (84.4) | 621 (83.9) | 996 (89.3) | |
| Mild impairment | 33 (12.0) | 24 (7.2) | 60 (8.1) | 65 (5.8) | |
| Moderate impairment | 16 (5.8) | 13 (3.9) | 29 (3.9) | 30 (2.7) | |
| Severe impairment | 46 (16.7) | 15 (4.5) | 30 (4.1) | 24 (2.2) | |
| Attention | |||||
| Focused Attention | <0.0001 | ||||
| No impairment | 198 (66.7) | 308 (84.6) | 685 (87.5) | 1078 (89.6) | |
| Mild impairment | 18 (6.06) | 14 (3.85) | 30 (3.8) | 49 (4.07) | |
| Moderate impairment | 14 (4.7) | 8 (2.2) | 19 (2.4) | 20 (1.7) | |
| Severe impairment | 67 (22.6) | 34 (9.3) | 49 (6.3) | 56 (4.7) | |
| Sustained Attention | <0.0001 | ||||
| No impairment | 199 (71.1) | 308 (85.8) | 643 (83.8) | 1040 (88.2) | |
| Mild impairment | 19 (6.8) | 18 (5.0) | 47 (6.1) | 56 (4.8) | |
| Moderate impairment | 18 (6.4) | 12 (3.4) | 21 (2.7) | 26 (2.2) | |
| Severe impairment | 44 (15.7) | 21 (5.9) | 56 (7.3) | 57 (4.8) | |
| Attention Span | <0.0001 | ||||
| No impairment | 198 (65.8) | 288 (78.7) | 642 (81.1) | 1005 (83.2) | |
| Mild impairment | 52 (17.3) | 54 (14.8) | 100 (12.6) | 148 (12.3) | |
| Moderate impairment | 24 (7.8) | 16 (4.4) | 41 (5.2) | 41 (3.4) | |
| Severe impairment | 278 (9.0) | 8 (2.2) | 9 (1.1) | 14 (1.2) | |
| Memory | |||||
| Short-term Free Recall | <0.0001 | ||||
| No impairment | 160 (53.7) | 259 (71.2) | 551 (70.0) | 956 (79.5) | |
| Mild impairment | 39 (13.1) | 38 (10.4) | 97 (12.3) | 113 (9.4) | |
| Moderate impairment | 26 (8.7) | 26 (7.1) | 60 (7.6) | 57 (4.7) | |
| Severe impairment | 73 (24.5) | 41 (11.3) | 79 (10.0) | 77 (6.4) | |
| Long-term Free Recall | <0.0001 | ||||
| No impairment | 145 (48.8) | 234 (64.3) | 497 (63.2) | 885 (73.6) | |
| Mild impairment | 35 (11.8) | 53 (14.6) | 126 (16.0) | 159 (13.2) | |
| Moderate impairment | 33 (11.1) | 35 (9.6) | 87 (11.1) | 74 (6.2) | |
| Severe impairment | 84 (28.3) | 42 (11.5) | 76 (9.7) | 85 (7.1) | |
| Executive Function | |||||
| Working Memory | <0.0001 | ||||
| No impairment | 198 (65.8) | 288 (78.7) | 642 (81.1) | 1005 (83.2) | |
| Mild impairment | 52 (17.3) | 54 (14.8) | 100 (12.6) | 148 (12.3) | |
| Moderate impairment | 24 (8.0) | 16 (4.4) | 41 (5.2) | 41 (3.4) | |
| Severe impairment | 27 (9.0) | 8 (2.2) | 9 (1.1) | 14 (1.2) | |
| Cognitive Initiation | |||||
| No impairment | 156 (52.2) | 252 (68.9) | 513 (64.9) | 890 (73.7) | |
| Mild impairment | 62 (20.7) | 74 (20.2) | 157 (19.9) | 219 (18.1) | |
| Moderate impairment | 16 (5.4) | 12 (3.3) | 42 (5.3) | 38 (3.2) | |
| Severe impairment | 65 (21.7) | 28 (7.7) | 79 (10.0) | 61 (5.1) | |
| Cognitive Flexibility | |||||
| No impairment | 157 (53.4) | 268 (73.6) | 554 (70.8) | 935 (77.7) | |
| Mild impairment | 15 (5.1) | 18 (5.0) | 45 (5.8) | 79 (6.6) | |
| Moderate impairment | 19 (6.4) | 18 (4.9) | 46 (5.9) | 50 (4.2) | |
| Severe impairment | 105 (35.5) | 60 (16.5) | 138 (17.6) | 139 (11.6) | |
| Visuospatial Organization | |||||
| Planning/Organization | <0.0001 | ||||
| No impairment | 97 (36.7) | 161 (51.1) | 353 (49.9) | 564 (53.0) | |
| Mild impairment | 24 (9.1) | 29 (9.2) | 75 (10.6) | 104 (9.8) | |
| Moderate impairment | 20 (7.6) | 19 (6.0) | 64 (9.0) | 95 (8.9) | |
| Severe impairment | 123 (46.6) | 106 (33.7) | 216 (30.5) | 302 (28.4) |
| Health Behavior | Level 1 | Level 2 | Level 3 | Level 4 | p Value |
|---|---|---|---|---|---|
| No. (%) | No (%) | No (%) | No. (%) | ||
| Meeting CDC Physical Activity Guidelines 1 | <0.0001 | ||||
| Yes | 129 (43.7) | 182 (49.6) | 465 (58.8) | 813 (67.6) | |
| No | 166 (56.3) | 185 (50.4) | 326 (41.2) | 389 (32.4) | |
| Smoking 2 | 0.004 | ||||
| Never | 212 (71.9) | 253 (68.8) | 554 (70.1) | 915 (76.0) | |
| Current | 53 (18.0) | 64 (17.4) | 142 (18.0) | 147 (12.2) | |
| Former | 30 (10.2) | 51 (13.9) | 94 (11.9) | 142 (11.8) | |
| Risky drinking 3 | 0.0002 | ||||
| Yes | 67 (23.2) | 117 (32.3) | 272 (35.0) | 433 (36.6) | |
| No | 222 (76.8) | 245 (67.7) | 505 (65.0) | 749 (63.4) | |
| Sleep disturbance 4 | 0.42 | ||||
| None to slight | 122 (40.5) | 128 (34.8) | 290 (36.6) | 476 (39.4) | |
| Mild | 151 (50.2) | 198 (53.8) | 432 (54.5) | 614 (50.8) | |
| Moderate or Severe | 28 (9.3) | 42 (11.4) | 70 (8.8) | 118 (9.8) | |
| Healthy Eating Index score 5 | <0.0001 | ||||
| <51 (poor diet) | 93 (30.6) | 102 (27.5) | 198 (24.8) | 213 (17.5) | |
| 50–80 (needs improvement) | 208 (68.4) | 263 (70.9) | 590 (73.8) | 979 (80.2) | |
| >80 (good) | 3 (1.0) | 6 (1.6) | 12 (1.5) | 28 (2.3) |
| Psychological Factors | Level 1 | Level 2 | Level 3 | Level 4 | p Value |
|---|---|---|---|---|---|
| No. (%) | No (%) | No (%) | No. (%) | ||
| Depression symptoms 1 | <0.0001 | ||||
| Yes | 85 (28.2) | 59 (16.0) | 68 (8.5) | 94 (7.7) | |
| No | 216 (71.8) | 310 (84.0) | 728 (91.5) | 1122 (92.3) | |
| Anxiety symptoms 2 | <0.0001 | ||||
| Yes | 71 (23.6) | 43 (11.7) | 67 (8.4) | 83 (6.8) | |
| No | 230 (76.4) | 326 (88.3) | 730 (91.6) | 1132 (93.2) | |
| Somatization symptoms 3 | <0.0001 | ||||
| Yes | 88 (29.3) | 56 (15.2) | 83 (10.4) | 103 (8.5) | |
| No | 212 (70.7) | 313 (84.8) | 713 (89.6) | 1112 (91.5) | |
| Cancer-Related Worry 4 | |||||
| General fear | <0.0001 | ||||
| Yes | 126 (41.9) | 142 (38.5) | 263 (33.0) | 349 (28.7) | |
| No | 175 (58.1) | 227 (61.5) | 534 (67.0) | 868 (71.3) | |
| Body-focused | <0.0001 | ||||
| Yes | 125 (41.5) | 105 (28.4) | 138 (17.3) | 189 (15.5) | |
| No | 176 (58.5) | 265 (71.6) | 659 (82.7) | 1028 (84.5) | |
| Health-related quality of life 5 | |||||
| Poor physical-health-related quality of life | <0.0001 | ||||
| Yes | 113 (40.2) | 79 (22.1) | 119 (15.5) | 114 (9.7) | |
| No | 168 (59.8) | 278 (77.9) | 648 (84.5) | 1058 (90.3) | |
| Poor mental-health-related quality of life | <0.0001 | ||||
| Yes | 113 (40.4) | 102 (28.7) | 145 (18.9) | 173 (14.8) | |
| No | 167 (59.6) | 253 (71.3) | 622 (81.1) | 999 (85.2) |
| Independent Variables | Odds Ratio (OR) | 95% CI |
|---|---|---|
| Patient Activation Level 2 vs. 1 3 vs. 1 4 vs. 1 | 1.14 1.53 2.07 | 0.80–1.62 1.13–2.09 1.53–2.80 |
| Age at assessment | 0.98 | 0.97–0.99 |
| Age at diagnosis | 0.99 | 0.97–1.01 |
| Gender Male vs. Female | 1.37 | 1.15–1.63 |
| Diagnosis Group Lymphoma vs. Leukemia Sarcoma vs. Leukemia CNS Tumor vs. Leukemia Embryonal Tumor vs. Leukemia Other vs. Leukemia | 0.90 0.75 0.69 0.79 0.86 | 0.68–1.18 0.56–1.00 0.51–0.92 0.58–1.06 0.61–1.22 |
| Race NH Black vs. NH White Other vs. NH White | 0.90 0.90 | 0.69–1.18 0.58–1.39 |
| Educational Attainment Some post-high school vs. high school or less College graduate vs. high school or less | 1.18 1.29 | 0.93–1.50 1.01–1.65 |
| Intelligence Mild vs. no impairment Moderate vs. no impairment Severe vs. no impairment | 0.91 0.61 0.59 | 0.64–1.28 0.38–1.00 0.37–0.95 |
| Auditory condition grade 3+ at assessment Yes vs. No | 0.97 | 0.74–1.26 |
| Cardiovascular condition grade 3+ at assessment Yes vs. No | 0.80 | 0.59–1.09 |
| Endocrine condition grade 3+ at assessment Yes vs. No | 0.78 | 0.65–0.93 |
| Hematological condition grade 3+ at assessment Yes vs. No | 0.32 | 0.06–1.69 |
| Neurological condition grade 3+ at assessment Yes vs. No | 0.52 | 0.35–0.76 |
| Pulmonary condition grade 3+ at assessment Yes vs. No | 0.66 | 0.47–0.93 |
| Renal condition grade 3+ at assessment Yes vs. No | 0.70 | 0.31–1.61 |
| Psychological Predictor | Number (%) of Total Sample | 95% CI |
|---|---|---|
| Depression Symptoms 2 | 2682 (99.04%) | 2.37 (1.87–2.99) |
| Anxiety Symptoms 3 | 2682 (99.04%) | 2.21 (1.73–2.83) |
| Somatization Symptoms 4 | 2682 (99.04%) | 1.99 (1.59–2.50) |
| Cancer-Related Worry | ||
| General Fear 5 | 2684 (99.11%) | 1.45 (1.23–1.71) |
| Body-Focused 6 | 2685 (99.15%) | 2.21 (1.83–2.66) |
| Health-Related Quality of Life | ||
| Physical Component 7 | 2577 (95.16%) | 2.57 (2.06–3.20) |
| Mental Component 8 | 2574 (95.05%) | 2.08 (1.72–2.52) |
Disclaimer/Publisher’s Note: The statements, opinions and data contained in all publications are solely those of the individual author(s) and contributor(s) and not of MDPI and/or the editor(s). MDPI and/or the editor(s) disclaim responsibility for any injury to people or property resulting from any ideas, methods, instructions or products referred to in the content. |
© 2024 by the authors. Licensee MDPI, Basel, Switzerland. This article is an open access article distributed under the terms and conditions of the Creative Commons Attribution (CC BY) license (https://creativecommons.org/licenses/by/4.0/).
Share and Cite
Ware, M.E.; De La Cruz, A.; Dong, Q.; Shelton, K.; Brinkman, T.M.; Huang, I.-C.; Webster, R.; Potter, B.; Krull, K.; Mirzaei, S.; et al. Characterization of Patient Activation among Childhood Cancer Survivors in the St. Jude Lifetime Cohort Study (SJLIFE). Cancers 2024, 16, 3220. https://doi.org/10.3390/cancers16183220
Ware ME, De La Cruz A, Dong Q, Shelton K, Brinkman TM, Huang I-C, Webster R, Potter B, Krull K, Mirzaei S, et al. Characterization of Patient Activation among Childhood Cancer Survivors in the St. Jude Lifetime Cohort Study (SJLIFE). Cancers. 2024; 16(18):3220. https://doi.org/10.3390/cancers16183220
Chicago/Turabian StyleWare, Megan E., Angelica De La Cruz, Qian Dong, Kyla Shelton, Tara M. Brinkman, I-Chan Huang, Rachel Webster, Brian Potter, Kevin Krull, Sedigheh Mirzaei, and et al. 2024. "Characterization of Patient Activation among Childhood Cancer Survivors in the St. Jude Lifetime Cohort Study (SJLIFE)" Cancers 16, no. 18: 3220. https://doi.org/10.3390/cancers16183220