Article

Activation of Cobalt Foil Catalysts for CO Hydrogenation

1
Department of Chemical Engineering, Norwegian University of Science and Technology (NTNU), N-7491 Trondheim, Norway
2
Gassco, Box 93, N-5501 Haugesund, Norway
3
Ministry of Petroleum and Energy, Box 8148, N-00133 Oslo, Norway
4
Equinor Research Centre, N-7053 Trondheim, Norway
*
Author to whom correspondence should be addressed.
Catalysts 2022, 12(1), 65; https://doi.org/10.3390/catal12010065
Submission received: 26 November 2021 / Revised: 1 January 2022 / Accepted: 4 January 2022 / Published: 8 January 2022
(This article belongs to the Section Catalytic Materials)

Abstract

:
CO hydrogenation has been studied on cobalt foils as model catalysts for Fischer–Tropsch (FT) synthesis. The effect of pretreatment (number of calcinations and different reduction times) for cobalt foil catalysts at 220 °C, 1 bar, and H2/CO = 3 has been studied in a microreactor. The foils were examined by scanning electron microscopy (SEM). It was found that the catalytic activity of the cobalt foil increases with the number of pretreatments. The mechanism is likely an increase in the available cobalt surface area from progressively deeper oxidation of the foil, supported by surface roughness detected by SEM. The highest FT activity was obtained using a reduction time of only 5 min (compared to 1 and 30 min). Prolonged reduction caused the sintering of cobalt crystallites, while too short of a reduction time led to incomplete reduction and small crystallites susceptible to low turn-over frequency from structure sensitivity. Larger crystals from longer reduction times gave increased selectivity to heavier components. The paraffin/olefin ratio increased with the increasing number of pretreatments due to olefin hydrogenation favored by enhanced cobalt site density. From the results, it is suggested that olefin hydrogenation is not structure sensitive, and that mass transfer limitations may occur depending on the pretreatment procedure. Produced water did not influence the results for the low conversions experienced in the present study (<6%).

Graphical Abstract

1. Introduction

Fischer–Tropsch synthesis (FTS), i.e., CO hydrogenation, is divided into high-temperature and low-temperature synthesis. The present paper is concerned with low-temperature FT synthesis (LT-FTS) on a cobalt catalyst where synthesis gas (syngas) is converted to a mixture of hydrocarbons ranging from methane to wax. LT-FTS is commonly conducted in the temperature range of 200–250 °C and pressure up to 40 bar. Cobalt is routinely supported on a porous material to achieve the desired cobalt crystallite size of 7–20 nm, and a promoter is frequently added to facilitate the reduction and dispersion of the active metal. The overall reaction of LT-FTS from syngas over cobalt catalysts is as follows:
n CO + 2n H2 → CnH2n + n H2O
It is important to understand mass transfer effects in FTS [1,2,3]. Even though the reactants are in the gas phase, the pores of the catalyst are filled with liquid products. The diffusion rates in the liquid phase are typically 3 orders of magnitude slower than in the gas phase, and even slow reactions may be diffusion limited in the liquid phase. Mass transfer may limit the productivity, but the effect on selectivity is usually more important. The selectivity in FT synthesis on cobalt catalysts is influenced by secondary reactions such as hydrogenolysis, olefin readsorption, and hydrogenation [4,5]. In designing FT processes for the maximum yield of higher hydrocarbons, it is important to have a detailed understanding of the primary and secondary reactions on the cobalt surface.
In order to study the FT synthesis without any possible influence of mass transfer effects, a cobalt metal foil has been chosen as the model catalyst. Using the cobalt foil also eliminates any interactions with the support, and the steady state is established much faster compared with a porous catalyst. However, the cobalt surface area is very low, making it challenging to analyze the activated foil by standard techniques for catalyst characterization. Preliminary experiments (not reported) showed that both the rates and the selectivities depend on the pretreatment, i.e., calcination and reduction. In order to use the cobalt foils as model catalysts for studying secondary reactions, a mapping of the effect of pretreatment of the foil was carried out. The present work deals with the effect of calcination and reduction on the catalytic behavior of a cobalt metal foil.
Cobalt foils were used by Kuipers et al. for studying secondary reactions, in particular the chain length dependence of olefin readsorption [4,5]. The standard pretreatment used by Kuipers et al. [4] involved calcination in air at 400–450 °C for 3 h followed by reduction in flowing hydrogen at 1 bar and 300 °C for 5 min, without explaining why a reduction time of 5 min was chosen. They observed, however, that the paraffin selectivity depended on the reduction time. From the observed olefin to paraffin (o/p) ratios, they concluded that the main secondary reaction is the hydrogenation of primary α-olefins. Furthermore, the o/p ratio decreased exponentially with chain length. Thus, it can be concluded that chain length dependency of the o/p ratio cannot be due to diffusion effects, assuming that there are no or limited transport restrictions in a foil catalyst (see van der Laan and Beenackers [6]). An interpretation of the propene to propane ratio responses to process conditions and catalyst formulation was recently reported by Rytter et al. [7].
Lojewska et al. [8,9] have shown that a series of subsequent reduction/oxidation cycles at high temperature (550 °C) leads to a catalyst precursor in an oxidized form that can be converted into an active catalyst by reduction of the foils at the temperature of the catalytic test (250 °C). It was claimed that this activation procedure increased the catalytic activity by 4 orders of magnitude up to a saturation value. Regeneration by oxidation at 550 °C after deactivation during the catalytic reaction restored the initial high activity. They concluded that the pretreatment procedure with reduction/oxidation cycles modified the surface of the cobalt foil by developing a CoO layer of a characteristic size and dispersion on the metallic surface of the foil. This layer acts as a support for the metallic active centers formed during reduction at moderate temperatures.
A similar effect of the reduction temperature was also observed by Palmer and Vroom when studying methanation on nickel and cobalt foils [10]. The activity was significantly enhanced by conducting the reduction at 252–327 °C rather than at 527–627 °C. The nickel foil increased its activity 10 times, and the cobalt foil was 100 times more active compared to the foil reduced at higher temperatures. Such activity enhancement was not observed using iron foils. Some surface roughening of the cobalt foil occurred during calcination, but the increase in surface area could not explain the much higher increase in methanation rates. Palmer and Vroom suggest that subsurface oxygen plays an important role in enhancing the catalytic activity of nickel and cobalt [10].
Frolich et al. studied the activation of cobalt foils during the hydrogenation of carbon dioxide [11]. Repeated reduction/oxidation cycles increased the catalytic activity of the cobalt foils until saturation in the activity was reached after 10 cycles. It was found that from one reduction/oxidation cycle to the next, oxygen could penetrate deeper into the bulk during oxidation. This process contributes to the roughening of the surface. Only surface oxygen could be completely removed from the surface by hydrogenation. Deactivation of the cobalt foil was due to structural changes in the surface. Interruption of the catalytic reaction by exposure of the cobalt foil to nitrogen had almost no influence, while oxygen gave considerable reactivation and hydrogen led to sintering of the surface.
During CO2 hydrogenation, Jnioui et al. observed that the pre-oxidation of a cobalt foil increased the rate for CO or CH4 formation by 2 or 3 orders of magnitude [12]. They suggested that the increased rates were due to the creation of surface defects by the alternate oxidations and reductions. Since practically no or very little carbonaceous residue was formed (examined by Auger spectroscopy), the observed deactivation of the foil during hydrogenation was considered to originate from thermal restructuring of the surface. Jnioui et al. claimed that the reduction itself is a key factor in catalyst activation [12]. The reduction of most of the surface region was shown to occur very quickly, whereas deeper layers continued to be reduced during the reaction.
Lathinen and Somorjai used cobalt foils to study the role of the readsorption of olefins during CO hydrogenation [13]. The experiments were performed at 252 °C and 1 bar for several hours. The addition of ethene was found to increase the chain growth probability during CO hydrogenation. By increasing the added ethene concentration, the methane fraction decreased, the C3 and C4 fractions increased, and a C5 fraction appeared. Most of the added ethene was converted to ethane, although about 25% participated either in chain growth or in the formation of methane. Although the results from this work indicate that multiple readsorption is beneficial for the production of higher hydrocarbons, this mechanism has been disproved by more recent studies. Yang et al. considered the possible incorporation of olefins into growing chains by desorbed olefins and olefins just produced by chain termination [14]. The former type was rejected based on 14C labeled C2–C19 olefins added to the feed [15,16,17]; only a small fraction of labeled carbon was detected in the FT products. Olefins prior to exiting the cobalt surface were examined by deuterium tracer studies. Insignificant incorporation into growing chains was also detected in this case [18].
In additional studies, Lahtinen, Somorjai, and coworkers investigated CO hydrogenation on polycrystalline cobalt foil at 1 bar and a H2/CO ratio of 1.24 [19,20]. Carbon deposition on the cobalt surface was characterized by Auger spectroscopy after the FT reaction. The C/Co ratio was almost constant as the reaction temperature was increased to 252 °C with no significant deactivation. The C/Co ratio was significantly higher at 297 °C, and it was deduced that carbon formed at this temperature is in graphitic form. The deactivation of the cobalt surface by carbon proceeded from 276 °C onwards. It was deduced that the hydrogenation of CO occurs in the presence of an active carbidic overlayer on the reduced foils, seemingly in contrast to the work by Jnioui et al. [12]. Deactivation is caused by the transformation of this overlayer into graphitic carbon. A 0.1 monolayer of potassium on the cobalt foil reduced the high temperature (307 °C) formation of graphite [21].
Although cobalt foils are frequently used as reference material in XPS and EXAFS studies, only one more recent study has been identified as relevant for FTS. Wu et al. used ambient pressure X-ray photoelectron spectroscopy (XPS) to investigate CO, H2, and their mixtures after carefully cleaning the metal surface [22]. Neat CO was found to dissociate above 120 °C, leaving carbon on the surface, but no oxygen. A 93:3 CO/H2 mixture yielded increasing amounts of hydroxyl on the cobalt surface until 150 °C; at higher temperatures, the surface was reduced with the formation of carbide. This transition took place at higher temperatures for the 9:1 and 1:1 mixtures.
Kobylinski et al. at Shell reported that the reduction–oxidation–reduction (ROR) treatment of supported cobalt and nickel Fischer–Tropsch catalysts increased the activity of the catalysts [23]. Both promoted and unpromoted catalysts improved reaction rates regardless of whether the catalyst was prepared by impregnation or precipitation. ROR activation increased the activity of the supported cobalt and nickel catalyst by up to about 100%. According to Kobylinski et al., the increased activity after ROR treatment was not caused by improved metal dispersion, but by an increase in the TOF of the metal sites [23]. However, most catalysts were prepared by impregnating a porous support with cobalt carbonyl, yielding a very high dispersion of cobalt up to 30%. Subsequent ROR caused sintering and dropped dispersion to 13–22%. Kobylinski et al. also found an increased C5+ selectivity after the ROR treatment [23]. The surprisingly high activity and selectivity that resulted are today explained by the well-known structure sensitivity of cobalt Fischer–Tropsch catalysts [24,25,26]. Bezemer et al. found for cobalt on carbon nano-fiber that the activity of cobalt in FTS increases up to a crystallite size of 7–8 nm [24]. Explanations have been given in terms of activation sites for CO that decline as edges dominate for small crystallites. Similar results have been found for γ-alumina as a support [25,26]. Consistently, Iglesia et al. found no catalytic effect of an extra calcination treatment on monometallic cobalt catalysts supported on silica and titania, but increased activity for ruthenium-promoted cobalt catalysts [27].
The main objective of the present work is to optimize the activation of the cobalt foil by the systematic repetition of calcination and reduction as outlined on Figure 1. It is expected that the ROR procedure roughens the metal surface, and deepens the reduction of the formed oxide layer at high hydrogen severities. Repeated ROR leads to trends in activity and selectivities that can be compared with standard supported catalysts. The analysis of short chain selectivities is enhanced by running at a high hydrogen to CO ratio. The CO conversions are low due to a very low specific cobalt surface area, but the effects of conversion are still clearly seen. Nevertheless, it cannot be ruled out that cobalt metal or alloys in the form of mesh or sponge have certain advantages in novel reactor designs, such as catalyst stagnant bubble columns or high heat transfer fixed beds.

2. Results and Discussion

Blank runs were performed in order to check the activity of the empty reactor without any cobalt foil. No traces of hydrocarbons were observed, showing that the reactor was inert.

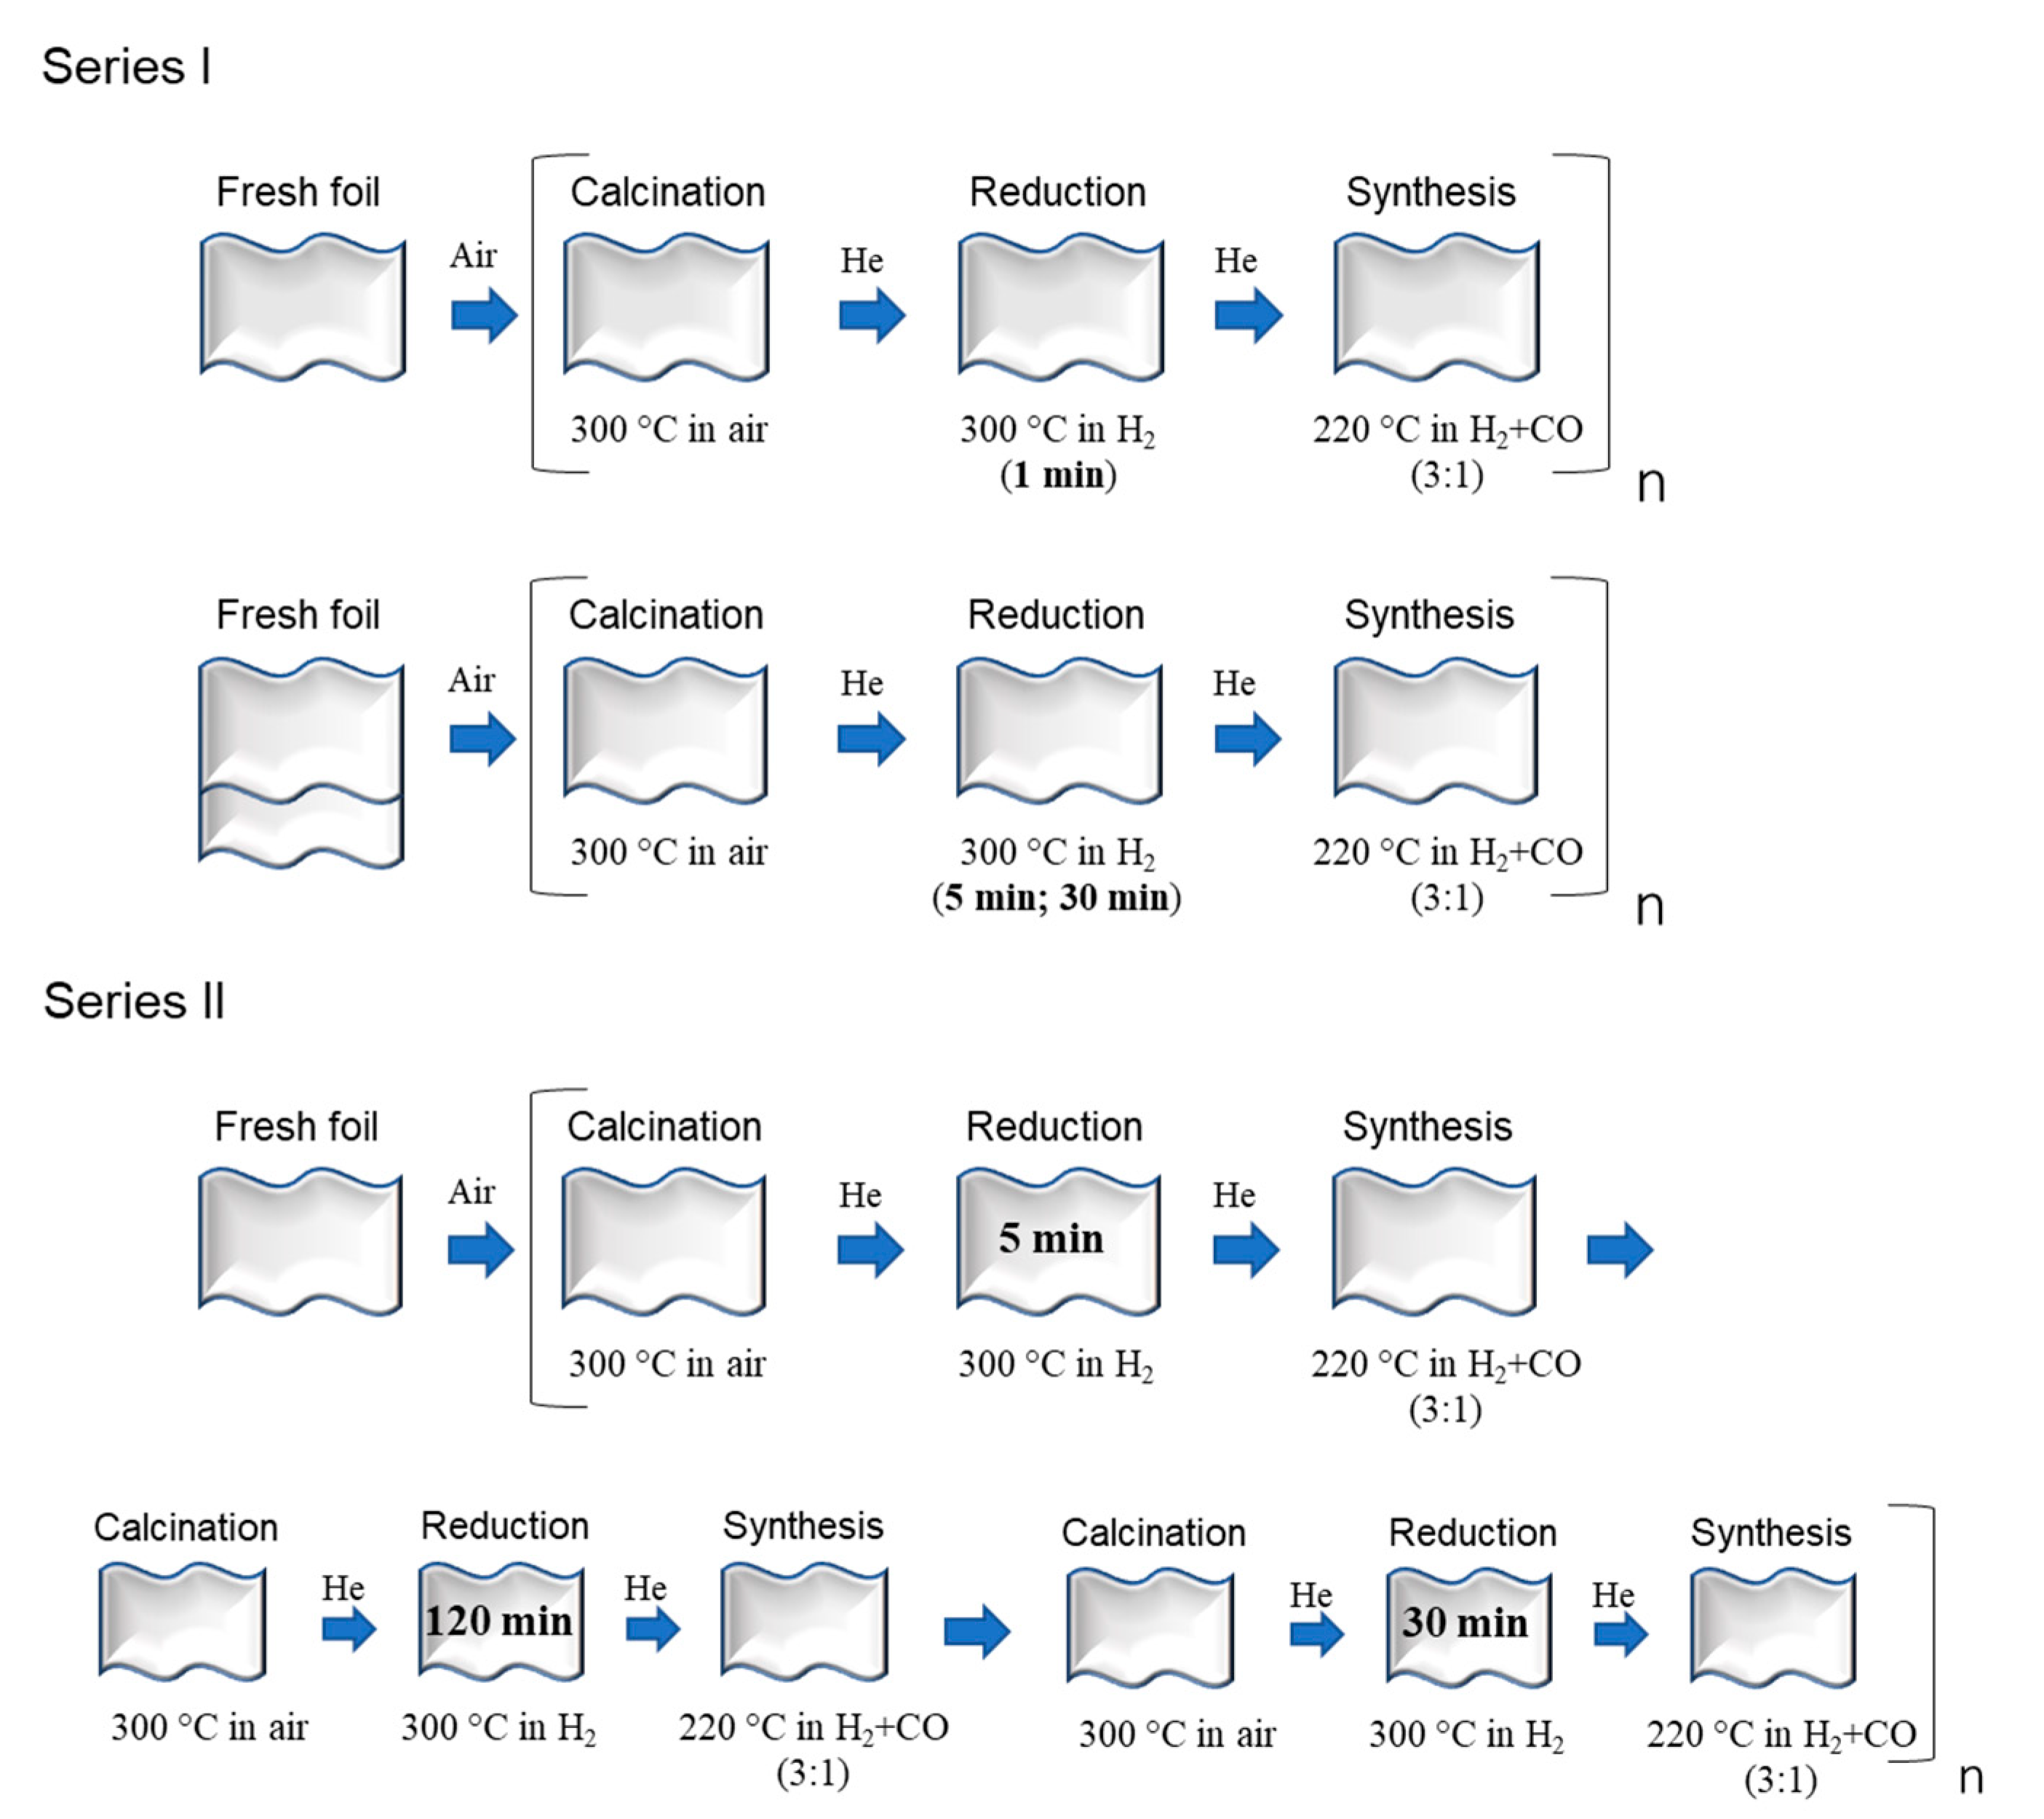
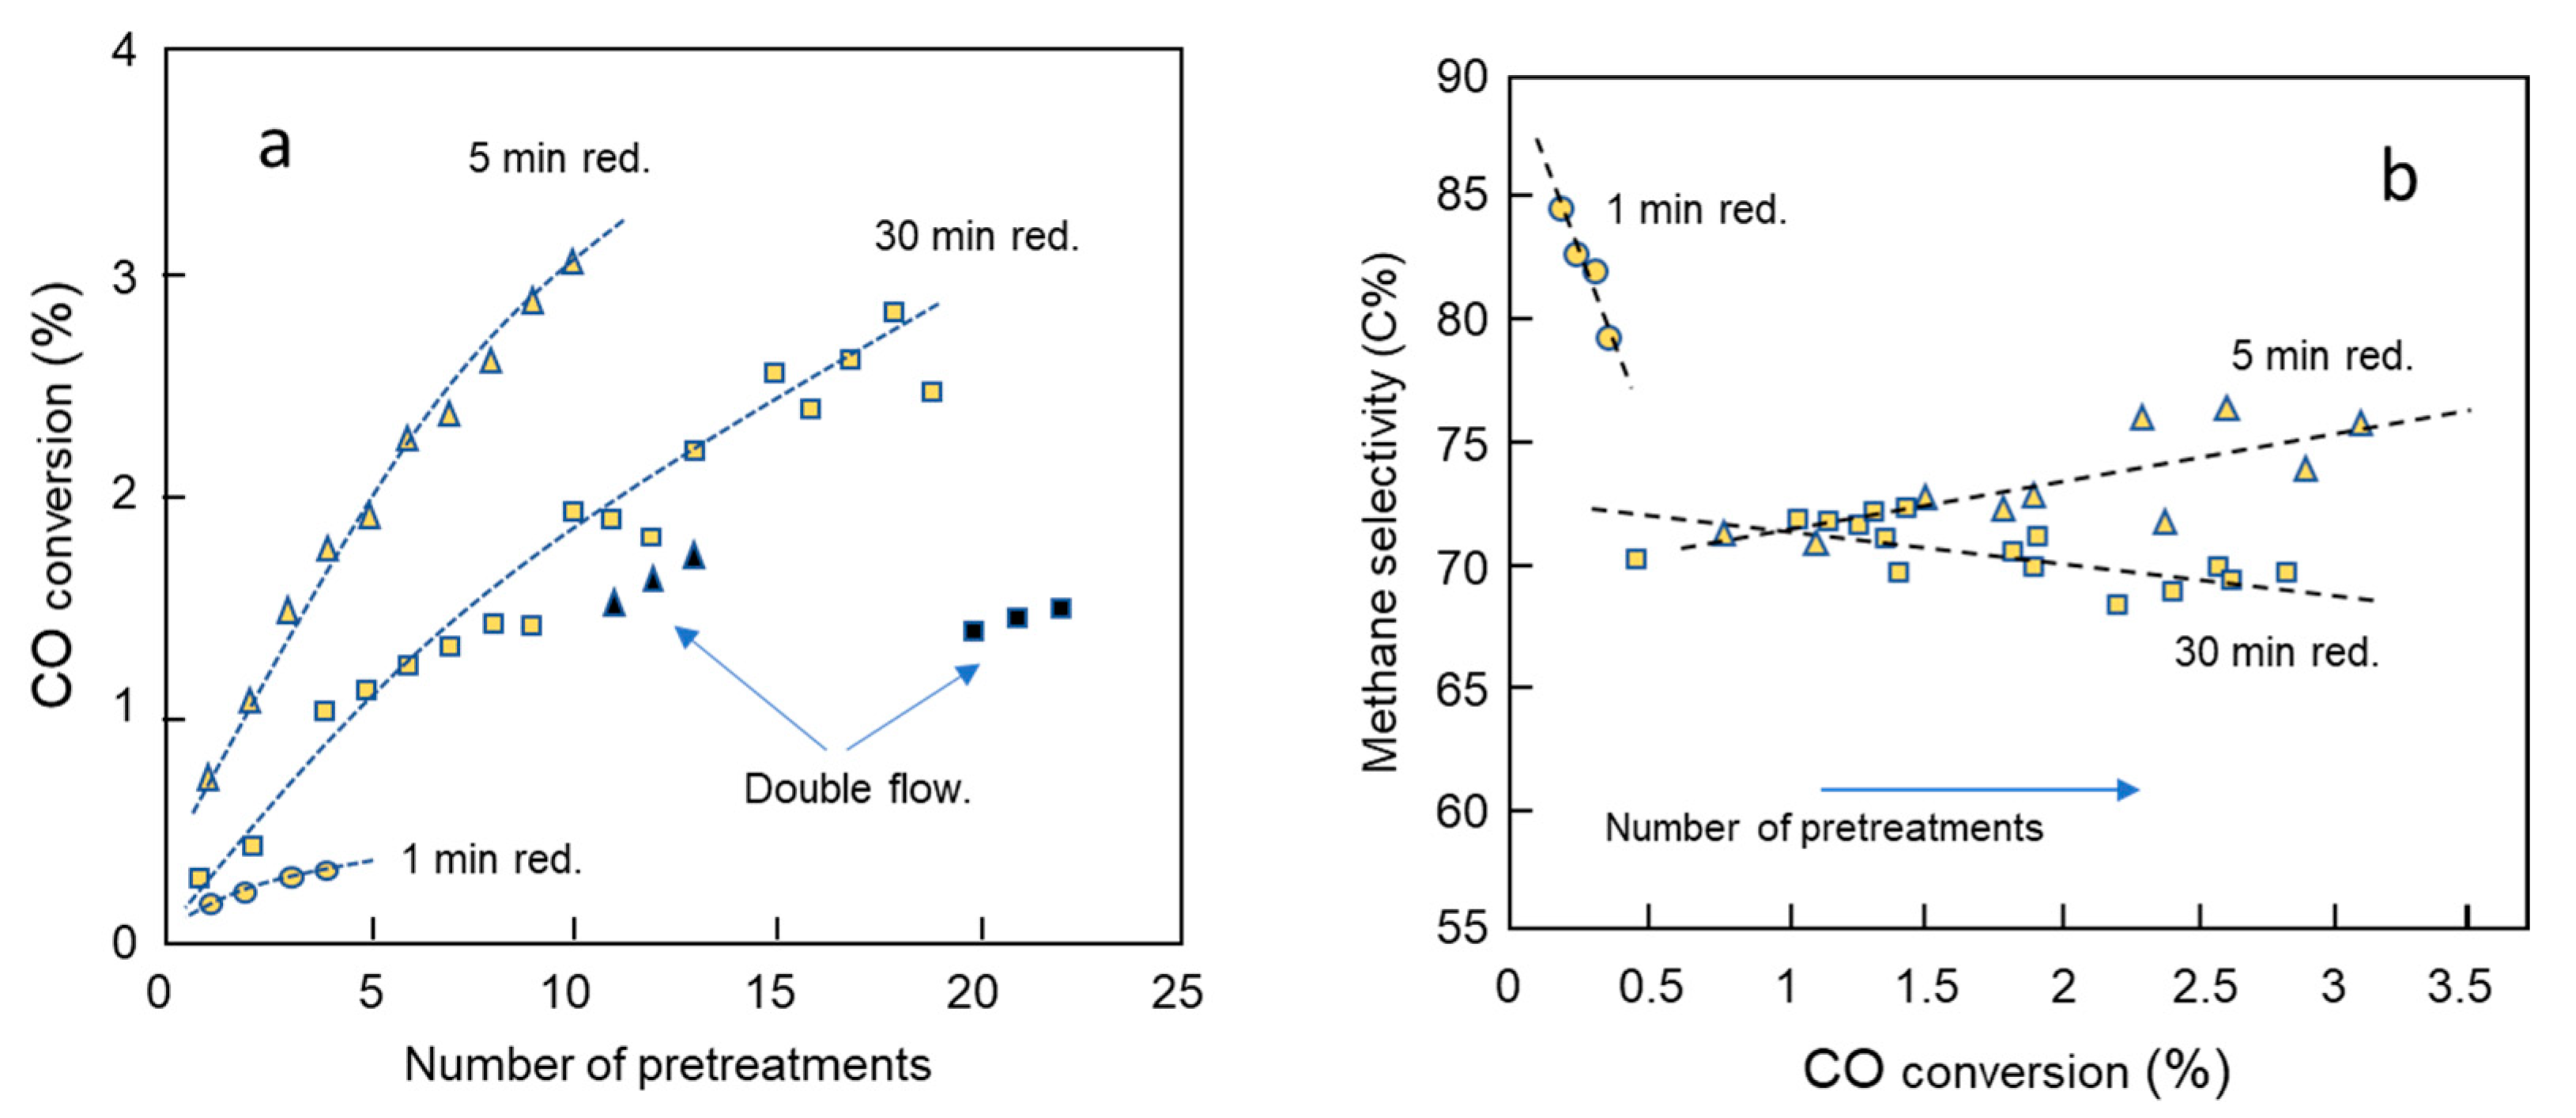
2.1. Series 1: Activity and Selectivity for the Variation in Reduction Time

CO conversion as a function of the number of pretreatments (calcination and reduction) for a variety of reduction times is shown in Figure 2a, clearly demonstrating that the conversion of CO depends on both the number of pretreatments and the reduction time. The catalytic activity of the foil increased with the number of pretreatments without reaching saturation during the testing. The figure shows that the conversion of CO goes through a maximum at 5 min when increasing the reduction period at 300 °C from 1 to 30 min. Further optimization was not carried out. Doubling the total flow of synthesis gas gave about a 50% less conversion of CO at reduction times of both 5 and 30 min. This verifies that the activity of the cobalt foil is controlled by the residence time with no detectable influence of mass transfer restrictions.
The conversion of CO increased from less than 1% to above 3% after 10 pretreatments in the series with a reduction time of 5 min, and for the series with 30 min reduction the conversion increased from 0.3% to about 3% after 18 pretreatments. It is likely that an increase in the available cobalt surface area of the foil can explain the observed increase in activity with the duration of each experiment. The roughening of the surface is proposed to be due to the destabilization of a growing oxide layer on the surface of the cobalt foil. The oxide layer starts to crack and open up after some oxidation–reduction-reaction periods, and this destabilization process develops a rougher surface structure. The present observation that repeated oxidation/reduction cycles give a rougher surface structure and thereby increase the surface area is supported by similar results by others (Lojewska et al. [9], Palmer et al. [10], Frolich et al. [11], and Jnioui et al. [12]). In addition, due consideration needs to be given to structure sensitivity [24]. We expect that the main effect of cobalt particle size is independent of the support and therefore also applies to a foil catalyst. A 1 min reduction may create lower site rates due to particularly small crystallites (<6–8 nm), while a 30 min reduction favors sintering and crystallites which are too large compared to those of a 5 min reduction. To summarize, our interpretation of the activity data is that successive activation cycles create a rougher surface with more cobalt available for FTS, while too short or long reduction times yield unfavorably small or large cobalt crystallites, respectively.
Other factors may also play a role, but are expected to be of a lesser significance for explaining the 4–9-fold activity increase of 5- and 30-min reduction times, respectively. The degree of reduction (DOR) of the oxide layer created during calcination is expected to increase with reduction time, without any obvious effect on the present CO conversions. Indeed, experience from cobalt on porous γ-alumina supports with varying cobalt crystallite sizes indicates moderate variations in DOR [28]. Another possible catalytic effect is strong metal–support interaction (SMSI); SMSI does play a role in FTS, but essentially for titania-based supports [29]. Additional effects include defects and hcp/fcc phases in Co crystallites (see Ducreux et al. [30]). Tsakoumis et al. found that Co nanoparticles with a minimum number of crystal defects, either due to lattice carbon or stacking faults, have a high TOF (turn-over frequency) as well as chain growth probability [31]. No evidence of defects or crystalline phase is available in the present study, but they might have a particular impact for the small crystallites presumed to be present for the shortest reduction time. A further consideration relates to the surface coverage of single carbon atoms that stems from CO scission. However, it appears that a steady state situation is attained where carbon covers 20–50% of the available sites [32].
In situ reduction during FT synthesis was indicated by studying CO conversion during the first two cycles. There was a slight increase in conversion for the 1- and 5-min reductions, confirming the incomplete reduction by hydrogen at 300 °C, while the 30 min reduction foil showed a normal slight deactivation.
The gross product composition at the end of each experiment with a constant reduction time is shown in Table 1. Each experiment involved a number of repetitive calcinations, reductions, and CO hydrogenations. The amount of methane in the product gas decreased and the amount of C5+ increased with the prolonged reduction time of the cobalt foil; C5+ was only a minor product after a reduction time of 1 min. In other words, the selectivity trend is different compared to the foil activity. Note the peculiarity that the selectivity to C2 was higher than for C3 in contrast to most FT synthesis experiments due to an anomaly in the Anderson–Schultz–Flory chain growth. This observation is most likely a consequence of the very light product slate, lifting all light products. High selectivity to methane for the shortest reduction time is likely due to the incomplete reduction of the cobalt foil, possibly giving finely divided cobalt crystallites on CoO [9]. This complies with abovementioned structure sensitivity, where crystallites below 6–8 nm favor light products [25]. The C5+ selectivity increased to about 15–20 nm cobalt particle size before it stabilized, followed by a slight decline. It should also be noted that produced water, increasing with CO conversion, enhanced C5+ selectivity [33,34,35], but this effect might be limited for the low conversions in the present study. Consequently, it is consistently understood why the 30 min reduction time results in a declined activity, but at the same time the lowest methane yield: larger cobalt crystallites favor both C5+ and a high TOF, but the latter is counteracted by the low dispersion to give an overall reduced activity.
Further insight into selectivity responses is found in how the methane selectivity developed with CO conversion (Figure 2b), i.e., with number of activation steps. After the reduction of the foil for 1 min, the methane selectivity decreased with increasing conversion as the crystallites grew successively larger. A similar, but minor trend, can be observed for the 30 min reduction. The slight increase in methane selectivity for the 5 min reduction as the experiment proceeded is more challenging to interpret as both conversion and crystal growth normally favors C5+ selectivity. It might be that for just a few pretreatments, with an insufficient activation of the foil, a 5 min reduction is sufficient for crystal growth. As the activation penetrates deeper into the foil, we speculate that crystal growth might become more kinetically hindered and a longer reduction time is required for the growth.
The roughening of the cobalt surface by pretreatment is visualized in the SEM micrographs in Figure 3. An unused cobalt foil is shown in Figure 3a; the surface is smooth with the only disorder from the production process. The foil in Figure 3b was calcined, reduced for 1 min, and exposed to a CO + H2 feed four times. The surface of the foil changed substantially compared to the unused foil, and the upper surface layer, probably an oxide layer, is starting to crack. A more severe pretreatment is illustrated in Figure 3c, d, where the foil was used 23 times, i.e., the foil was calcined, reduced for 30 min, and exposed to syngas 23 times. The structure seems porous and the surface area is clearly higher than that of an unused foil. The SEM results support the idea that the surface area increases due to the roughening of a growing oxide layer at the surface with the number of pretreatments.

2.2. Series 1: Paraffin to Olefin Ratio by the Variation of Reduction Time

The paraffin/olefin (p/o) ratio depends on the activation procedure, and the ratio increases with the number of pretreatments, as illustrated in Figure 4a. The p/o ratio was higher following a 5 min reduction compared to reduction times of 30 min and 1 min. The trend is similar to the one for CO conversion as shown in Figure 2a. The same behavior was observed for the ethane/ethene ratio, except that no ethene was detected in the product gas when the foil was reduced for only 1 min. The propane/propene ratio was, however, much lower than the ethane/ethene ratio. After eight pretreatments with a reduction time of 5 min, the ethane/ethene ratio was about 10, while the propane/propene ratio was merely 1.3.
The parameters affecting the hydrogenation of olefins in cobalt FTS have recently been systemized [7]; the following factors are found to be potentially important at a given temperature and total pressure:
  • Residence time: The gas flow, or space velocity, determining the residence time of the olefins in the reactor often dominates olefin hydrogenation responses. In the present case, however, the flow rate was constant except for a few control experiments (see Figure 2).
  • Loading and dispersion of cobalt: The available surface area of cobalt, i.e., the amount and crystallite size of cobalt and the degree of the reduction of the available cobalt oxide, plays a major role. This factor is partly dominating in the present study as the pretreatments constantly changed the amount of available oxide and its reduction.
  • Hydrogen coverage: The coverage of hydrogen depends on the total pressure of hydrogen and the H2/CO feed ratio (and conversion), but is also related to the structure sensitivity of the cobalt FT process. The present work was conducted at a high H2/CO ratio of 3, thus favoring hydrogenation.
  • Mass transfer: The diffusion of olefins is important for porous catalysts of a size above about 80 μm [3]. The thickness of the cobalt foil is only 50 μm and mass transfer should not be an issue, but actual pore sizes are not known.
  • CO conversion (H2O coverage): The CO conversion as, e.g., a result of space velocity alteration, catalyst characteristics, or through a reactor, changes gas composition. In particular, it has been found that produced water inhibits olefin hydrogenation, probably due to the enhanced water coverage on cobalt at high CO conversions displacing hydrogen [7,27,36,37]. Since the conversion in the present study was below 6%, conversion is not considered as a critical parameter.
  • Olefin readsorption: The incorporation of olefins during chain growth naturally reduces the amount of primary produced olefins. However, olefin readsorption has been found to be of minor importance for chain growth [17,18]. Nevertheless, it cannot be ruled out that readsorption played a role in the present study due to a light product slate.
  • Activation of olefin: Limited information is available on light α-olefin adsorption and double bond activation on cobalt facets under FTS conditions. This factor has been neglected in the following discussion.
Of the above seven factors, cobalt dispersion and hydrogen coverage are especially relevant for the cobalt foil catalyst. The paraffin/olefin ratio for C3 as a function of CO conversion is depicted in Figure 4b; a similar trend was observed for C2. These results are opposite to the ones found for a standard porous catalyst when water is added to the feed. In the present case, the increased availability of cobalt oxide through repeated pretreatments was dominating. The very strong response up to about 1.5% CO conversion shows that the first 5–10 pretreatments were the most effective. FT synthesis following a reduction for 30 min gave a somewhat higher propane/propene ratio than a reduction for 5 min at comparable conversions (see Figure 4b). This is in apparent conflict with the selectivity data discussed above. A high severity reduction resulted in large cobalt crystals with improved selectivity to longer chains, ascribed to reduced hydrogen coverage. (The effect might be an indirect one. It is proposed that the activation of CO takes place via water-assisted CO dissociation [38]. Higher water coverage suppressing hydrogen promotes the formation of CHx* monomers, which again favors the formation of longer chains as well as the reduced hydrogenation of olefins.). Therefore, it seems that effective deep calcination/reduction dominates over crystal growth for propene hydrogenation.
Short reduction intervals of only 1 min gave low conversions but p/o ratios in line with longer reduction times for a given number of pretreatments. As discussed previously, small crystallites of cobalt that are subject to structure sensitivity for CO hydrogenation are expected to be created. This reduced FTS activity for small crystallites evidently does not apply to olefin hydrogenation. We conclude that olefin hydrogenation on cobalt catalysts under typical FTS conditions is not structure sensitive.

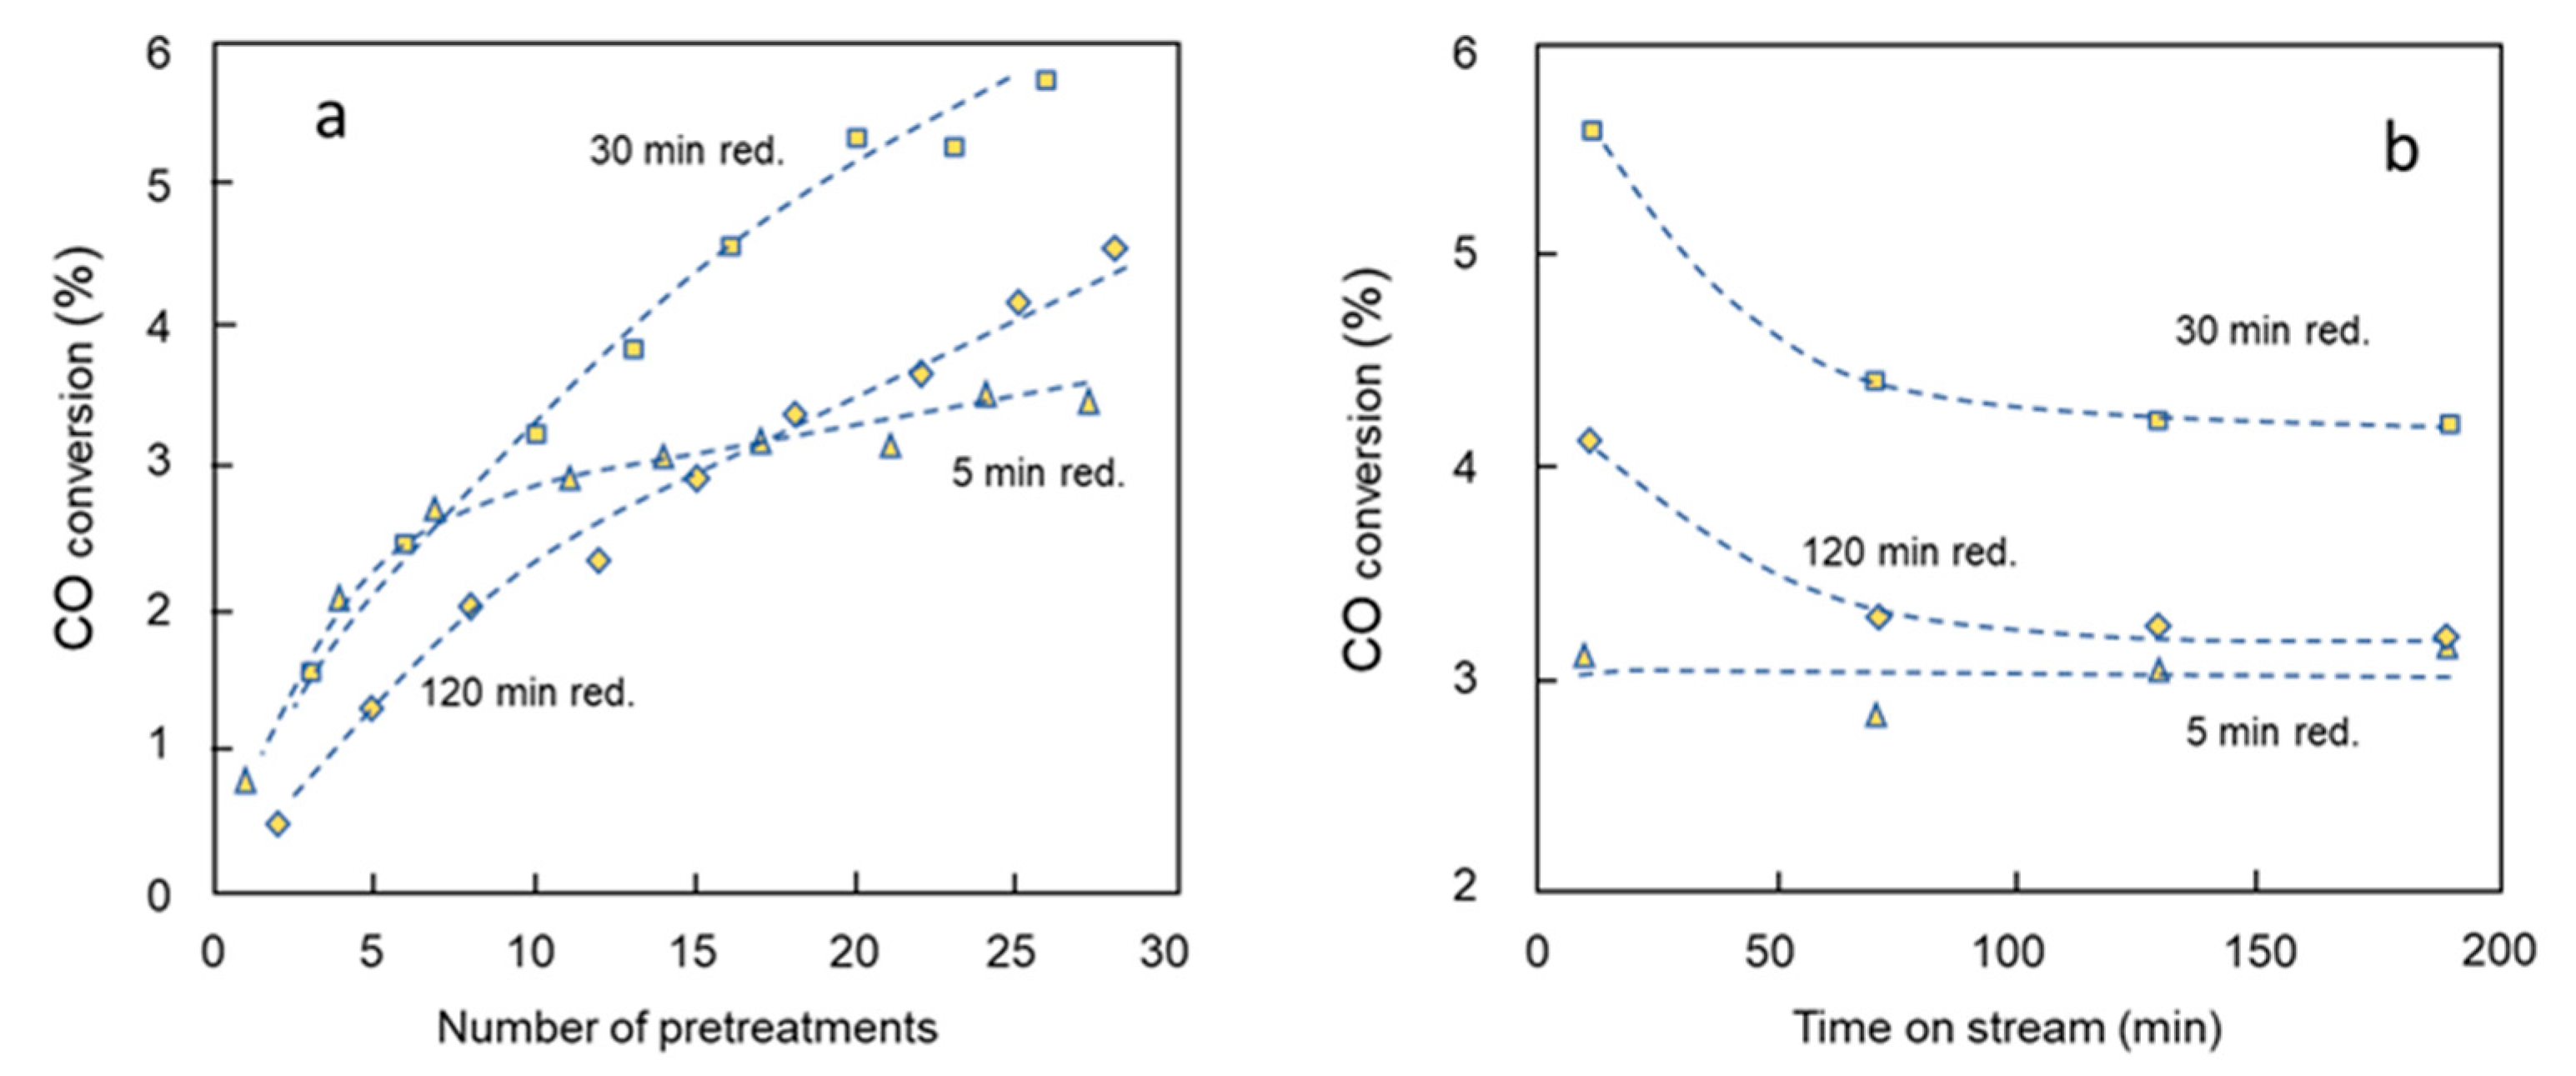
2.3. Series 2: Activity and Selectivity for a Sequential Variation in Reduction Time

The Series 2 experiment was carried out on one fresh cobalt foil run sequentially employing pretreatments with reduction times of 5, 120, and 30 min. In the first experimental cycle the foil was reduced for 5 min, in the second the foil was reduced for 120 min, and in the third the foil was reduced for 30 min (see Figure 1). The sequence of reduction times was then continued with 5, 120, and 30 min of the cobalt foil prior to CO hydrogenation after each reduction. This sequence of alternating reduction times was used in the whole series to confirm that the effect of reduction times starts at similar penetration depths of the foil. The crystallite sizes were expected to be similar, and it is the net effect of reducibility that was investigated.
The CO conversion as a function of the number of pretreatments (calcination/reduction/reaction) is shown in Figure 5a. Initially, the 5- and 30-min reductions gave the highest activity, but after 10 pretreatments the 30 min reduction was clearly preferred. The activity of the cobalt foil following a reduction time of 5 min leveled out after about 10 pretreatments. The latter is explained as insufficient reduction as cobalt crystallites grow with TOS. Remember that two-thirds of the pretreatments in Series 2 involved a higher severity than the 5 min reduction. Therefore, it is not surprising that a similar saturation of activity is not seen in Figure 2a. Frolich et al. observed a leveling of the activity for the hydrogenation of carbon dioxide on cobalt foils after ten reduction/calcination cycles [11]. In contrast, the activity of the foil following 30- and 120-min reductions increased for the duration of the Series 2 experiment, in line with the separate foil experiments shown in Figure 2a. It is expected that more treatments deepen the oxidation of the cobalt foil, making a larger number of reduced crystallites available. It is interesting that the 120 min reduction was less effective than the 30 min one. This cannot be due to DOR, but indicates that a sintering of the crystallites occurs for a prolonged reduction. In the next cycle of calcination and reduction for 30 min, however, the crystallites appeared to be re-dispersed.
The product composition for the end of Series 2 with three different reduction times using the same cobalt foil is given in Table 2. The selectivities were similar for all reduction times, but the lowest methane selectivity for the 30 min reduction indicates a preferred crystallite size for chain growth. The methane selectivity did not vary much at all throughout the experiment, remaining between 73 and 76%. In other words, the strong adverse effect of highly dispersed cobalt after a 1 min reduction in Series 1 is absent. For C5+, there was a slight selectivity increase with increasing CO conversion for reduction times of 30 and 120 min, in line with porous supported cobalt catalysts in FTS [39].
After completion of the experiment shown on Figure 5a, three more cycles were run, each containing a 5, 120, and 30 min reduction and extended Fischer–Tropsch test periods of 60 min each; the last data points in Figure 5a for the 5 and 120 min reduction are the same as the first ones in Figure 5b. Reduction time clearly influences the amount of deactivation; for the experiments with 30 and 120 min reductions there were significant decreases in catalytic activity as TOS increased, while no deactivation was detected for the 5 min reduction. The deactivation mechanism is presumed to be sintering during the longer reduction times, but this was not observed for the 5 min reduction as the reduction was incomplete; larger crystallites have lower surface areas but at the same time reduce more easily.

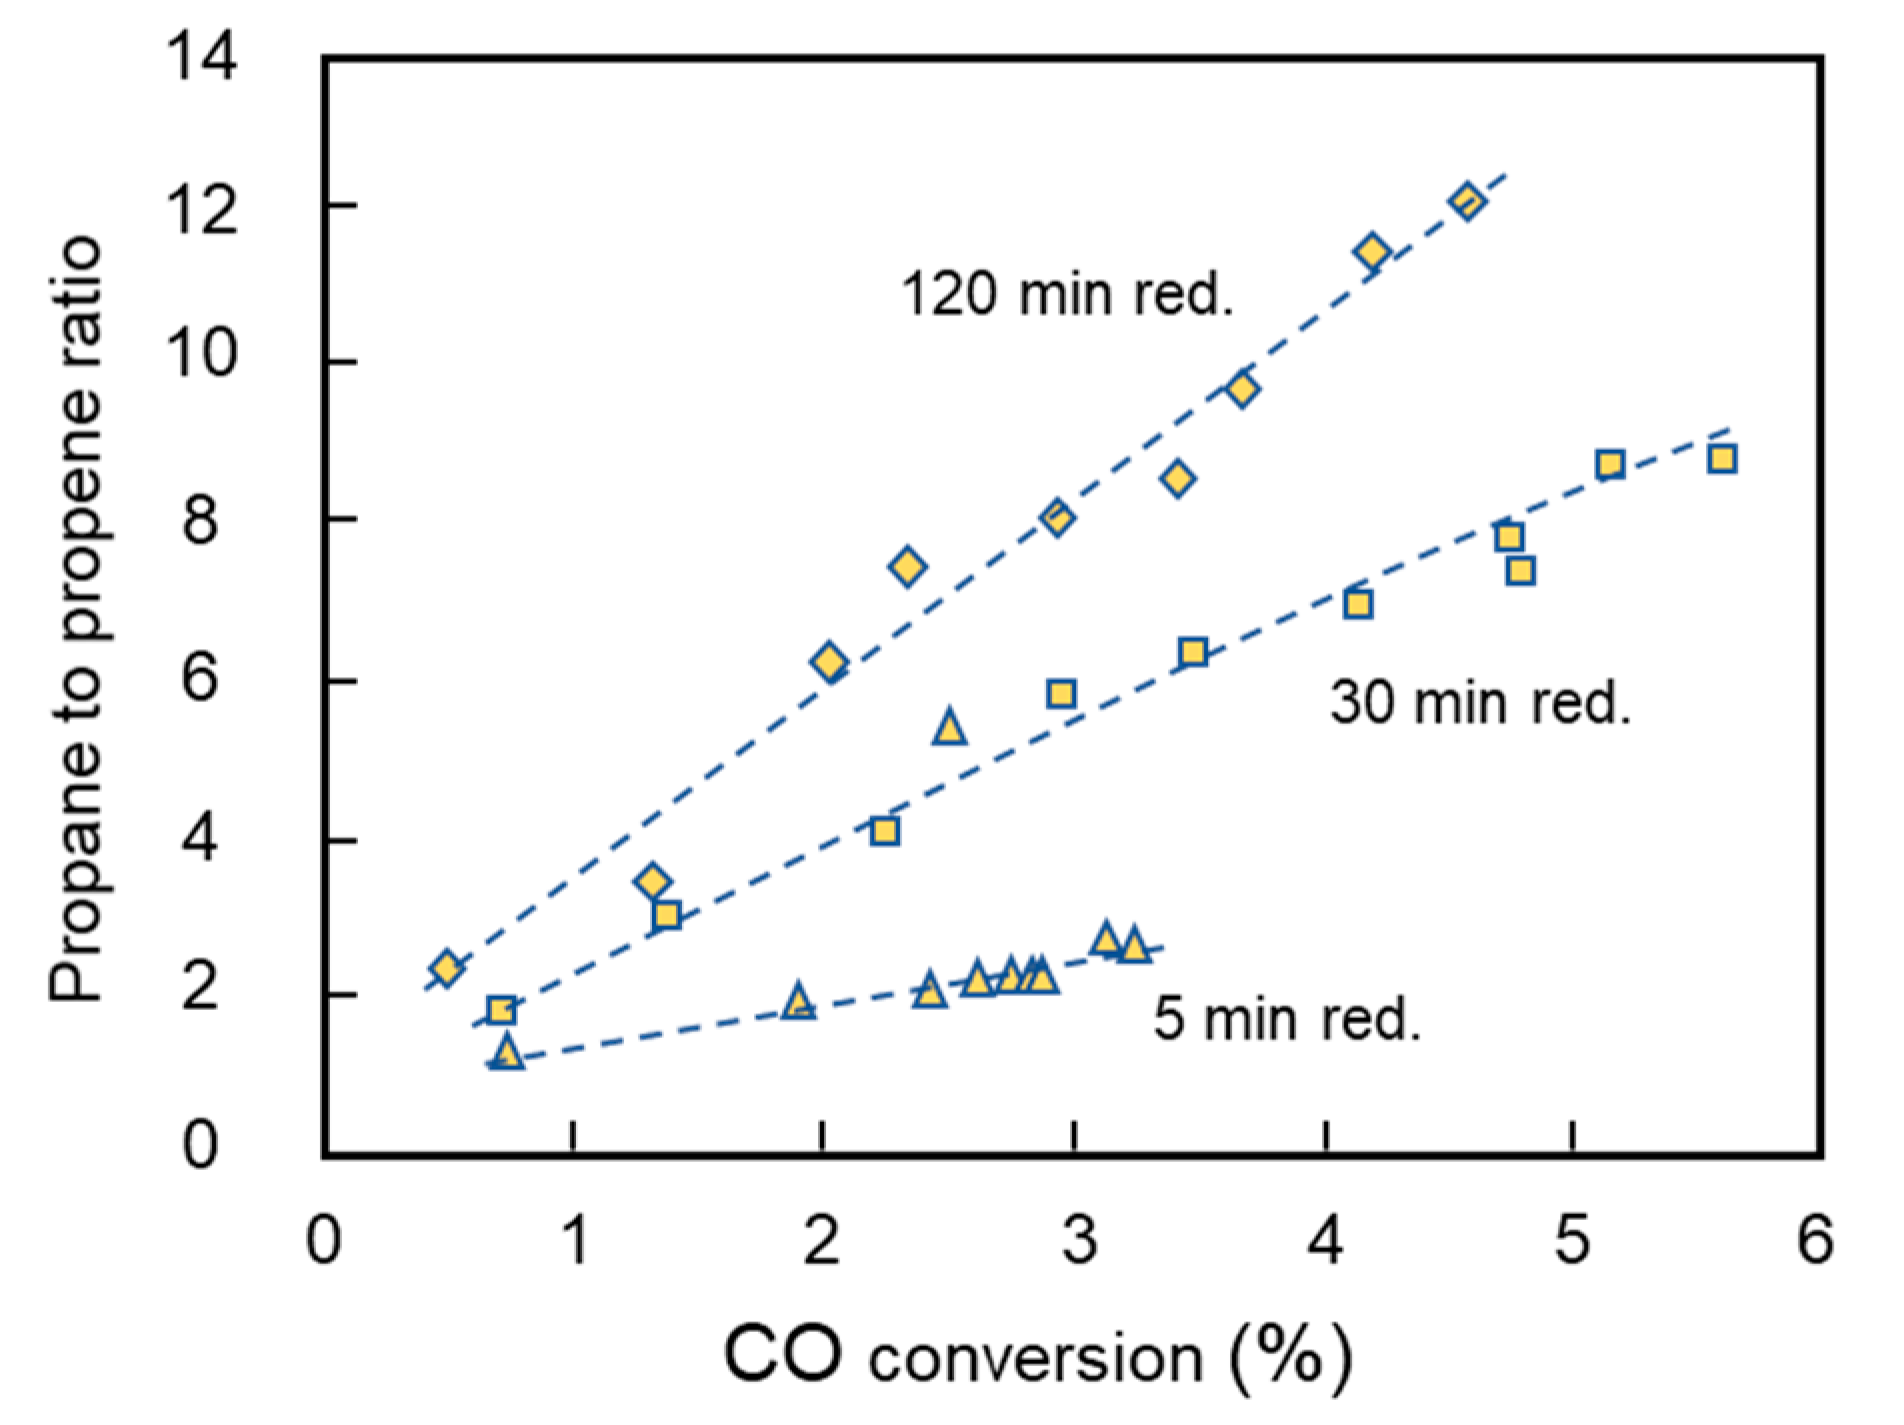
2.4. Series 2: Paraffin to Olefin Ratio by a Sequential Variation in Reduction Time

The propane/propene ratio for Series 2 with three different reduction times using the same cobalt foil is shown on Figure 6. The same trend was also observed for the ethane/ethene ratio. Compared to the ratios obtained by using a constant reduction time for each foil (Figure 4b), the propane/propene ratio was significantly higher (up to ten-fold). Increasing p/o with CO conversion and the number of pretreatment cycles is again explained by the successively deeper oxidation of the foil with time. For a given conversion, and similar total time on stream, it is evident that a longer reduction time promotes hydrogenation in spite of the similarities in effective oxide layer availability. The trend is opposite between the 30- and 120-min reduction for olefin hydrogenation and CO conversion (compare Figure 5a and Figure 6). There is not an obvious explanation, but this indicates that the transport-limited removal of primary olefins might be important even for cobalt foils. However, diffusion limitation in a cobalt foil is not in line with the general idea of cobalt foils as model catalysts without diffusion limitation. A clue can be found in the assumption above that a 120 min reduction leads to sintering followed by redispersion during a 30 min reduction. The fracking of larger crystallites may lead to fine pores susceptible to diffusion limited hydrogenation.

3. Experimental Section

The experiments were carried out in a conventional in-house isothermal fixed bed microreactor described elsewhere [40]. The cobalt foils (Goodfellow, purity 99.9%) were rolled up and loaded into a microreactor (i.d. 0.5 cm). The foil size was 5 cm, 2.5 cm, and the thickness was 0.05 mm. The gas flows were controlled by Bronkhorst Hi-Tee mass flow controllers and the temperature was measured by a thermocouple located just above the foil. The experiments were carried out at 1 bar. The reactor effluent was analyzed using a gas chromatograph (HP 5880) equipped with a flame ionization detector (0.53 mm i.d. GS alumina column).
The cobalt foils were loaded into the reactor and heated to 300 °C in air (20 NmL/min) at a rate of 1 °C/min and kept at 300 °C for 18 h. After calcination, the reactor was flushed with helium (20 NmL/min) at 300 °C for 10 min before reduction in hydrogen (20 NmL/min) at 300 °C for either 1, 5, or 30 min. After reduction, the reactor system was again flushed with helium (20 NmL/min) for 30 min and the reactor was cooled to 220 °C in flowing helium. The reactant mixture (0.75 NmL/min CO, 2.25 NmL/min H2) was introduced at 220 °C. For some experiments, a double flow of synthesis gas was used. The above procedure represents the first experiment in a series of experiments (number of pretreatments). The second experiment began by flushing the reactor with helium and heating to 300 °C at 1 °C/min in flowing air. The experimental procedure followed the above description. A new cobalt foil was used for each series of experiments with different reduction times.
Some experiments were also performed with three different times of reduction on the same cobalt foil. In these experiments, reduction time of 5, 30, or 120 min were used. These experiments were performed in the same way as described above, except that the same foil was used in all the experiments. The foil was first flushed with helium, then calcined, flushed with helium, reduced in flowing hydrogen, and flushed with helium. The reactor was cooled to 220 °C in flowing helium before synthesis gas was fed. The experimental conditions were the same as described above. The reduction time was varied in the following way: 5 min, 120 min, and 30 min, and then the same sequence of reduction times was repeated until the series was finished.
The weight of each foil determined after the experiments was 0.574 g for the 30 min reduction time, 0.600 g for the 5 min reduction time, and 0.575 g for 1 the min reduction time. The foils were examined by scanning electron microscopy (SEM) using a Zeiss Digital Scanning Microscope 940. SEM images were taken of an unused foil, a foil that had been pretreated and exposed to CO and H2 four times, and a foil that had been pretreated and exposed to CO and H2 23 times.

4. Conclusions

The cobalt foil develops a more porous surface after many pretreatments. Scanning electron microscope micrographs of unused and used cobalt foils confirm increased surface roughening with the number of pretreatments. Reduction time influences the CO conversion. The optimal reduction time for a cobalt foil was found to be 5 min (compared to 30 min and 1 min). Increased reduction time results in lower selectivity to light products and increased selectivity to heavier products. The paraffin/olefin ratio in the products from the FT synthesis depends on both the CO conversion and the reduction time; p/o increases with the number of pretreatments. Indications of diffusion limitations in cobalt foils question the validity of cobalt foils as model catalysts without mass transfer restrictions.
The observations were interpreted as follows:
  • Increased surface area and deeper oxidation is created by repetitive calcination–oxidation–calcination.
  • Longer reduction times favor a deepening of the catalytic layer.
  • A short reduction time (1 min) gives small cobalt crystallites dispersed on unreduced oxide which are susceptible to low activity by structure sensitivity.
  • A 5 min reduction time does not result in appreciable sintering, but does not completely reduce large crystallites formed by a 120 min reduction + calcination.
  • A 30 min reduction gives some sintering, but can on the other hand re-disperse large crystallites after following a 120 min reduction + calcination.
  • Prolonged reduction causes sintering.
  • Small cobalt crystallites promote methane formation due to structure sensitivity.
  • The hydrogenation of olefins is favored by repetitive pretreatments and deep oxidation/reduction.
  • The hydrogenation of olefins largely follows development in the available cobalt surface area.
  • The hydrogenation of olefins is not structure sensitive.
  • There are indications of mass transfer limited hydrogenation after redispersion.
  • Produced water (CO conversion < 6%) influences neither activity nor selectivity.

Author Contributions

Conceptualization, A.H. and E.B.; methodology, A.-M.H.; validation, A.H. and E.R.; investigation, C.A.; resources, A.H.; data curation, C.A.; writing—original draft preparation C.A.; writing—review and editing, E.R.; supervision, A.H., A.-M.H. and E.B.; project administration and funding acquisition, A.H. All authors have read and agreed to the published version of the manuscript.

Funding

This research was funded by the Research Council of Norway, SINTEF Applied Chemistry, and the Department of Chemical Engineering, NTNU.

Conflicts of Interest

The authors declare no conflict of interest.

References

  1. Hilmen, A.-M.; Bergene, E.; Lindvåg, O.A.; Schanke, D.; Eri, S.; Holmen, A. Fischer-Tropsch Synthesis Using Monolithic Catalysts. Stud. Surf. Sci. Catal. 2000, 130, 1163–1168. [Google Scholar]
  2. Iglesia, E. Design, Synthesis, and Use of Cobalt-Based Fischer-Tropsch Synthesis Catalysts. Appl. Catal. A Gen. 1997, 161, 59–78. [Google Scholar] [CrossRef]
  3. Rytter, E.; Eri, S.; Skagseth, T.H.; Schanke, D.; Bergene, E.; Myrstad, R.; Lindvåg, A. Catalyst Particle Size of Cobalt/Rhenium on Porous Alumina and the Effect on Fischer−Tropsch Catalytic Performance. Ind. Eng. Chem. Res. 2007, 46, 9032–9036. [Google Scholar] [CrossRef]
  4. Kuipers, E.W.; Scheper, C.; Wilson, J.H.; Vinkenburg, I.H.; Oosterbeek, H. Non-ASF Product Distributions Due to Secondary Reactions during Fischer-Tropsch synthesis. J. Catal. 1996, 158, 288–300. [Google Scholar] [CrossRef]
  5. Kuipers, E.; Vinkenburg, I.H.; Oosterbeek, H. Chain Length Dependence of α-Olefin Readsorption in Fischer-Tropsch Synthesis. J. Catal. 1995, 152, 137–146. [Google Scholar] [CrossRef]
  6. Van der Laan, G.P.; Beenackers, A.A.C.M. Kinetics and Selectivity of the Fischer–Tropsch Synthesis: A Literature Review. Catal. Rev. 1999, 41, 255–318. [Google Scholar] [CrossRef]
  7. Rytter, E.; Yang, J.; Borg, Ø.; Holmen, A. Significance of C3 Olefin to Paraffin Ratio in Cobalt Fischer–Tropsch Synthesis. Catalysts 2020, 10, 967. [Google Scholar] [CrossRef]
  8. Lojewska, J. Various forms of the Carbonaceous Deposit on the Model Cobalt Catalyst Studied in Hydrogenation of Ethylene. Stud. Surf. Sci. Catal. 2001, 139, 13–20. [Google Scholar]
  9. Lojewska, J.; Makowski, W.; Tyszewski, T.; Dziembaj, R. Active State of Model Cobalt Foil Catalyst Studied by SEM, TPR/TPO, XPS and TG. Catal. Today 2001, 69, 409–418. [Google Scholar] [CrossRef]
  10. Palmer, R.L.; Vroom, D.A. Mass-Spectrometric Measurements of Enhanced Methanation Activity over Cobalt and Nickel Foils. J. Catal. 1977, 50, 244–251. [Google Scholar] [CrossRef]
  11. Frolich, G.; Kestel, U.; Lojewska, J.; Lojewski, T.; Meyer, G.; Vob, M.; Borgmann, D.; Dziembaj, D.; Wedler, G. Activation and Deactivation of Cobalt Catalysts in the Hydrogenation of Carbon Dioxide. Appl. Catal. A 1996, 134, 1–19. [Google Scholar] [CrossRef]
  12. Jnioui, A.; Eddouasse, M.; Amariglio, A.; Ehrhardt, J.J.; Alnot, M.; Lambert, J.; Amariglio, H. Catalytic Activation of Cobalt Induced by Oxidizing Treatments in the Methanation of Carbon Dioxide. J. Catal. 1987, 106, 144–165. [Google Scholar] [CrossRef]
  13. Lahtinen, J.; Somorjai, G.A. The Role of Readsorption during CO Hydrogenation over Cobalt Model Catalysts. J. Molec. Catal. A 1994, 91, 387–397. [Google Scholar] [CrossRef]
  14. Yang, J.; Ma, W.; Chen, D.; Holmen, A.; Davis, B.H. Fischer–Tropsch Synthesis: A Review of the Effect of CO Conversion on Methane Selectivity. Appl. Catal. A Gen. 2014, 470, 250–260. [Google Scholar] [CrossRef]
  15. Zimmerman, W.; Bukur, D.; Ledakowicz, S. Kinetic Model of Fischer-Tropsch Synthesis Selectivity in the Slurry Phase. Chem. Eng. Sci. 1992, 47, 2707–2712. [Google Scholar] [CrossRef]
  16. Shi, B.; O’Brien, R.J.; Bao, S.; Davis, B.H. Mechanism of the Isomerization of 1-Alkene during Iron-Catalyzed Fischer-Tropsch Synthesis. J. Catal. 2001, 199, 202–208. [Google Scholar] [CrossRef]
  17. Shi, B.; Jacobs, G.; Sparks, D.; Davis, B.H. Fischer-Tropsch Synthesis: Accounting for Chain Length Phenomena. Fuel 2005, 84, 1093–1098. [Google Scholar] [CrossRef]
  18. Yang, J.; Shafer, W.D.; Pendyala, V.R.R.; Jacobs, G.; Chen, D.; Holmen, A.; Davis, B.H. Fischer-Tropsch Synthesis: Using Deuterium as a Tool to Investigate Primary Product Distribution. Catal. Lett. 2014, 144, 524–530. [Google Scholar] [CrossRef]
  19. Lahtinen, J.; Anraku, T.; Somorjai, G.A. Carbon Monoxide Hydrogenation on Cobalt Foil and on Thin Cobalt Film Model Catalysts. J. Catal. 1993, 142, 206–225. [Google Scholar] [CrossRef]
  20. Lahtinen, J.; Anraku, T.; Somorjai, G.A. C, CO and CO2 Hydrogenation on Cobalt Foil Model Catalysts: Evidence for the Need of CoO Reduction. Catal. Lett. 1994, 25, 241–255. [Google Scholar] [CrossRef]
  21. Lahtinen, J.; Somorjai, G.A. The Effects of Promoters in Carbon Monoxide Hydrogenation on Cobalt Foil Model Catalysts. J. Mol. Catal. A 1998, 130, 255–260. [Google Scholar] [CrossRef]
  22. Wu, C.H.; Eren, B.; Bluhm, H.; Salmeron, M.B. Ambient Pressure Photoelectron Spectroscopy Study of Cobalt Foil Model Catalyst under CO, H2 and Their Mixtures. ACS Catal. 2017, 7, 1150–1157. [Google Scholar] [CrossRef]
  23. Kobylinski, T.P.; Kibby, C.L.; Pannell, R.B.; Eddy, E.L. Synthesis gas conversion using ROR-activated catalyst. U.S. Patent No. 4605676, 12 August 1986. [Google Scholar]
  24. Bezemer, G.L.; Bitter, J.H.; Kuipers, H.P.C.E.; Oosterbeek, H.; Holewijn, J.E.; Xu, X.; Kapteijn, F.; van Dillen, A.J.; de Jong, K.P. Cobalt Particle Size Effects in the Fischer-Tropsch Reaction Studied with Carbon Nanofiber Supported Catalysts. J. Am. Chem. Soc. 2006, 128, 3956–3964. [Google Scholar] [CrossRef] [Green Version]
  25. Borg, Ø.; Dietzel, P.D.C.; Spjelkavik, A.I.; Tveten, E.Z.; Walmsley, J.C.; Eri, S.; Holmen, A.; Rytter, E. Fischer-Tropsch Synthesis: Cobalt Particle Size and Support Effects on Intrinsic Activity and Product Distribution. J. Catal. 2008, 259, 161–164. [Google Scholar] [CrossRef]
  26. Rane, S.; Borg, Ø.; Rytter, E.; Holmen, A. Relation between Hydrocarbon Selectivity and Cobalt Particle Size for Alumina Supported Cobalt Fischer-Tropsch Catalysts. Appl. Catal. A Gen. 2012, 437–438, 10–17. [Google Scholar] [CrossRef]
  27. Iglesia, E.; Reyes, S.C.; Madon, R.J.; Soled, S. Selectivity Control and Catalyst Design in the Fischer-Tropsch Synthesis: Sites, Pellets, and Reactors. Adv. Catal. 1993, 39, 221–302. [Google Scholar]
  28. Borg, Ø.; Eri, S.; Storsæter, S.; Blekkan, E.A.; Wigum, H.; Rytter, E.; Holmen, A. Fischer–Tropsch Synthesis over γ-Alumina-Supported Cobalt Catalysts: Effect of Support Variables. J. Catal. 2007, 248, 89–100. [Google Scholar] [CrossRef]
  29. Haller, G.L.; Resasco, D.E. Metal-Support Interaction: Group VIII Metals and Reducible Oxides. Adv. Catal. 1989, 36, 173–235. [Google Scholar]
  30. Ducreux, O.; Rebours, B.; Lynch, J.; Roy-Auberger, M.; Bazin, D. Microstructure of Supported Cobalt Fischer-Tropsch Catalysts. Oil Gas Sci. Technol. Rev. IFP 2009, 64, 49–62. [Google Scholar] [CrossRef] [Green Version]
  31. Tsakoumis, N.E.; Patanou, E.; Lögdberg, S.; Johnsen, R.E.; Myrstad, R.; van Beek, W.; Rytter, E.; Blekkan, E.A. Structure-Performance Relationships on Co-Based Fischer-Tropsch Synthesis Catalysts: The More Defect-Free, the Better. ACS Catal. 2019, 9, 511–520. [Google Scholar] [CrossRef] [Green Version]
  32. Keyvanloo, K.; Fischer, M.J.; Hecker, W.C.; Lancee, R.J.; Jacobs, G.; Bartholomew, C.H. Kinetics of Deactivation by Carbon of a Cobalt Fischer-Tropsch Catalyst: Effects of CO and H2 Partial Pressures. J. Catal. 2015, 327, 33–47. [Google Scholar] [CrossRef]
  33. Krishnamoorthy, S.; Tu, M.; Ojeda, M.P.; Pinna, D.; Iglesia, E. An Investigation of the Effects of Water on Rate and Selectivity for the Fischer–Tropsch Synthesis on Cobalt-Based Catalysts. J. Catal. 2002, 211, 422–433. [Google Scholar] [CrossRef]
  34. Bertole, C.J.; Mims, C.A.; Kiss, G. The Effect of Water on the Cobalt-Catalyzed Fischer–Tropsch Synthesis. J. Catal. 2002, 210, 84–96. [Google Scholar] [CrossRef]
  35. Rytter, E.; Borg, Ø.; Tsakoumis, N.; Holmen, A. Water as Key to Activity and Selectivity in Co Fischer-Tropsch Synthesis: γ-Alumina Based Structure-Performance Relationships. J. Catal. 2018, 365, 334–343. [Google Scholar] [CrossRef]
  36. Hilmen, A.-M.; Lindvåg, O.A.; Bergene, E.; Schanke, D.; Eri, S.; Holmen, A. Selectivity and Activity Changes Upon Water Addition during Fischer-Tropsch Synthesis. Stud. Surf. Sci. Catal. 2001, 136, 295–300. [Google Scholar]
  37. Hilmen, A.-M.; Bergene, E.; Lindvag, O.A.; Schanke, D.; Eri, S.; Holmen, A. Fischer–Tropsch Synthesis on Monolithic Catalysts of Different Materials. Catal. Today 2001, 69, 227–232. [Google Scholar] [CrossRef]
  38. Rytter, E.; Holmen, A. Consorted Vinylene Mechanism for Cobalt Fischer-Tropsch Synthesis Encompassing Water or Hydroxyl Assisted CO-Activation. Top. Catal. 2018, 61, 1024–1034. [Google Scholar] [CrossRef]
  39. Rytter, E.; Tsakoumis, N.E.; Holmen, A. On the Selectivity to Higher Hydrocarbons in Co-Based Fischer–Tropsch Synthesis. Catal. Today 2016, 261, 3–16. [Google Scholar] [CrossRef]
  40. Hanssen, K.F.; Blekkan, E.A.; Schanke, D.; Holmen, A. Transient and Steady-State Studies of the Effect of Water on Cobalt Fischer-Tropsch Catalysts. Stud. Surf. Sci. Catal. 1997, 109, 193–202. [Google Scholar]
Figure 1. Activation of catalyst foils by repeated calcination in air and reduction in diluted hydrogen. Series I is based on three separate foils using reduction times of 1, 5, and 30 min, respectively, while one foil is used in series II with sequential change in reduction times and intermittent FT synthesis. Details, including calcination and flushing times, gas compositions, and ramping, are given in the Experimental Section.
Catalysts 12 00065 g001
Figure 2. (a) CO conversion as a function of number of pretreatments. (b) Methane selectivity as a function of CO conversion. Conditions: fresh foil for each reduction time of 1, 5, or 30 min; calcination and reduction at 300 °C; FTS at 220 °C and 1 bar; open symbols: flow, 3 NmL/min; closed symbols: 6 NmL/min; TOS for each FT synthesis: 70 min.
Catalysts 12 00065 g002
Figure 3. (a) SEM micrograph of an unused cobalt foil. (b) SEM micrograph of a cobalt foil used four times, reduced in 1 min. (c) SEM micrograph of a cobalt foil used 23 times, reduced in 30 min. (d) Micrograph enlarged four times of the marked area in (c).
Catalysts 12 00065 g003
Figure 4. (a) The propane/propene ratio as a function of the number of pretreatments for different reduction times. (b) The propane/propene ratio as a function of CO conversion. Conditions: fresh foil for each reduction time of 1, 5, or 30 min; calcination and reduction at 300 °C; FTS at 220 °C and 1 bar; open symbols: flow, 3 NmL/min; closed symbols: 6 NmL/min; TOS for each FT synthesis: 70 min.
Catalysts 12 00065 g004
Figure 5. (a) CO conversion as a function of pretreatments on one fresh Co foil run continuously in the sequence of 5, 120, and 30 min. (b) CO conversion as a function of accumulated TOS under Fischer–Tropsch synthesis for each applied reduction time. Conditions: T = 220 °C; P = 1 bar; H2/CO = 3; total flow = 3 NmL/min; TOS for each FT-synthesis: 10 min.
Catalysts 12 00065 g005
Figure 6. Propane to propene ratio as a function of CO conversion on one fresh Co foil run continuously in the sequence of 5-, 120-, and 30-min. Conditions: T = 220 °C; P = 1 bar; H2/CO = 3; total flow = 3 NmL/min; TOS for each FT-synthesis: 10 min.
Catalysts 12 00065 g006
Table 1. Conversion and selectivities at the end of each experiment in Series 1 with constant reduction time of the cobalt foil (see Figure 1 and Figure 2). The pretreatment involved calcination, reduction, and then CO hydrogenation. Time on stream for each FT test: 70 min.
Reduction
Time
(min)
Number of
Pretreatments
CO
Conversion
(C%)
C1
(C%)
C2
(C%)
C3
(C%)
C4
(C%)
C5+
(C%)
140.379.68.97.33.70.4
5103.175.98.97.73.63.9
30182.870.011.69.04.55.0
Table 2. Conversion and selectivities at the end of the experiment using one cobalt foil, last cycle (Series 2; Figure 1). The pretreatment involved calcination, reduction, and then CO hydrogenation. Time on stream for each FT test: 10 min.
Reduction Time
(min)
Number of
Pretreatments
CO
Conversion
(C%)
C1
(C%)
C2
(C%)
C3
(C%)
C4
(C%)
C5+
(C%)
5273.475.510.77.53.52.9
30295.674.111.37.83.92.9
120284.574.811.47.63.62.6
Publisher’s Note: MDPI stays neutral with regard to jurisdictional claims in published maps and institutional affiliations.

