Article

Influence of UV-A Light Modulation on Phenol Mineralization by TiO2 Photocatalytic Process Coadjuvated with H2O2

1
Department of Industrial Engineering, University of Salerno, Via Giovanni Paolo II 132, 84084 Fisciano, Italy
2
Exeling SRL, Contrada S. Tommaso 18/F, 83100 Avellino, Italy
3
Department of Information, and Electrical Engineering and Applied Mathematics, University of Salerno, Via Giovanni Paolo II 132, 84084 Fisciano, Italy
4
Department of Electrical and Information Engineering “Maurizio Scarano”, University of Cassino and Southern Lazio, Viale dell’Università, 03043 Cassino, Italy
*
Author to whom correspondence should be addressed.
Catalysts 2024, 14(8), 544; https://doi.org/10.3390/catal14080544
Submission received: 19 July 2024 / Revised: 12 August 2024 / Accepted: 17 August 2024 / Published: 20 August 2024
(This article belongs to the Special Issue Commemorative Special Issue for Prof. Dr. Dion Dionysiou)

Abstract

:
This work examined the influence of UV-A light modulation on the photocatalytic process coadjuvated with H2O2 to mineralize phenol in an aqueous solution. A fixed-bed batch photocatalytic reactor with a flat-plate geometry, irradiated by UV-A LEDs, was employed. The successful deposition of commercial TiO2 PC105 on a steel plate (SP) was achieved, and the structured photocatalyst was characterized using Raman spectroscopy, specific surface area (SSA) measurements, and UV–vis DRS analysis. These analyses confirmed the formation of a titania coating in the anatase phase with a bandgap energy of 3.25 eV. Various LED-dimming techniques, with both fixed and variable duty cycle values, were tested to evaluate the stability of the photocatalyst’s activity and the influence of operating parameters during the mineralization of 450 mL of a phenol solution. The optimal operating parameters were identified as an initial phenol concentration of 10 ppm, a hydrogen peroxide dosage of 0.208 g L−1, and triangular variable duty cycle light modulation. Under these conditions, the highest apparent phenol degradation kinetic constant (0.39 min−1) and the total mineralization were achieved. Finally, the energy consumption for mineralizing 90% phenol in one cubic meter of treated water was determined, showing the greatest energy savings with triangular light modulation.

1. Introduction

Nowadays, an urgent problem affecting the biosphere is represented by water pollution, generated by the huge growth of the population, which has led to a significant increase in the water demand for industrialization, urbanization, and agriculture [1]. This has led to environmental degradation and pollution, which has negatively impacted water bodies and, consequently, human health and ecosystems [2]. Numerous industrial organic pollutants are responsible for reducing water quality and contaminating ecosystems, including phenolic compounds [3].
In particular, water pollution by phenol is a critical environmental issue that poses significant risks to both ecosystems and human health. Phenol, a toxic aromatic compound, commonly finds its way into water bodies through industrial discharges, agricultural runoff, and inadequate waste management practices. Industries such as petrochemical, pharmaceutical, and plastics manufacturing are major contributors, releasing phenol into rivers, lakes, and oceans [4]. Once in the aquatic environment, phenol can adversely affect aquatic life, disrupting biological processes and leading to the bioaccumulation of harmful substances in the food chain [5]. For humans, exposure to phenol-contaminated water can result in serious health issues, including respiratory problems, skin irritation, and long-term effects on the liver and kidneys [6]. Addressing phenol pollution requires stringent regulatory measures, effective wastewater treatment technologies, and public awareness to mitigate its detrimental impact on the environment and public health [7]. In particular, the EPA has considered 1 ppm and 0.001 ppm as the permissible limits of phenol in wastewater and water, respectively [8], while the maximum phenol concentration in drinking water is limited to 0.5 ppb by European Union regulation no. 80/778/EC [9].
For the removal of phenol from wastewater, three different types of processes are used in traditional treatment plants: (i) physicochemical processes (flocculation, chemical precipitation, and chlorination), (ii) physical processes (volatilization, ion exchange resins, and membrane filtration), and (iii) biological processes [10]. These processes are neither environmentally nor economically sustainable. Indeed, for the first two types of processes, the main disadvantages are the high treatment costs, incomplete mineralization of the pollutant, excessive sludge production, and high energy consumption [11]. Biological treatments are also not suitable for removing phenol from water because they require high retention times and present difficult conditions for the adaptation of microorganisms [12].
For these reasons, research is increasingly driven toward identifying innovative, economical, and highly efficient solutions to completely degrade phenol from wastewater. In the literature, many different techniques for treating wastewater have been developed to effectively remove this compound and avoid its negative impacts on both humans and marine life. In particular, they are (i) physical adsorption [13], (ii) solvent extraction [14], and (iii) advanced oxidation processes (AOPs) [15,16,17,18,19]. Among them, a promising solution for phenol removal is represented by the advanced oxidation process (AOP), which uses reactive oxygen species (ROS) to mineralize phenol into carbon dioxide (CO2) and water (H2O) [20,21,22,23]. Despite the possibility of releasing reactive oxygen species (ROS) from dissolved precursors, such as hydrogen peroxide (H2O2), photocatalytic processes have garnered significant interest [24]. Particularly, the photocatalytic process conducted using titanium dioxide (TiO2) as a catalyst for the degradation of organic contaminants is widely used, as TiO2 is economical, non-toxic, stable, and allows the process to take place under mild conditions (ambient pressure and room temperature) [25]. However, due to its high energy band gap (approximately 3.2 eV), TiO2 needs ultraviolet radiation (UV-A light) to form electron–hole pairs, which are then used to produce ROS from the dissolved oxygen and hydroxyl ions present in the water [26]. The anatase phase is frequently considered the most effective polymorph for photocatalytic applications presenting a higher conduction band edge, with a greater reduction potential for electrons and an extended lifetime of photogenerated charge carriers [27].
Even though the TiO2 photocatalytic process is effective on its own, it has been demonstrated that it can provide synergistic effects when coadjuvated with H2O2, which enhances the formation of ROS and subsequent oxidation of organic pollutants present in the treated water [28,29].
Another important aspect to take into account to intensify the photocatalytic process is the reactor configuration [30]. In general, the most used configuration is that of slurry photoreactors, in which the photocatalytic nanoparticles are suspended within the solution to be treated [31], but it shows several disadvantages [32]: (i) the difficulty of separating the photocatalyst from the treated wastewater downstream of the treatment process; (ii) aggregation and agglomeration phenomena of photocatalytic powders in the case of a high photocatalyst dosage, (iii) the recirculation pumps have a limited lifetime due to corrosion phenomena, and (iv) the difficulty of implementing a continuous process. For this reason, to increase the efficiency of the process it is better to use a fixed-bed reactor with a structured photocatalyst [33,34,35,36].
In addition, controlled periodic illumination represents an effective technique for increasing photonic efficiency and, therefore, achieving the intensification of the photocatalytic process [37,38]. The best sources to apply this technique to are LEDs [39,40]. Indeed, they can be controlled electronically using dimming techniques, which allow the light to be turned on and off on a microsecond time scale. In our previous studies [38,41,42,43,44,45], it was demonstrated that irradiation with the dimming duty cycle LED modulation significantly enhanced the mineralization efficiencies regarding methylene blue, urea, terephthalic acid, acid orange 7, and ceftriaxone.
The aim of this work was to analyze the mineralization of phenol through a photocatalytic process assisted with hydrogen peroxide, conducted in a fixed-bed photoreactor with a planar geometry with a light source modulated using the LED-dimming technique. There is no work reported in the literature that has carried out this type of study. For this reason, a structured photocatalyst was synthesized consisting of commercial TiO2 (P105) deposited on a steel plate, and its activity was analyzed as the operating parameters of the photo-reactor changed (the initial concentration of the pollutant, the dosage of hydrogen peroxide, the intensity of the light incident on the surface of the photocatalyst, and the type of light modulation).

2. Results and Discussion

2.1. Physicochemical, Morphological, and Optical Characterizations

2.1.1. Raman Spectra Evaluation

As seen in Figure 1, Raman vibrational spectroscopy was used to examine the presence of the crystalline phase of TiO2 on the support.
A strong characteristic spectrum of the TiO2 anatase phase was confirmed in the PC105/SP, with Raman peaks centered at 143 cm−1 (Eg), 199 cm−1 (Eg), 398 cm−1 (B1g), 516 cm−1 (A1g + B1g), and 642 cm−1 (Eg) [46,47,48]. No Raman scattering characteristic peak (Figure 1) was present on the stainless-steel plate due to its flat trend. As expected, observing the PC105/SP spectrum, the nano-powder deposition method employed did not lead to changes in the TiO2 particle signals. From the Raman data, there was no sign that any component of the alloy substrate chemically reacted on the surface with the photocatalyst.

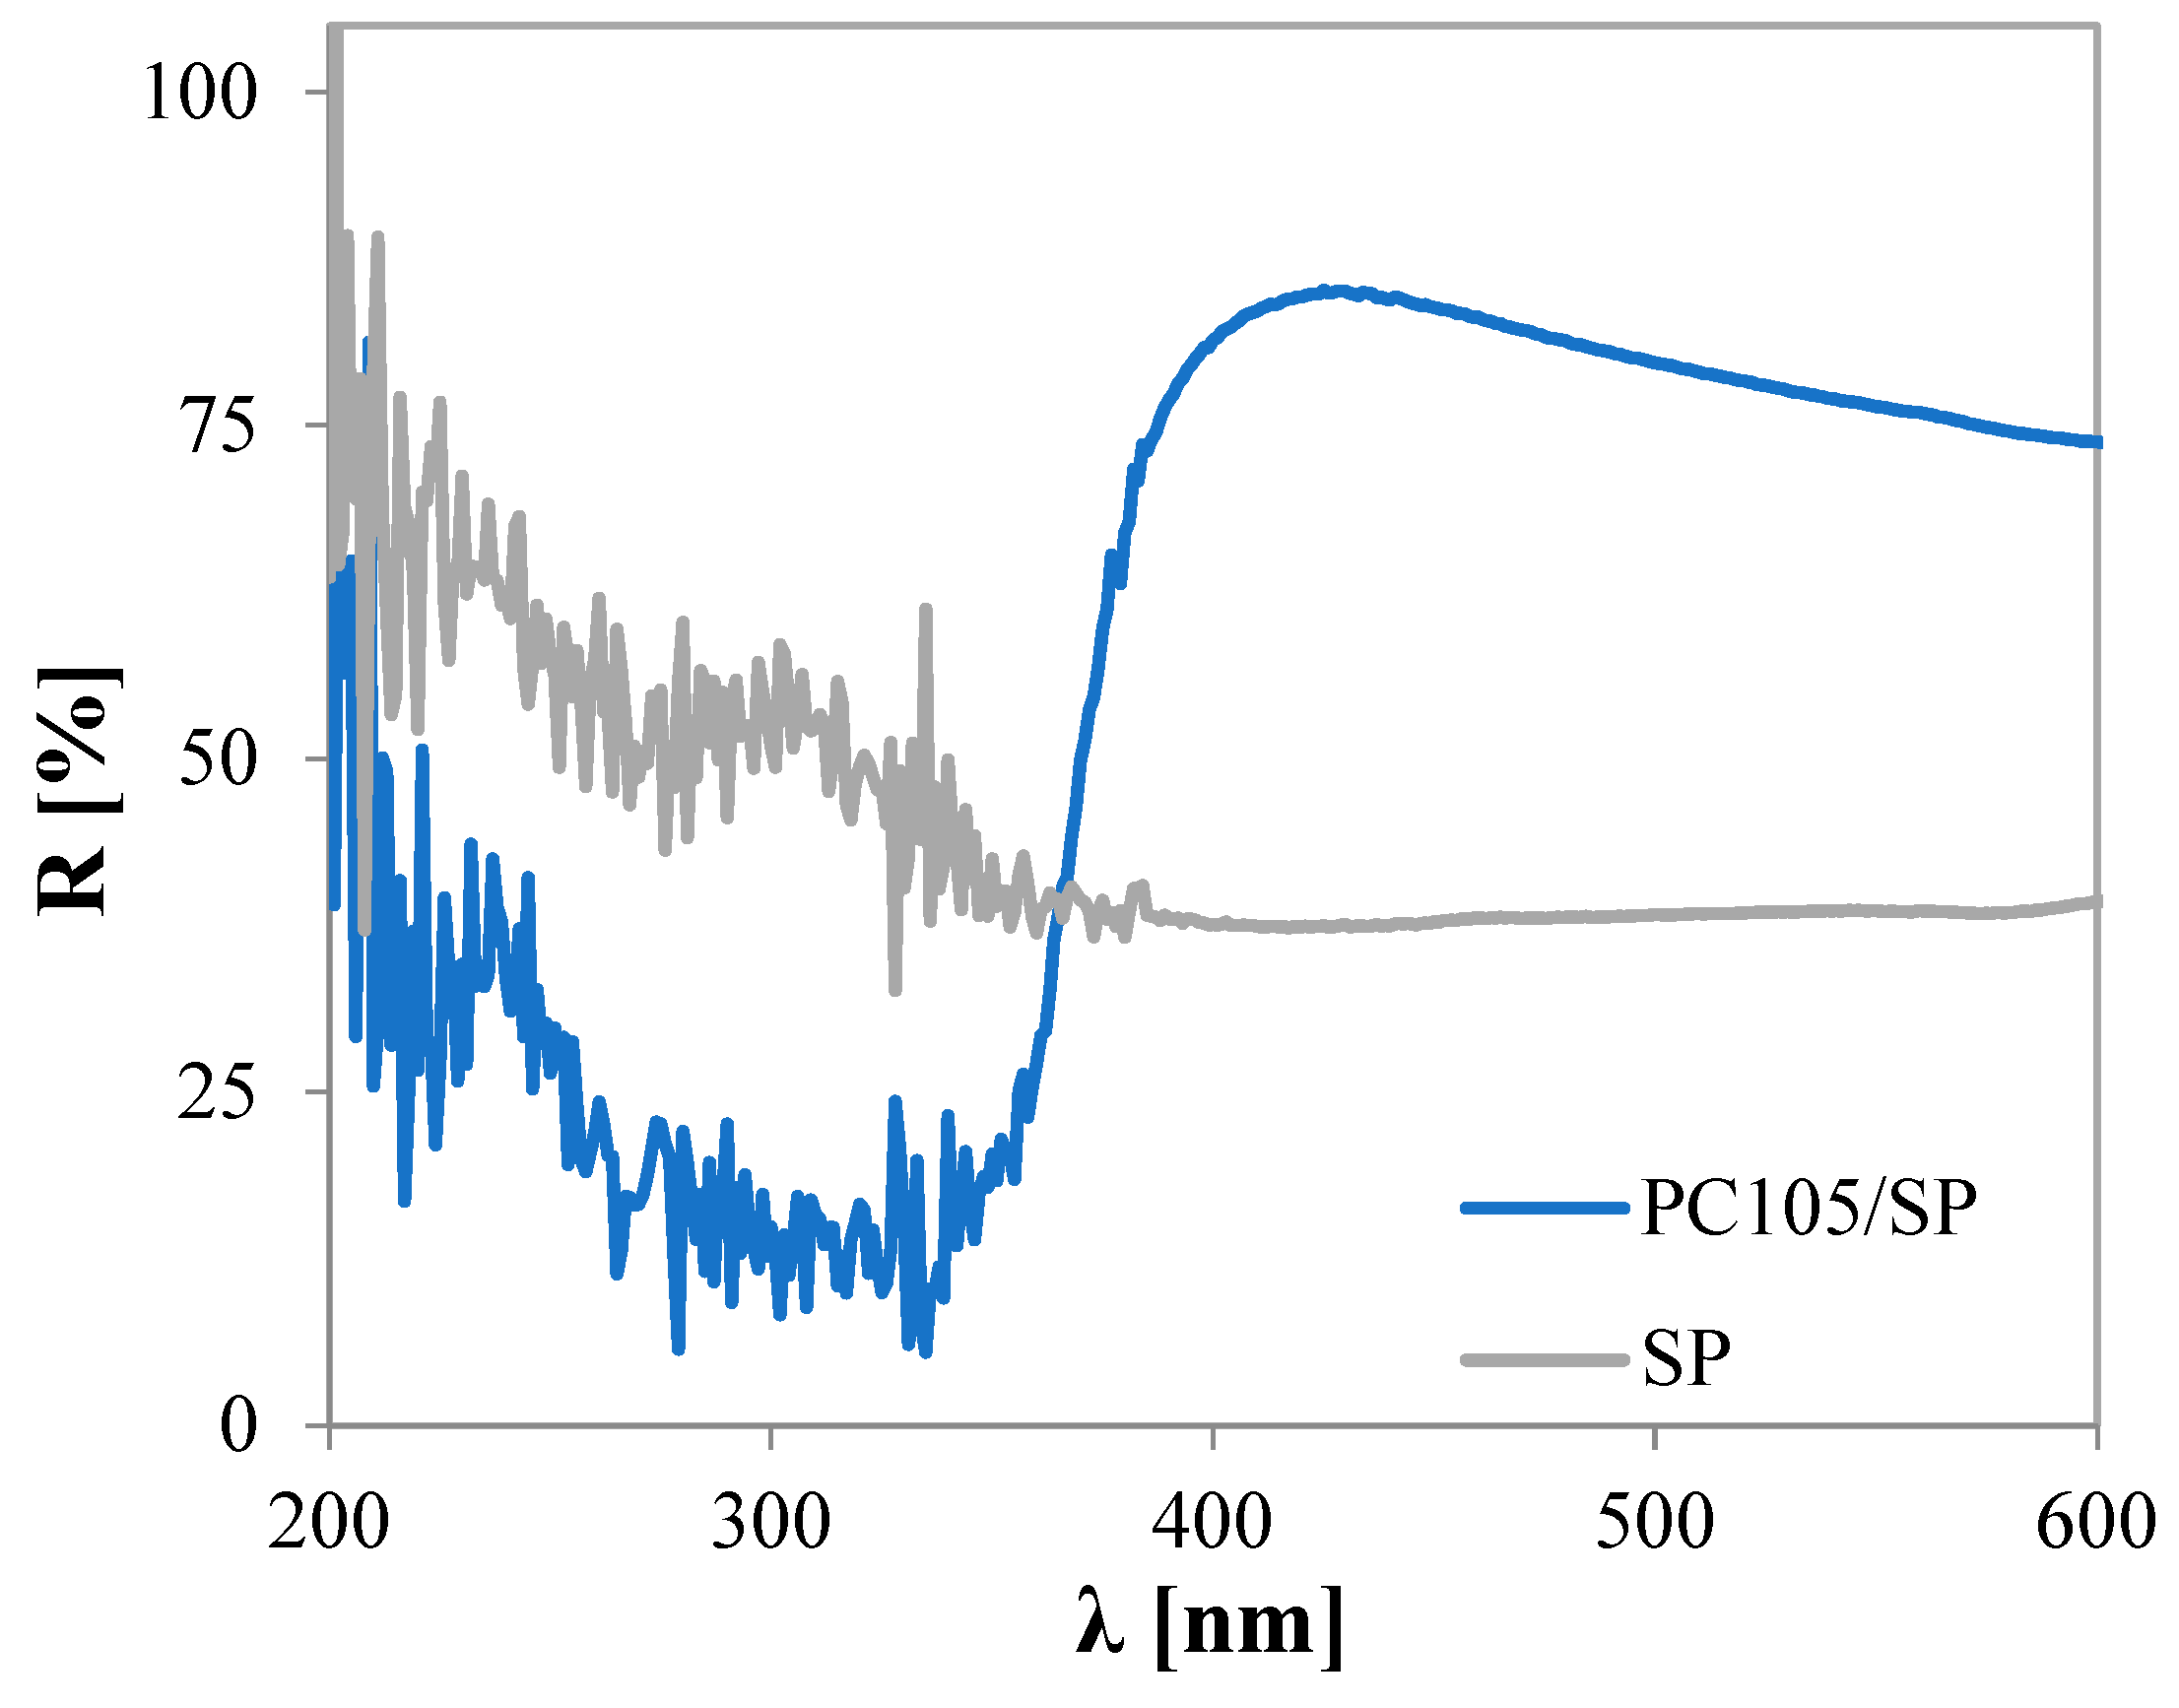
2.1.2. UV–Vis DRS Spectra and Energy Bandgap Calculation

Figure 2 displays the PC105/SP and SP samples’ diffuse reflectance spectra (DRS) in the range of 200–600 nm.
With a wavelength of 400 nm, the PC105/SP exhibited an absorption edge in the UV zone [49], proving the effectiveness of the photocatalyst’s deposition on the support. The SP support constantly partially absorbed the visible light and reflected the ultraviolet light.
As shown in Figure 3, the measurement of the bandgap energy, Eg, is performed using the Tauc plot on the linear portion of (F(R∞)hv)n vs. hν (where n = 1/2 for the indirect bandgap).
This allows one to observe the intercept of the straight line with the photon energy, which corresponds to 3.25 eV and is in excellent agreement with the literature [49].

2.2. Photocatalytic Tests

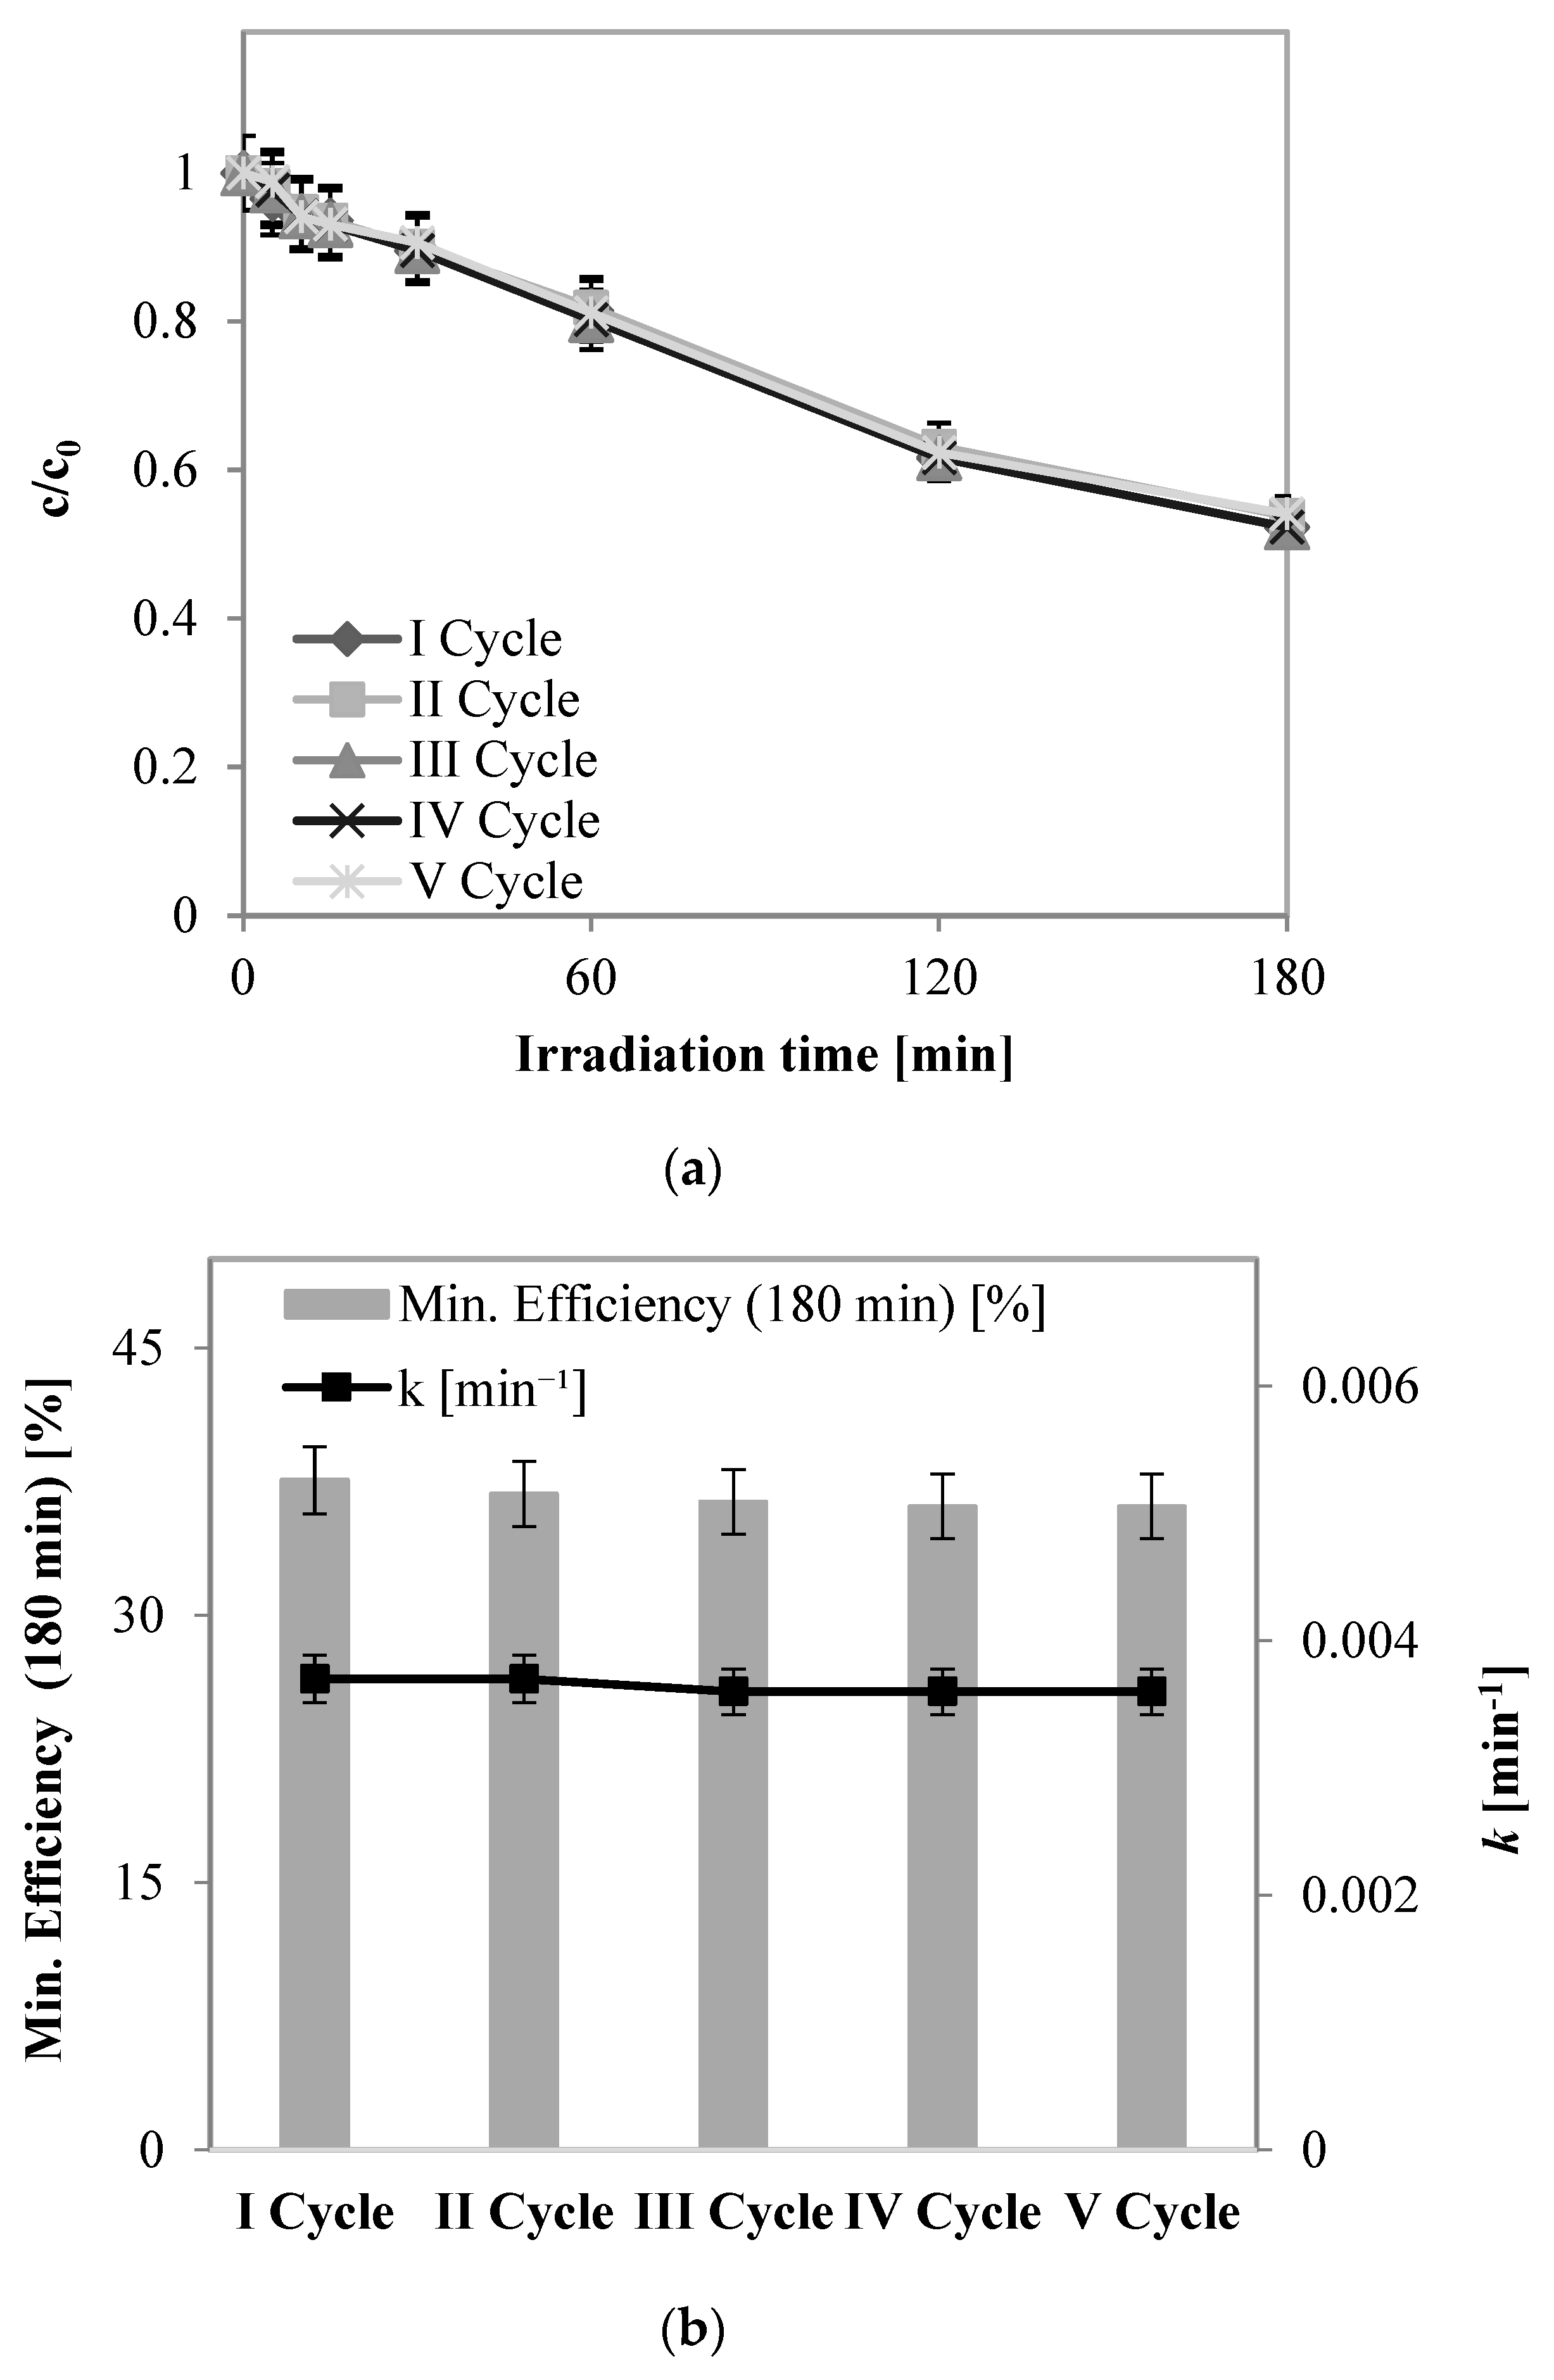
2.2.1. Preliminary Tests: Evaluation of Stability of Structured Photocatalyst

Initially, the stability of the PC105/SP sample was verified by irradiating the structured photocatalyst with UV-A light under FD-dimming modulation. In detail, the fixed on-state LED current and the dimming duty cycle were set to 200 mA and 0.5, respectively, to achieve a Φ value equal to 221 ± 5 W m−2. Five stability cycles were carried out. For each test, the initial phenol concentration was set at 10 ppm.
The results in Figure 4 confirmed the stability of the structured photocatalyst. Indeed, across various tests, the pollutant concentration showed consistent behavior over the irradiation time (Figure 4a), achieving an average phenol removal of about 45% after 180 min of irradiation. Additionally, the mineralization efficiency after 180 min of UV-A light exposure was approximately 36%, with an apparent kinetic degradation constant of around 0.0036 min−1 throughout all the reused cycles (Figure 4b).

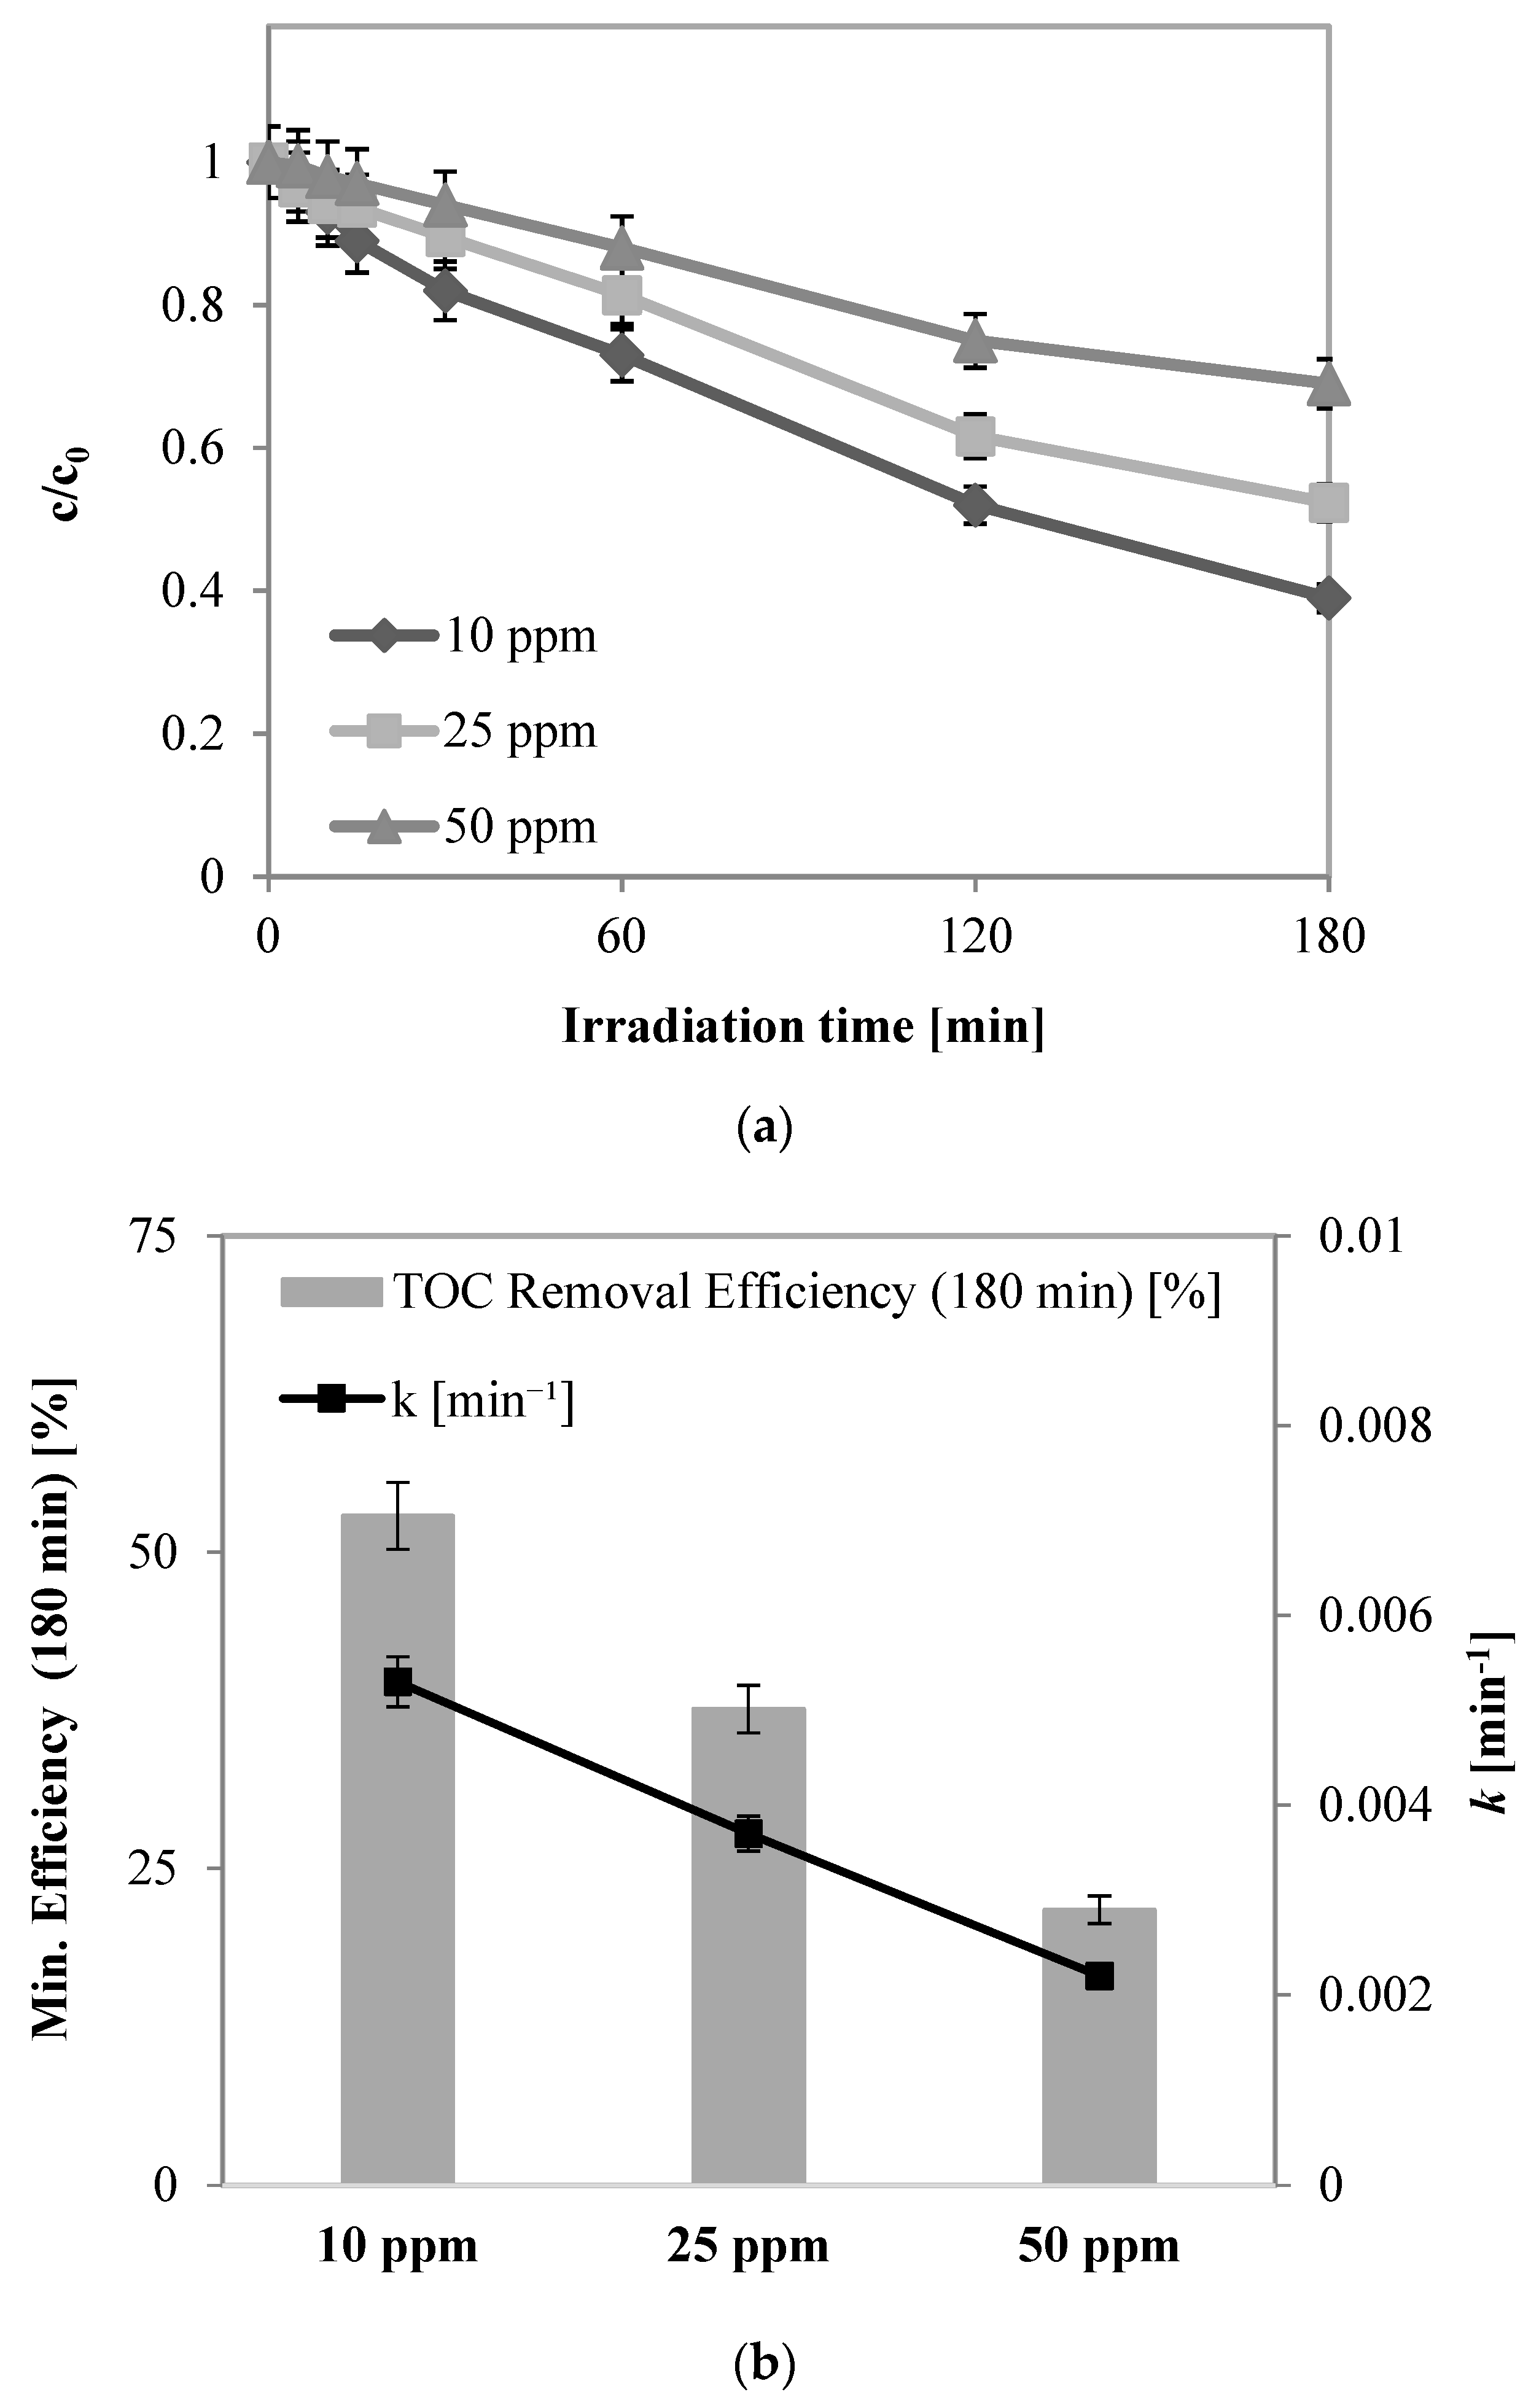
2.2.2. Preliminary Tests: Influence of Initial Phenol Concentration

The influence of the initial phenol concentration on its degradation and mineralization throughout the photocatalytic process was investigated. Experimental tests were conducted with initial pollutant concentrations ranging from 10 to 50 ppm, using FD-dimming modulation with a Φ equal to 221 W m−2. The results are reported in Figure 5 below.
Based on the tests, the maximum photocatalytic activity was enhanced in correspondence to 10 ppm of the phenol initial concentration, with a degradation efficiency of about 61% (Figure 5a) and a TOC removal of 53% (Figure 5b) after 180 min of UV-A light exposure. As expected, the degradation degree was higher at low initial concentrations of phenol, while it decreased at high initial concentrations. With the increase in the initial concentration, an overall reduction in the mineralization efficiency occurred because the higher phenol adsorption on the photocatalysts hindered the photons from reaching the catalyst surfaces. Hence, the productions of hydroxyl and superoxide radicals were reduced; therefore, the photocatalytic efficiency was decreased [50,51]. In particular, at a lower initial concentration (10 ppm), an apparent degradation kinetic constant of 0.0053 min−1 was registered (Figure 5b).

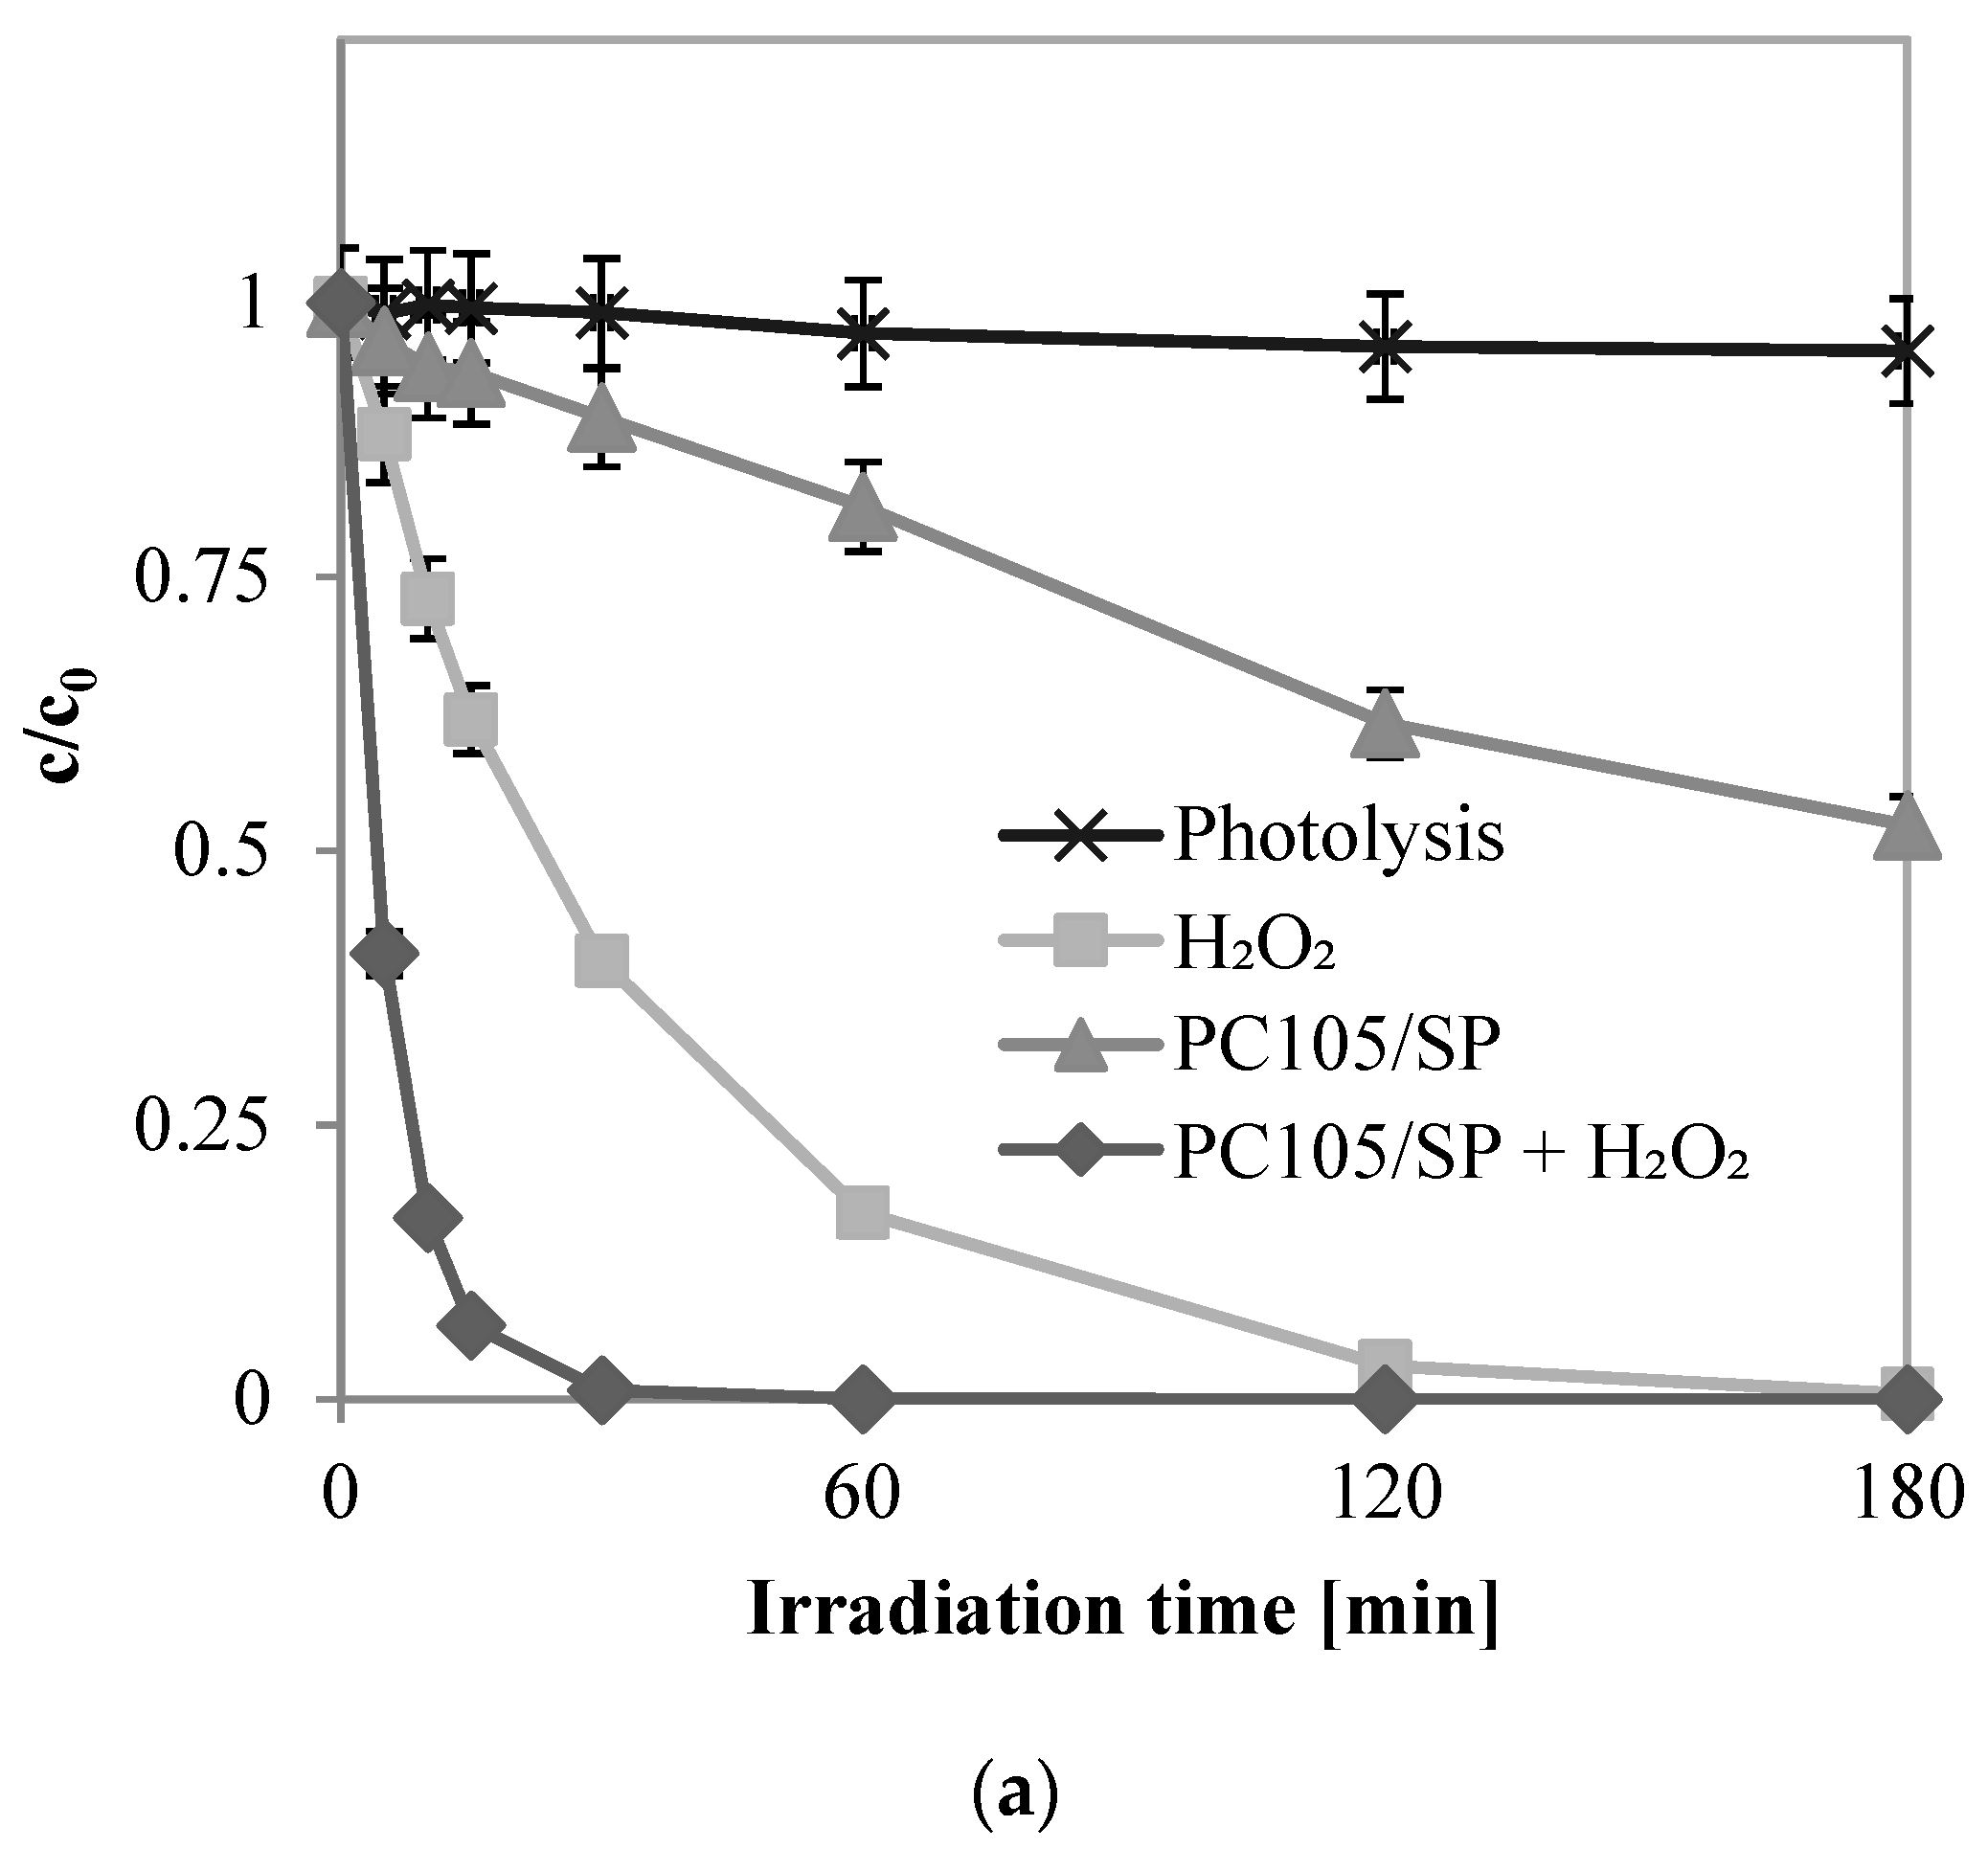
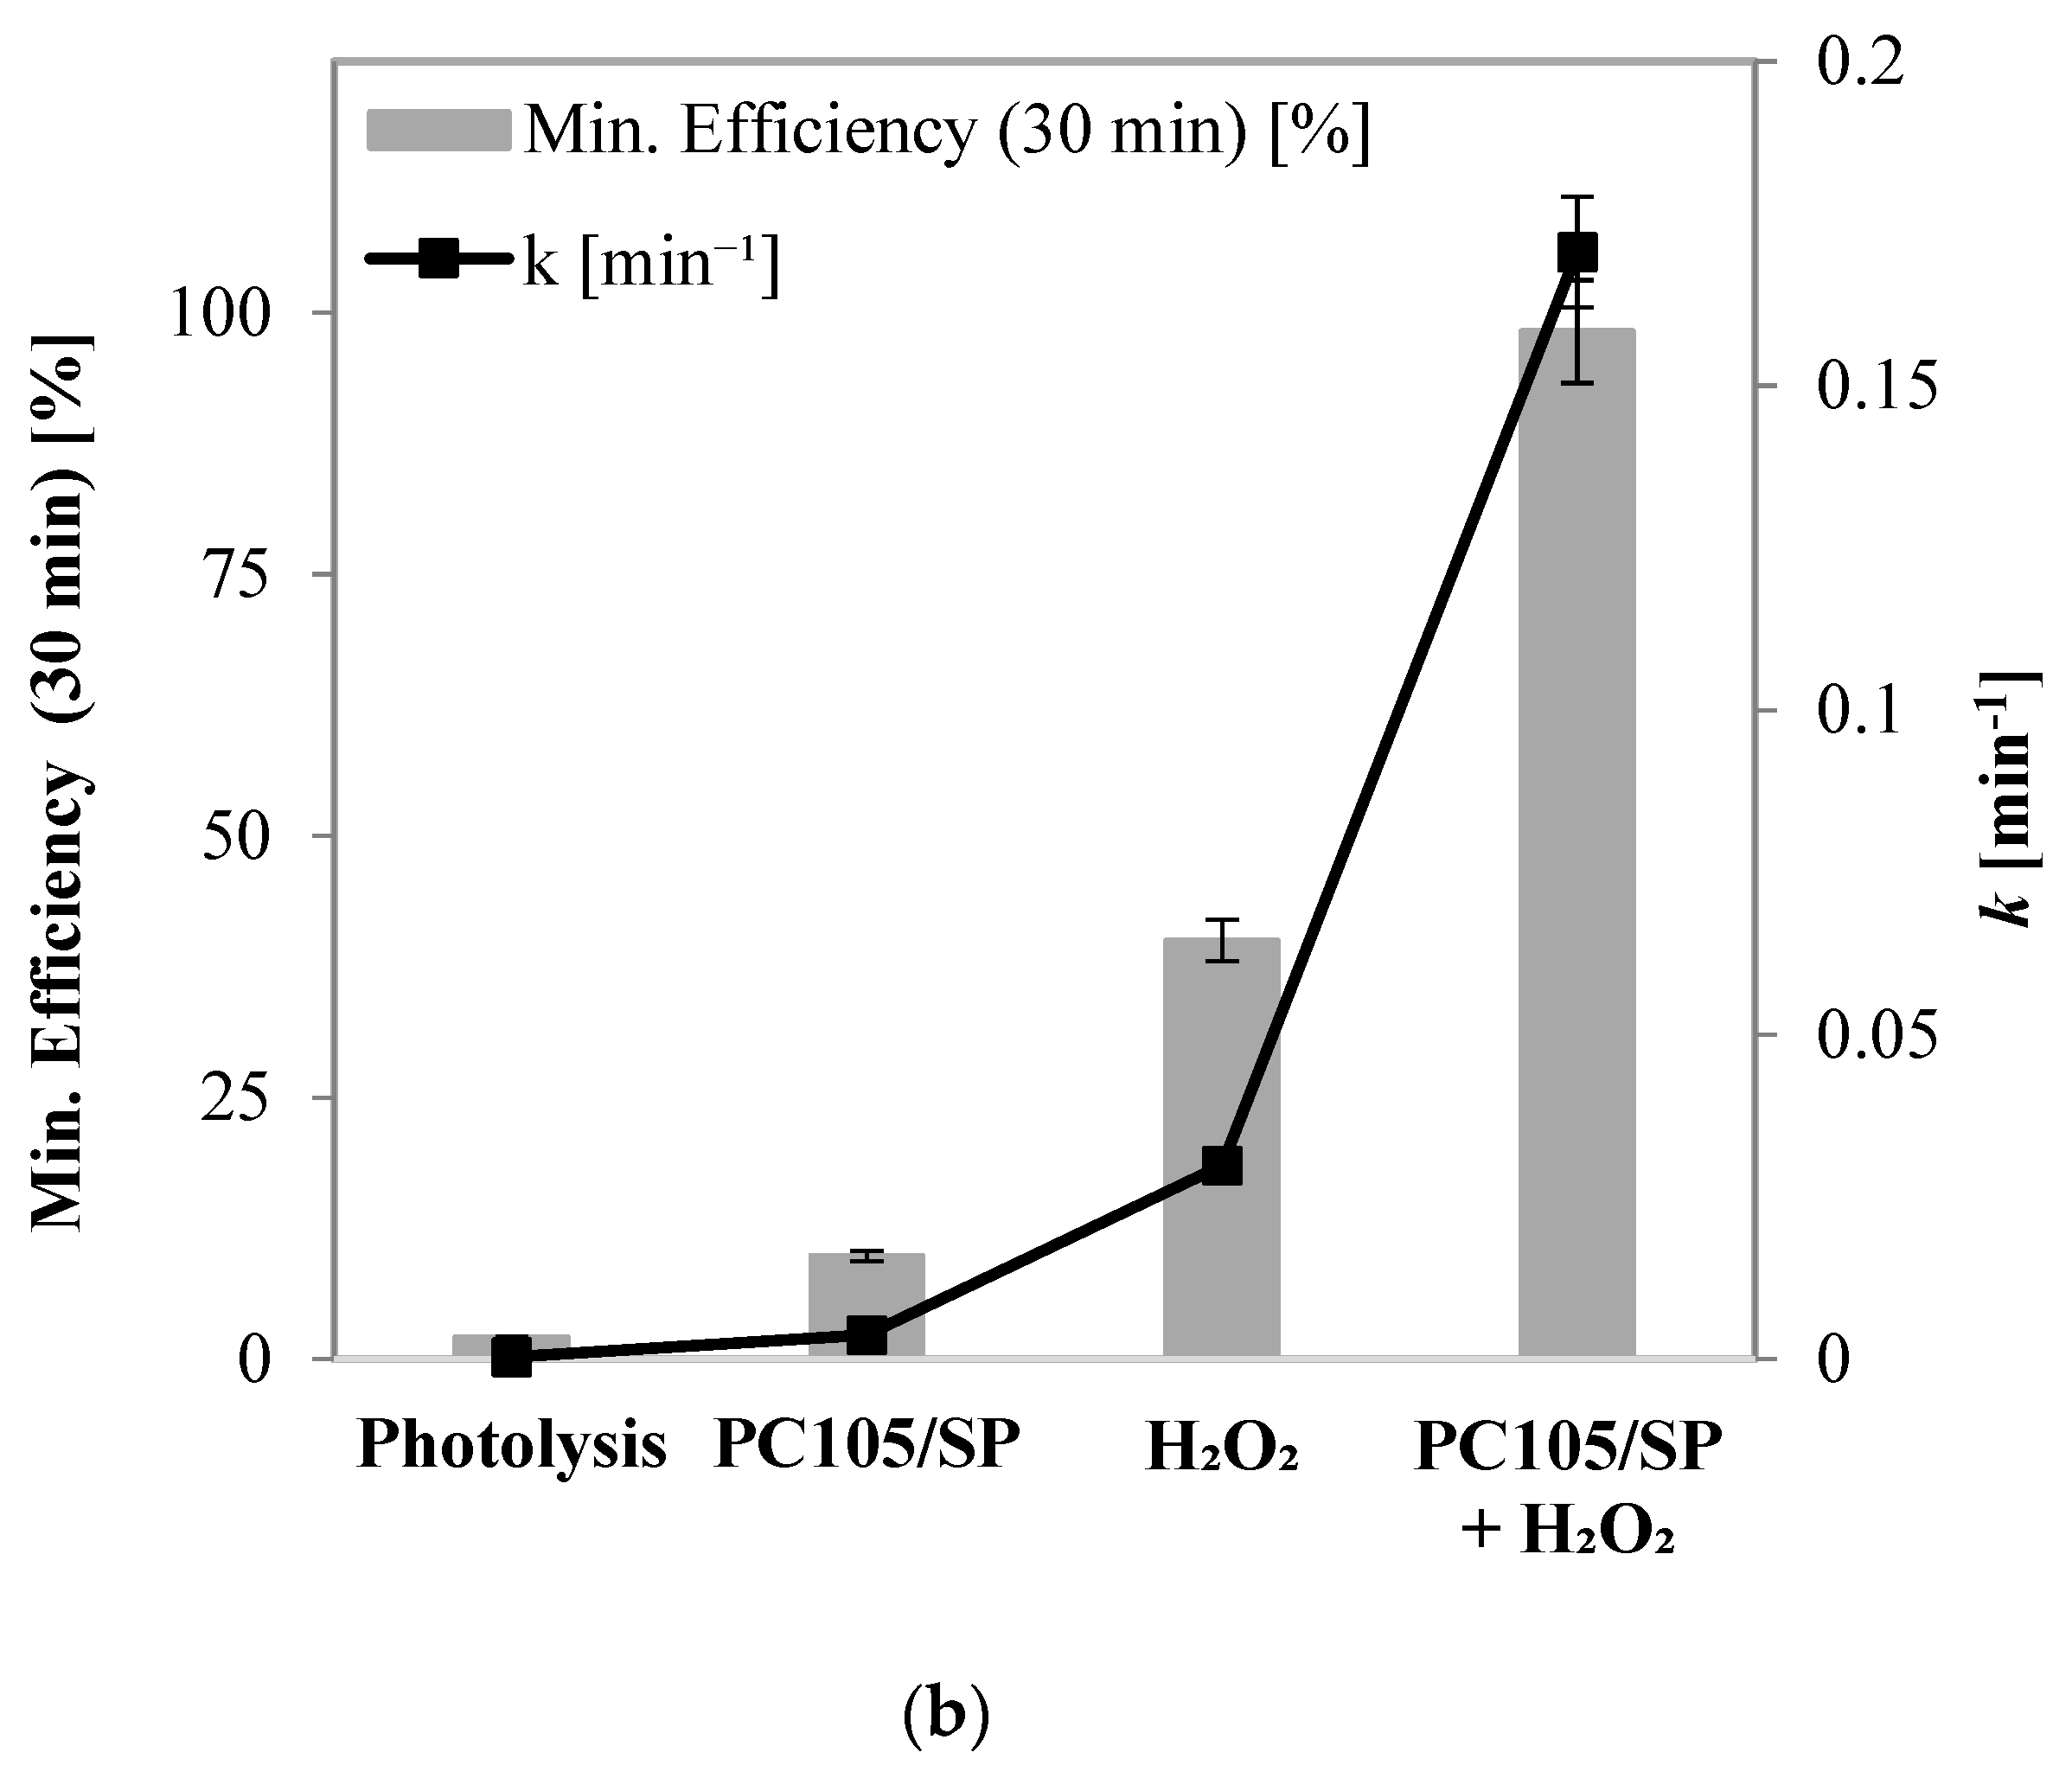
2.2.3. Effects of UV-A, UV-A + H2O2, PC105/SP + UV-A, and PC105/SP + H2O2 + UV-A on Phenol Degradation

Subsequently, the effects of different reaction conditions were evaluated: only UV-A light (photolysis), UV-A light with hydrogen peroxide (H2O2), the structured photocatalyst irradiated by UV-A light (PC105/SP), and the photocatalyst irradiated by UV-A light in the presence of hydrogen peroxide (PC105/SP + H2O2). These tests were conducted by irradiating the structured photocatalyst with FD-dimming modulation and fixing the following operating conditions: (i) c0 = 10 ppm and (ii) a Φ value equal to 221 W m−2.
For tests involving hydrogen peroxide, the initial dosage was set stoichiometrically based on the phenol total oxidation reaction (Equation (5)). This dosage was determined to be 0.05 g L−1.
The results are shown in Figure 6a,b. Photolysis resulted in negligible phenol degradation, with approximately 4% after 180 min of UV-A irradiation. In contrast, the photocatalytic process significantly improved phenol degradation. The structured photocatalyst achieved a 48% degradation of the pollutant after 180 min of UV-A light irradiation.
C 6 H 5 O H + 14   H 2 O 2   17   H 2 O + 6   C O 2
A notable improvement in phenol degradation and mineralization was observed when the process was conducted in the presence of H2O2 under UV-A irradiation, achieving a 40% TOC removal efficiency after 180 min with an apparent phenol degradation rate constant of 0.0298 min−1.
Furthermore, the photocatalytic process with the PC105/SP sample coadjuvated with hydrogen peroxide significantly enhanced phenol degradation, reaching a pollutant removal efficiency of 99% after just 30 min of irradiation. This resulted in an apparent phenol degradation rate constant approximately 46 times higher than with the structured photocatalyst alone. This enhancement was due to hydrogen peroxide accelerating phenol degradation by increasing the formation of hydroxyl radicals, which are the main reactive oxygen species (ROS) involved in phenol mineralization [52,53,54,55]. Based on the literature, a possible reaction mechanism for the PC105/SP + H2O2 process is described as follows:
P C 105 S P + h ν     h + + e
O H + h +   O H
O 2 + e   O 2
H 2 O 2 + h ν     2 O H
C 6 H 5 O H + O H   i n t e r m e d i a t e s   C O 2 + H 2 O

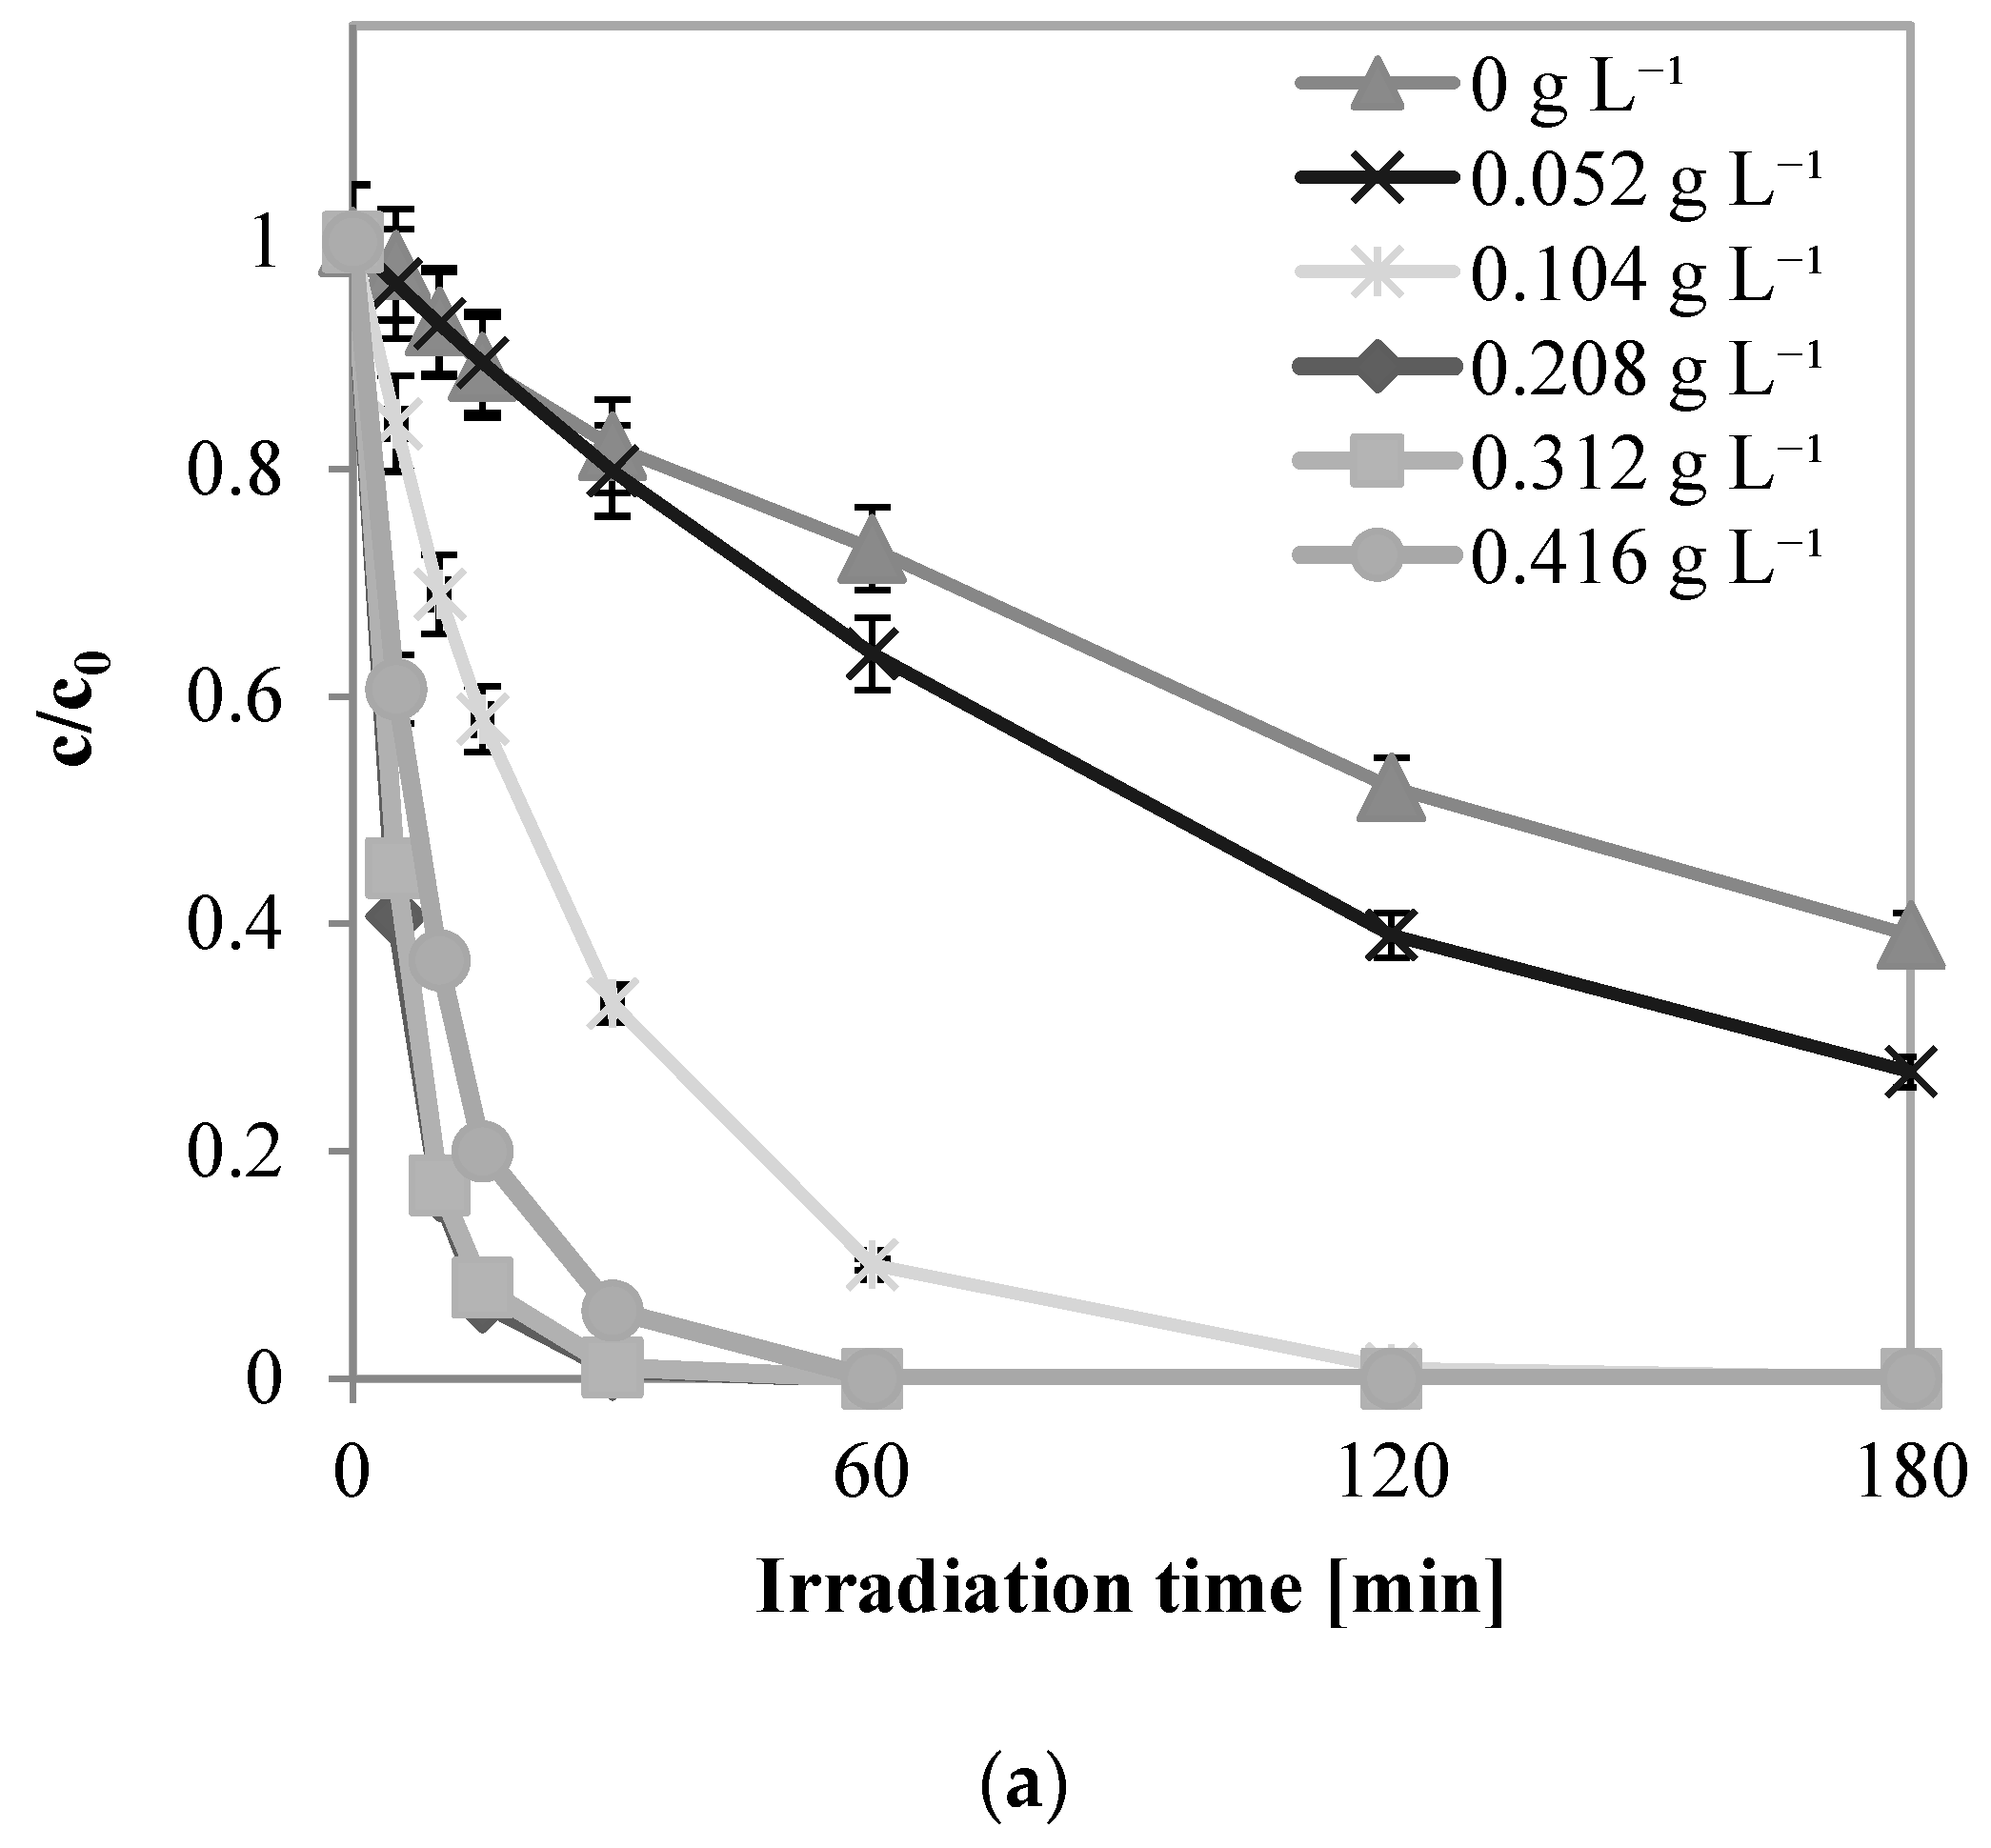
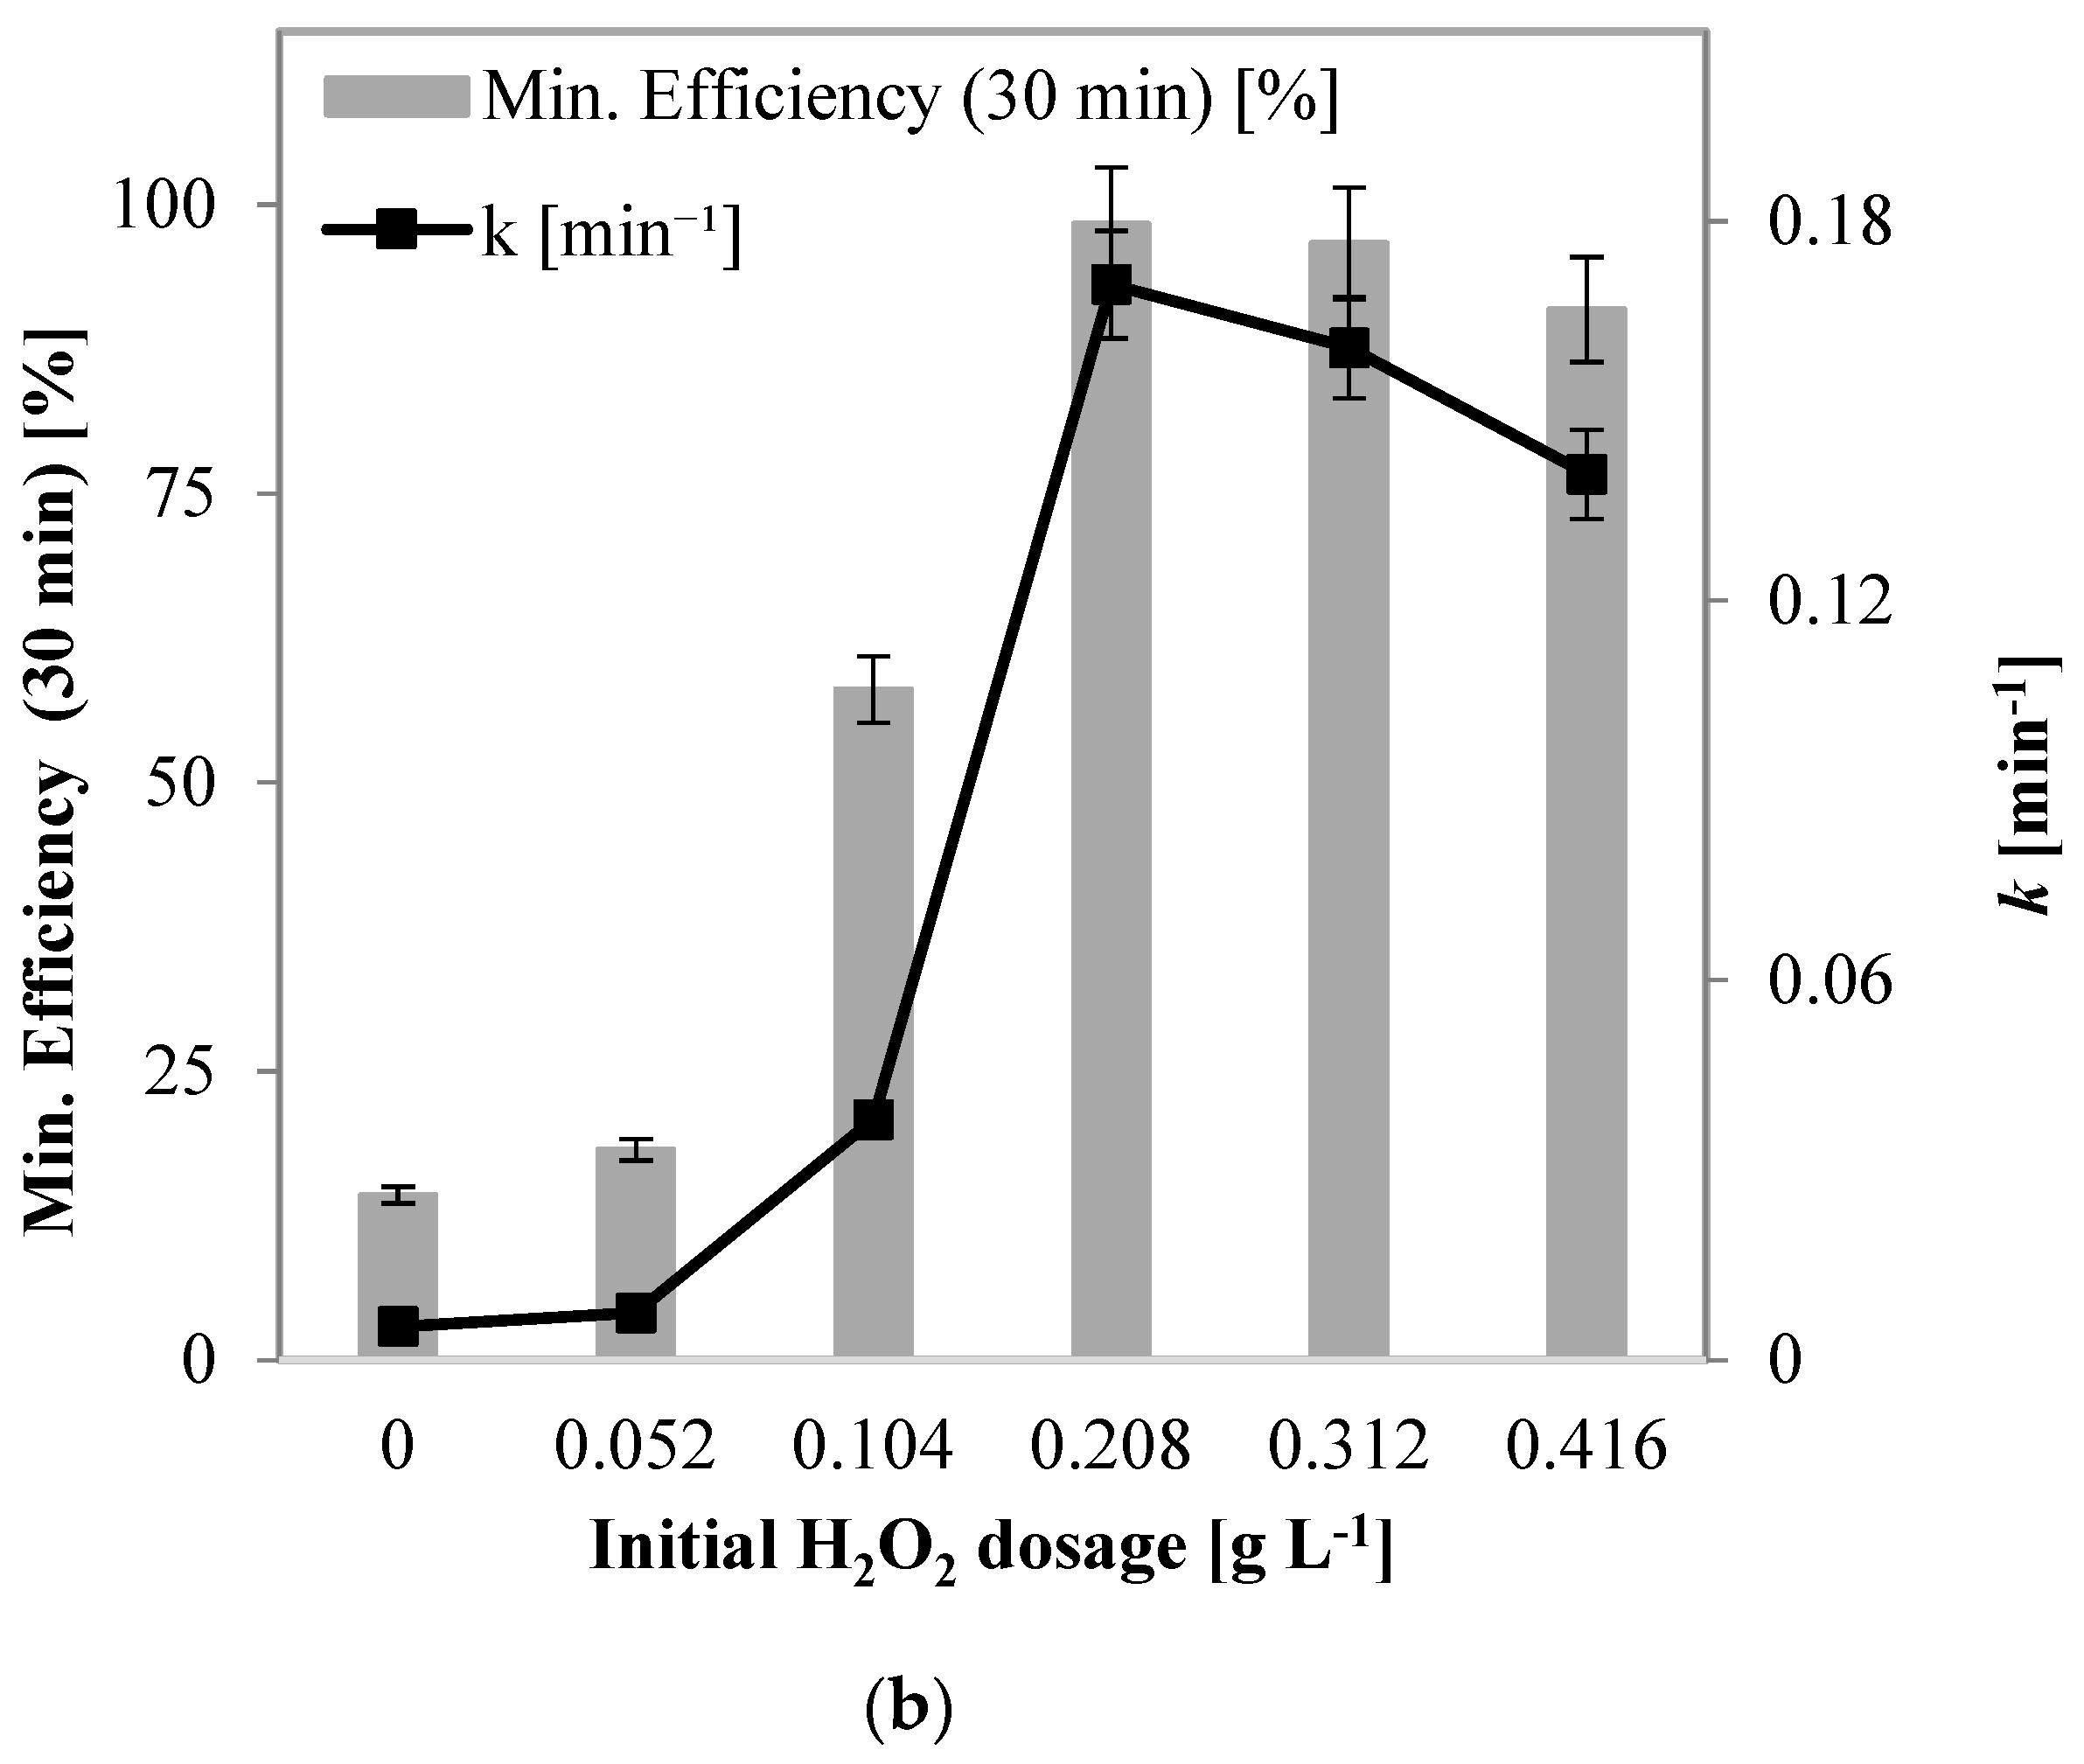
2.2.4. Influence of H2O2 Dosage

The influence of the initial dosage of hydrogen peroxide on the PC105/SP activity was analyzed by varying the dosage from 0 to 0.416 g L−1. These experiments were conducted under previously determined optimal conditions (c0 = 10 ppm and Φ = 221 W m−2).
The effect of the hydrogen peroxide dosage on photocatalytic activity is related to the generation of hydroxyl radicals (OH) and their conversion into hydroperoxide radicals (HO2). The side reaction of H2O2 decomposition into O2 and water occurs parallel to this.
As shown in Figure 7a,b, increasing the H2O2 dosage from 0 to 0.208 g L−1 led to the enhanced degradation and mineralization of the pollutant, attributed to the increased production of hydroxyl radicals. No residual H2O2 up to this dosage was evinced.
However, further increasing the dosage beyond 0.208 g L−1 negatively affected phenol mineralization. This was due to the auto-decomposition of hydrogen peroxide into oxygen and water, and the transformation of hydroxyl radicals into less-oxidizing hydroperoxide radicals [23,56] (Equations (11)–(13)):
2   H 2 O 2     H 2 O + O 2
O H + H 2 O 2     H O 2 + H 2 O
2   O H     H 2 O 2
Therefore, the optimal initial dosage of hydrogen peroxide was 0.208 g L−1. At this dosage, complete oxidant consumption (Figure 8), the highest apparent phenol degradation kinetic constant (0.17 min−1), and maximum mineralization efficiency (98%) after 30 min of UV-A light irradiation were achieved.

2.2.5. Influence of UV-A Light Modulation

Several tests were conducted to analyze the influence of different light modulations on the photocatalytic activity of the reaction system. These experiments were performed under the previously identified optimal operating conditions.
The light modulations studied included: (i) triangular variable duty cycle (T-VD) (triangular variable irradiation), (ii) square-wave variable duty cycle (SW-VD) (square wave variable irradiation), (iii) saw-tooth variable duty cycle (ST-VD) (sawtooth variable irradiation), and (iv) pulse variable duty cycle (P-VD) (pulse variable irradiation).
Each modulation was evaluated by supplying an average current between 33.33 and 167.67 mA (Φmin = 33 ± 5 W m−2 and Φmax = 311 ± 5 W m−2) with a period of 3 s.
The optimal modulation for the photodegradation of the pollutant was T-VD, which achieved the highest phenol degradation (98%) after 10 min of UV-A light exposure. Furthermore, as shown in Figure 9, the reaction system demonstrated rapid pollutant degradation and mineralization across all modulations. Notably, the highest mineralization removal efficiency value after 10 min of UV-A light exposure (96%) and the highest apparent degradation kinetic constant (0.39 min−1) were achieved with S-VD modulation. Moreover, the total hydrogen peroxide consumption after 180 min of irradiation was recorded for all activity tests.
Following the experimental tests, the electric energy consumption for achieving 90% photodegradation of phenol in 1 m3 of contaminated water was evaluated using the correlation proposed by Bolton et al. [57]:
E E / O = P   t 90 %   1000 V   60 ln c t 0 c t
where P is the nominal power of the light source (kW), t90% is the irradiation time to achieve 90% phenol removal (min), V is the volume of the solution treated (L), c(t0) is the phenol concentration at the initial irradiation time (ppm), and c(t) is the phenol concentration at irradiation time t (min).
The electric energy consumption values obtained from the experimental data for the different light modulations are shown in Table 1. The calculated EE/O values highlight that the S-VD modulation reduced electric energy consumption by about 56% compared with FD LED-dimming modulation. Therefore, light modulation significantly enhances the photocatalytic process, coadjuvated with H2O2, for phenol photodegradation under UV-A irradiation, as it substantially reduces electrical energy consumption.

3. Materials and Methods

3.1. Chemicals and Photocatalyst

Tetraethylorthosilicate (TEOS, 98%, Sigma-Aldrich), hydrochloric acid solution (HCl, 37% (w/w) in H2O, Carlo Erba), 2-propanol (HPLC, VWR Chemicals, Dresden, Germany), hydrogen peroxide solution (H2O2, 30% (w/w) in H2O, Sigma Aldrich ITALIA, Milano, Italy), titanium(IV) oxysulfate solution (TiOSO4 ∼ 15% (w/w) in dilute sulfuric acid ≥99.99%, Sigma Aldrich), phenol (C6H5OH, Sigma Aldrich, ≥99%), the steel plate (Officina elettromeccanica Mormile, Caivano, Italy), distilled water, and PC105 (TiO2 anatase, 78 m2/g, from Millennium Inorganic Chemicals Hunt Valley, Cockeysville, MD, USA) were purchased. All reagents were used without further purification treatment. The molecular structure of phenol is shown in Figure S1.

3.2. Preparation of the Structured Photocatalyst PC105/SP

The PC105 nanopowders were deposed onto a wide steel plate (30 cm × 10 cm; A = 300 cm2) using a sol–gel method with a silica binder reported in the literature [29]. The stainless-steel plate was (Figure 10a) chosen for the favorable reflection of radiation if the latter overcomes the photocatalyst whole layer.
For the preparation of the silica binder, 45 mL of TEOS was mixed under stirring with 935 μL of hydrochloric acid solution. Subsequently, about 205 mL of 2-propanol was added dropwise, and the solution was stirred for 8 h. For the photocatalyst deposition, 10 mL of the silica binder was placed in a beaker with 1.6 g of PC105, adding 33 mL of 2-propanol dropwise. The suspension was stirred for 8 min. Subsequently, the suspension was brushed onto the plate layer by layer. After passing the single layer, the sample was placed in an oven for 30 min at 100 °C. This procedure was repeated 6 times. The theoretical TiO2 coating on the structured photocatalyst was equal to 2.23 mg cm−2 (Figure 10b).

3.3. Raman Spectra Acquisition

An integrated confocal micro-Raman system (Invia Micro-Raman, Renishaw, Wotton-under-Edge, UK) was used to acquire the Raman spectra. It had three internal lasers that were used as excitation wavelength sources: a diode (785 nm), HeNe (632.8 nm), and Nd:YAG (514 nm). Notch filters are used in the spectrometer to filter out the Rayleigh excitation line. Radiation at 514 nm was used for the measurements, with an actual output power of 25 mW. A Si wafer was used for the Raman shift calibration. At a magnitude of 20×, the spectra were obtained on focalized powder and stainless-steel layered samples under atmospheric conditions. The surface was examined at at least four points.

3.4. Determination of Specific Surface Area

The specific surface area (SSA) was measured using a Costech Sorptometer 1042 instrument (Costech International s.r.l., Pioltello (MI), Italy) after dynamic N2 adsorption at a low temperature (−196 °C) by the samples. The samples were pre-treated in a He flow for 30 min at 150 °C before the measurements.

3.5. UV–Vis DRS Analysis

Using ultraviolet–visible diffuse reflectance spectroscopy (UV–vis DRS), the light absorption properties of the synthesized photocatalysts were examined. A Perkin–Elmer spectrophotometer Lambda 35 (PerkinElmer, Waltham, MA, USA) equipped with a reflection sphere with a 0° sample positioning holder (Labsphere Inc., North Sutton, NH, USA) was used to produce the reflectance spectra. A certified Teflon blank sample was used as a reference. As a function of the wavelength, the reflectance data were expressed in terms of the Kubelka–Munk values (F(R∞)). (F(R∞) hv)0.5 vs. hν (eV) plotting was used to calculate the samples’ indirect bandgap.

3.6. Experimental Setup Used for Phenol Mineralization Tests

The tests for the mineralization of phenol with a photocatalytic process coadjuvated with hydrogen peroxide were conducted using a batch reaction system consisting of a recirculating flat-geometry photoreactor illuminated by a matrix of UV-A LEDs with an emission peak at 365 nm.
A simplified scheme of the experimental setup is shown in Figure 11. The photocatalytic system used for the tests included the photoreactor (height: 20 cm, length: 10 cm, and thickness: 1 cm), a UV-A LED matrix, an LED driver (Power Stage), a peristaltic pump for liquid recirculation, a tank containing the solution to be treated, and a reactor cooling system. In detail, for each experimental activity test, the stirred tank (equipped with a magnetic stirrer) was filled with 450 mL of an aqueous solution containing a fixed initial phenol concentration. A peristaltic pump maintained a recirculation flow rate of 28 mL min−1, ensuring the liquid stream flowed over the surface of the structured photocatalyst. The liquid then emerged from the top of the photoreactor and returned to the stirred tank.
The photoreactor was designed and implemented by the spin-off IPERA s.r.l. It was made with a flat geometry to ensure that the photon flow and, consequently, the intensity of the incident light within the reaction system were uniform and to maximize the efficiency of excitation of the structured photocatalyst [38]. There were two distinct operating compartments in the reactor. In each of them, there was a Pyrex window that transmitted UV-A light. To avoid light leaks outside the system, and uniformly excite the structured photocatalyst, an array of UV-A LEDs was placed next to the Pyrex windows. It was fixed on a heatsink and connected to an LED driver with digital control. Specifically, the light source was made up of a 30 × 15 cm single-layer aluminum printed circuit with 240 LEDs placed on it in 24 parallel rows, each with 10 LEDs separated by 1.05 cm. In addition, the LEDs were arranged into different strings that were individually accessible via 12 connectors that were placed on the board’s sides. Each LED string had its own power source, and the LED driver controlled the light modulation. Details of the light modulations tested are provided in Section SM1 and Figure S2 of the Supplementary Material.
The photocatalytic activity experiments were conducted using LTPL-C034UVH365 UV-A LEDs (supplied by Exeling s.r.l., Avellino, Italy) with a typical forward voltage drop of 3.5 V at 200 mA DC. The arrangement of the LEDs in the matrix was designed to optimize the uniformity of the light incident on the structured photocatalyst [58]. In particular, a triangular pattern with a 1.1 cm reticule distance was adopted. The matrix fitted only the transparent window of the photoreactor and was very closely placed, so the loss of radiation was negligible. The relationship between the incident light intensity on the photocatalyst’s surface (Φ) and the average current supplied to the LEDs was measured using a StellarNet Inc. (14390 Carlson Circle|Tampa, FL 33626, USA) spectroradiometer, as depicted in Figure 12.
As the supplied current intensity increased, the saturation effects became evident, indicating a decrease in the light source’s reactivity and efficiency [59]. This analysis demonstrated that using a current greater than 133 mA to power the light source was not advantageous, as the LEDs’ luminous efficiency showed minimal improvement.

3.7. Analytical Techniques Used for the Test Results Analysis

Each experimental test lasted 300 min in total, starting with a 120 min dark phase. After this period, the LEDs were turned on, beginning the light phase. During the following 180 min of irradiation, aqueous samples were collected at intervals of 15, 30, 60, 120, and 180 min. No pH changes in all tests were induced concerning the spontaneous pH of the phenol solution, equal to 6.4.
The residual phenol concentration in these samples was measured using a Perkin–Elmer UV–vis spectrophotometer at a wavelength of 270 nm [23]. The total organic carbon (TOC) in the aqueous solutions was measured using the high-temperature combustion method in a tubular-flow microreactor. The reactor, operated at 680 °C, utilized a Pt-Al2O3 catalyst and a stream of hydrocarbon-free air to oxidize the organic carbon [60]. A kinetic analysis of the photocatalytic degradation of phenol was conducted using the Langmuir–Hinshelwood model, a standard approach for describing the kinetics of photocatalytic processes [61]. The degradation rate (r) was derived and expressed as follows:
r = d c d t = k r   K a d   c 1 + K a d   c
where k r , K a d , and c represent the kinetic constant, the adsorption equilibrium constant, and the pollutant concentration, respectively.
Given that the pollutant concentration was low, the above equation could be simplified to a first-order kinetics expression with an apparent degradation kinetic constant ( k ):
r = k r   K a d   c = k   c
The apparent degradation kinetic constant (k) could be determined from the slope of the straight line obtained by plotting ln(c0/c) vs. the irradiation time (t). In addition, the TOC removal (mineralization) and phenol removal (degradation) efficiencies at a given irradiation time were evaluated using the following relationships:
M i n e r a l i z a t i o n   e f f i c i e n c y   t = 1 T O C t T O C 0   · 100
D e g r a d a t i o n   e f f i c i e n c y   t = 1 c t c 0   · 100
where TOC(t) is the total organic carbon at a specific irradiation time (ppm), TOC0 is the initial total organic carbon (ppm), c(t) is the phenol concentration at a specific irradiation time (ppm), and c0 is the initial phenol concentration (ppm).

4. Conclusions

In this study, the effectiveness of heterogeneous photocatalysis assisted by hydrogen peroxide for the mineralization of phenol in aqueous solution was analyzed. The experimental setup consisted of a fixed-bed photocatalytic reactor with a flat-plate geometry, utilizing UV-A LEDs for irradiation. The commercial TiO2 PC105 photocatalyst was immobilized on a steel plate (SP) using a sol–gel method with a silica binder to create a structured photocatalyst (PC105/SP), which was then loaded onto the photoreactor.
The structured photocatalyst was characterized using Raman spectroscopy, specific surface area measurements, and UV-DRS analysis, revealing the formation of a titania coating in the anatase phase with a bandgap energy of 3.25 eV, and an almost uniform distribution on the SP surface. The responsiveness and efficiency of the LEDs relative to the current intensity were evaluated with a StellarNet Inc. spectroradiometer. The stability of the photocatalysts’ activity and the influence of the operating parameters were examined during the mineralization of 450 mL of the phenol solution. Various LED-dimming techniques were tested, including a fixed duty cycle, sinusoidal variable duty cycle, triangular variable duty cycle, square-wave variable duty cycle, saw-tooth variable duty cycle, pulse variable duty cycle, and pseudo-sinusoidal variable duty cycle.
The optimal operating parameters were found to be an initial phenol concentration of 10 ppm, a hydrogen peroxide dosage of 0.208 g L−1, and triangular variable duty cycle light modulation with an average current between 33.33 and 166.67 mA, and a period of 3 s. Under these conditions, the highest apparent phenol degradation kinetic constant (0.39 min−1) and the highest mineralization efficiency after only 10 min of ultraviolet irradiation (96%) were achieved.
Finally, the energy consumption for the mineralization of 90% phenol in one cubic meter of treated water (EE/O) was determined. The analysis demonstrated a significant intensification of the process through light modulation, with the triangular variable duty cycle modulation reducing the electrical energy consumption by approximately 56% compared with FD LED-dimming modulation.

Supplementary Materials

The following supporting information can be downloaded at: https://www.mdpi.com/article/10.3390/catal14080544/s1, Figure S1: Molecular structure of phenol; Paragraph SM.1: Dimming techniques for light modulation; Figure S2: Diagram of the LED driver module; Paragraph SM.2: Influence of incident light intensity [38,62]; Figure S3: (a) Phenol degradation under UV-A light irradiation registered for different Φ values; (b) mineralization efficiency after 180 min of irradiation and apparent kinetic degradation constant values obtained for different Φ values.

Author Contributions

Conceptualization, N.F. and D.S.; data curation, N.M., L.D.G., N.O., G.D.C., V.V. and D.S.; formal analysis, N.M. and G.D.C.; investigation, L.D.G. and K.M.; methodology, N.M. and V.V.; resources, L.D.G., N.O., N.F. and D.S.; supervision, N.F. and D.S.; validation, N.O. and V.V.; visualization, G.D.C.; writing—original draft, N.M. and K.M.; writing—review and editing, D.S. All authors have read and agreed to the published version of the manuscript.

Funding

This research received no external funding. University of Salerno is acknowledged for the projects 300365FRB22SANNI “Processi fotocatalitici intensificati tramite l’impiego della modulazione dell’intensità luminosa” and 300638FRB22FEMIA “Elettronica Per La Fotocatalisi”.

Data Availability Statement

The data presented in this study will be made available upon request from the corresponding author.

Conflicts of Interest

The authors declare no conflicts of interest.

References

  1. Galeas, S.; Valdivieso-Ramírez, C.S.; Pontón, P.I.; Guerrero, V.H.; Goetz, V. Photocatalytic degradation of phenol under visible light irradiation by using ferrous oxalate synthesized from iron-rich mineral sands via a green hydrothermal route. Environ. Technol. Innov. 2023, 32, 103325. [Google Scholar] [CrossRef]
  2. Bibi, A.; Bibi, S.; Abu-Dieyeh, M.; Al-Ghouti, M.A. Towards sustainable physiochemical and biological techniques for the remediation of phenol from wastewater: A review on current applications and removal mechanisms. J. Clean. Prod. 2023, 417, 137810. [Google Scholar] [CrossRef]
  3. Zulfiqar, M.; Sufian, S.; Rabat, N.E.; Mansor, N. Photocatalytic degradation and adsorption of phenol by solvent-controlled TiO2 nanosheets assisted with H2O2 and FeCl3: Kinetic, isotherm and thermodynamic analysis. J. Mol. Liq. 2020, 308, 112941. [Google Scholar] [CrossRef]
  4. Veerakumar, P.; Sangili, A.; Chen, S.M.; Kumar, R.S.; Arivalagan, G.; Firdhouse, M.J.; Hameed, K.S.; Sivakumar, S. Photocatalytic degradation of phenolic pollutants over palladium-tungsten trioxide nanocomposite. Chem. Eng. J. 2024, 489, 151127. [Google Scholar] [CrossRef]
  5. Tan, L.; Feng, H.; Li, L.; Lin, H.; Xiong, J. Phenol degradation by a combined hydrogenation and photocatalytic oxidation over the bifunctional Rh/WO3 catalyst. J. Environ. Chem. Eng. 2024, 12, 112020. [Google Scholar] [CrossRef]
  6. Zhang, Y.; Li, Y.; Tabassum, S. Based on nanocomposites for degradation of phenolic compounds from aqueous environments by advanced oxidation processes: A review. J. Water Process Eng. 2024, 61, 105286. [Google Scholar] [CrossRef]
  7. Yadav, G.; Ahmaruzzaman, M. Recent development of novel nanocomposites for photocatalysis mediated remediation of phenolic derivatives: A comprehensive review. J. Ind. Eng. Chem. 2023, 127, 18–35. [Google Scholar] [CrossRef]
  8. Firoozi, M.; Hashemi, M.; Narooie, M.R.; Daraei, H. Evaluation of phenol degradation rate using advanced oxidation/reduction process (ao/rp) in the presence of sulfite and zinc oxide under uv. Optik 2023, 279, 170787. [Google Scholar] [CrossRef]
  9. Andries, D.M.; Garrido, A.; De Stefano, L. The evolution of the eu drinking water policy towards a source-to-mouth approach. Int. J. Water Resour. Dev. 2024, 40, 723–745. [Google Scholar] [CrossRef]
  10. Naguib, D.M.; Badawy, N.M. Phenol removal from wastewater using waste products. J. Environ. Chem. Eng. 2020, 8, 103592. [Google Scholar] [CrossRef]
  11. Mumtaz, F.; Li, B.; Al Shehhi, M.R.; Feng, X.; Wang, K. Treatment of phenolic-wastewater by hybrid technologies: A review. J. Water Process Eng. 2024, 57, 104695. [Google Scholar] [CrossRef]
  12. Aslam, Z.; Alam, P.; Islam, R.; Khan, A.H.; Samaraweera, H.; Hussain, A.; Zargar, T.I. Recent developments in moving bed biofilm reactor (mbbr) for the treatment of phenolic wastewater—A review. J. Taiwan Inst. Chem. Eng. 2024, 105517. [Google Scholar] [CrossRef]
  13. Melo, J.; Lütke, S.; Igansi, A.; Franco, D.; Vicenti, J.; Dotto, G.; Pinto, L.; Cadaval, T.C., Jr.; Felipe, C. Mass transfer and equilibrium modelings of phenol adsorption on activated carbon from olive stone. Colloids Surf. A Physicochem. Eng. Asp. 2024, 680, 132628. [Google Scholar] [CrossRef]
  14. Zhao, Y.; Tong, J. Investigation of the extraction ability and mechanism of environmentally friendly ionic liquids for phenol in the model oil. Fuel 2023, 341, 127673. [Google Scholar] [CrossRef]
  15. Kavian, N.; Asadollahfardi, G.; Hasanbeigi, A.; Delnavaz, M.; Samadi, A. Degradation of phenol in wastewater through an integrated dielectric barrier discharge and fenton/photo-fenton process. Ecotoxicol. Environ. Saf. 2024, 271, 115937. [Google Scholar] [CrossRef]
  16. Cheng, A.; He, Y.; Liu, X.; He, C. Honeycomb-like biochar framework coupled with Fe3O4/FeS nanoparticles as efficient heterogeneous fenton catalyst for phenol degradation. J. Environ. Sci. 2024, 136, 390–399. [Google Scholar] [CrossRef]
  17. Fan, Y.; Wan, C.; Zhao, X.; Li, M.; Wu, C. Ce-doped lamno3-δ perovskite as an efficient ozonation catalyst for the degradation of high-concentration phenol wastewater. J. Environ. Chem. Eng. 2024, 12, 112761. [Google Scholar] [CrossRef]
  18. Song, Z.; Wu, X.; He, Q.; Xiang, P.; Ma, P.; Miao, Z. Degradation of phenol in high-salt wastewater by three-dimensional fecu co-doped materials: Interaction of FeCu with g-C3N4–rGO and synergistic catalytic mechanism. J. Environ. Chem. Eng. 2024, 12, 112164. [Google Scholar] [CrossRef]
  19. Mandal, R.; Mandal, A.; Mukherjee, M.; Pandit, N.; Mukherjee, B. Mechanochemically synthesized MnO2-gcn nanocomposite for photocatalytic dye and phenol degradation: A combined experiment and dft study. Micro Nano Eng. 2024, 22, 100240. [Google Scholar] [CrossRef]
  20. Chen, Y.; Long, L.; Luo, Y.; Zeng, B.; Liu, Z.; Shao, Q.; Wu, F.; Xie, P.; Ma, J. Insights into persulfate activation by feo for phenol removal: The production and effect of Fe (iv). Chem. Eng. J. 2023, 468, 143842. [Google Scholar] [CrossRef]
  21. You, Y.; He, Z. Phenol degradation in iron-based advanced oxidation processes through ferric reduction assisted by molybdenum disulfide. Chemosphere 2023, 312, 137278. [Google Scholar] [CrossRef]
  22. Lin, Y.; Dai, Y.; Zhang, L.; Wu, Q. Efficient degradation of phenol in aqueous solution by Fe2+/H2O2/CAO2 system. Environ. Technol. Innov. 2022, 27, 102320. [Google Scholar] [CrossRef]
  23. Tammaro, O.; Morante, N.; Marocco, A.; Fontana, M.; Castellino, M.; Barrera, G.; Allia, P.; Tiberto, P.; Arletti, R.; Fantini, R. The beneficial role of nano-sized Fe3O4 entrapped in ultra-stable y zeolite for the complete mineralization of phenol by heterogeneous photo-fenton under solar light. Chemosphere 2023, 345, 140400. [Google Scholar] [CrossRef] [PubMed]
  24. Miklos, D.B.; Remy, C.; Jekel, M.; Linden, K.G.; Drewes, J.E.; Hübner, U. Evaluation of advanced oxidation processes for water and wastewater treatment—A critical review. Water Res. 2018, 139, 118–131. [Google Scholar] [CrossRef] [PubMed]
  25. Thakur, N.; Thakur, N.; Kumar, A.; Thakur, V.K.; Kalia, S.; Arya, V.; Kumar, A.; Kumar, S.; Kyzas, G.Z. A critical review on the recent trends of photocatalytic, antibacterial, antioxidant and nanohybrid applications of anatase and rutile tio2 nanoparticles. Sci. Total Environ. 2024, 914, 169815. [Google Scholar] [CrossRef] [PubMed]
  26. Sari, Y.; Gareso, P.L.; Armynah, B.; Tahir, D. A review of tio2 photocatalyst for organic degradation and sustainable hydrogen energy production. Int. J. Hydrogrn Energy 2023, 55, 984–996. [Google Scholar] [CrossRef]
  27. Song, C.; Xiao, L.; Chen, Y.; Yang, F.; Meng, H.; Zhang, W.; Zhang, Y.; Wu, Y. TiO2-based catalysts with various structures for photocatalytic application: A review. Catalysts 2024, 14, 366. [Google Scholar] [CrossRef]
  28. Janson, O.; Unosson, E.; Strømme, M.; Engqvist, H.; Welch, K. Organic degradation potential of a TiO2/H2O2/UV–vis system for dental applications. J. Dent. 2017, 67, 53–57. [Google Scholar] [CrossRef]
  29. Schwarze, M.; Borchardt, S.; Frisch, M.L.; Collis, J.; Walter, C.; Menezes, P.W.; Strasser, P.; Driess, M.; Tasbihi, M. Degradation of phenol via an advanced oxidation process (aop) with immobilized commercial titanium dioxide (TiO2) photocatalysts. Nanomaterials 2023, 13, 1249. [Google Scholar] [CrossRef]
  30. Iqbal, M.A.; Akram, S.; Lal, B.; Hassan, S.U.; Ashraf, R.; Kezembayeva, G.; Mushtaq, M.; Chinibayeva, N.; Hosseini-Bandegharaei, A. Advanced photocatalysis as a viable and sustainable wastewater treatment process: A comprehensive review. Environ. Res. 2024, 253, 118947. [Google Scholar] [CrossRef]
  31. Thaha, S.S.M.; Nalandhiran, P.; Kaliyamoorthy, S.; Mizota, I.; Mangalaraja, R.V.; Sathishkumar, P. Critical review of photocatalytic reactor designs for environmental applications. In Photocatalysis for Energy and Environmental Applications: Current Trends and Future Perspectives; Springer: Berlin/Heidelberg, Germany, 2024; pp. 1–50. [Google Scholar] [CrossRef]
  32. Molinari, R.; Severino, A.; Lavorato, C.; Argurio, P. Which configuration of photocatalytic membrane reactors has a major potential to be used at an industrial level in tertiary sewage wastewater treatment? Catalysts 2023, 13, 1204. [Google Scholar] [CrossRef]
  33. Yusuf, A.O.; Mohamed, G.H.; Al-Sakkaf, R.; Rodríguez, J.; Žerjav, G.; Pintar, A.; Palmisano, G. Photocatalytic degradation of diclofenac amide in a fixed-bed reactor using TiO2/β-Bi2O3: Process optimization and stability analysis. J. Photochem. Photobiol. A: Chem. 2024, 450, 115470. [Google Scholar] [CrossRef]
  34. Soison, P.; Weerapreechachai, S.; Chawengkijwanich, C. A hybrid solar/uv lamp photoreactor using TiO2/clay catalyst beads for enhanced water reclamation of secondary textile wastewater effluent. Sol. Energy 2024, 274, 112606. [Google Scholar] [CrossRef]
  35. Tahir, M.; Tahir, B.; Kumar, N.; Al Marzooqi, M.; Siraj, M.; Fatehmulla, A. In-situ synthesis of V2AlC@ V2O5/TiO2 immobilized over honeycomb support with vanadium oxide electron transfer mediator for stimulating selective CO2 photoreduction through bi-reforming in a monolith reactor. Fuel 2024, 370, 131816. [Google Scholar] [CrossRef]
  36. Palak, B.; Kumari, A.; Parmar, M.S. Textile wastewater treatment through aops with special focus on fixed-bed approach: A review. J. Water Chem. Technol. 2024, 46, 292–301. [Google Scholar] [CrossRef]
  37. Schneider, O.M.; Liang, R.; Bragg, L.; Jaciw-Zurakowsky, I.; Fattahi, A.; Rathod, S.; Peng, P.; Servos, M.R.; Zhou, Y.N. Photocatalytic degradation of microcystins by TiO2 using uv-led controlled periodic illumination. Catalysts 2019, 9, 181. [Google Scholar] [CrossRef]
  38. Bouanimba, N.; Laid, N.; Zouaghi, R.; Sehili, T. A comparative study of the activity of TiO2 degussa p25 and millennium pcs in the photocatalytic degradation of bromothymol blue. Int. J. Chem. React. Eng. 2018, 16, 20170014. [Google Scholar] [CrossRef]
  39. Rosa, R.H.; Silva, R.S.; Nascimento, L.L.; Okura, M.H.; Patrocinio, A.O.T.; Rossignolo, J.A. Photocatalytic and antimicrobial activity of TiO2 films deposited on fiber-cement surfaces. Catalysts 2023, 13, 861. [Google Scholar] [CrossRef]
  40. Morante, N.; Folliero, V.; Dell’Annunziata, F.; Capuano, N.; Mancuso, A.; Monzillo, K.; Galdiero, M.; Sannino, D.; Franci, G. Characterization and photocatalytic and antibacterial properties of Ag- and TiOx-based (x = 2, 3) composite nanomaterials under UV irradiation. Materials 2024, 17, 2178. [Google Scholar] [CrossRef]
  41. Al-Oubidy, E.A.; Kadhim, F.J. Photocatalytic activity of anatase titanium dioxide nanostructures prepared by reactive magnetron sputtering technique. Opt. Quantum Electron. 2019, 51, 23. [Google Scholar] [CrossRef]
  42. Lee, H.; Kannan, P.; Al Shoaibi, A. Srinivasakannan. Phenol degradation catalyzed by metal oxide supported porous carbon matrix under uv irradiation. J. Water Process Eng. 2019, 31, 100869. [Google Scholar] [CrossRef]
  43. Omri, A.; Benzina, M. Almond shell activated carbon: Adsorbent and catalytic support in the phenol degradation. Environ. Monit. Assess. 2014, 186, 3875–3890. [Google Scholar] [CrossRef] [PubMed]
  44. Bognár, S.; Jovanović, D.; Despotović, V.; Finčur, N.; Putnik, P.; Merkulov, D.Š. Advancing wastewater treatment: A comparative study of photocatalysis, sonophotolysis, and sonophotocatalysis for organics removal. Processes 2024, 12, 1256. [Google Scholar] [CrossRef]
  45. Bremner, D.H.; Burgess, A.E.; Houllemare, D.; Namkung, K.-C. Phenol degradation using hydroxyl radicals generated from zero-valent iron and hydrogen peroxide. Appl. Catal. B Environ. 2006, 63, 15–19. [Google Scholar] [CrossRef]
  46. Xu, J.; Shen, J.; Jiang, H.; Yu, X.; Qureshi, W.A.; Maouche, C.; Gao, J.; Yang, J.; Liu, Q. Progress and challenges in full spectrum photocatalysts: Mechanism and photocatalytic applications. J. Ind. Eng. Chem. 2023, 119, 112–129. [Google Scholar] [CrossRef]
  47. Morshedy, A.S.; El-Fawal, E.M.; Zaki, T.; El-Zahhar, A.A.; Alghamdi, M.M.; El Naggar, A.M.A. A review on heterogeneous photocatalytic materials: Mechanism, perspectives, and environmental and energy sustainability applications. Inorg. Chem. Commun. 2024, 163, 112307. [Google Scholar] [CrossRef]
  48. Lee, J.K.; Walker, K.L.; Han, H.S.; Kang, J.; Prinz, F.B.; Waymouth, R.M.; Nam, H.G.; Zare, R.N. Spontaneous generation of hydrogen peroxide from aqueous microdroplets. Proc. Natl. Acad. Sci. USA 2019, 116, 19294–19298. [Google Scholar] [CrossRef]
  49. Bolton, J.R.; Bircher, K.G.; Tumas, W.; Tolman, C.A. Figures-of-merit for the technical development and application of advanced oxidation technologies for both electric- and solar-driven systems (iupac technical report). Pure Appl. Chem. 2001, 73, 627–637. [Google Scholar] [CrossRef]
  50. Herrmann, J.M. Heterogeneous photocatalysis: State of the art and present applications in honor of pr. R.L. Burwell jr. (1912–2003), former head of ipatieff laboratories, northwestern university, evanston (ill). Top. Catal. 2005, 34, 49–65. [Google Scholar] [CrossRef]
  51. Morante, N.; Tammaro, O.; Albarano, L.; De Guglielmo, L.; Oliva, N.; Sacco, O.; Mancuso, A.; Castellino, M.; Sannino, D.; Femia, N.; et al. Influence of visible light leds modulation techniques on photocatalytic degradation of ceftriaxone in a flat plate reactor. Chem. Eng. J. 2024, 482, 149175. [Google Scholar] [CrossRef]
  52. Gayral, B. Leds for lighting: Basic physics and prospects for energy savings. Comptes Rendus. Phys. 2017, 18, 453–461. [Google Scholar] [CrossRef]
  53. Pei, Y.; Zhu, S.; Yang, H.; Zhao, L.; Yi, X.; Junxi Wang, J.; Li, J. Led modulation characteristics in a visible-light communication system. Opt. Photonics J. 2013, 3, 4. [Google Scholar] [CrossRef]
  54. Di Capua, G.; Femia, N.; Migliaro, M.; Sacco, O.; Sannino, D.; Stoyka, K.; Vaiano, V. Intensification of a flat-plate photocatalytic reactor performances by innovative visible light modulation techniques: A proof of concept. Chem. Eng. Process. Process Intensif. 2017, 118, 117–123. [Google Scholar] [CrossRef]
  55. Vaiano, V.; Sacco, O.; Di Capua, G.; Femia, N.; Sannino, D. Use of visible light modulation techniques in urea photocatalytic degradation. Water 2019, 11, 1642. [Google Scholar] [CrossRef]
  56. Sannino, D.; Morante, N.; Sacco, O.; Mancuso, A.; De Guglielmo, L.; Di Capua, G.; Femia, N.; Vaiano, V. Visible light-driven degradation of acid orange 7 by light modulation techniques. Photochem. Photobiol. Sci. 2023, 22, 185–193. [Google Scholar] [CrossRef]
  57. Sannino, D.; Vaiano, V.; Sacco, O.; Morante, N.; De Guglielmo, L.; Di Capua, G.; Femia, N. Visible light driven degradation of terephthalic acid: Optimization of energy demand by light modulation techniques. J. Photocatal. 2021, 2, 13. [Google Scholar] [CrossRef]
  58. Moreno, I.; Avendaño-Alejo, M.; Tzonchev, R.I. Designing light-emitting diode arrays for uniform near-field irradiance. Appl. Opt. 2006, 45, 2265–2272. [Google Scholar] [CrossRef]
  59. Bhattacharya, P. Semiconductor Optoelectronic Devices, 2nd ed.; Prentice-Hall, Inc.: Upper Saddle River, NJ, USA, 1997. [Google Scholar]
  60. Bahadori, E.; Vaiano, V.; Esposito, S.; Armandi, M.; Sannino, D.; Bonelli, B. Photo-activated degradation of tartrazine by H2O2 as catalyzed by both bare and Fe-doped methyl-imogolite nanotubes. Catal. Today 2018, 304, 199–207. [Google Scholar] [CrossRef]
  61. Khuzwayo, Z.; Chirwa, E.M.N. Modelling and simulation of photocatalytic oxidation mechanism of chlorohalogenated substituted phenols in batch systems: Langmuir–hinshelwood approach. J. Hazard. Mater. 2015, 300, 459–466. [Google Scholar] [CrossRef]
  62. Vaiano, V.; Sacco, O.; Sannino, D.; Di Capua, G.; Femia, N. Enhanced performances of a photocatalytic reactor for wastewater treatment using controlled modulation of leds light. Chem. Eng. Trans. 2017, 57, 6. [Google Scholar]
Figure 1. Raman spectra of PC105/SP, PC105, and SP samples.
Catalysts 14 00544 g001
Figure 2. UV–vis diffuse reflectance spectra of PC105/SP and SP samples.
Catalysts 14 00544 g002
Figure 3. Tauc plot for the energy bandgap estimation of PC105/SP sample.
Catalysts 14 00544 g003
Figure 4. (a) Phenol degradation under UV-A light registered with FD light modulation for five reuse cycles; (b) mineralization efficiency after 180 min of irradiation and apparent kinetic degradation constant values obtained with FD light modulation for five reuse cycles.
Catalysts 14 00544 g004
Figure 5. (a) Phenol degradation under UV-A light registered for different initial phenol concentrations; (b) mineralization efficiency after 180 min of irradiation and apparent kinetic degradation constant values obtained for different initial phenol concentrations.
Catalysts 14 00544 g005
Figure 6. (a) Phenol degradation under UV-A light registered for different reaction conditions; (b) mineralization efficiency after 30 min of irradiation and apparent kinetic degradation constant values obtained for different reaction conditions.
Catalysts 14 00544 g006aCatalysts 14 00544 g006b
Figure 7. (a) Phenol degradation under UV-A light irradiation registered for different initial H2O2 dosages; (b) mineralization efficiency after 30 min of irradiation and apparent kinetic degradation constant values obtained for different initial H2O2 dosages.
Catalysts 14 00544 g007aCatalysts 14 00544 g007b
Figure 8. H2O2 consumption after 180 min under UV-A irradiation on PC105/SP by varying initial H2O2 dosage.
Catalysts 14 00544 g008
Figure 9. Mineralization efficiency after 10 min of irradiation and apparent kinetic degradation constant values obtained using different light modulation.
Catalysts 14 00544 g009
Figure 10. (a) Picture of the steel plate before deposition of the photocatalyst; (b) picture of the PC105/SP-structured photocatalyst after deposition of the photocatalyst.
Catalysts 14 00544 g010
Figure 11. Experimental setup scheme.
Catalysts 14 00544 g011
Figure 12. Values of the incident light intensity inside the reactor by varying the feed current to UV-A LEDs.
Catalysts 14 00544 g012
Table 1. Electrical energy consumption values for reduction of 90% phenol in 1 m3 of solution for the following UV-A light modulations: FD, S-VD, SW-VD, T-VD, ST-VD, and P-VD, with T = 3 s, IAVG min = 33.33 mA, and IAVG max = 166.67 mA.
Light ModulationP [kW]V [L]k [min−1]EE/O [kWh m−3]
FD0.0360.450.177.84
S-VD0.0360.450.343.92
SW-VD0.0360.450.363.70
T-VD0.0360.450.393.42
ST-VD0.0360.450.324.17
P-VD0.0360.450.284.76
Disclaimer/Publisher’s Note: The statements, opinions and data contained in all publications are solely those of the individual author(s) and contributor(s) and not of MDPI and/or the editor(s). MDPI and/or the editor(s) disclaim responsibility for any injury to people or property resulting from any ideas, methods, instructions or products referred to in the content.

