It was reported that short residence times may lead to incomplete urea decomposition [
22] and promote a mixture of NH
3, HNCO, and urea, which can be mixed together with NO
x on the SCR catalyst. Then, different assumptions can be proposed to explain the NO
x conversion decrease, the increase of the (NH
3 conversion/NO
x conversion) ratio in the 350–400 °C temperature range, and the changes in the NO
2/NO
x outlet ratio at low temperature (
T < 350 °C): (i) a poisoning of the active SCR sites; (ii) a reactivity of urea or its by-products with oxygen, which would lead to a loss in reductant availability for NO
x reduction; (iii) a change in reaction stoichiometry (from standard/fast SCR to NO
2-SCR, which would lead to a (NH
3 conversion/NO
x conversion) ratio higher than 1); or (iv) a limitation of the generated ammonia from urea (urea thermolysis (Equation (4)) and/or HNCO hydrolysis (Equation (5))).
2.2.1. Study of the Possible Poisoning of the Active SCR Sites
The drop in activity observed for
tR = 4.0 s could be assigned to a deposit formation on the surface of the catalyst, as mentioned in the introduction section [
24]. It would lead to unavailable reductant for NO
x reduction but the reductant would appear missing in the outlet gas (then increasing the (NH
3 conversion/NO
x conversion) ratio). Data reported in the experimental part indicate that urea is fully thermally converted into ammonia at 200 °C between the urea injection and the analyser. It appears that it is not the case at the catalyst level for
tR = 4.0 s since the catalytic activity is changed. In order to test a possible deposit formation, the stability of adsorbed species were examined by TPD and TPO experiments.
After one hour of adsorption at 175 °C under 200 ppm urea (400 ppm
eq. NH
3), 8% H
2O, 10% CO
2, 10% O
2, desorption was performed until 550 °C under N
2 (TPD) or under gas mixture containing O
2, CO
2, H
2O balanced in N
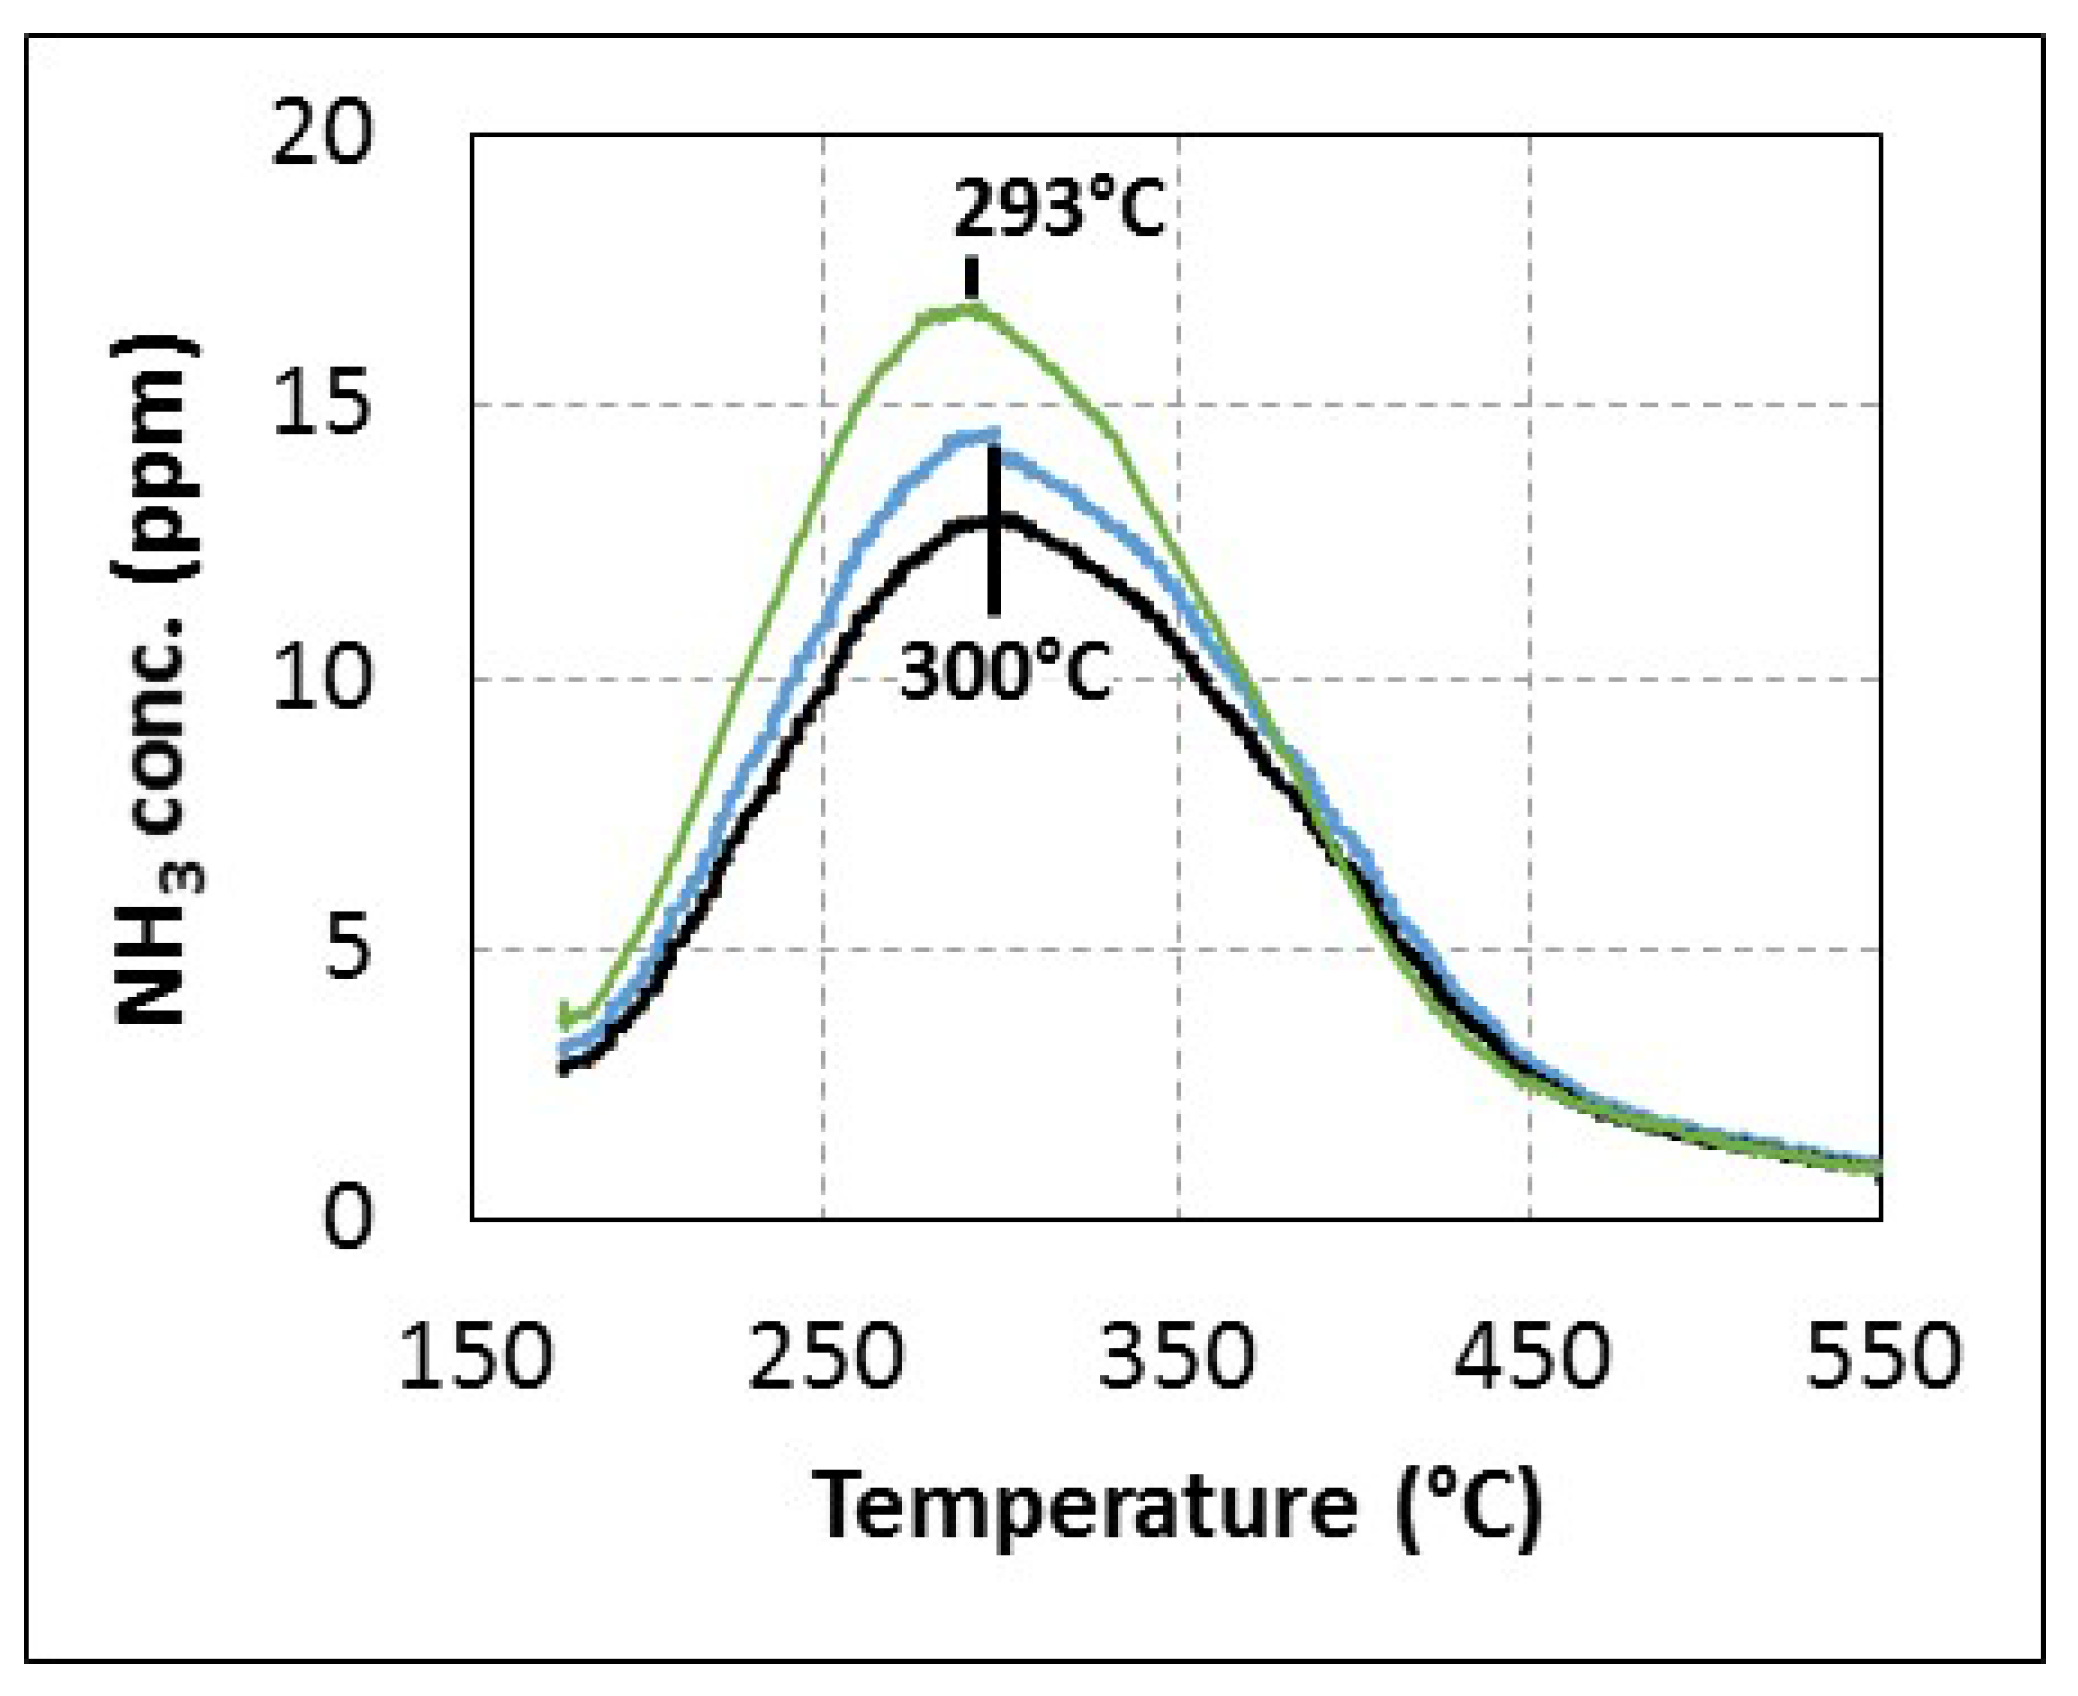
2 (TPO). Results are reported in
Figure 4. No other
N-compounds than NH
3 were detected, with a maximum around 293–300 °C whatever the composition of the desorption gas mixture, in particular the presence or absence of oxygen. Most of the adsorbed species are desorbed before 450 °C. In addition, almost identical values of adsorbed species are measured, with 280 μmol·g
−1 and 260 μmol·g
−1 for TPD and TPO experiments respectively. Besides, replacing urea with ammonia gas for the adsorption step leads to a very similar TPD recorded profile. Note that the quantification of TPD experiments reveals an ammonia storage capacity two to three times lower than the usual zeolite used in the NH
3-SCR process [
31,
33], depending on the de-alumination ratio and NH
3 sorption condition. Finally, these results indicate that adsorbed species from the urea injection present the same behaviour as ammonia during the TPD-TPO tests when the temperature is increased. However, it is not sufficient to definitively invalidate the hypothesis of poisoning at low temperature.
Figure 4.
(▬): NH3-TPD experiments under N2; (▬): urea-TPD experiments under N2; (▬): urea-TPO experiments under 8% H2O, 10% CO2, 10% O2 after urea adsorption at 175 °C from 1 h.
Figure 4.
(▬): NH3-TPD experiments under N2; (▬): urea-TPD experiments under N2; (▬): urea-TPO experiments under 8% H2O, 10% CO2, 10% O2 after urea adsorption at 175 °C from 1 h.
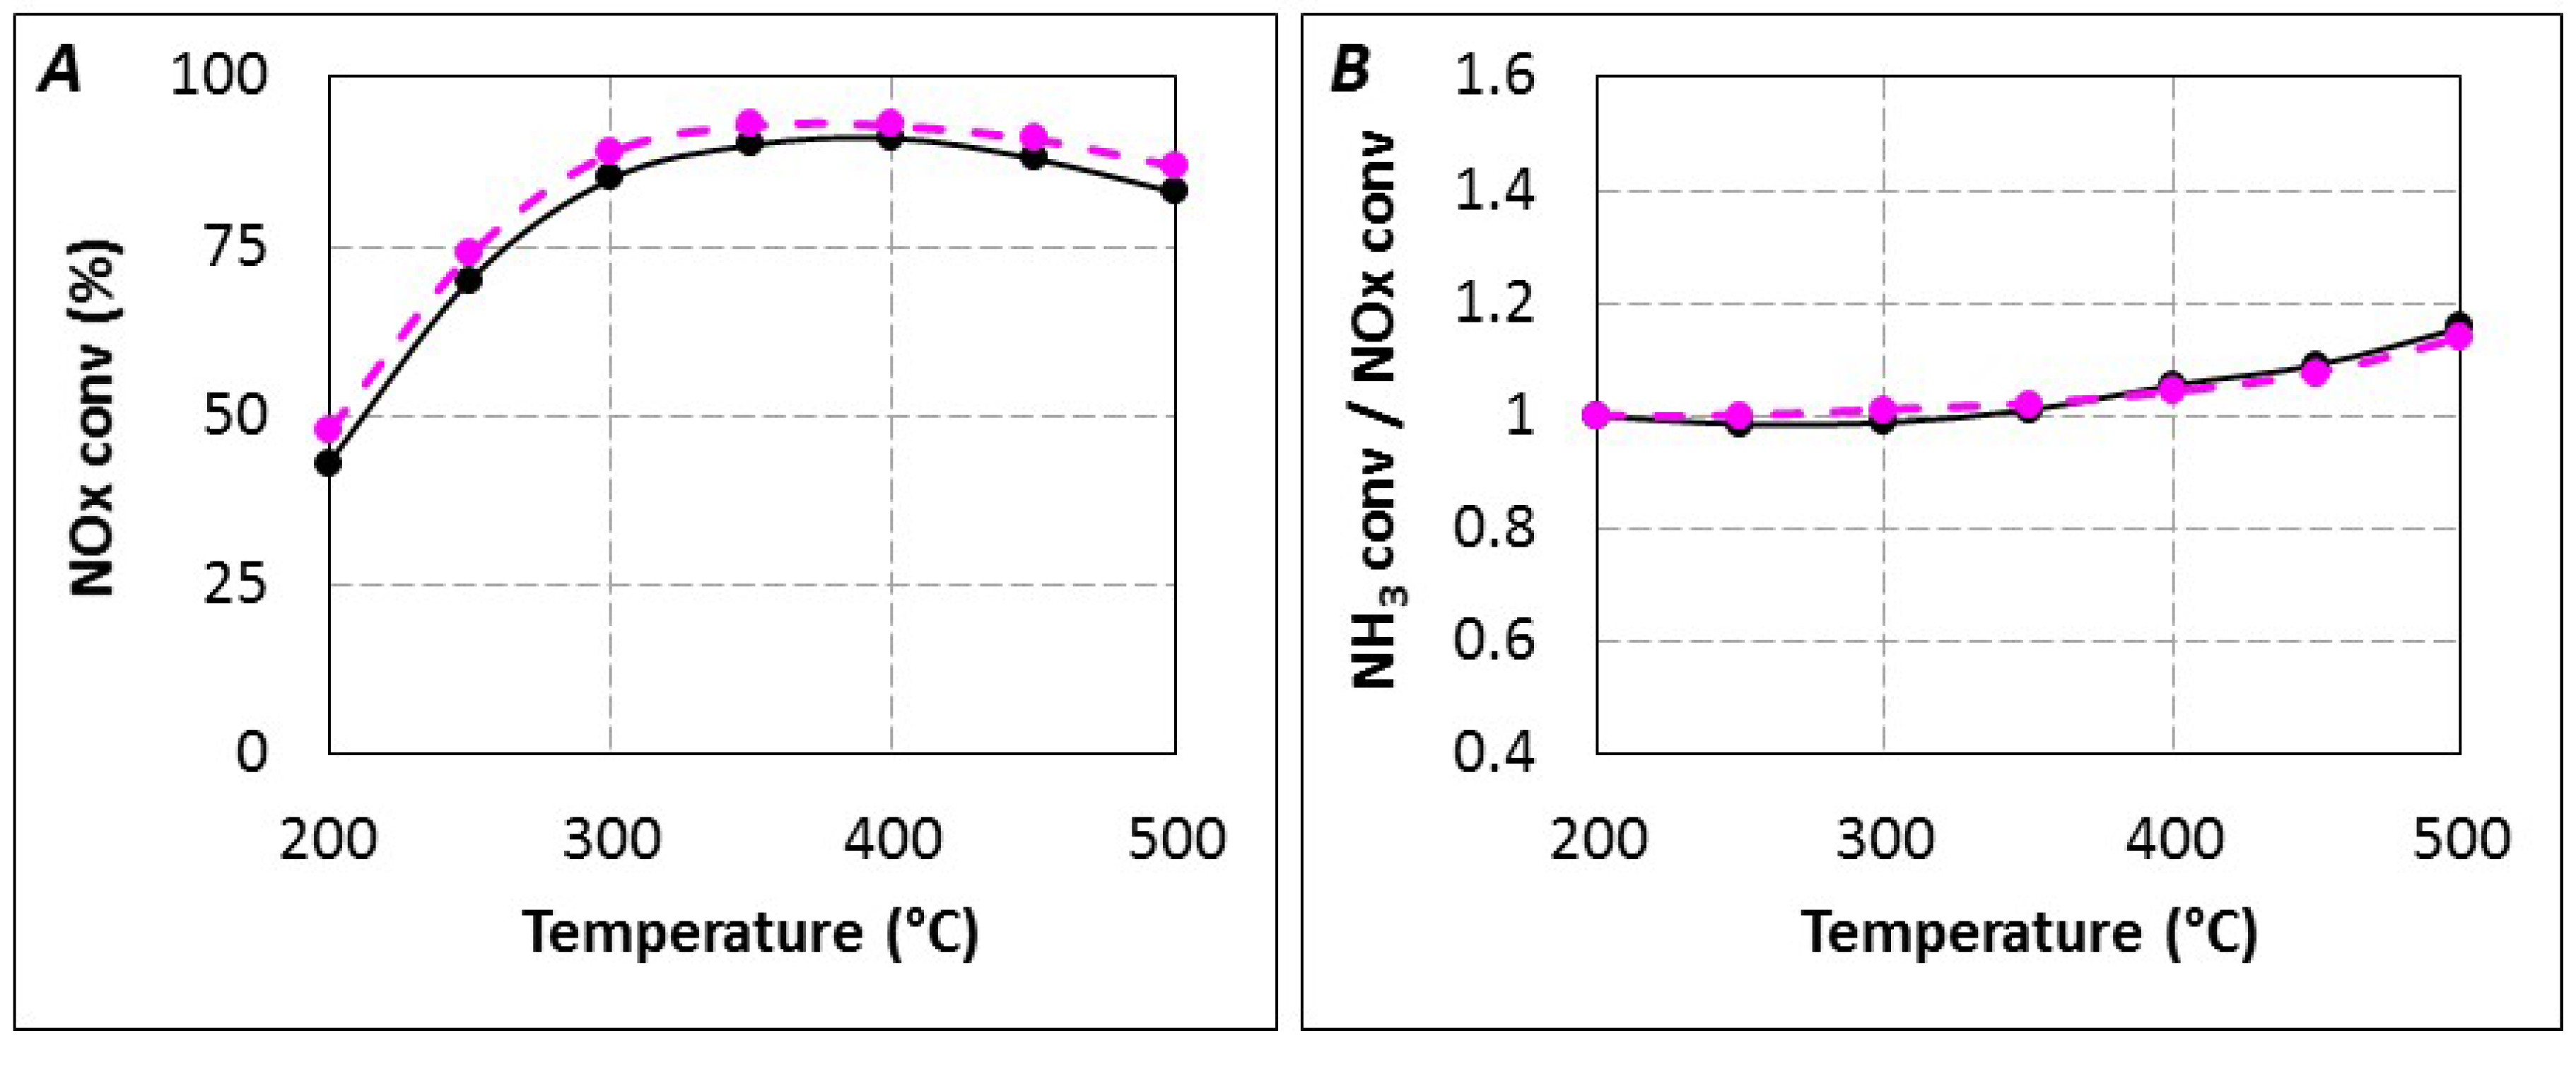
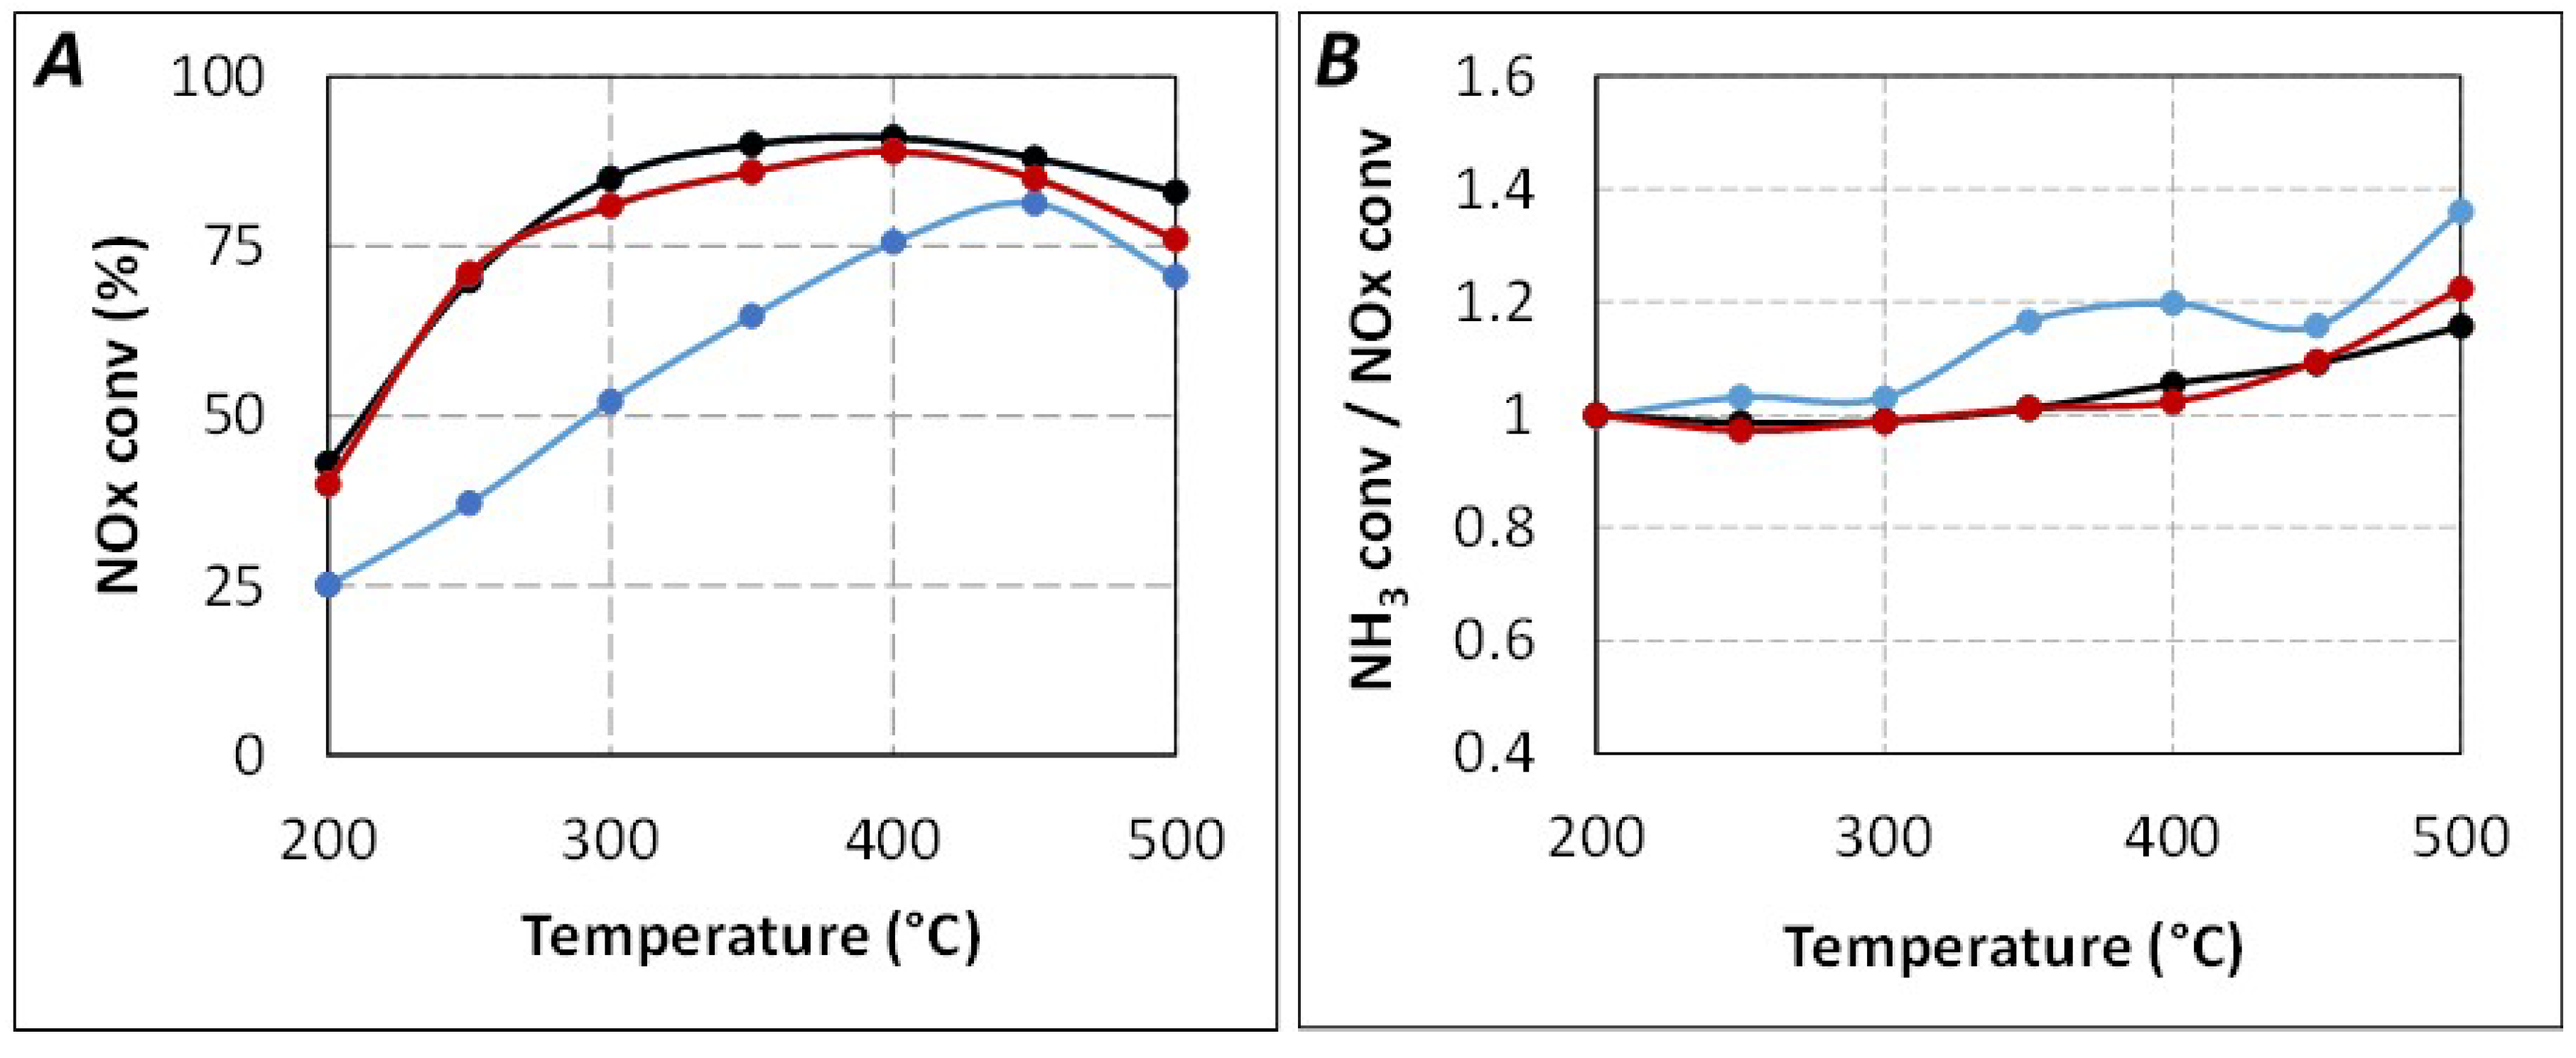
In order to understand if the decrease in the NO
x conversion with
tR = 4.0 s is attributable to lack of ammonia (respecting assumption (ii)–(iv)) or to catalyst poisoning, additional measurements were performed with
tR = 4.0 s in which different amounts of gaseous NH
3 were added depending on the temperature test. Additional NH
3 amounts were calculated to theoretically compensate the NO
x conversion drop observed for
tR = 4.0 s compared with
tR = 5.2 s (similar to NH
3-SCR results). For example, at 300 °C, the NO
x conversion at
tR = 5.2 and
tR = 4.0 s are 85% and 54%, respectively (200 ppm urea inlet,
i.e., 400 ppm equivalent NH
3). In this case, 130 ppm NH
3 were added in the urea-SCR reaction mixture (added NH
3 amount for each temperature is reported in
Table S1. NO
x conversions with
tR = 5.2 s,
tR = 4.0 s and
tR =4.0 s with additional gaseous NH
3 are compared in
Figure 5. This figure clearly indicates that addition of NH
3 in adjusted amounts allows a fully recovery of the NO
x conversion at
tR = 4.0 s. This result suggests that the loss in DeNO
x efficiency when the urea residence time is decreased to 4.0 s is not attributable to catalyst poisoning, but to a lack in ammonia availability. Interestingly, the NO
2/NO
x outlet ratio (
Table 2) recorded with additional ammonia in the urea-SCR mixture is also close to values obtained in NH
3-SCR. The (NH
3 conversion/NO
x conversion) ratio cannot be easily compared due to the over adjunction of NH
3.
Figure 5.
Effect of ammonia offset in urea-SCR gas mixture at urea residence time tR = 4.0 s on NOx conversion in standard SCR condition. (▬): Urea-SCR tR = 4.0 s; (▬): Urea-SCR tR = 5.2 s; (▬): Urea-SCR tR = 4.0 s + NH3.
Figure 5.
Effect of ammonia offset in urea-SCR gas mixture at urea residence time tR = 4.0 s on NOx conversion in standard SCR condition. (▬): Urea-SCR tR = 4.0 s; (▬): Urea-SCR tR = 5.2 s; (▬): Urea-SCR tR = 4.0 s + NH3.
Table 2.
NO2/NOx outlet ratio (%) versus temperature for standard-SCR (400 ppm NO, 400 ppmeq. NH3, 8% H2O, 10% CO2, 10% O2).
Table 2.
NO2/NOx outlet ratio (%) versus temperature for standard-SCR (400 ppm NO, 400 ppmeq. NH3, 8% H2O, 10% CO2, 10% O2).
| Catalytic Bed | SCR Catalyst Alone | Double Catalytic Bed |
|---|
| Al2O3 (100 mg) + SCR Sample | TiO2 (100 mg) + SCR Sample | ZrO2 (100 mg) + SCR Sample | ZrO2 (150 mg) + SCR Sample |
|---|
| Reductant | NH3 | Urea tR = 5.2 s | Urea tR = 4.0 s | Urea tR = 4.0s + NH3 | Urea tR = 4.0s |
|---|
| 200 °C | 4.7 | 2.3 | 0.6 | 4.8 | 0.8 | 0.3 | 0.4 | 3.4 |
| 250 °C | 6.2 | 4.1 | 0.6 | 6.4 | 1.2 | 0.5 | 0.6 | 5.7 |
| 300 °C | 9.7 | 8.2 | 0.6 | 9.4 | 0.8 | 0.6 | 0.6 | 8.5 |
| 350 °C | 11.9 | 12.2 | 1.3 | 11.0 | 1.7 | 0.8 | 2.5 | 12.5 |
| 400 °C | 10.0 | 13 | 10.3 | 10.5 | 11.0 | 9.7 | 10.2 | 10.8 |
| 450 °C | 9.1 | 10.0 | 17.2 | 9.3 | 15.4 | 10.7 | 15.0 | 9.3 |
| 500 °C | 8.2 | 7.1 | 16.1 | 8.0 | 15.0 | 7.3 | 14.3 | 9.8 |
In addition, note that the addition of gaseous ammonia should also affect the kinetics of the reaction if the reaction order in NH
3 is different from zero. This specific point was verified by adding an excess of NH
3 at 200 °C in the urea-SCR conditions for
tR = 4.0 s. The results are reported in
Figure S1 and show that the NO
x conversion is not increased in the presence of excess of ammonia gas (added ammonia concentration higher than 50 ppm), indicating a NH
3 reaction order close to zero. In fact, we previously reported a slightly negative order in ammonia for NH
3-SCR over acidic oxide [
12].
2.2.2. Reactivity of Urea or By-Products with Oxygen
Another hypothesis to explain results observed in
Figure 2 (
tR = 4.0 s) is a reductant oxidation by oxygen. In fact, if urea or these decomposition products are more reactive toward O
2 than NH
3, it would induce a drop of the available reductant for NO
x reduction, and it could also explain the apparent (NH
3 conversion/NO
x conversion) ratio increase in the 350–400 °C temperature range as reported in
Figure 2B. Then, SCO experiments were performed with NH
3 or urea with
tR = 4.0 s.
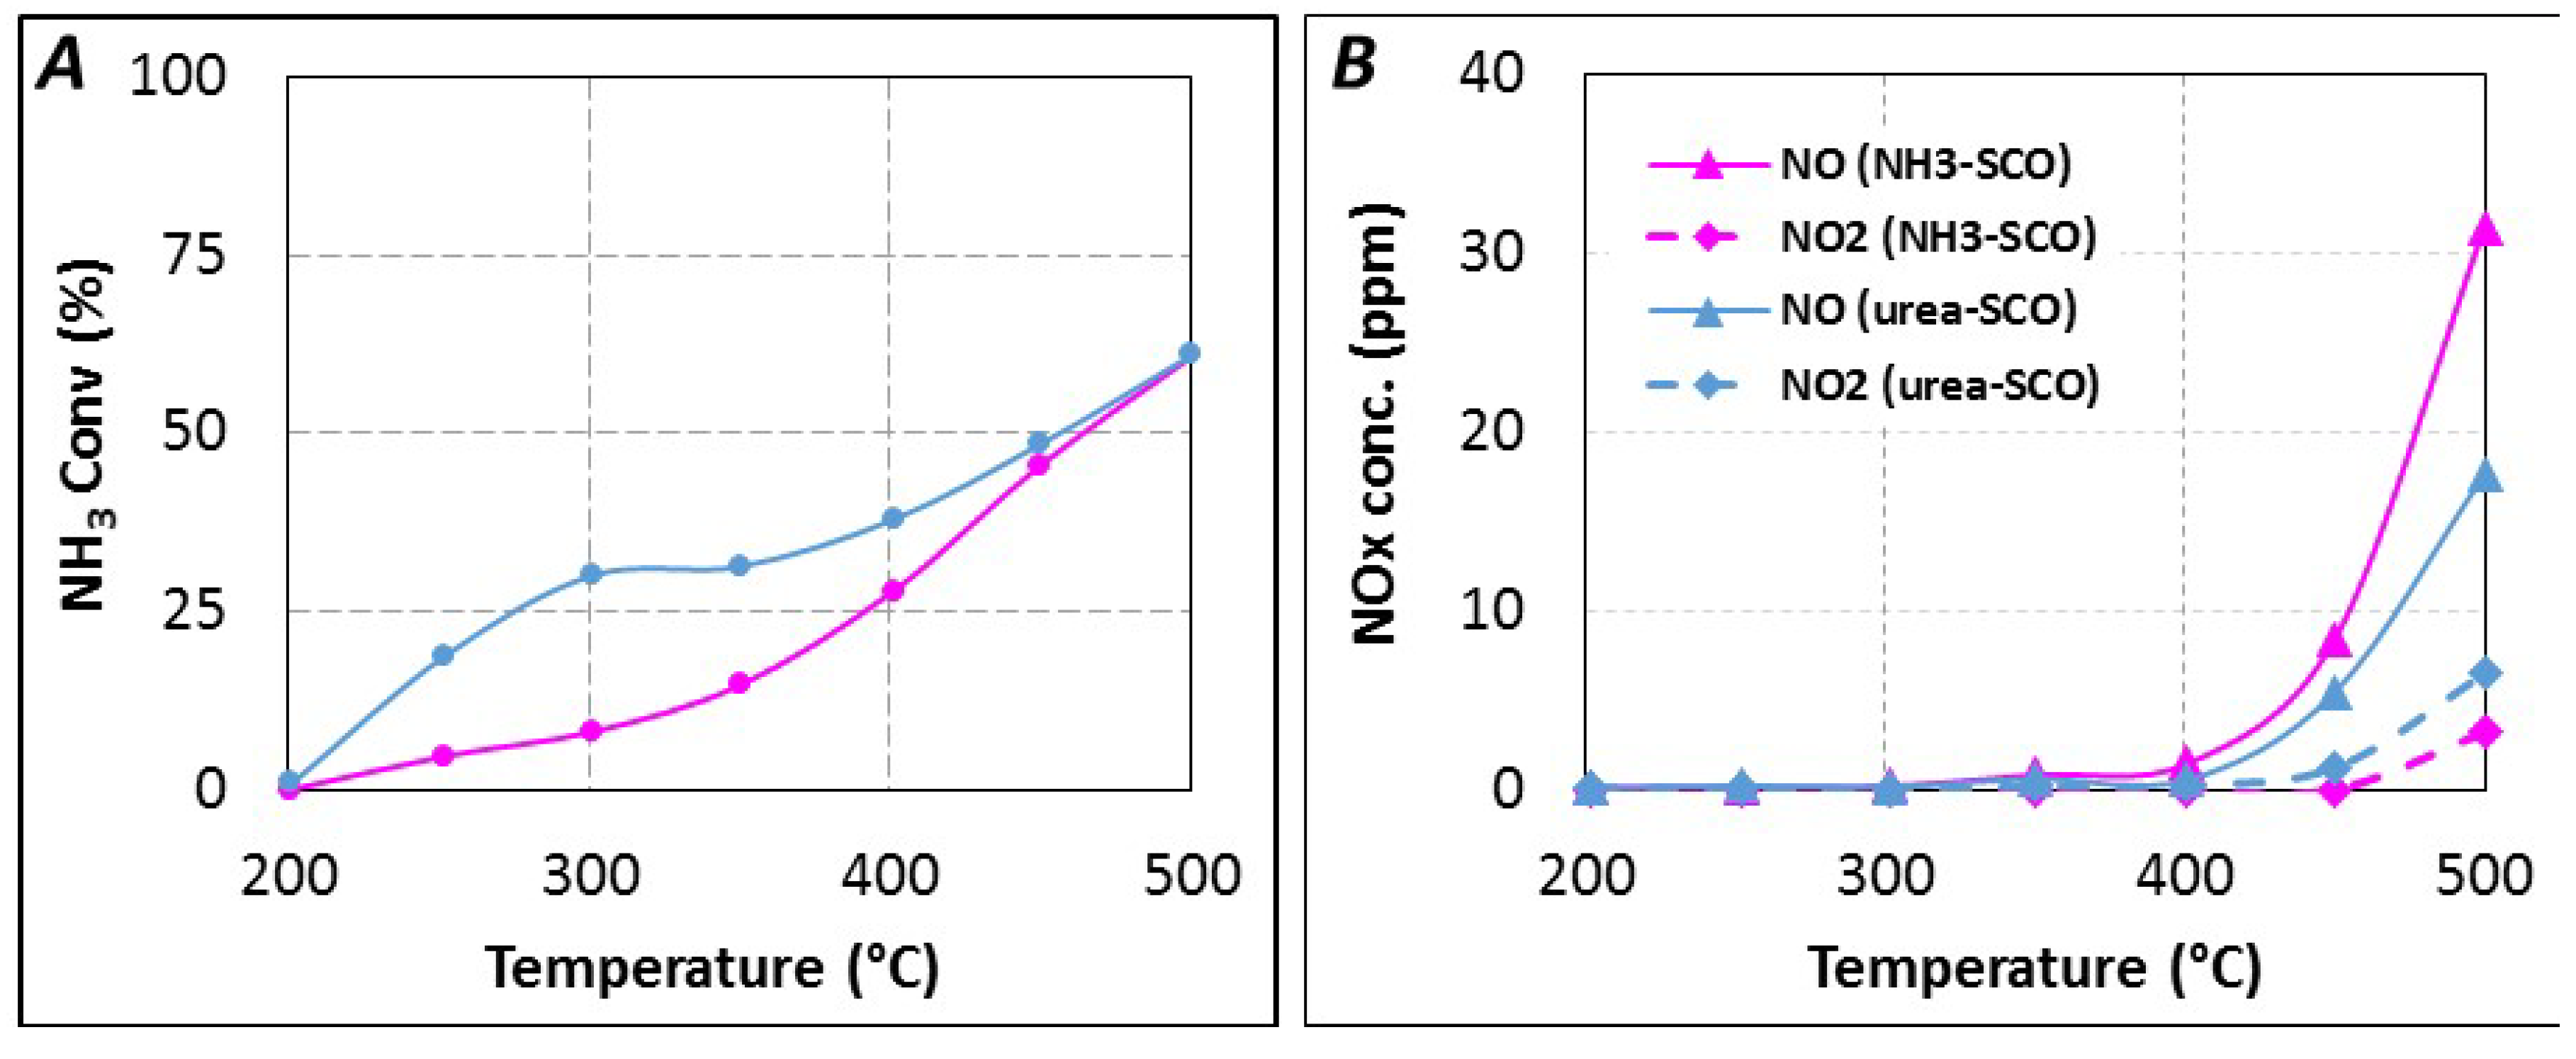
The reductant conversion profiles, expressed in NH
3 conversion, are reported in
Figure 6A. With gaseous NH
3 as introduced reductant, ammonia conversion starts near 250 °C and NH
3 is selectively oxidized into N
2 until 400 °C (28% NH
3 conversion). NO
x is detected for higher temperature, with a selectivity of 14% at 500 °C (61% NH
3 conversion). NO is emitted in higher proportion compared to NO
2, with around 31 ppm and 3 ppm at 500 °C, respectively (NO
2/NO
x = 0.09), as reported in
Figure 6B. The reductant conversion profile using urea is significantly different, higher reductant conversion is observed, especially in the 250–400 °C temperature range. For instance, the corresponding ammonia conversion increases from 8% to 30% at 300 °C for NH
3-SCO and Urea-SCO, respectively. However, both NH
3 conversion profiles become similar from 450 °C. With urea, the NO
x selectivity reaches only 10% at 500 °C. It corresponds to lower NO
x emission (24 ppm) compared to NH
3-SCO (34 ppm). However, the oxidation of urea leads to a higher NO
2 amount (6 ppm at 500 °C) compared with NH
3 (3 ppm). It induces that the outlet NO
2/NO
x ratio increase to 0.25 with urea. However, the recorded NO and NO
2 concentrations reach only few ppm and these values appear too small to discuss about a mechanism.
Figure 6.
(A) urea-SCO (▬, tR = 4.0 s) and NH3-SCO (▬) for 400 ppmeq. NH3, 8% H2O, 10% CO2, 10% O2; (B) NOx distribution in urea-SCO and NH3-SCO.
Figure 6.
(A) urea-SCO (▬, tR = 4.0 s) and NH3-SCO (▬) for 400 ppmeq. NH3, 8% H2O, 10% CO2, 10% O2; (B) NOx distribution in urea-SCO and NH3-SCO.
Finally, SCO tests show that the reactive species at the catalyst surface is not only NH
3 in the 250–400 °C temperature range when urea is used, since results are different. It indicates that the double urea decomposition may be not achieved at low temperature when the urea residence time is fixed at 4.0 s. In addition, the resulting species from the urea injection are more reactive toward O
2 than NH
3. Nevertheless, the catalyst exhibits no activity in SCO at 200 °C, whatever the considered reductant. Then, the possible contribution of the oxidation reactions cannot be invoked to explain the drop in NO
x conversion at 200 °C when urea is injected with
tR = 4.0 s. In addition, oxidation reactions should impact the (NH
3 conversion/NO
x conversion) ratio but
Figure 2B shows that it remains close to 1 until 300 °C. At this temperature the reactivity toward oxygen is approximately three times higher using urea compared with ammonia (
Figure 6). Moreover, the direct comparison of NH
3-SCO and NH
3-SCR tests indicate that competition between the NH
3 reaction with O
2 or NO
x is really effective for temperatures higher than 400 °C even if the NH
3 oxidation is possible from 250 °C in absence of NO
x. Finally, the NO
x conversion decrease observed with urea until 400 °C is not consistent with over-oxidation of the reductant by oxygen, even if a higher reactivity is observed compared with NH
3.
2.2.3. SCR Reaction Stoichiometry
A change in the balance between the possible SCR reactions may also impact the (NH
3 conversion/NO
x conversion) ratio, as observed in
Figure 2B in the 350–400 °C temperature range. Indeed, if Equations (1) and (2) respect the (1:1) (NH
3:NO
x) stoichiometry, Equation (3) corresponds to a higher NH
3/NO
x value of 1.33. If this NO
2-SCR reaction occurs, it would lead to a higher “ammonia” consumption compared with NO
x consumption. It also means that the reactive species at the catalyst surface are not the same when comparing NH
3 and urea as reductant. With this idea, it can be also envisaged that these species are more reactive toward NO
2.
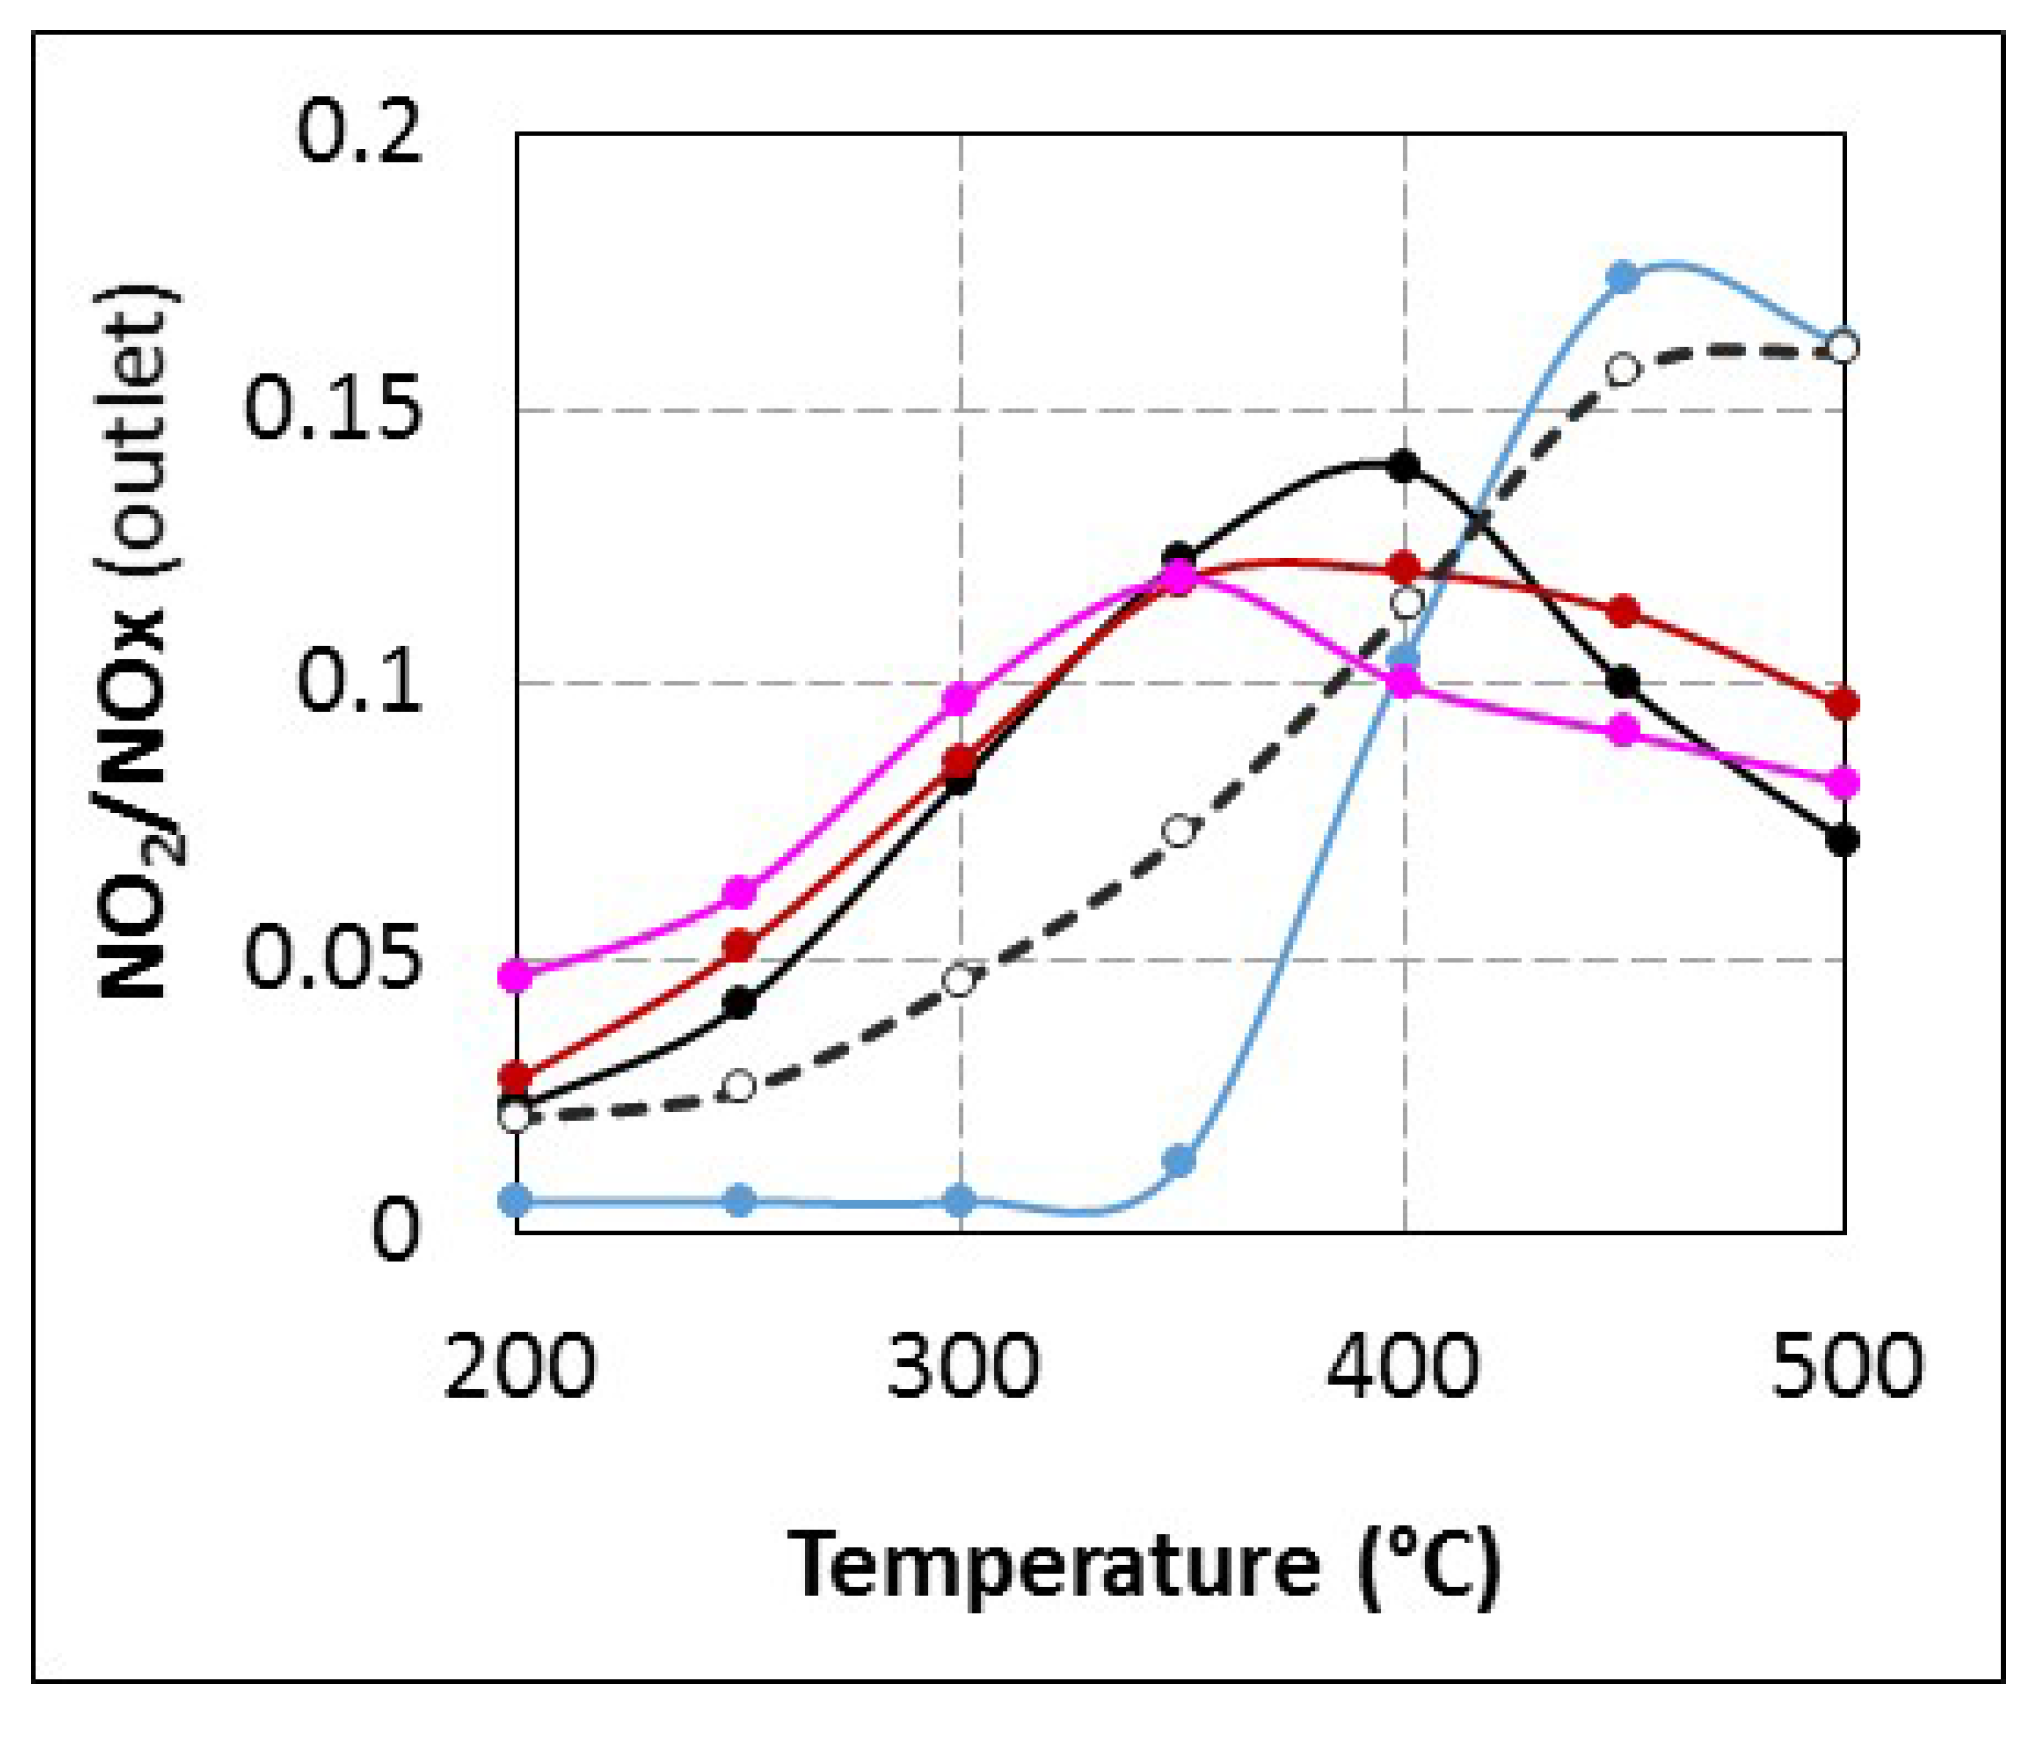
Unfortunately, it is not possible to evaluate the specific reactivity of urea and HNCO toward NO
2 and this hypothesis is only speculative. However, the fact that no NO
2 is emitted until 350 °C with
tR = 4.0 s compared with other tested conditions (
Figure 3) it supports the hypothesis of a change in the NO
2 reactivity at low temperature, which does not lead to nitrogen formation (decrease in the NO
x conversion). A plausible assumption to explain these results is that NO
2 is not detected because it would react with urea and/or its by-products. This point is specifically discussed in
Section 2.2.4.
In addition, taking into account that NO
2 is not observed at low temperature, an additional hypothesis can be proposed. Indeed, NO
2 is known to possibly react with ammonia at low temperature, leading to ammonium nitrate formation (Equation (9)), as reported for V
2O
5/WO
3–TiO
2 SCR catalysts [
17]. Then, it may be envisaged that NO
2 reacts with urea decomposition products to form NH
4NO
3. Nevertheless, it is claimed that the NH
4NO
3 decomposition leads to N
2O emission (Equation (10)). This by-product has never been recorded in our conditions, even in light-off mode (2 °C·min
−1 heating rate, from 200 °C to 500 °C) suggesting that NH
4NO
3 formation does not occur. In addition, note that ammonium nitrates could be alternately reduced by NO leading to ammonium nitrites with subsequent nitrogen release through their decomposition.
Finally, there is no clear indication for a change in SCR stoichiometry from standard/fast SCR to NO2-SCR, but a change in the NO2 reactivity when urea used as reductant is evidenced.
2.2.4. Understanding of the Loss of Activity Observed for tR = 4.0 s
The previously discussed results suggest that the drop in NO
x conversion when urea is used with
tR = 4.0 is mainly attributable to the fact that ammonia does not appear sufficiently available at the catalyst surface below 450 °C. Particularly, results presented in
Section 2.2.1 show that ammonia addition in the feed stream allows retrieving of catalytic behaviour similar to that obtained for longer residence times or with NH
3. Then, an incomplete urea thermolysis or HNCO hydrolysis would be responsible for this lower DeNO
x efficiency. This is also in accordance with the different reactivity toward oxygen (
Section 2.2.2): urea and/or its by-products appear more reactive than ammonia. As presented in the introduction section, the rate-determining step of urea decomposition is still a matter of debate in the literature. It is reported that the urea thermolysis is much slower than HNCO hydrolysis and therefore that catalytic urea thermolysis into NH
3 and HNCO is probably the rate-determining step in urea decomposition [
22]. Recently, kinetic studies on the decomposition reactions of urea on TiO
2 support this assumption [
23]. In addition, it was likewise proposed that zirconium oxide works differently. A different reaction pathway is advanced in which water directly reacts with adsorbed urea rather than adsorbed HNCO, leading to a high urea hydrolysis activity of the ZrO
2 catalyst, compared to its low urea thermolysis activity [
23]. Conversely, these authors also report that anatase TiO
2 presents higher efficiency than ZrO
2 for urea thermolysis. These results clearly evidence that the rate determining step in catalytic urea decomposition depends on the composition of the solid. Finally, for the urea thermolysis into HNCO and NH
3, the following activity order was observed: TiO
2 > H-ZSM-5 ≈ Al
2O
3 > ZrO
2 > SiO
2; whereas for the HNCO hydrolysis, the ranking becomes ZrO
2 > TiO
2 > Al
2O
3 > H-ZSM-5 > SiO
2 [
23].
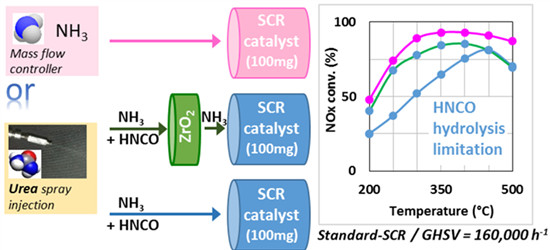
Based on this work, in order to understand if the observed lack of ammonia at the catalyst level with
tR = 4.0 s (
Figure 5) is attributable to a limitation of the urea thermolysis step and/or to the HNCO hydrolysis step, new catalytic tests were performed with the addition of a first catalytic bed containing a single oxide (Al
2O
3, TiO
2, or ZrO
2) just before the SCR catalyst.
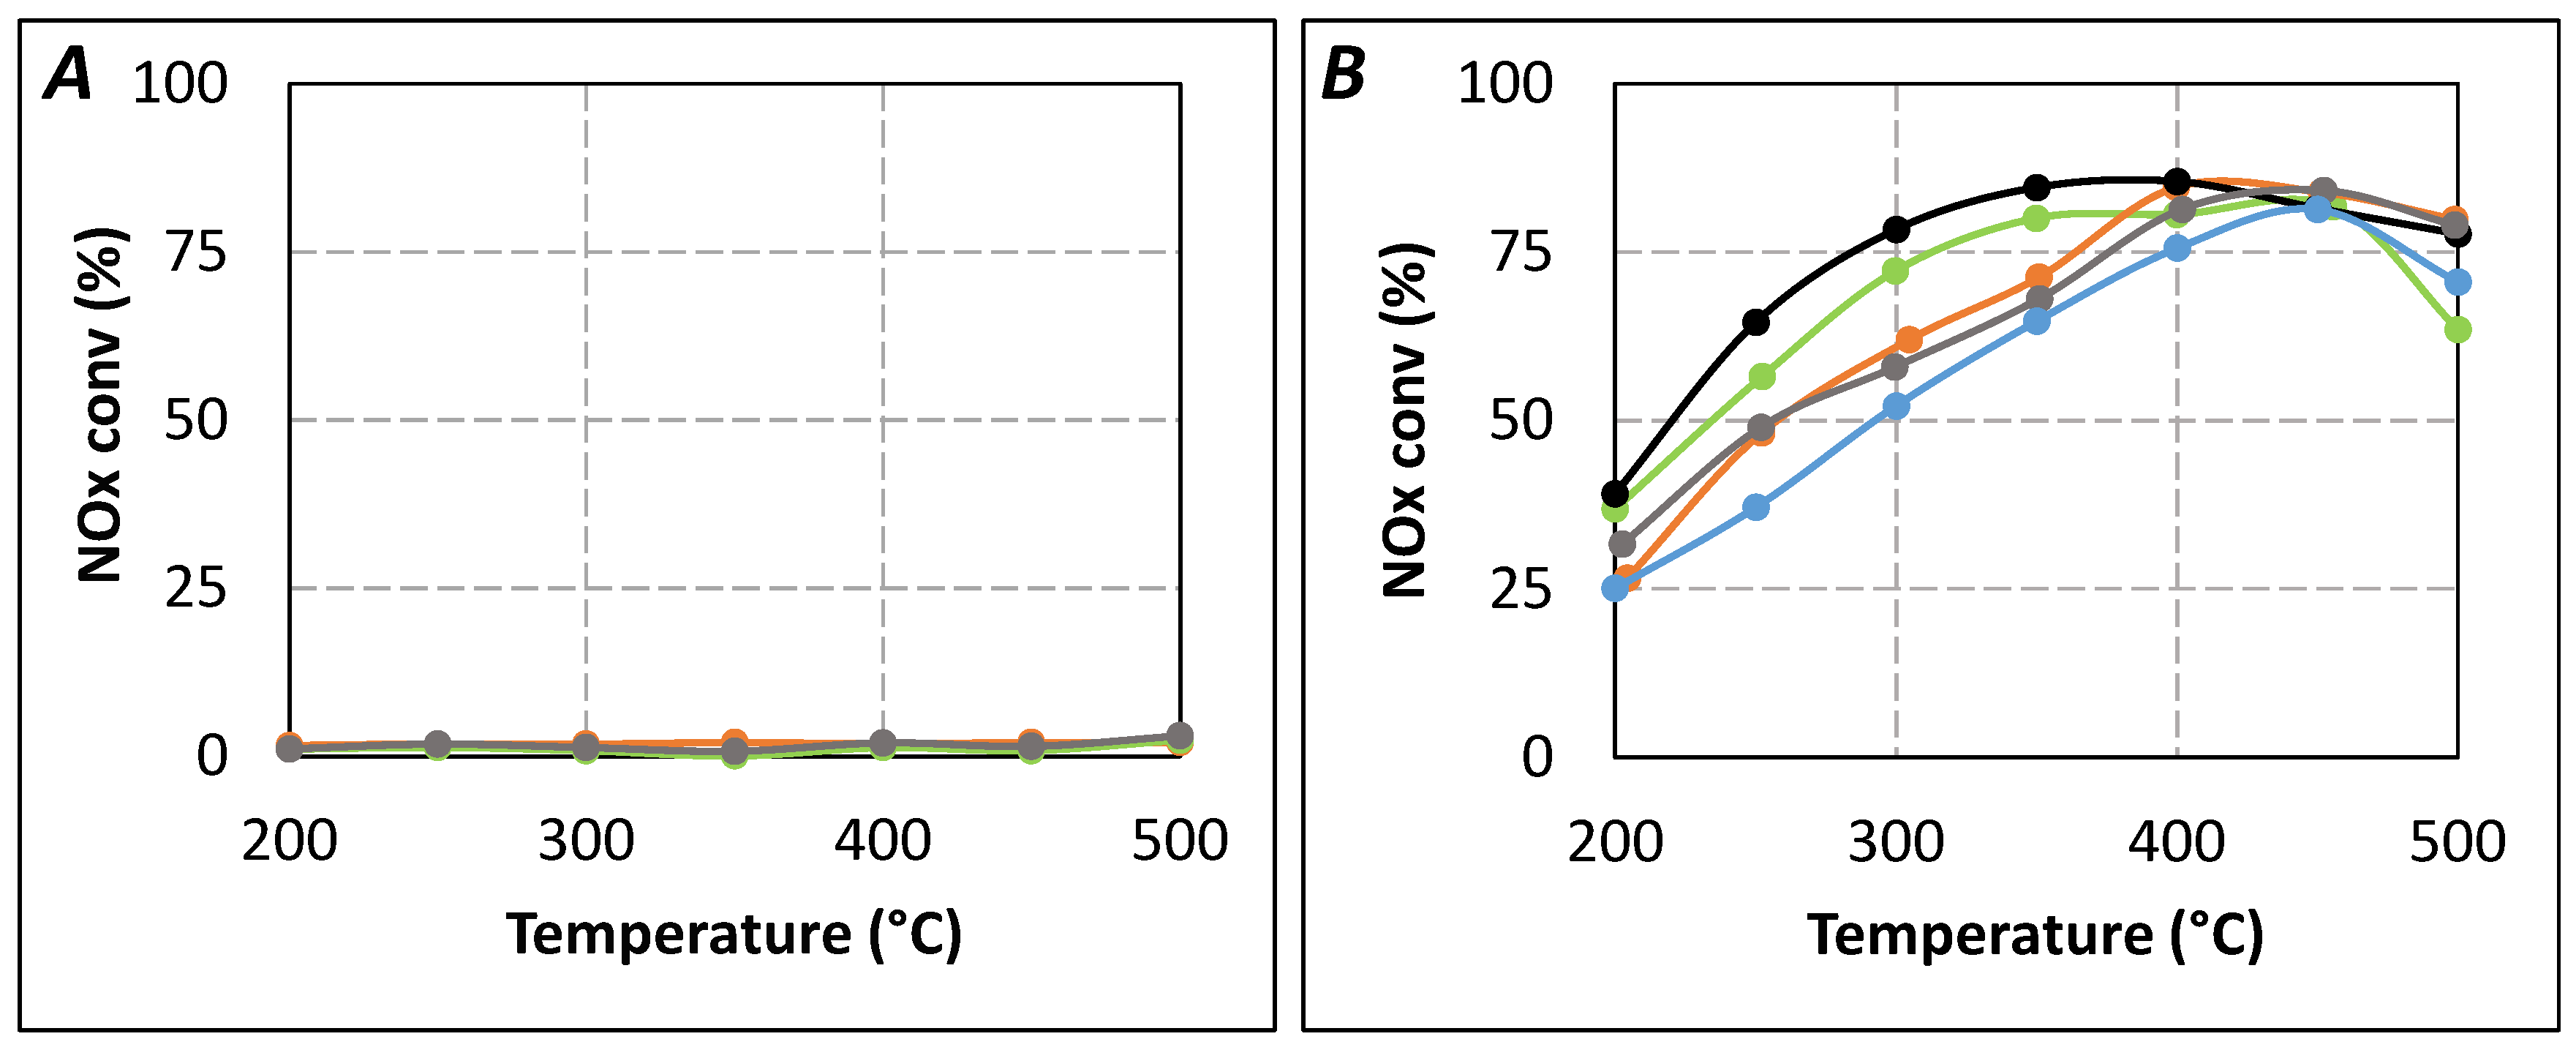
Firstly, preliminary urea-SCR catalytic tests were performed with only the single oxides (
Figure 7A). All of them showed no significant NO
x reduction in the 200–500 °C temperature range. Only ammonia oxidation was observed at high temperature, the NH
3 conversion reached 13%, 15%, and 13% at 500 °C for Al
2O
3, TiO
2, and ZrO
2, respectively. Secondly, it was also verified that the addition of an inert material as additional first catalytic bed (SiC with the same granulometry as the single oxides) does not impact the NO
x and NH
3 conversion with the SCR catalyst placed at
tR = 4.0 s (no effect of additional contact surface on the NH
3 availability, result not shown).
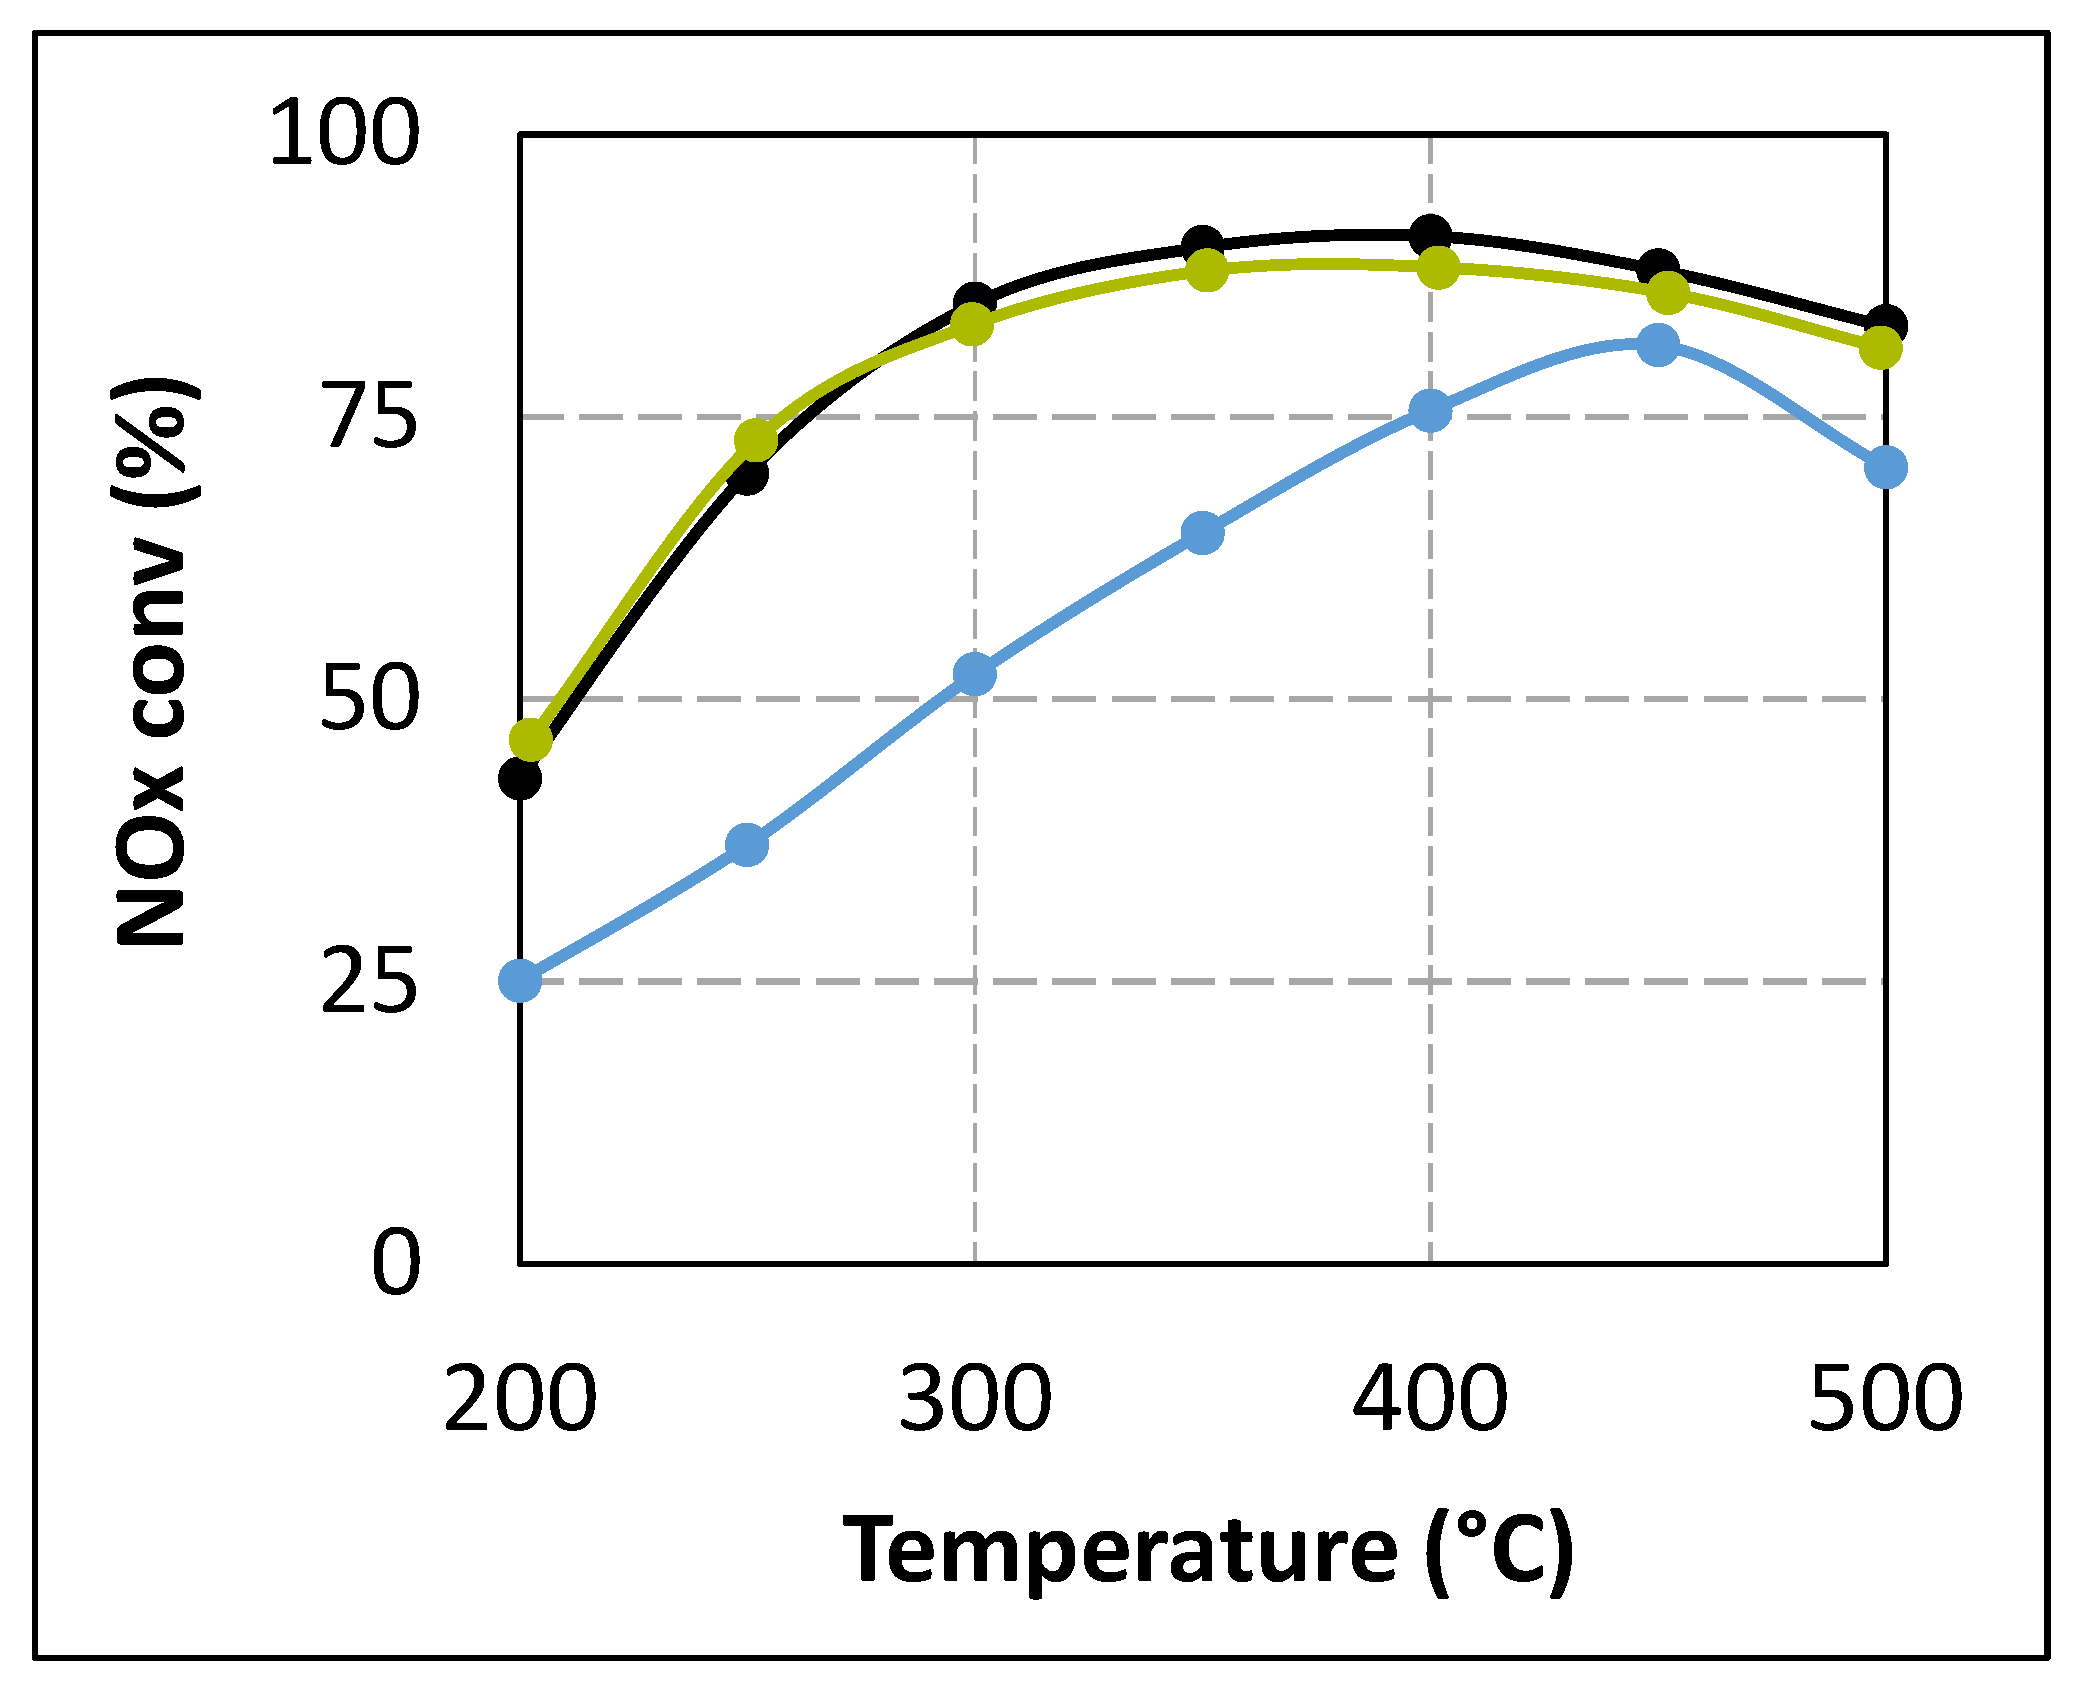
Figure 7.
Effect of catalytic double bed in urea-SCR results in standard condition (400 ppm NO, 400 ppmeq. NH3, 8% H2O, 10% CO2, 10% O2). (A) Single oxide (tR = 4.0 s). (▬): ZrO2(100mg) only; (▬): TiO2(100mg) only; (▬): Al2O3(100mg) only; (B) Double catalytic bed. (▬): SCR only (tR = 5.2 s); (▬): ZrO2(100mg) + SCR (tR = 4.0 s); (▬): TiO2(100mg) + SCR (tR = 4.0 s); (▬): Al2O3(100mg) + SCR (tR = 4.0 s); (▬): SCR only (tR = 4.0 s).
Figure 7B describes the NO
x conversion obtained with the use of a primary upstream catalytic bed composed of the single oxides (100 mg of Al
2O
3, TiO
2, or ZrO
2), whereas the SCR catalyst position correspond to a
tR of 4.0 s. For comparison, results already presented in
Figure 2A with
tR = 4.0 s and
tR = 5.2 s are also plotted. Results depicted in
Figure 7B show that the NO
x conversion is just a little improved by the addition of Al
2O
3 despite its relatively high surface area (approximately four times higher than TiO
2 or ZrO
2). Conversely, the addition of TiO
2 allows a slightly better improvement of the NO
x conversion, especially in the 300–400 °C temperature range. The beneficial effect of ZrO
2 is more significant, approximately half of NO
x conversion loss between
tR = 5.2 s (same activity compared with the direct use of NH
3) and
tR = 4.0 s is recovered. In the same time, the NO
2/NO
x outlet ratio (
Table 2) remains unchanged compared to the results obtained with
tR = 4.0 s, irrespective of the type of the materials added upstream of the SCR catalyst.
Finally, the partial recovery of the NO
x conversion with the addition of a first catalytic bed depends on the following order: ZrO
2 > TiO
2 > Al
2O
3. According to the previously mentioned work [
23], it is proposed that the decrease of the NO
x conversion between
tR = 5.2 s and
tR = 4.0 s is mainly attributable to a limitation of the HNCO hydrolysis, impacting the NH
3 availability.
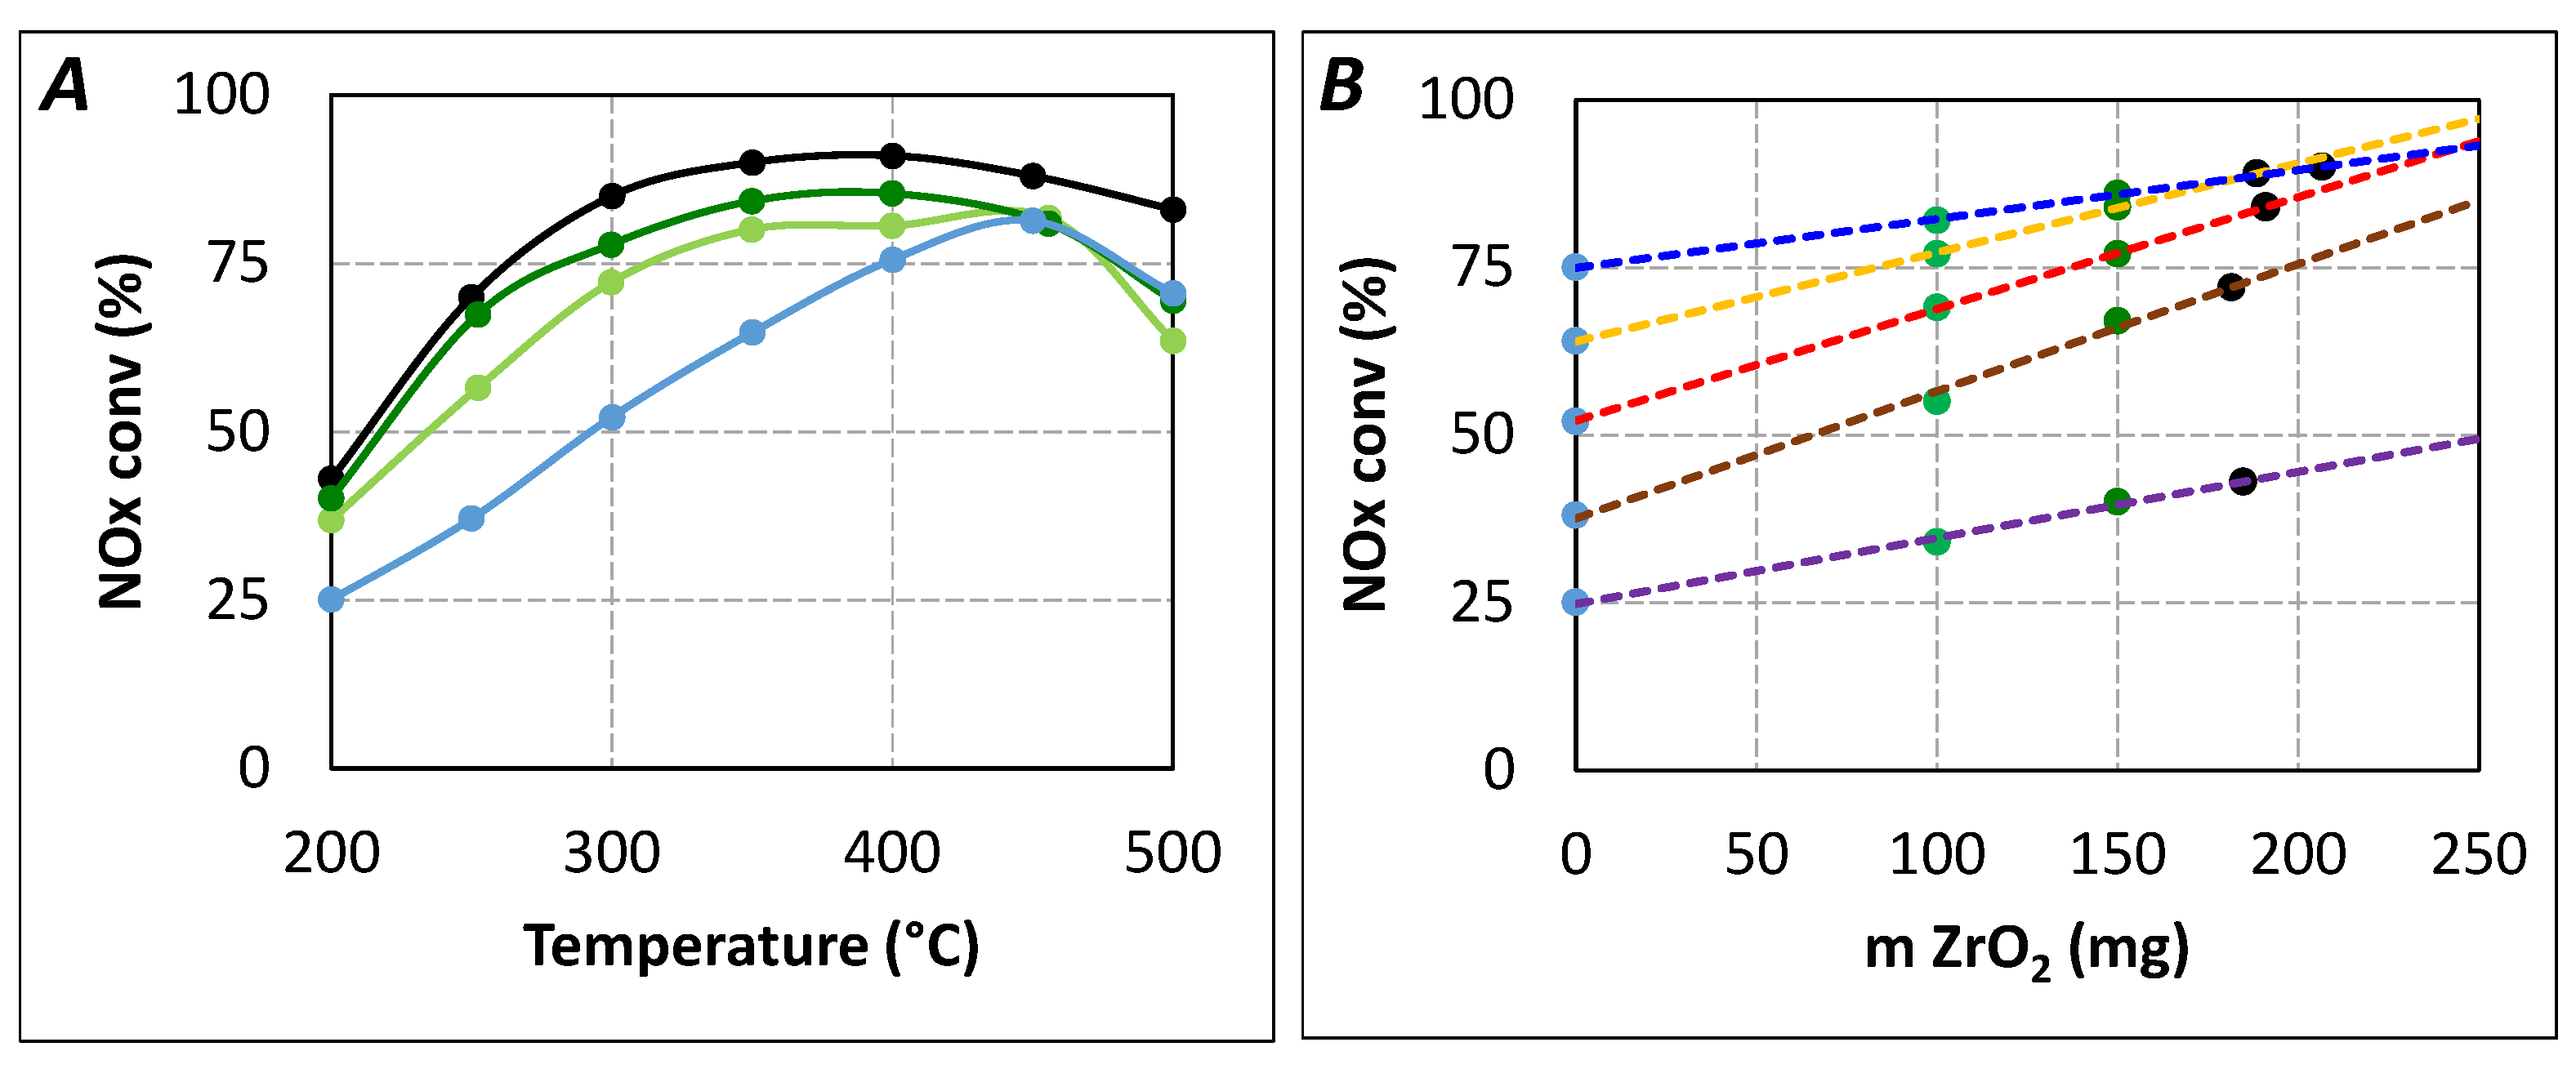
Additional urea-SCR tests were performed with 150 mg ZrO
2 in order to evaluate the relationship between the ZrO
2 weight and the NO
x conversion recovery. Results are presented in
Figure 8A (NO
x conversion) and
Figure 8B (relationship between the ZrO
2 weight and the recovery). This figure clearly indicates that the NO
x conversion recovery is linearly correlated with the ZrO
2 weight,
i.e., to the amount of sites able to produce NH
3. It also allows the evaluation of the ZrO
2 amount necessary to obtain the same DeNO
x activity as for
tR = 5.2 s. The extrapolation of
Figure 8B gives a ZrO
2 weight of approximately 190 mg.
Figure 8.
Influence of ZrO2 weight in DeNOx efficiency for urea residence time of 4.0 s in standard condition (400 ppm NO, 400 ppmeq. NH3, 8% H2O, 10% CO2, 10% O2). (A) NOx conversion versus temperature. (▬): SCR catalyst (tR = 5.2 s); (▬): ZrO2(100mg) + SCR catalyst (tR = 4.0 s); (▬): ZrO2(150mg) + SCR catalyst (tR = 4.0 s); (▬): SCR catalyst (tR = 4.0 s); (B) NOx conversion versus ZrO2 weight. (▬): 200 °C; (▬): 250 °C; (▬): 300 °C; (▬): 350 °C; (▬): 450 °C.
Interestingly, note that ZrO
2 in sufficient quantity is the only material which, located upstream of the SCR catalyst, is able to increase the NO
2/NO
x outlet ratio and recover the values obtained with ammoniac or for longer urea residence times (
Table 2). In the same time, the (NH
3 conversion/NO
x conversion) ratio (
Table 2) also reaches values observed with NH
3 or
tR = 5.2 s, whatever the temperature. All these observations show that ZrO
2 addition exhibits the same effects as direct ammonia use and confirm its major role in obtaining ammonia.
Assuming that HNCO is available at the catalyst surface when the urea residence time is fixed at 4.0 s, SCO tests described in
Section 2.2.2 indicate that HNCO is more reactive than NH
3 toward oxygen. Then, a plausible assumption to explain the fact that NO
2 is not emitted until 350 °C when urea is injected with
tR = 4.0 s (
Figure 3) is that NO
2, a stronger oxidizer than O
2, is able to oxidize HNCO without NO
x reduction. Possible reactions are proposed below (Equations (11) and (12)):
In addition, these reactions would also lead to a lack of reductant for NO
x reduction. This hypothesis is also in accordance with results reported in
Figure 2B: the reductant consumption appears 20% higher than the NO
x conversion at 350 and 400 °C. At lower temperature, NO
2 formation is limited to few ppm and it is not sufficient to observe a change in the NH
3 conversion/NO
x conversion ratio.


