
Eurocode Design of Recycled Aggregate Concrete for Chloride Environments: Stochastic Modeling of Chloride Migration and Reliability-Based Calibration of Cover


Abstract
:1. Introduction
1.1. General Introduction
1.2. Properties of Recycled Aggregate Concrete
2. Chloride Cover Design and Reliability and Modeling of Depassivation by Chloride Ions
2.1. Eurocode 2 Concrete Cover Design
2.2. Fib Bulletin 34 Model for Depassivation Due to Chloride Ingress
3. Materials and Methods
3.1. Test Protocol
- Slump [41], measured on a standard Abrams’ cone immediately after mixing;
- Compressive strength [42], tested with a load rate of 0.6 MPa/s;
- Non-steady-state chloride migration [24], in which samples are put into vacuum, submerged in a solution saturated with calcium hydroxide, and subjected to forced chloride ingress (through electrical current, a catholyte solution of sodium chloride, and an anolyte solution of sodium hydroxide) in a migration cell.
3.2. Raw Materials
3.3. Concrete Mix Design
4. Results
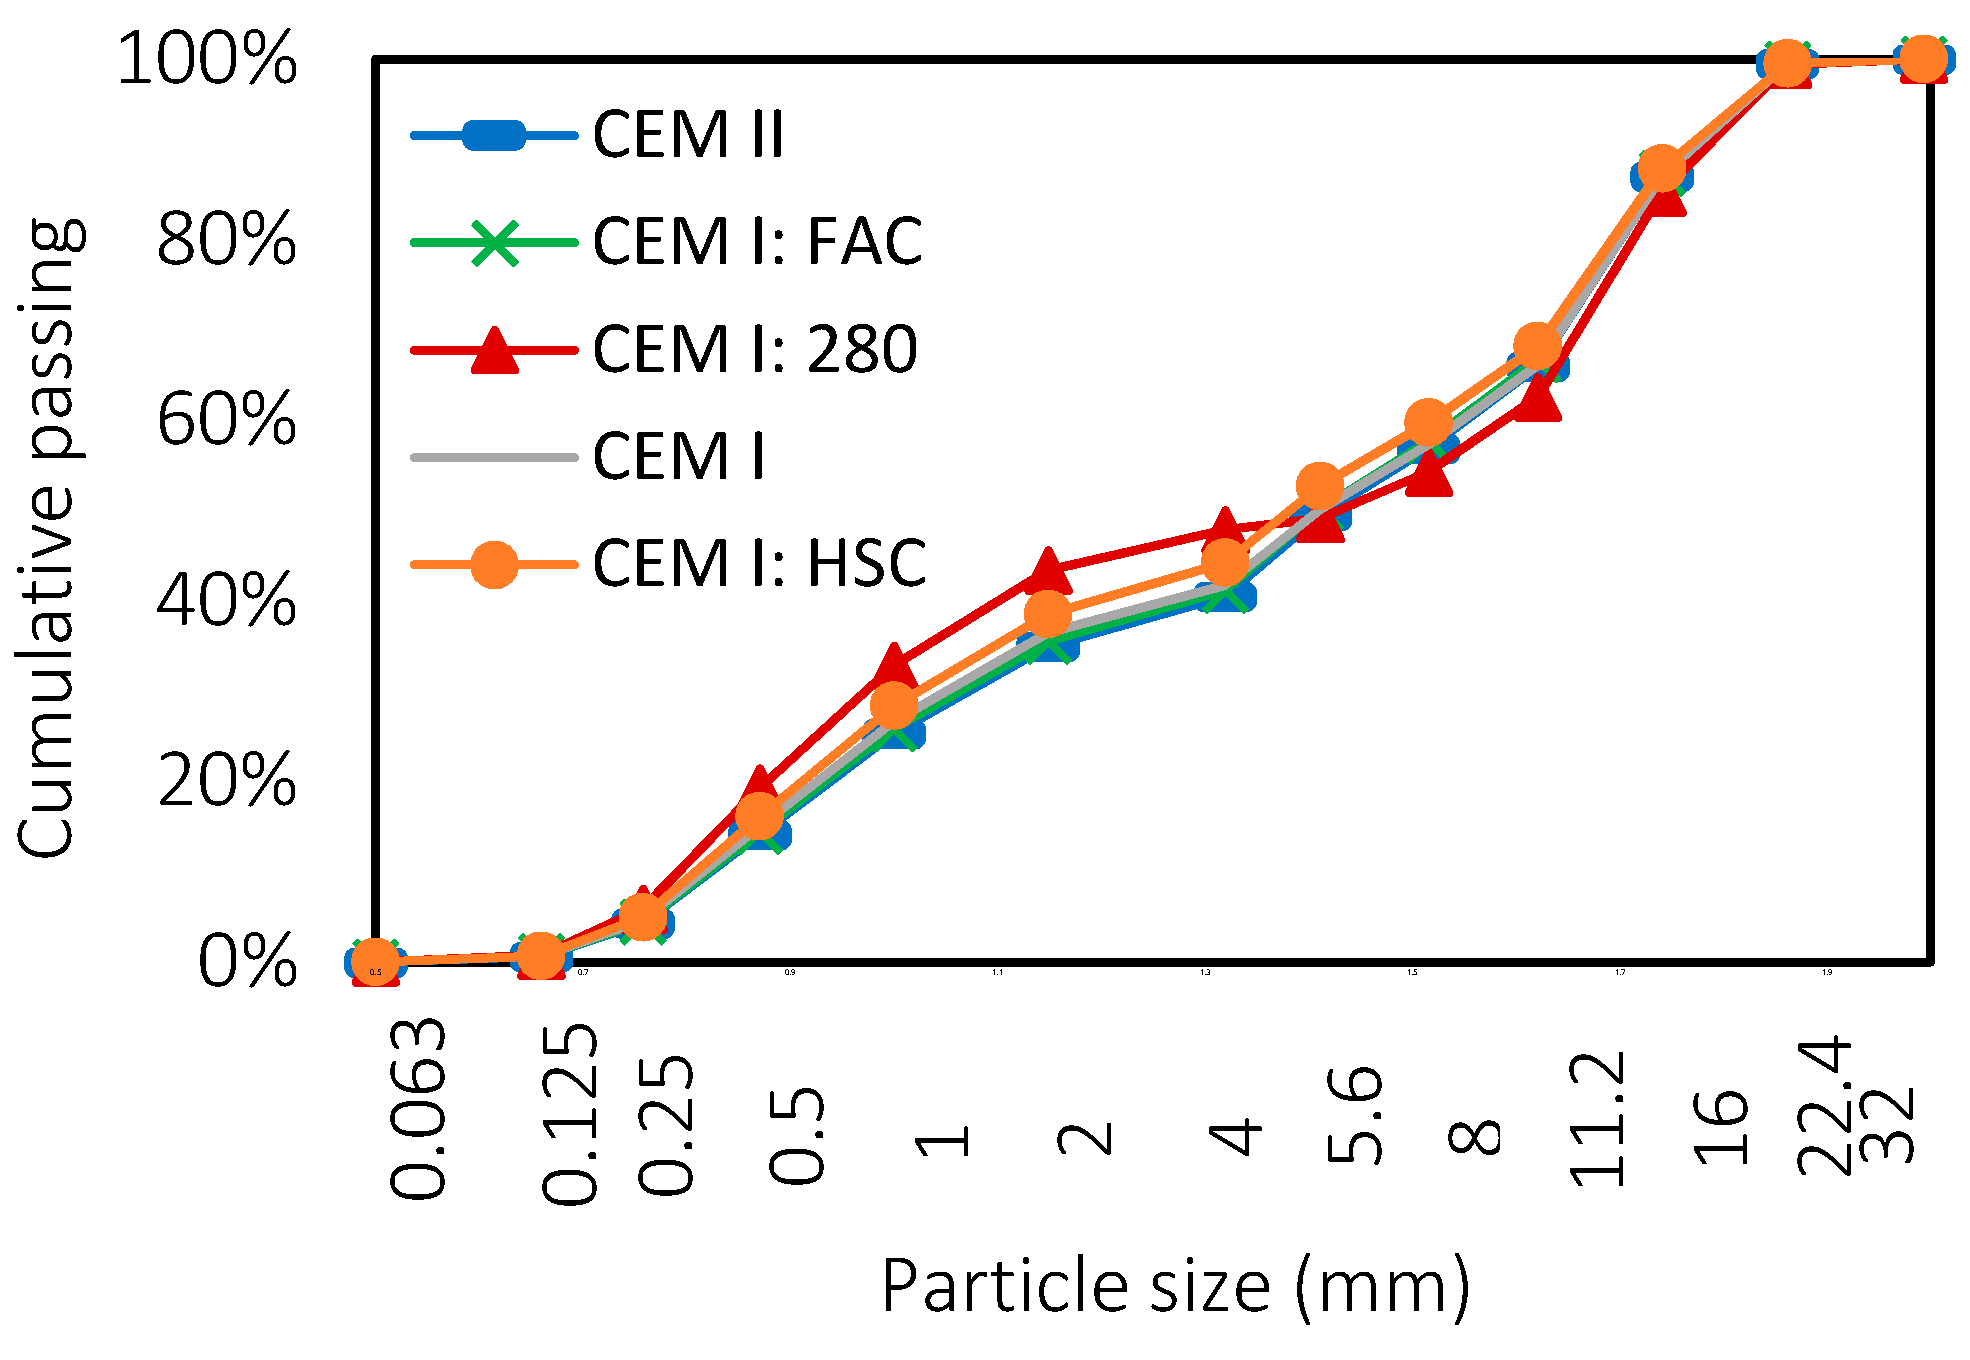
4.1. Aggregates
- The shape index of NA was 15.39, while that of RA was 16.25. Larger shape indices are associated to more elongated particles and to workability losses;
- The 24 h water absorption of NA was small (1.3%), while that of RA was quite large (9.28%) and needs to be accounted for when batching;
- The density of RA (2478 kg/m3) is smaller than that of NA (2657 kg/m3). This is due to the smaller density of the attached mortar (a rough estimate is 2000 kg/m3 [47] for conventional concrete mix design) in comparison to the density of limestone (e.g., of the limestone used in this paper has a density of 2657 kg/m3). This was accounted for during mix design, since coarse aggregate replacement is done by volume (see Section 3.3).
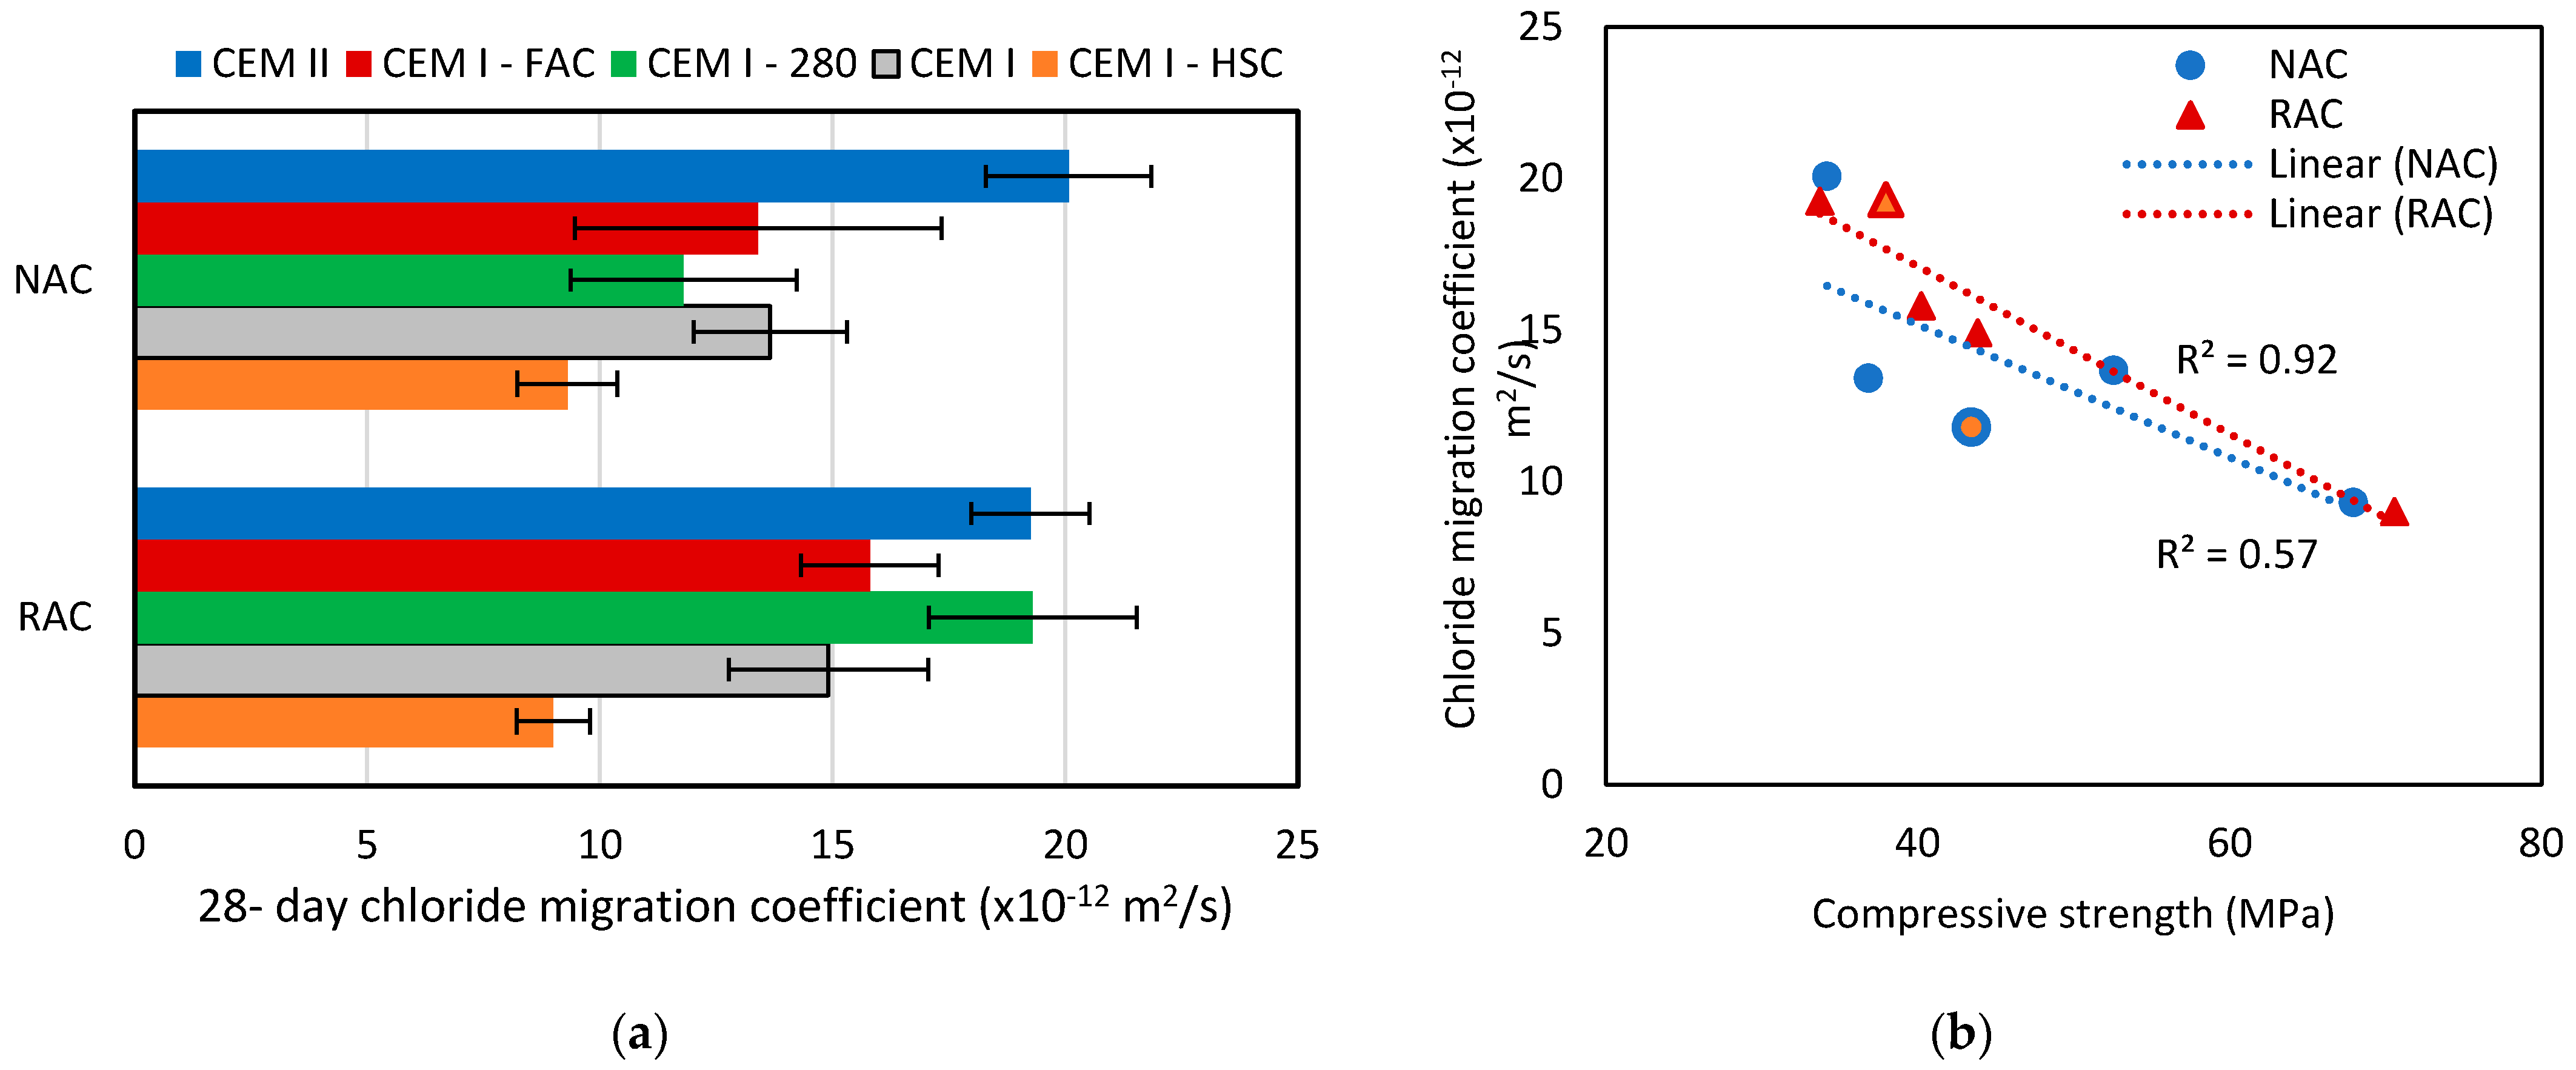
4.2. Concrete
5. Reliability-Based Calibration of Concrete Cover
6. Conclusions
- Decreased the compressive strength;
- Increased the water absorption by capillarity;
- Increased the chloride migration coefficient.
- These findings agree with the state of the art on the properties of recycled aggregate concrete and are caused by the porosity of recycled aggregates and by the increase in the water/cement ratio required to offset the influence of recycled aggregates on workability.
- Normal distributions suit the experimental data of chloride migration tests well;
- Recycled aggregates did not increase the variability of this property. Similar findings have been reported in other publications that studied the variability of the mechanical properties of concrete produced with recycled aggregates produced from concrete waste;
- The negligible influence of these recycled aggregates on the variability of the chloride migration coefficient may be due to internal curing mechanisms, though more research should follow to confirm this hypothesis.
- The use of recycled aggregates somewhat reduces the reliability index;
- This effect is caused by the influence of the incorporation of recycled aggregates on the mean value of the chloride migration coefficient;
- An increase of concrete cover of 5 mm is recommended as a compromise that ensures that the reliability index of recycled aggregate concrete is at least as large as that of natural aggregate concrete;
- The overall uncertainty of concrete cover design is mostly dependent on the uncertainty of parameters of design that do not depend on recycled aggregates (e.g., the ageing exponent of fib Bulletin 34 and the superficial chloride content). Therefore, the practical consequences of recycled aggregate incorporation on concrete cover design for chloride ingress may be assessed through the mean values of experimental data.
- The definition of ageing exponents that depend on the type of binder, in order to reduce the effect of the uncertainty of this parameter in the reliability;
- The experimental testing of the variability of other durability mechanisms, such as carbonation ingress and sulfate attack, and of concrete made with other types of recycled aggregates, such as fine recycled aggregates and recycled aggregates produced from other types of waste;
- The definition of strength classes and environmental exposure conditions that are ideal for applications of recycled aggregate concrete. This task has to be performed while taking into consideration the practical implications of using recycled aggregate concrete for the structural design (the volume of concrete will tend to increase when recycled aggregates are incorporated) and should be assessed through economic and environmental life-cycle assessments.
Author Contributions
Funding
Data Availability Statement
Acknowledgments
Conflicts of Interest
References
- De Brito, J.; Silva, R. Current status on the use of recycled aggregates in concrete: Where do we go from here? RILEM Tech. Lett. 2016, 10, 1–5. [Google Scholar] [CrossRef]
- Xiao, J. Recycled Aggregate Concrete Structures; Tracts in Civil Engineering; Springer: Berlin, Germany, 2018; 668p. [Google Scholar]
- Thomas, C.; Setién, J.; Polanco, J.A.; Alaejos, P.; Sánchez de Juan, M. Durability of recycled aggregate concrete. Constr. Build. Mater. 2013, 40, 1054–1065. [Google Scholar] [CrossRef]
- Silva, R.V.; de Brito, J.; Dhir, R.K. Properties and composition of recycled aggregates from construction and demolition waste suitable for concrete production. Constr. Build. Mater. 2014, 65, 201–217. [Google Scholar] [CrossRef]
- Pacheco, J.; de Brito, J.; Ferreira, J.; Soares, D. Destructive horizontal load tests of full-scale recycled aggregate concrete structures. ACI Struct. J. 2015, 112, 815–826. [Google Scholar] [CrossRef] [Green Version]
- Xiao, J.; Wang, C.; Ding, T.; Akbarnezhad, A. A recycled aggregate concrete high-rise building: Structural performance and embodied carbon footprint. J. Clean. Prod. 2018, 199, 868–881. [Google Scholar] [CrossRef]
- Khoury, E.; Ambrós, W.; Cazacliu, B.; Sampaio, C.H.; Remond, S. Heterogeneity of recycled concrete aggregates, an intrinsic variability. Constr. Build. Mater. 2018, 175, 705–713. [Google Scholar] [CrossRef]
- Pepe, M.; Grabois, T.M.; Silva, M.A.; Tavares, L.M.; Toledo Filho, R.D. Mechanical behaviour of coarse lightweight, recycled and natural aggregates for concrete. Proc. Inst. Civil Eng. Constr. Mater. 2018, 173, 70–78. [Google Scholar] [CrossRef]
- Pacheco, J.; de Brito, J.; Chastre, C.; Evangelista, L. Experimental investigation on the variability of the main mechanical properties of recycled aggregate concrete. Constr. Build. Mater. 2019, 201, 110–120. [Google Scholar] [CrossRef]
- Nowak, A.S.; Szerszen, M. Calibration of Design Code for Buildings (ACI 318): Part 1—Statistical Models for Resistance. ACI Struct. J. 2003, 100, 377–382. [Google Scholar] [CrossRef]
- Foster, S.J.; Stewart, M.G.; Loo, M.; Ahammed, M.; Sirivivatnanon, V. Calibration of Australian Standard AS3600 Concrete structures: Part I statistical analysis of material properties and model error. Aust. J. Struct. Eng. 2016, 17, 242–253. [Google Scholar] [CrossRef]
- Gulvanessian, H.; Holický, M. Reliability based calibration of Eurocodes considering a steel member. In Proceedings of the JCSS Workshop on Reliability Based Code Calibration, Zurich, Switzerland, 21–22 March 2002. [Google Scholar]
- Tam, V.W.Y.; Tam, C.M.; Le, K.N. Removal of cement mortar remains from recycled aggregate using pre-soaking approaches. Resour. Conserv. Recy. 2007, 50, 82–101. [Google Scholar] [CrossRef] [Green Version]
- De Brito, J.; Ferreira, J.; Pacheco, J.; Soares, D.; Guerreiro, M. Structural, material, mechanical and durability properties and behaviour of recycled aggregates concrete. J. Build. Eng. 2016, 6, 1–16. [Google Scholar] [CrossRef]
- Tattersall, G.H. Workability and Quality Control of Concrete; E&FN Spon: London, UK, 1991; p. 254. [Google Scholar]
- Pacheco, J.; de Brito, J.; Chastre, C.; Evangelista, L. Scatter of constitutive models of the mechanical properties of concrete: Comparison of major international codes. J. Adv. Concr. Technol. 2019, 17, 102–125. [Google Scholar] [CrossRef] [Green Version]
- Zaharieva, R.; Buyle-Bodin, F.; Skoczylas, F.; Wirquin, E. Assessment of the surface permeation properties of recycled aggregate concrete. Cem. Concr. Compos. 2003, 25, 223–232. [Google Scholar] [CrossRef]
- Soares, D.; de Brito, J.; Ferreira, J.; Pacheco, J. Use of coarse recycled aggregates from precast concrete rejects: Mechanical and durability performance. Constr. Build. Mater. 2014, 71, 263–272. [Google Scholar] [CrossRef]
- Zhang, K.; Xiao, J. Prediction model of carbonation depth for recycled aggregate concrete. Cem. Concr. Compos. 2018, 88, 86–99. [Google Scholar] [CrossRef]
- Silva, R.V.; Neves, R.; de Brito, J.; Dhir, R.K. Carbonation behaviour of recycled aggregate concrete. Cem. Concr. Compos. 2015, 62, 22–32. [Google Scholar] [CrossRef] [Green Version]
- Koulouris, A.; Limbachiya, M.C.; Fried, A.N.; Roberts, J.J. Use of recycled aggregate in concrete application: Case studies. In Proceedings of the International Conference on Sustainable Waste Management and Recycling: Challenges and Opportunities; Limbachiya, M.C., Roberts, J.J., Eds.; Thomas Telford: London, UK, 2004; pp. 245–257. [Google Scholar]
- Villagran-Zaccardi, Y.A.; Zega, C.J.; Di Maio, A.A. Chloride penetration and binding in recycled concrete. J. Mater. Civ. Eng. 2008, 20, 449–455. [Google Scholar] [CrossRef]
- fib Bulletin 34: Model Code for Service Life Design; fib: Lausanne, Switzerland, 2006; p. 116.
- NT-Build-492. Concrete, Mortar and Cement-Based Repair Materials: Chloride Migration Coefficient from Non-Steady-State Migration Experiments; Nordtest: Espoo, Finland, 1999; p. 8. [Google Scholar]
- Silva, R.V.; Brito, J.d.; Neves, R.; Dhir, R. Prediction of chloride ion penetration of recycled aggregate concrete. Mater. Res. 2015, 18, 427–440. [Google Scholar] [CrossRef] [Green Version]
- Pacheco, J.; de Brito, J.; Chastre, C.; Evangelista, L. Probabilistic conversion of the compressive strength of cubes to cylinders of natural and recycled aggregate concrete specimens. Materials 2019, 12, 280. [Google Scholar] [CrossRef] [PubMed] [Green Version]
- EN-206. Concrete: Specification, Performance, Production and Conformity. Incorporating Corrigendum May 2014; CEN: Brussels, Belgium, 2013; p. 98. [Google Scholar]
- Vrouwenvelder, T. Eurocode1, basis of design, background information. IABSE Rep. 1996, 74, 25–32. [Google Scholar]
- Gulvanessian, H.; Calgaro, J.A.; Holicky, M. Designers’ guide to EN1990 Eurocode: Basis of structural design. In Designers’ Guide to the Eurocodes; Thomas Telford: London, UK, 2002; p. 197. [Google Scholar]
- ISO-2394:1998. General Principles on Reliability for Structures; ISO: Geneve, Switzerland, 1998; p. 76. [Google Scholar]
- fib Bulletin 76: Benchmarking of Deemed-to-Satisfy Provisions in Standards; fib: Lausanne, Switzerland, 2015; p. 191.
- EN-1992-1-1. Eurocode 2—Design of Concrete Structures: Part 1-1: General Rules and Rules for Buildings; Comité Européen de Normalisation (CEN): Brussels, Belgium, 2008; p. 259. [Google Scholar]
- Von Greve-Dierfeld, S.; Gehlen, C. Performance-based durability design, carbonation, part 3: PSF approach and a proposal for the revision of deemed-to-satisfy rules. Struct. Concr. 2016, 17, 718–728. [Google Scholar] [CrossRef]
- Von Greve-Dierfeld, S.; Gehlen, C. Performance based durability design, carbonation part 1—Benchmarking of European present design rules. Struct. Concr. 2016, 17, 309–328. [Google Scholar] [CrossRef]
- Von Greve-Dierfeld, S.; Gehlen, C. Performance-based durability design, carbonation part 2—Classification of concrete. Struct. Concr. 2016, 17, 523–532. [Google Scholar] [CrossRef]
- JCSS. Probabilistic Model Code. Part 3: Material Properties. 2001. Available online: https://www.jcss-lc.org/publications/jcsspmc/part_iii.pdf (accessed on 11 March 2021).
- EN-933-4. Tests for Geometrical Properties of Aggregates. Determination of Particle Shape. Shape Index; Comité Européen de Normalisation (CEN): Brussels, Belgium, 2008; p. 14. [Google Scholar]
- EN-1097-3. Tests for Mechanical and Physical Properties of Aggregates. Determination of Loose Bulk Density and Voids; Comité Européen de Normalisation (CEN): Brussels, Belgium, 1998; p. 10. [Google Scholar]
- EN-1097-6. Tests for Mechanical and Physical Properties of Aggregates. Determination of Particle Density and Water Absorption; Comité Européen de Normalisation (CEN): Brussels, Belgium, 2013; p. 54. [Google Scholar]
- Rodrigues, F.; Evangelista, L.; de Brito, J. A new method to determine the density and water absorption of fine recycled aggregates. Mater. Res. 2013, 16, 1045–1051. [Google Scholar] [CrossRef] [Green Version]
- EN-12350-2. Testing Fresh Concrete. Slump-Test; Comité Européen de Normalisation (CEN): Brussels, Belgium, 2009; p. 12. [Google Scholar]
- EN-12390-3. Testing Hardened Concrete. Part3: Compressive Strength of Test Specimens; Comité Européen de Normalisation (CEN): Brussels, Belgium, 2009; p. 22. [Google Scholar]
- EN-197. Cement. Composition, Specifications and Conformity Criteria for Common Cements; Comité Européen de Normalisation (CEN): Brussels, Belgium, 2011; p. 50. [Google Scholar]
- Sanchez de Juan, M.; Alaejos Gutierrez, P. Study on the influence of attached mortar content on the properties of recycled concrete aggregate. Constr. Build. Mater. 2009, 23, 872–877. [Google Scholar] [CrossRef]
- EN-933-1. Tests for Geometrical Properties of Aggregates. Determination of Particle Size Distribution. Sieving Method; Comité Européen de Normalisation (CEN): Brussels, Belgium, 2012; p. 22. [Google Scholar]
- Pedro, D.; de Brito, J.; Evangelista, L. Performance of concrete made with aggregates recycled from precasting industry waste: Influence of the crushing process. Mater. Struct. 2015, 48, 3965–3978. [Google Scholar] [CrossRef]
- Lavado, J.; Bogas, J.; de Brito, J.; Hawreen, A. Fresh properties of recycled aggregate concrete. Constr. Build. Mater. 2020, 233, 117322. [Google Scholar] [CrossRef]
- Kurda, R.; de Brito, J.; Silvestre, J.D. A comparative study of the mechanical and life cycle assessment of high-content fly ash and recycled aggregates concrete. J. Build. Eng. 2020, 29, 101173. [Google Scholar] [CrossRef]
- Hirschi, T.; Wombacher, F. Influence of different superplasticizers on UHPC. In Proceedings of the Second International Symposium on Ultra High Performance Concrete; Kassel University Pres: Kassel, Germany, 2008. [Google Scholar]
- Kurad, R.; Silvestre, J.D.; de Brito, J.; Ahmed, H. Effect of incorporation of high volume of recycled concrete aggregates and fly ash on the strength and global warming potential of concrete. J. Clean. Prod. 2017, 166, 485–502. [Google Scholar] [CrossRef]
- Thoft-Christensen, P.; Baker, M.J. Structural Reliability Theory and Its Applications; Springer: Berlin, Germany, 1982. [Google Scholar]
- Pacheco, J.; de Brito, J.; Chastre, C.; Evangelista, L. Statistical analysis of Portuguese ready-mixed concrete production. Constr. Build. Mater. 2019, 209, 283–294. [Google Scholar] [CrossRef]
- Henry, M.; Hagiwara, K.; Nishimura, T.; Kato, Y. Effect of recycled aggregate quality on variation and estimation of concrete strength. Proc. Jpn. Concr. Inst. 2011, 33, 1535–1540. [Google Scholar]
- Ying, J.; Xiao, J.; Meng, Q. On Probability Distribution of Chloride Diffusion Coefficient for Recycled Aggregate Concrete. Int. J. Concr. Struct. Mater. 2016, 10, 61–73. [Google Scholar] [CrossRef] [Green Version]
- Etxeberria, M.; Vazquez, E.; Mari, A.; Barra, M. Influence of amount of recycled coarse aggregates and production process on properties of recycled aggregate concrete. Cem. Concr. Res. 2007, 37, 735–742. [Google Scholar] [CrossRef]
- Yildirim, S.T.; Meyer, C.; Herfellner, S. Effects of internal curing on the strength, drying shrinkage and freeze–thaw resistance of concrete containing recycled concrete aggregates. Constr. Build. Mater. 2015, 91, 288–296. [Google Scholar] [CrossRef]
- LNEC-E465. Methodology for Estimating the Concrete Performance Properties Allowing to Comply with the Design Working Life of the Reinforced or Prestressed Concrete Structures under the Environmental Exposures XC and XS (in Portuguese); National Laboratory of Civil Engineering (Laboratório Nacional de Engenharia Civil—LNEC): Lisboa, Portugal, 2005; p. 25. [Google Scholar]
- Lemaire, M. Structural Reliability; Jone Wiley & Sons: Hoboken, NJ, USA, 2009; p. 504. [Google Scholar]
- Der Kiureghian, A.; Ditlevsen, O. Aleatory or epistemic? Does it matter? Struct. Saf. 2009, 31, 105–112. [Google Scholar] [CrossRef]


| Parameter | Mean Value | Standard Deviation | Probability Distribution | Source |
|---|---|---|---|---|
| Δa—uncertainty in concrete cover | 2.5 mm (columns) 5.0 mm (slabs) | 5 mm | Normal | [36] |
| —chloride migration coefficient | Section 4. | Section 4. | Normal | Section 4 |
| —ageing exponent | 0.30 *1 | 0.12 *1 | Beta (a = 0; b = 1) *1 | [31] |
| —transfer parameter | 1.0 | - | Deterministic | [31] |
| —regression parameter | 4800 | 700 | Normal | [31] |
| —real temperature | 288 K | 8 K | Normal | [31] |
| —reference temperature | 293 K | - | Deterministic | [31] |
| —transfer function | 10 mm*2 | 5 mm *2 | Beta (a = 0; b = 50) *2 | [31] |
| —initial chloride content of concrete | 0 | - | Deterministic | [31] |
| —superficial chloride content | 1.5 wt. %/cement | 1.13 wt. %/cement | Lognormal | [31] |
| —critical chloride content | 0.6 wt. %/cement | 0.15 wt. %/cement | Beta (a = 0.2; b = 2) | [31] |
| Mix | Fine Aggregates | NA | RA | Water | w/c | Cement Type | FA | HRWRA |
|---|---|---|---|---|---|---|---|---|
| CEM II—NAC | 710 | 1116 | - | 186.0 | 0.53 | CEM II/B-L 32.5N | 0 | - |
| CEM II—RAC | 710 | - | 1009 | 199.3 | 0.57 | CEM II/B-L 32.5N | 0 | - |
| CEM I—NAC | 705 | 1141 | - | 186.2 | 0.53 | CEM I 42.5R | 0 | - |
| CEM I—RAC | 705 | - | 1032 | 201.7 | 0.58 | CEM I 42.5R | 0 | - |
| CEM I: FAC—NAC | 722 | 1107 | 184 | 0.64 * | CEM I 42.5R | 61.68 | ||
| CEM I: FAC—NAC | 722 | 1001 | 196.3 | 0.68 * | CEM I 42.5R | 61.68 | ||
| CEM I: 280—NAC | 886 | 950 | 179.2 | 0.64 | CEM I 42.5R | 0 | ||
| CEM I: 280—NAC | 886 | 864 | 202.8 | 0.72 | CEM I 42.5R | 0 | ||
| CEM I: HSC—NAC | 784 | 1049 | - | 143.5 | 0.41 | CEM I 42.5R | 0 | 3.5 |
| CEM I: HSC—RAC | 784 | - | 949 | 152.6 | 0.44 | CEM I 42.5R | 0 | 3.5 |
| Mix | Slump | w/c |
|---|---|---|
| CEM II—NAC | 115 mm | 0.53 |
| CEM II—RAC | 119 mm | 0.57 |
| CEM I: FAC—NAC | 145 mm | 0.64 * |
| CEM I: FAC—NAC | 135 mm | 0.68 * |
| CEM I: 280—NAC | 138 mm | 0.64 |
| CEM I: 280—RAC | 149 mm | 0.72 |
| CEM I—NAC | 120 mm | 0.53 |
| CEM I—RAC | 123 mm | 0.58 |
| CEM I: HSC—NAC | 140 mm | 0.41 |
| CEM I: HSC—RAC | 117 mm | 0.44 |
| Composition | Ratio RAC/NAC | Proposed (Mean) Standard Deviation | Probability Distribution |
|---|---|---|---|
| CEM II | 0.72 | 1.50 | Normal |
| CEM I: FAC | 0.38 | 2.70 | Normal |
| CEM I: 280 | 0.92 | 2.35 | Normal |
| CEM I | 1.30 | 1.90 | Normal |
| CEM I: HSC | 0.73 | 0.95 | Normal |
Publisher’s Note: MDPI stays neutral with regard to jurisdictional claims in published maps and institutional affiliations. |
© 2021 by the authors. Licensee MDPI, Basel, Switzerland. This article is an open access article distributed under the terms and conditions of the Creative Commons Attribution (CC BY) license (http://creativecommons.org/licenses/by/4.0/).
Share and Cite
Albuquerque, A.; Pacheco, J.N.; Brito, J.d. Eurocode Design of Recycled Aggregate Concrete for Chloride Environments: Stochastic Modeling of Chloride Migration and Reliability-Based Calibration of Cover. Crystals 2021, 11, 284. https://doi.org/10.3390/cryst11030284
Albuquerque A, Pacheco JN, Brito Jd. Eurocode Design of Recycled Aggregate Concrete for Chloride Environments: Stochastic Modeling of Chloride Migration and Reliability-Based Calibration of Cover. Crystals. 2021; 11(3):284. https://doi.org/10.3390/cryst11030284
Chicago/Turabian StyleAlbuquerque, António, João Nuno Pacheco, and Jorge de Brito. 2021. "Eurocode Design of Recycled Aggregate Concrete for Chloride Environments: Stochastic Modeling of Chloride Migration and Reliability-Based Calibration of Cover" Crystals 11, no. 3: 284. https://doi.org/10.3390/cryst11030284