3.2. Sesquioxides
All sesquioxide samples show four emission bands that are composed of a series of well-separated peaks, as expected by the strong crystal field of these crystal matrixes [
27]. The first band extends from 11,500 cm
−1 to 10,000 cm
−1 and corresponds to the
4F
3/2 →
4I
9/2 transition, the second extends from 9600 cm
−1 to 8600 cm
−1 and corresponds to the
4F
3/2 →
4I
11/2 transition, and the third extends from 7800 cm
−1 to 6700 cm
−1 and corresponds to the
4F
3/2 →
4I
13/2 transition. The peak position agrees with the energy level position reported in the literature [
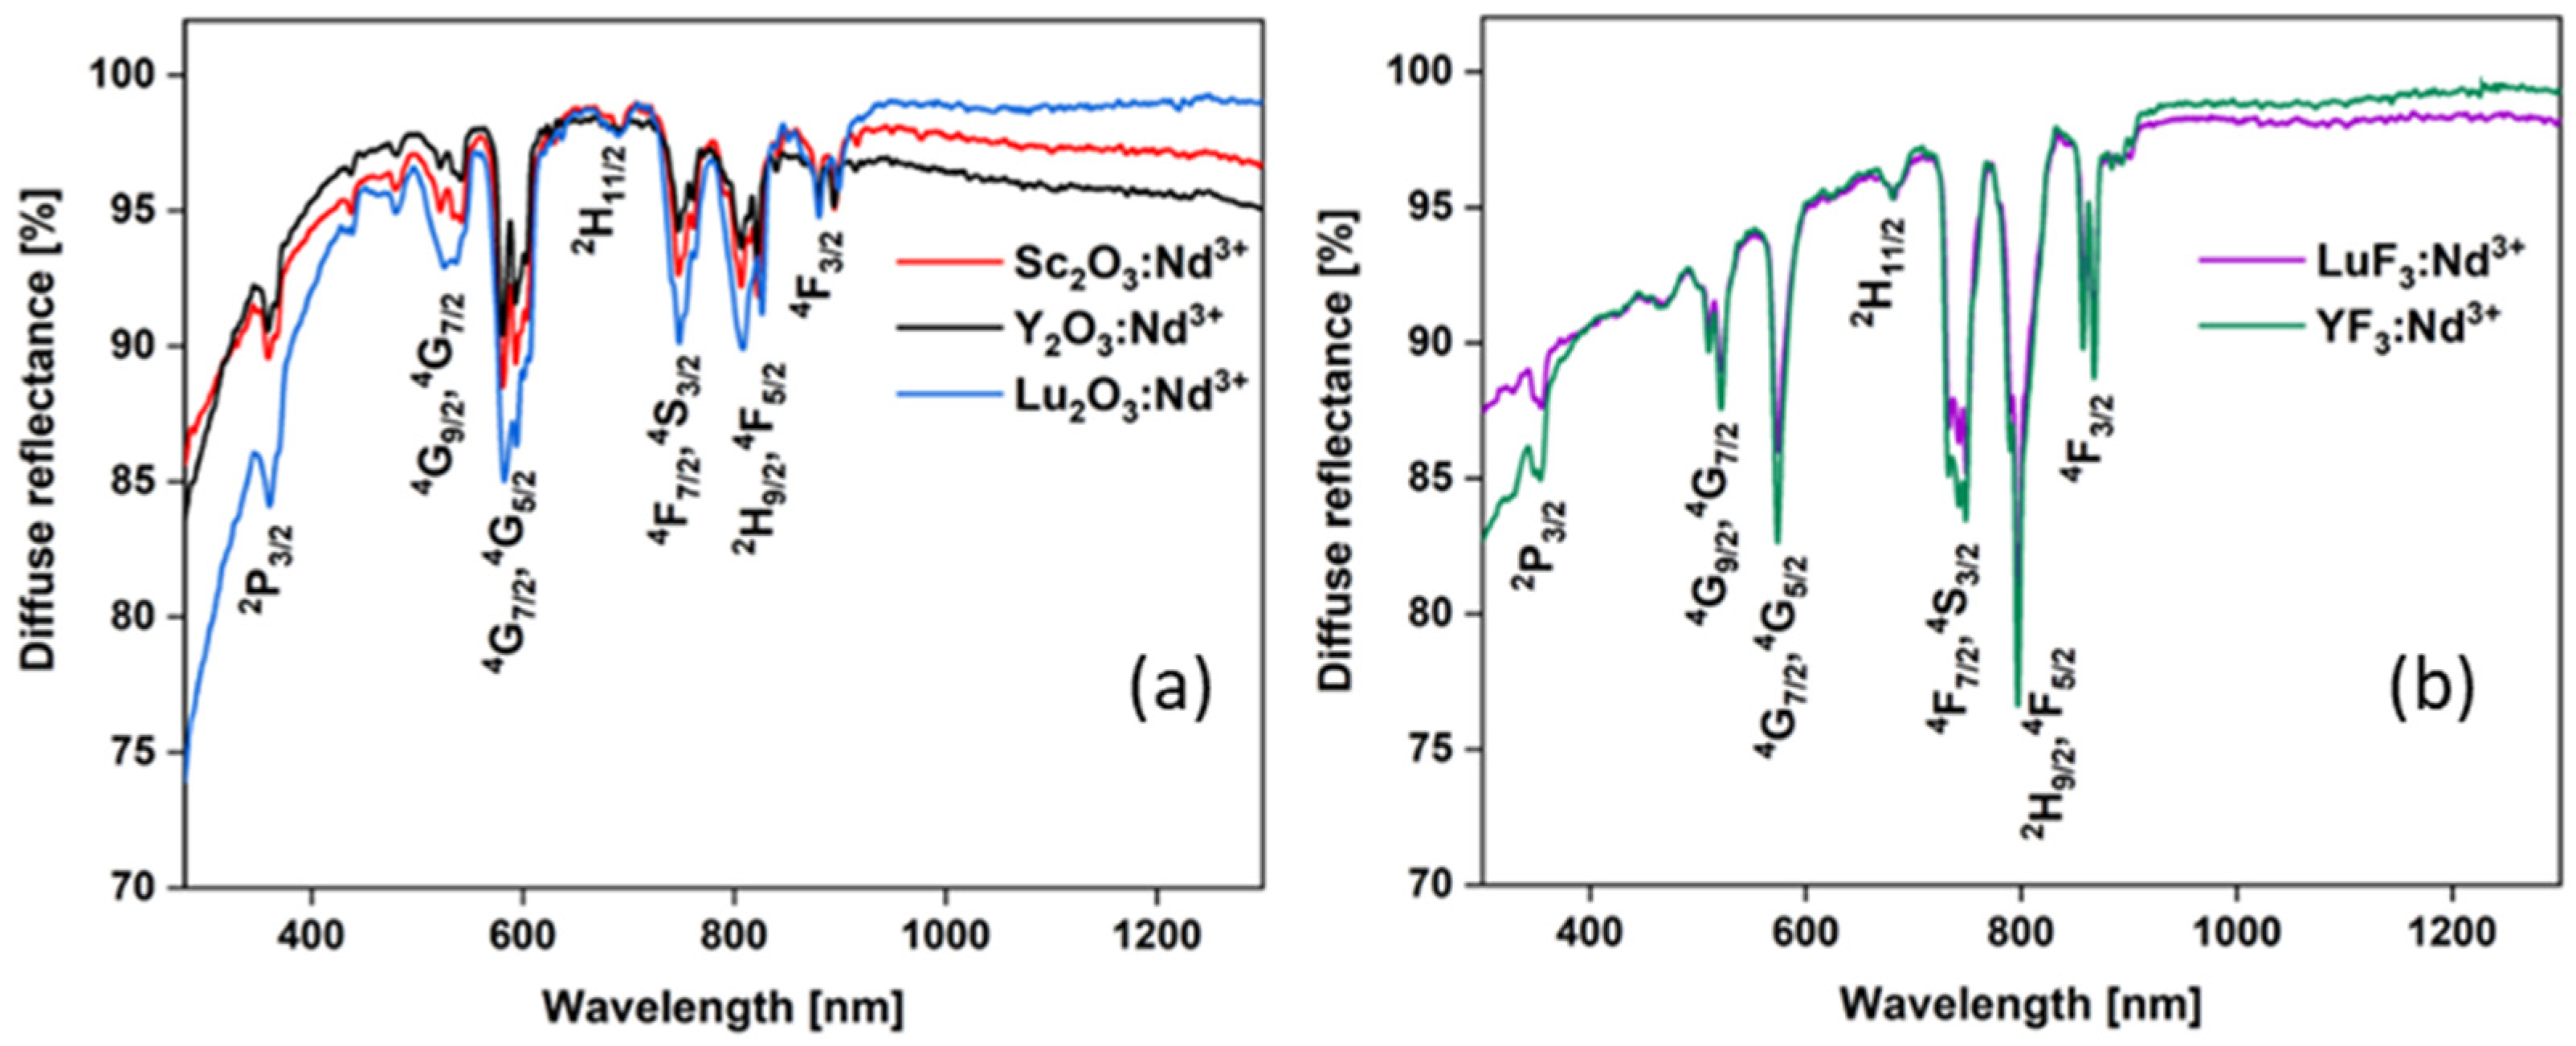
27]. Spectra are very similar among the various compositions. In fact, we can notice a strong similarity in the shape of these emission spectra, with only a small shift of the emission features and small differences in the relative emission intensity among the three compounds. This is not unexpected since Y
2O
3, Sc
2O
3, and Lu
2O
3 are isomorphs. When going from Y
2O
3 to Lu
2O
3 and to Sc
2O
3, the emission features experience a tendency to redshift that is more pronounced for the longest wavelength emission peaks within each band. This can be ascribed to the increasing crystal field strength in the three compounds [
20]. The strongest peaks of the first band are located at 10,560 cm
−1 (947 nm) in Y
2O
3, 10,240 cm
−1 (977 nm) in Lu
2O
3, and 10,350 cm
−1 (966 nm) in Sc
2O
3. As usual for Nd-doped compounds, the strongest emission band is the one located at around 1 micron with maxima at 9265 cm
−1 (1079 nm) for Y
2O
3, 9253 cm
−1 (1081 nm) for Lu
2O
3, and 9237 cm
−1 (1083 nm) for Sc
2O
3. The maxima of the 1.3 μm band are located at 7363 cm
−1 (1358 nm) for Y
2O
3, 7352 cm
−1 (1360 nm) for Lu
2O
3, and 7311 cm
−1 (1368 nm) for Sc
2O
3. Moreover, in all cases, we were able to observe a fourth emission band in the 2 μm region that extends from about 4500 cm
−1 to about 6000 cm
−1. This band is usually considered very weak, and the emission has rarely been reported in the literature, even in bulk crystals. As for the other bands, also in this region, the shapes of the spectra look very similar for the three compounds with a tendency to red-shifting when passing from Y
2O
3 to Lu
2O
3 and to Sc
2O
3. The highest peaks are located at 4800 cm
−1 (2083 nm) for Y
2O
3, 4760 cm
−1 (2101 nm) for Lu
2O
3, and 4632 cm
−1 (2159 nm) for Sc
2O
3.
From the emission spectra, we calculated the emission cross-section of the
4F
3/2 →
4I
i (i = 9/2, 11/2, 13/2, 15/2) emission bands with the following equation [
28]:
where
c is the speed of light in vacuum,
is Planck’s constant,
is the fluorescence signal, and
and
are the crystal refractive indexes at 1 μm wavelength and the radiative lifetime, respectively, both taken from the literature as reported in
Table 1 for the various compounds. For LuF
3, we could not find proper references to published values; therefore, we used the values of the isomorph compound YF
3. In Equation (1), the integral is over the whole emission region of the
4F
3/2 decay channels, including the 2 μm emission band. It is worth mentioning that we performed all the calculations in the frequency domain using Equation (1), because the experimental data were acquired with an FTIR that works at fixed wavenumber intervals, instead of using the equivalent expression in wavelength, as reported in Equation (14) of ref [
28] that must be used when working with grating spectrometers.
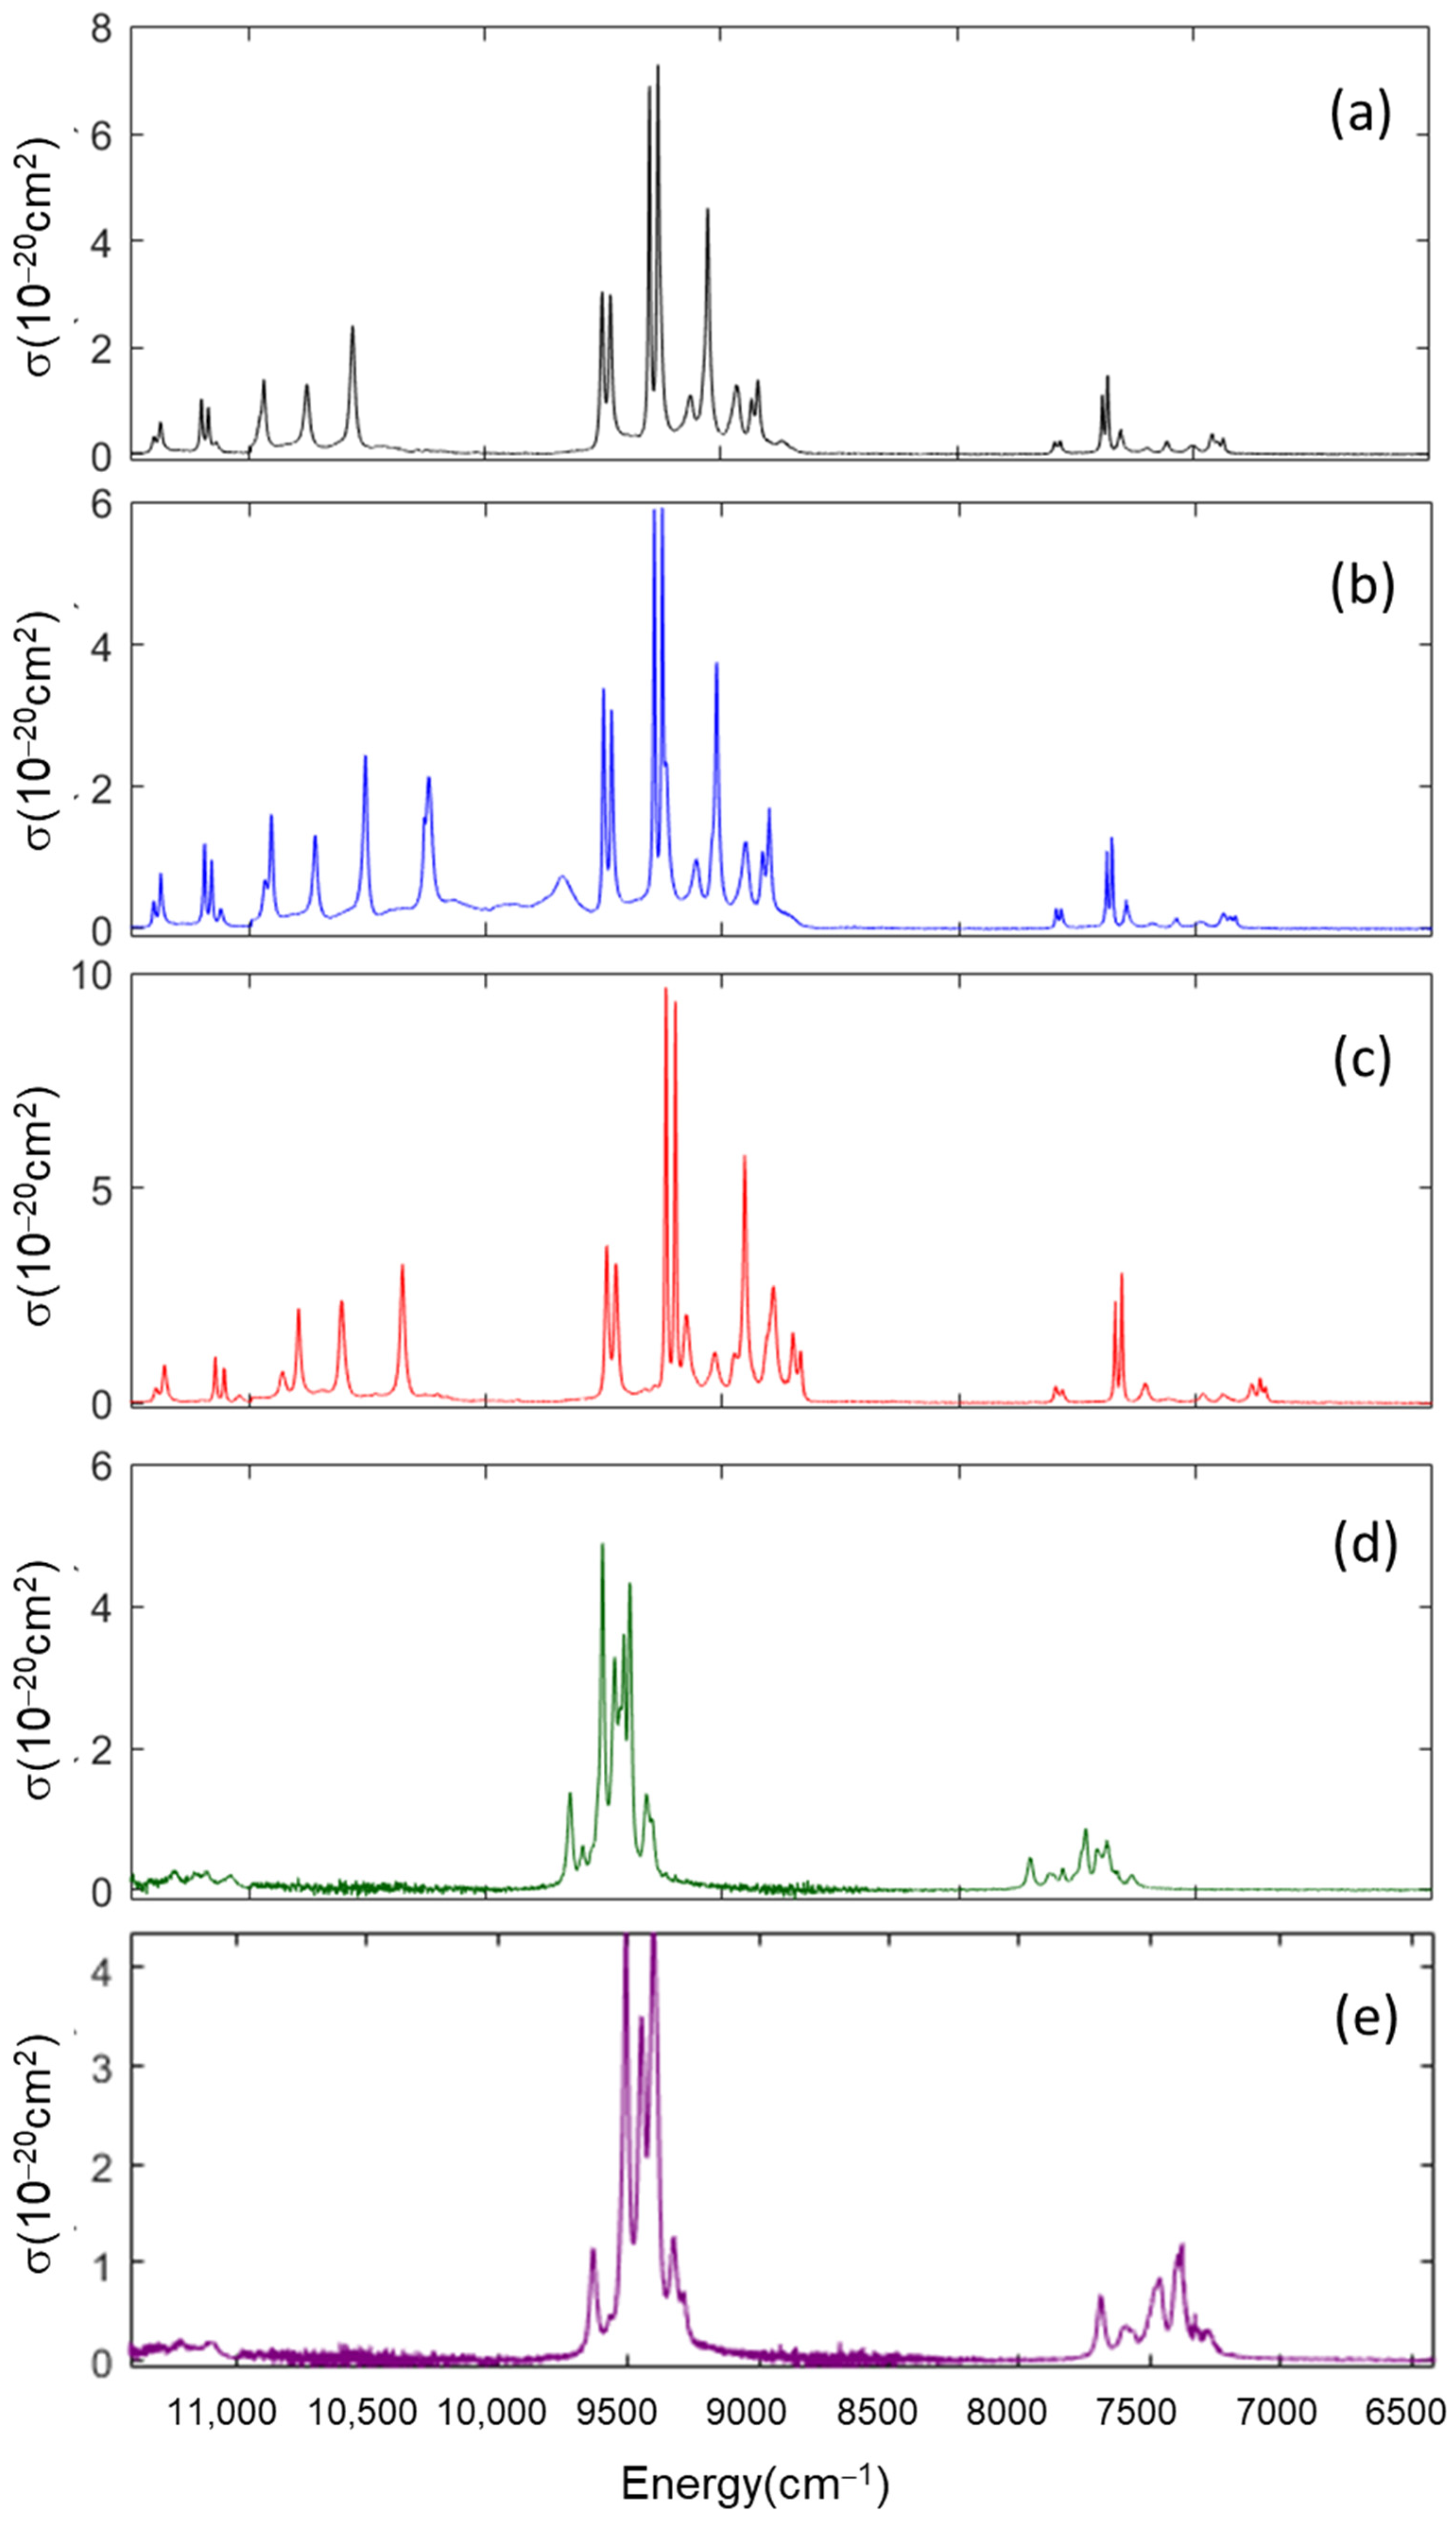
Figure 3a–c show the emission cross-sections of all the Nd-doped sesquioxides in the 11,500 cm
−1–6500 cm
−1 region measured at 1%Nd doping level for oxides and 5%Nd doping level for fluorides because these were the samples with the highest emission intensities. In this region, we can distinguish the three main emission bands. The shape and peak position of the various bands qualitatively agree with published results, when available, and the cross-section peak intensities we obtained are compared with the literature results in
Table 2,
Table 3,
Table 4,
Table 5 and
Table 6. It is evident that large discrepancies are present among the literature results, especially for the most studied of these compounds, such as Nd:Y
2O
3, where many different estimates are present. Our results compare well with the variation interval of published values. In all cases, the highest emission cross-section is that of the
4F
3/2 →
4I
11/2 transition, and our calculations for this band are in good agreement with published results. The emission cross-section of the other decay channels is not always known in the literature, and when present, our results compare well with published values.
It may be worth noting that these results are similar or slightly lower than the emission cross-section of well-known laser crystals. For example, the maximum emission cross-section of YLF is about 2 × 10
−20, 18 × 10
−20, and 3 × 10
−20 cm
2 for the
4F
3/2 →
4I
9/2,
4F
3/2 →
4I
11/2, and
4F
3/2 →
4I
13/2 transitions, respectively [
36].
Table 2.
Emission cross-sections of Nd:Y2O3.
Table 2.
Emission cross-sections of Nd:Y2O3.
| | Decay Channel | σem (10−20 cm2) |
|---|
| | 4F3/2 → | This work | [14] | [18] | [16] | [15] | [17] | [13] |
| Nd:Y2O3 | 4I9/2 | 2.4 | - | - | - | - | 4.89 | 1.8 |
| 4I11/2 | 7.3 | 6.9 | 1.73 | 7.24 | 5.13 | 6.35 | 6.8 |
| 4I13/2 | 1.5 | 5.5 | - | - | - | 0.92 | - |
| 4I15/2 | 0.07 | - | - | - | - | - | - |
Table 3.
Emission cross-sections of Nd:Lu2O3.
Table 3.
Emission cross-sections of Nd:Lu2O3.
| | Decay Channel | σem (10−20 cm2) |
|---|
| | 4F3/2 → | This work | [20] | [21] | [27] | [37] |
| Nd:Lu2O3 | 4I9/2 | 2.4 | - | - | 1.9 | - |
| 4I11/2 | 5.9 | 8.49 | 6.5 | 5.0 | 6.5 |
| 4I13/2 | 1.3 | - | - | 3.1 | - |
| 4I15/2 | 0.04 | - | - | - | - |
Table 4.
Emission cross-sections of Nd:Sc2O3.
Table 4.
Emission cross-sections of Nd:Sc2O3.
| | Decay Channel | σem (10−20 cm2) |
|---|
| | 4F3/2 → | This work | [33] |
| Nd:Sc2O3 | 4I9/2 | 3.2 | - |
| 4I11/2 | 9.7 | 9.5 |
| 4I13/2 | 3 | - |
| 4I15/2 | 0.09 | - |
Table 5.
Emission cross-sections of Nd:YF3.
Table 5.
Emission cross-sections of Nd:YF3.
| | Decay Channel | σem (10−20 cm2) |
|---|
| | 4F3/2 → | This work | [35] * |
| Nd:YF3 | 4I9/2 | 0.3 | 0.51 |
| 4I11/2 | 4.9 | 0.74 |
| 4I13/2 | 0.9 | 0.4 |
| 4I15/2 | 0.06 | 0.032 |
Table 6.
Emission cross-sections of Nd:LuF3.
Table 6.
Emission cross-sections of Nd:LuF3.
| | Decay Channel | σem (10−20 cm2) |
|---|
| | 4F3/2 → | This work |
| Nd:LuF3 | 4I9/2 | 0.2 |
| 4I11/2 | 4.7 |
| 4I13/2 | 1.1 |
| 4I15/2 | 0.1 |
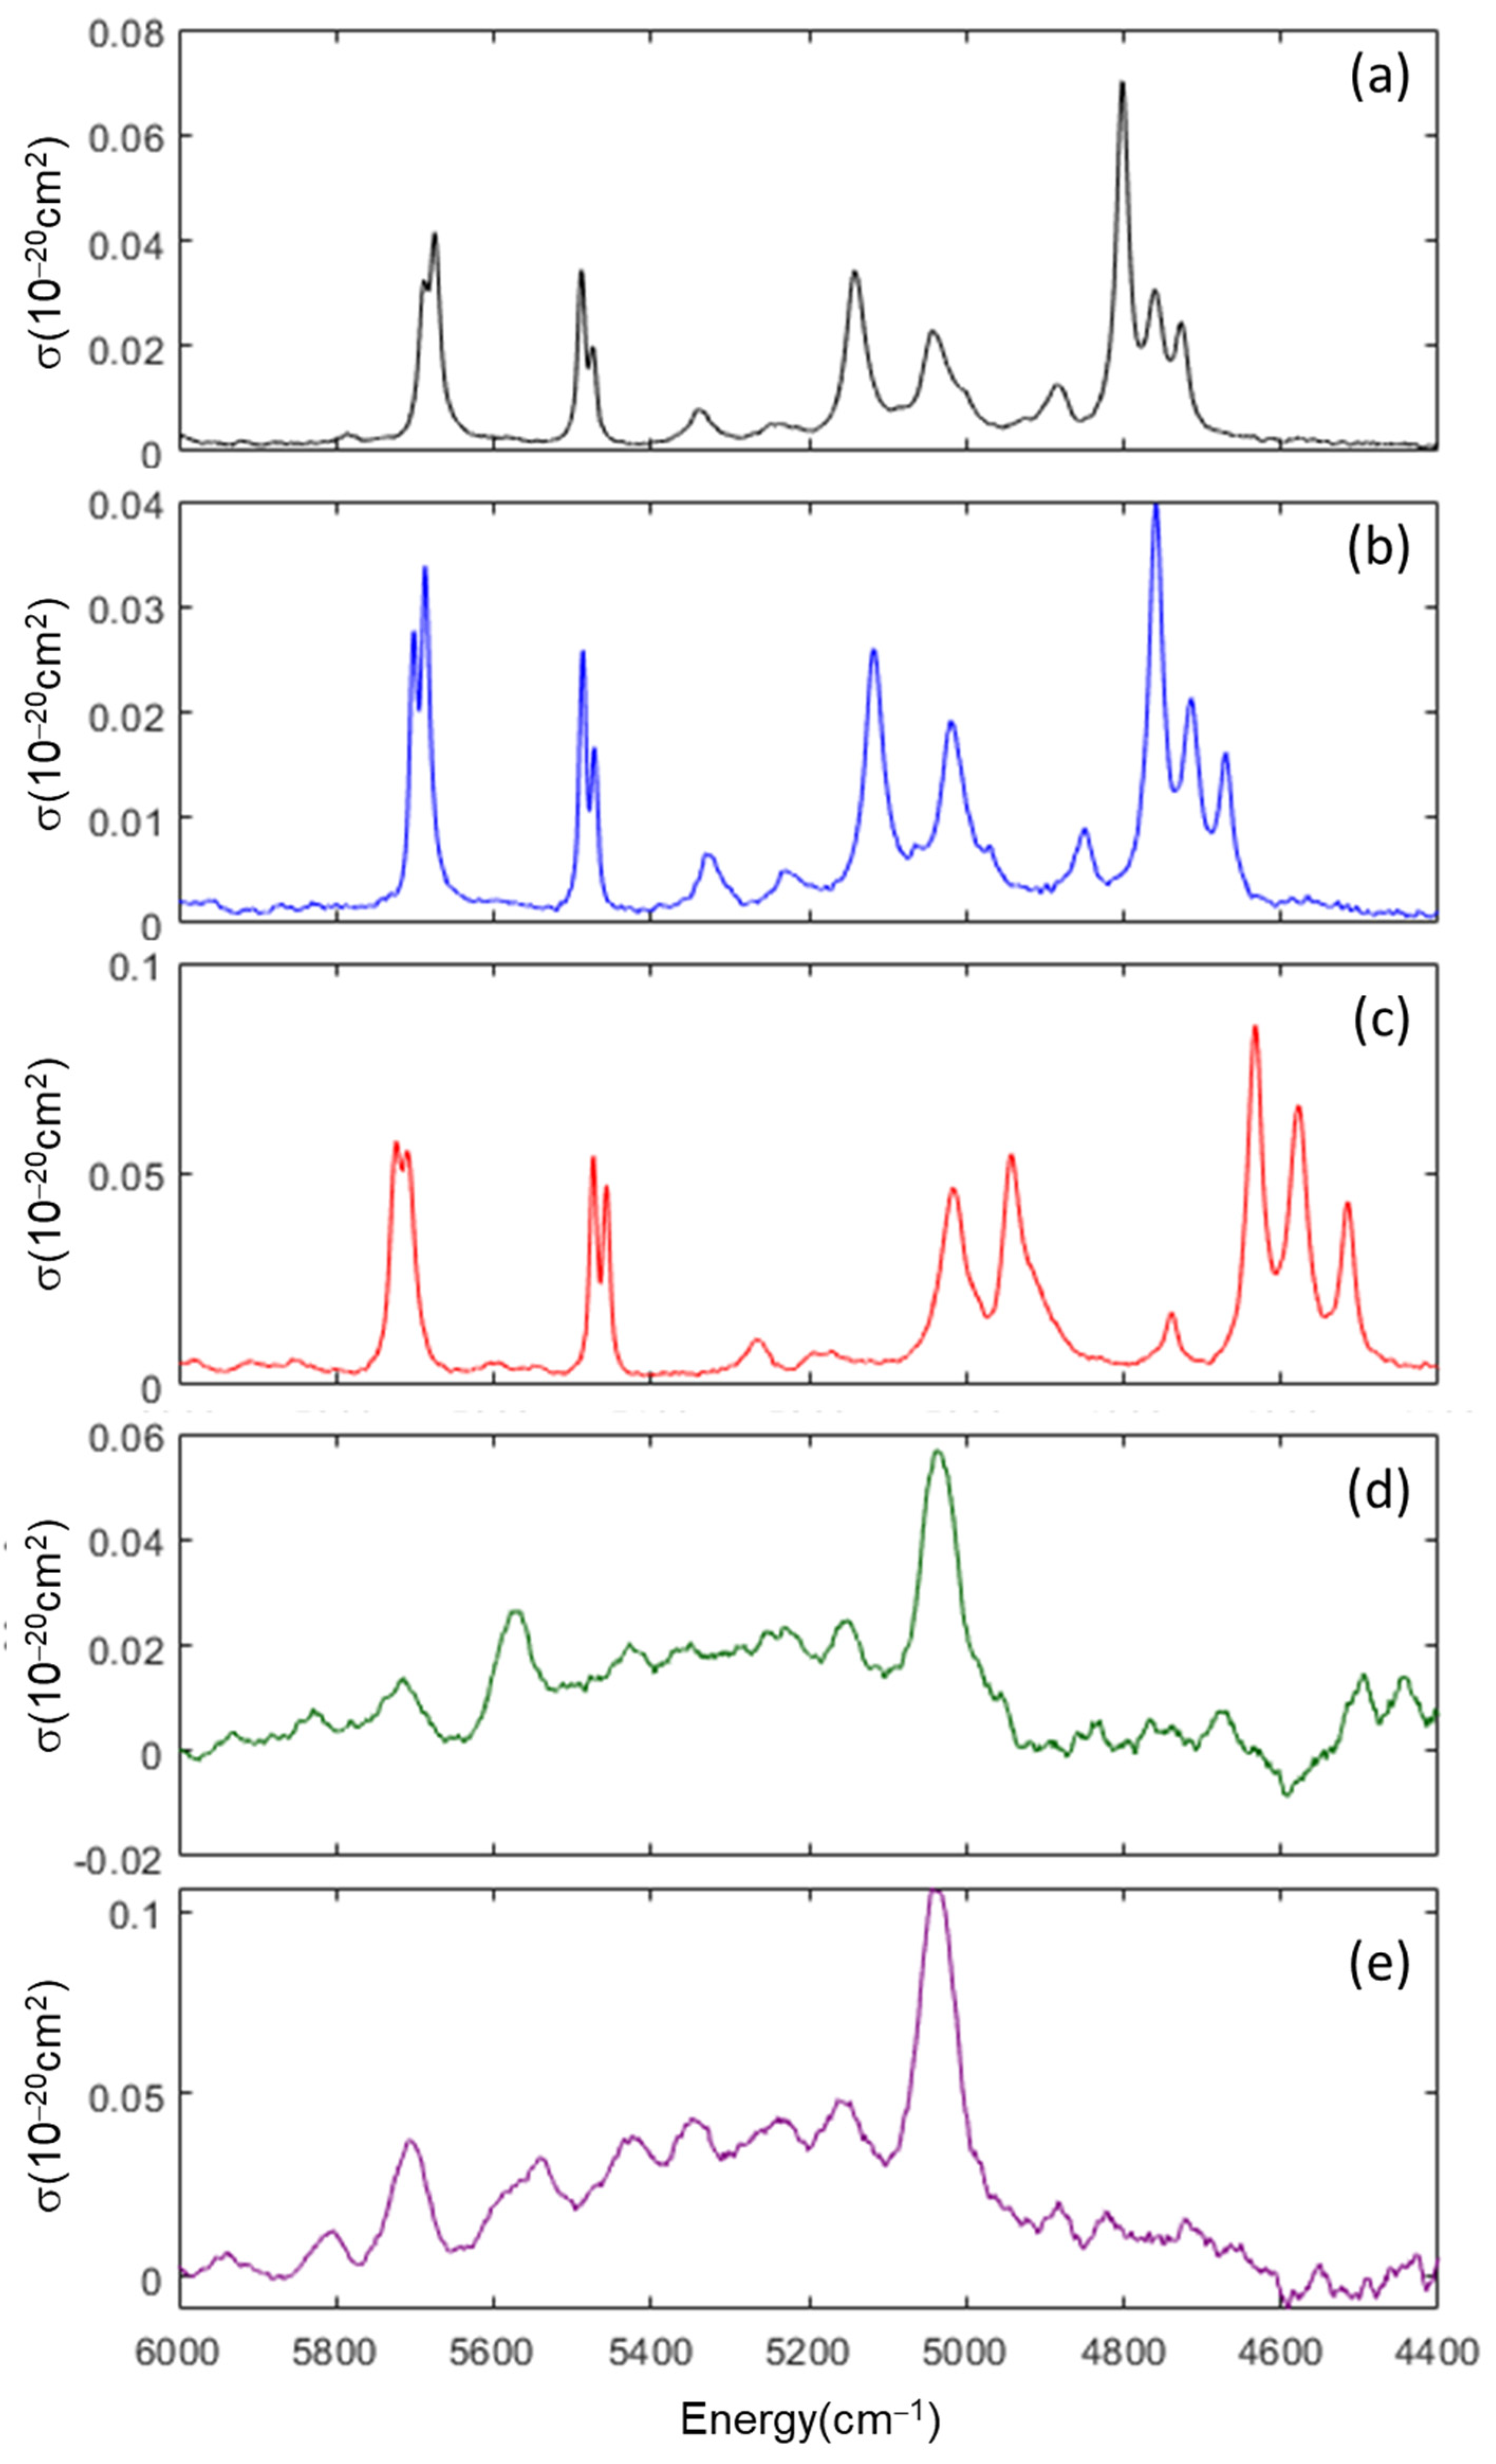
The stimulated emission cross-section for the
4F
3/2→
4I
15/2 decay is depicted in
Figure 4a–c for all investigated compounds. This transition appears as a series of separated groups of peaks of increasing intensity. The highest emission cross-section is observed at around 2.1 μm in all compounds.
We also measured the
4F
3/2 decay time under LED pumping on 3% and 1% doped samples. The decay profile is always exponential and lifetime values measured on 1% doped samples are reported in
Table 7,
Table 8 and
Table 9 and compared with the literature values on low concentration samples, whenever available. On higher doped samples, concentration quenching effects make the lifetime shorter than the radiative value; we measured 217 μs, 211 μs, and 324 μs in 3%Nd-doped Y
2O
3, Lu
2O
3, and Sc
2O
3, respectively. The product of quantum efficiency and the dopant concentration can be considered as a figure of merit of the material [
17]. In the case of 3%Nd:Y
2O
3, for example, considering a radiative lifetime of 354 μs, this value is 1.8, about 2.7 times higher than that obtained by Kumar and co-workers for the same doping level [
17] from which laser emission has been obtained. The values obtained for the other compounds at 3% doping level are 1.8 for Lu
2O
3 and 2.8 for Sc
2O
3.
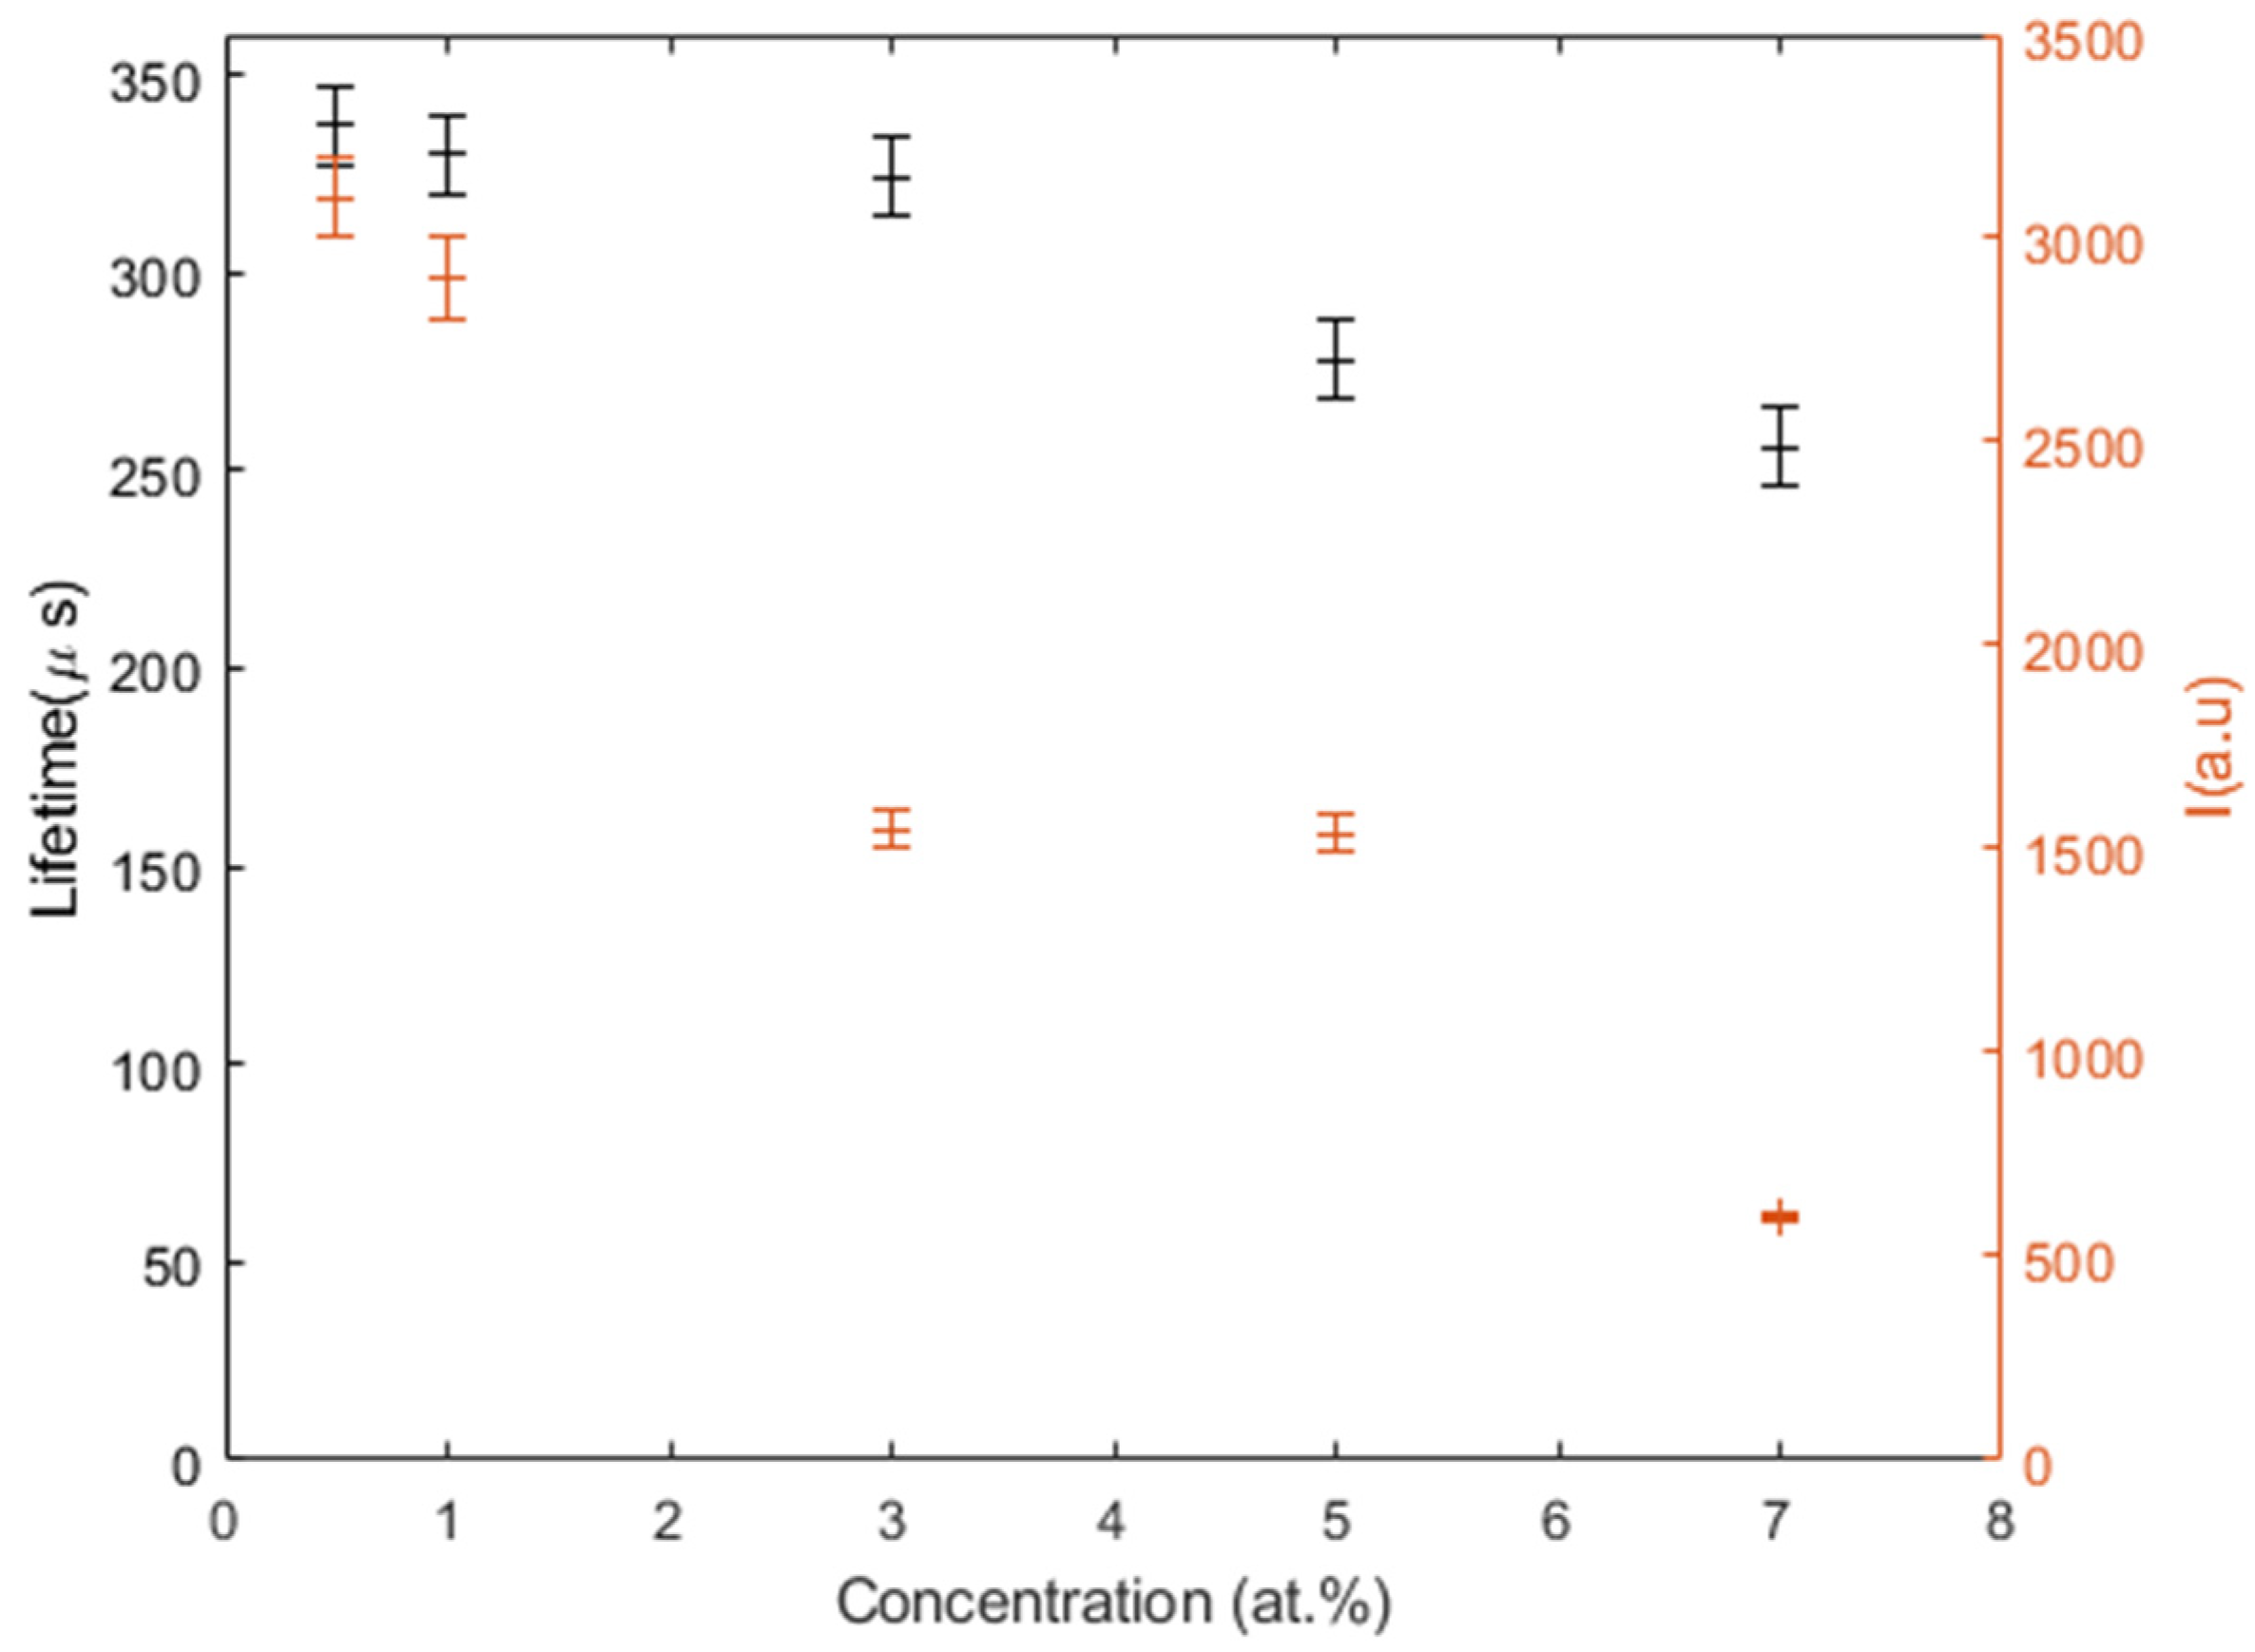
For Sc
2O
3, we investigated the dependence of the emission intensity and of the lifetime as a function of the doping level from 0.5% to 7%. The results are shown in
Figure 5. As expected, both the emission intensity and the lifetime decrease with the concentration. The low-doping level value of the lifetime is slightly lower, but consistent with the theoretical radiative lifetime reported in
Table 1, but the high concentration values are typically much longer than those measured in Y
2O
3 with similar doping levels. These results indicate that concentration quenching in Sc
2O
3 is not very strong and confirm the high quality of our samples.
3.3. Fluorides
We also acquired the emission spectra from 5%Nd:YF
3 and 5%Nd:LuF
3 samples and calculated the emission cross-section with Equation (1), as for sesquioxides. Results are shown in
Figure 3d,e for the 11,500 cm
−1–6500 cm
−1 region and in
Figure 4d,e for the 6000 cm
−1–4000 cm
−1 region. Since the decay time of LuF
3 is not known in the literature, the value for YF
3 has been used, instead. The emission intensity of fluoride samples is, in general, much weaker than that of sesquioxide samples. This can be ascribed either to the higher Nd doping level of our fluoride samples that can cause concentration quenching effects, or to a worse matching of the emission wavelength of our pump diode that causes lower absorption. In all cases, the emission is dominated by the 1-micron band. The emission cross-sections of the two compounds have similar shapes and intensity, as expected from the fact that the two compounds are isomorphs, and are much different from that of sesquioxides. The Stark splitting of the energy levels is in general smaller, and single peaks usually merge into continuous bands. The maximum emission cross-section recorded in the 1 μm region is 5 × 10
−20 cm
2 and 4.7 × 10
−20 cm
2 for YF
3 and LuF
3, respectively. The emission cross-section in the 2-micron region follows the same features already described: the shape is very similar between FY
3 and LuF
3 and is composed of an almost featureless band with a few peaks with maximum intensity of about 1 × 10
−21 cm
2.
Emission lifetimes of the
4F
3/2 level have been recorded under LED pumping, and results are reported in
Table 10 and
Table 11 and compared with the literature for YF
3. Measured decay times are 170 μs and 120 μs for YF
3 and LuF
3, respectively. If compared to the radiative lifetime of YF
3 of 783 μs determined in [
35], we can observe that concentration quenching at this high doping level is strong.
These results show that fluoride materials generally show broader and weaker emission features in all wavelength regions, although fluoride crystals have lower phonon energy. This is probably due to the longer radiative lifetime of fluoride materials, but we cannot rule out interaction with possible quenching centers that are known to severely affect the emission efficiency of lanthanide-doped fluoride materials. The highest emission cross-sections are obtained from Nd:Sc2O3 in all regions.


 ,
, 

