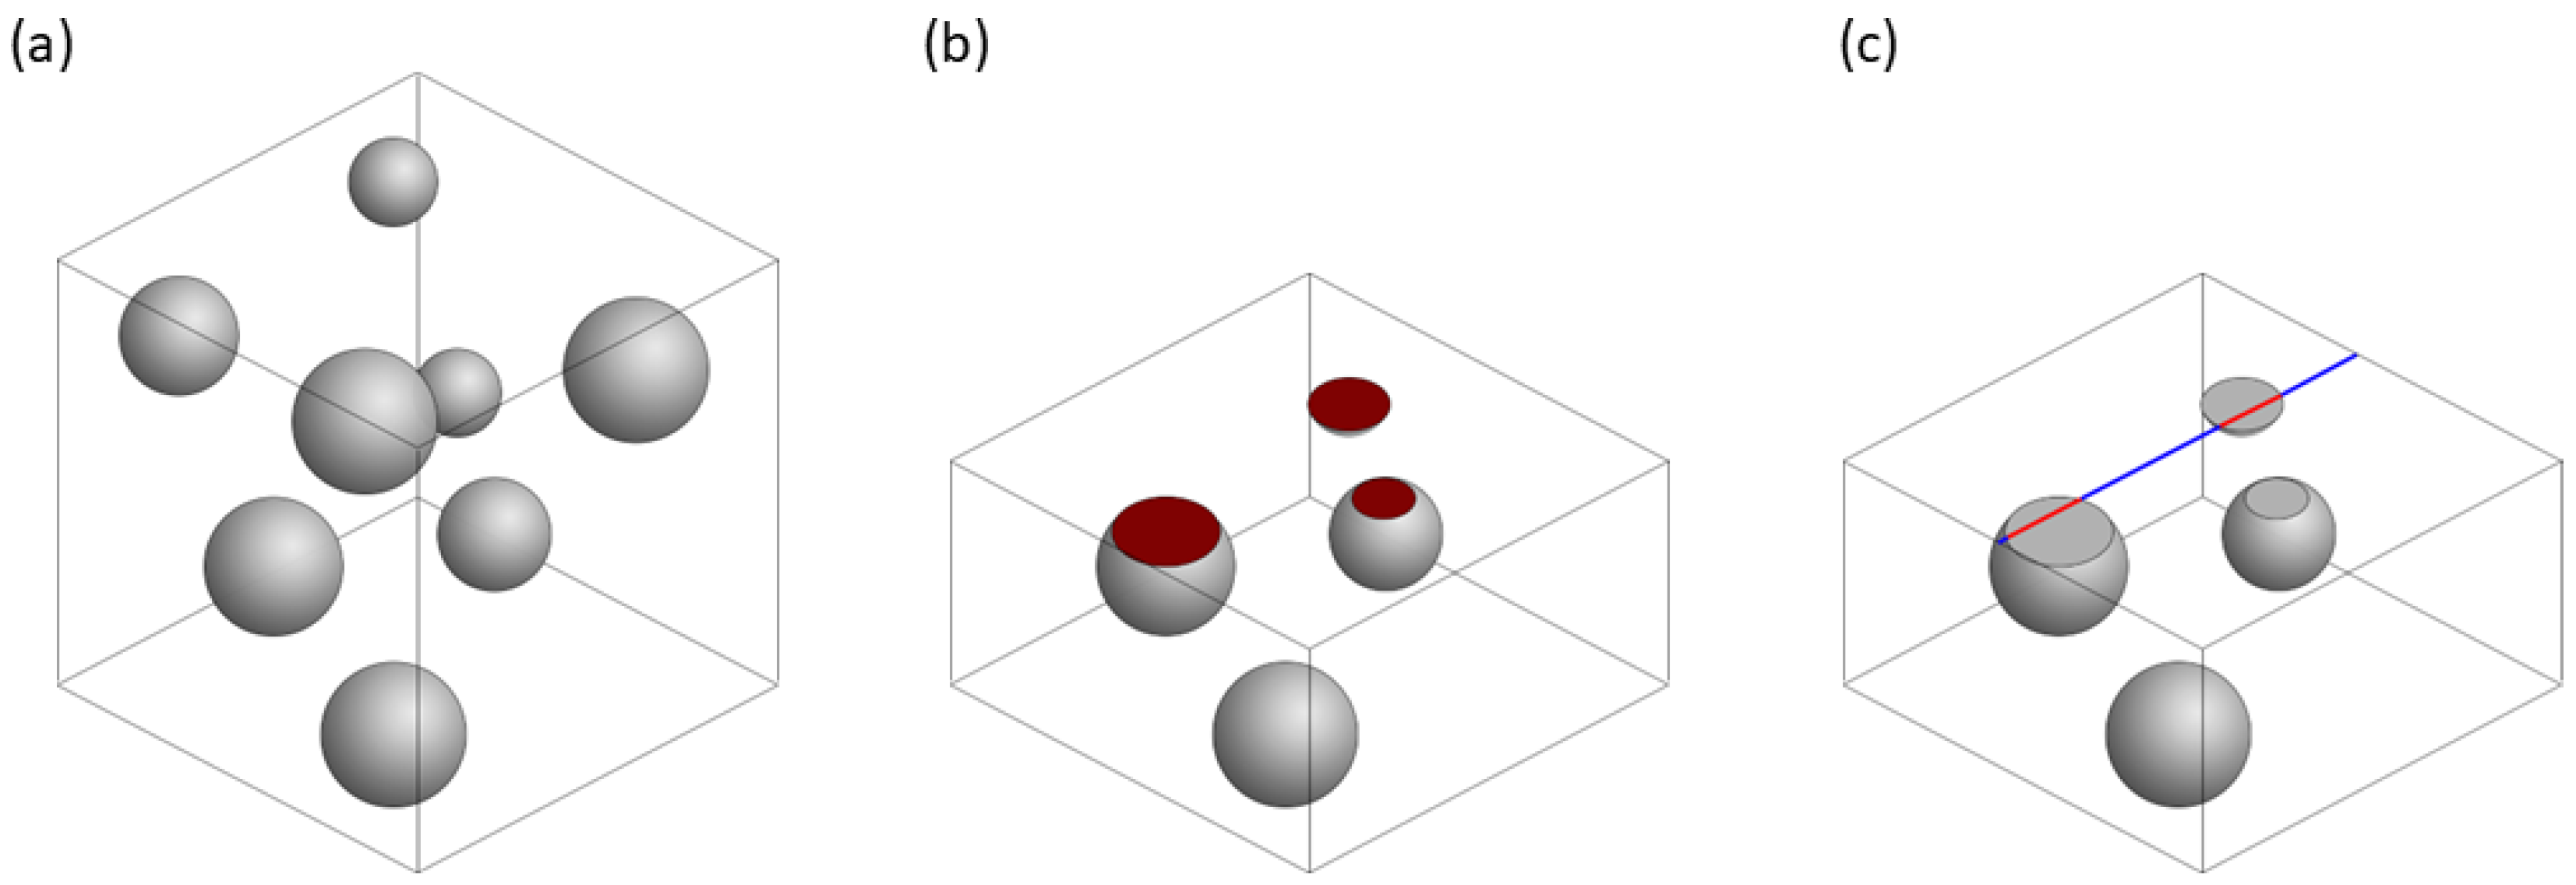
Figure 1.
(a) A 3D particle dispersion. (b) A cross-section through the dispersion, cutting through particles. (c) A line intercept passing through particles.
Figure 1.
(a) A 3D particle dispersion. (b) A cross-section through the dispersion, cutting through particles. (c) A line intercept passing through particles.
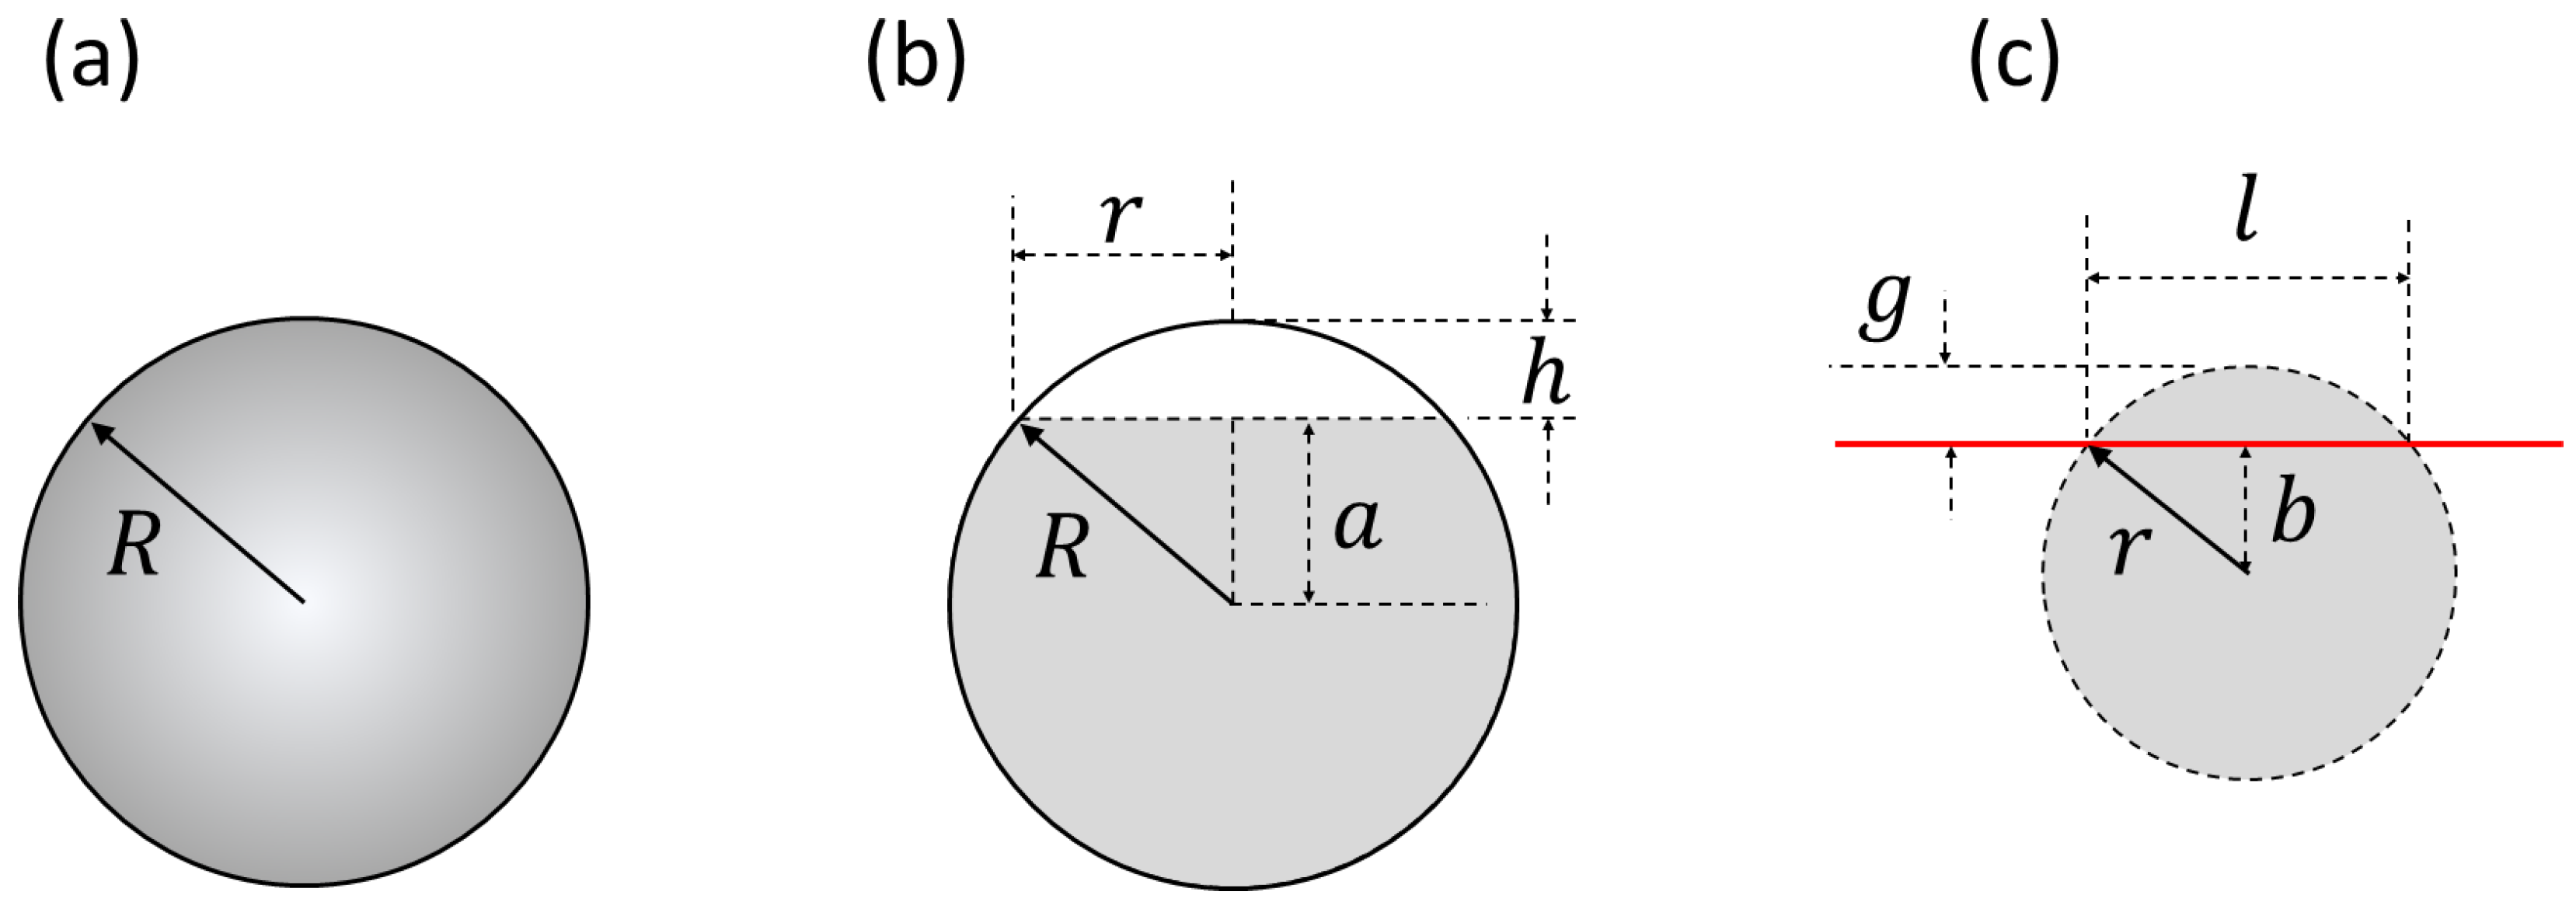
Figure 2.
The key geometry defining (a) the sphere, (b) the cross-section of a spherical particle, (c) the line intercept taken through a circle cross-section of a particle.
Figure 2.
The key geometry defining (a) the sphere, (b) the cross-section of a spherical particle, (c) the line intercept taken through a circle cross-section of a particle.
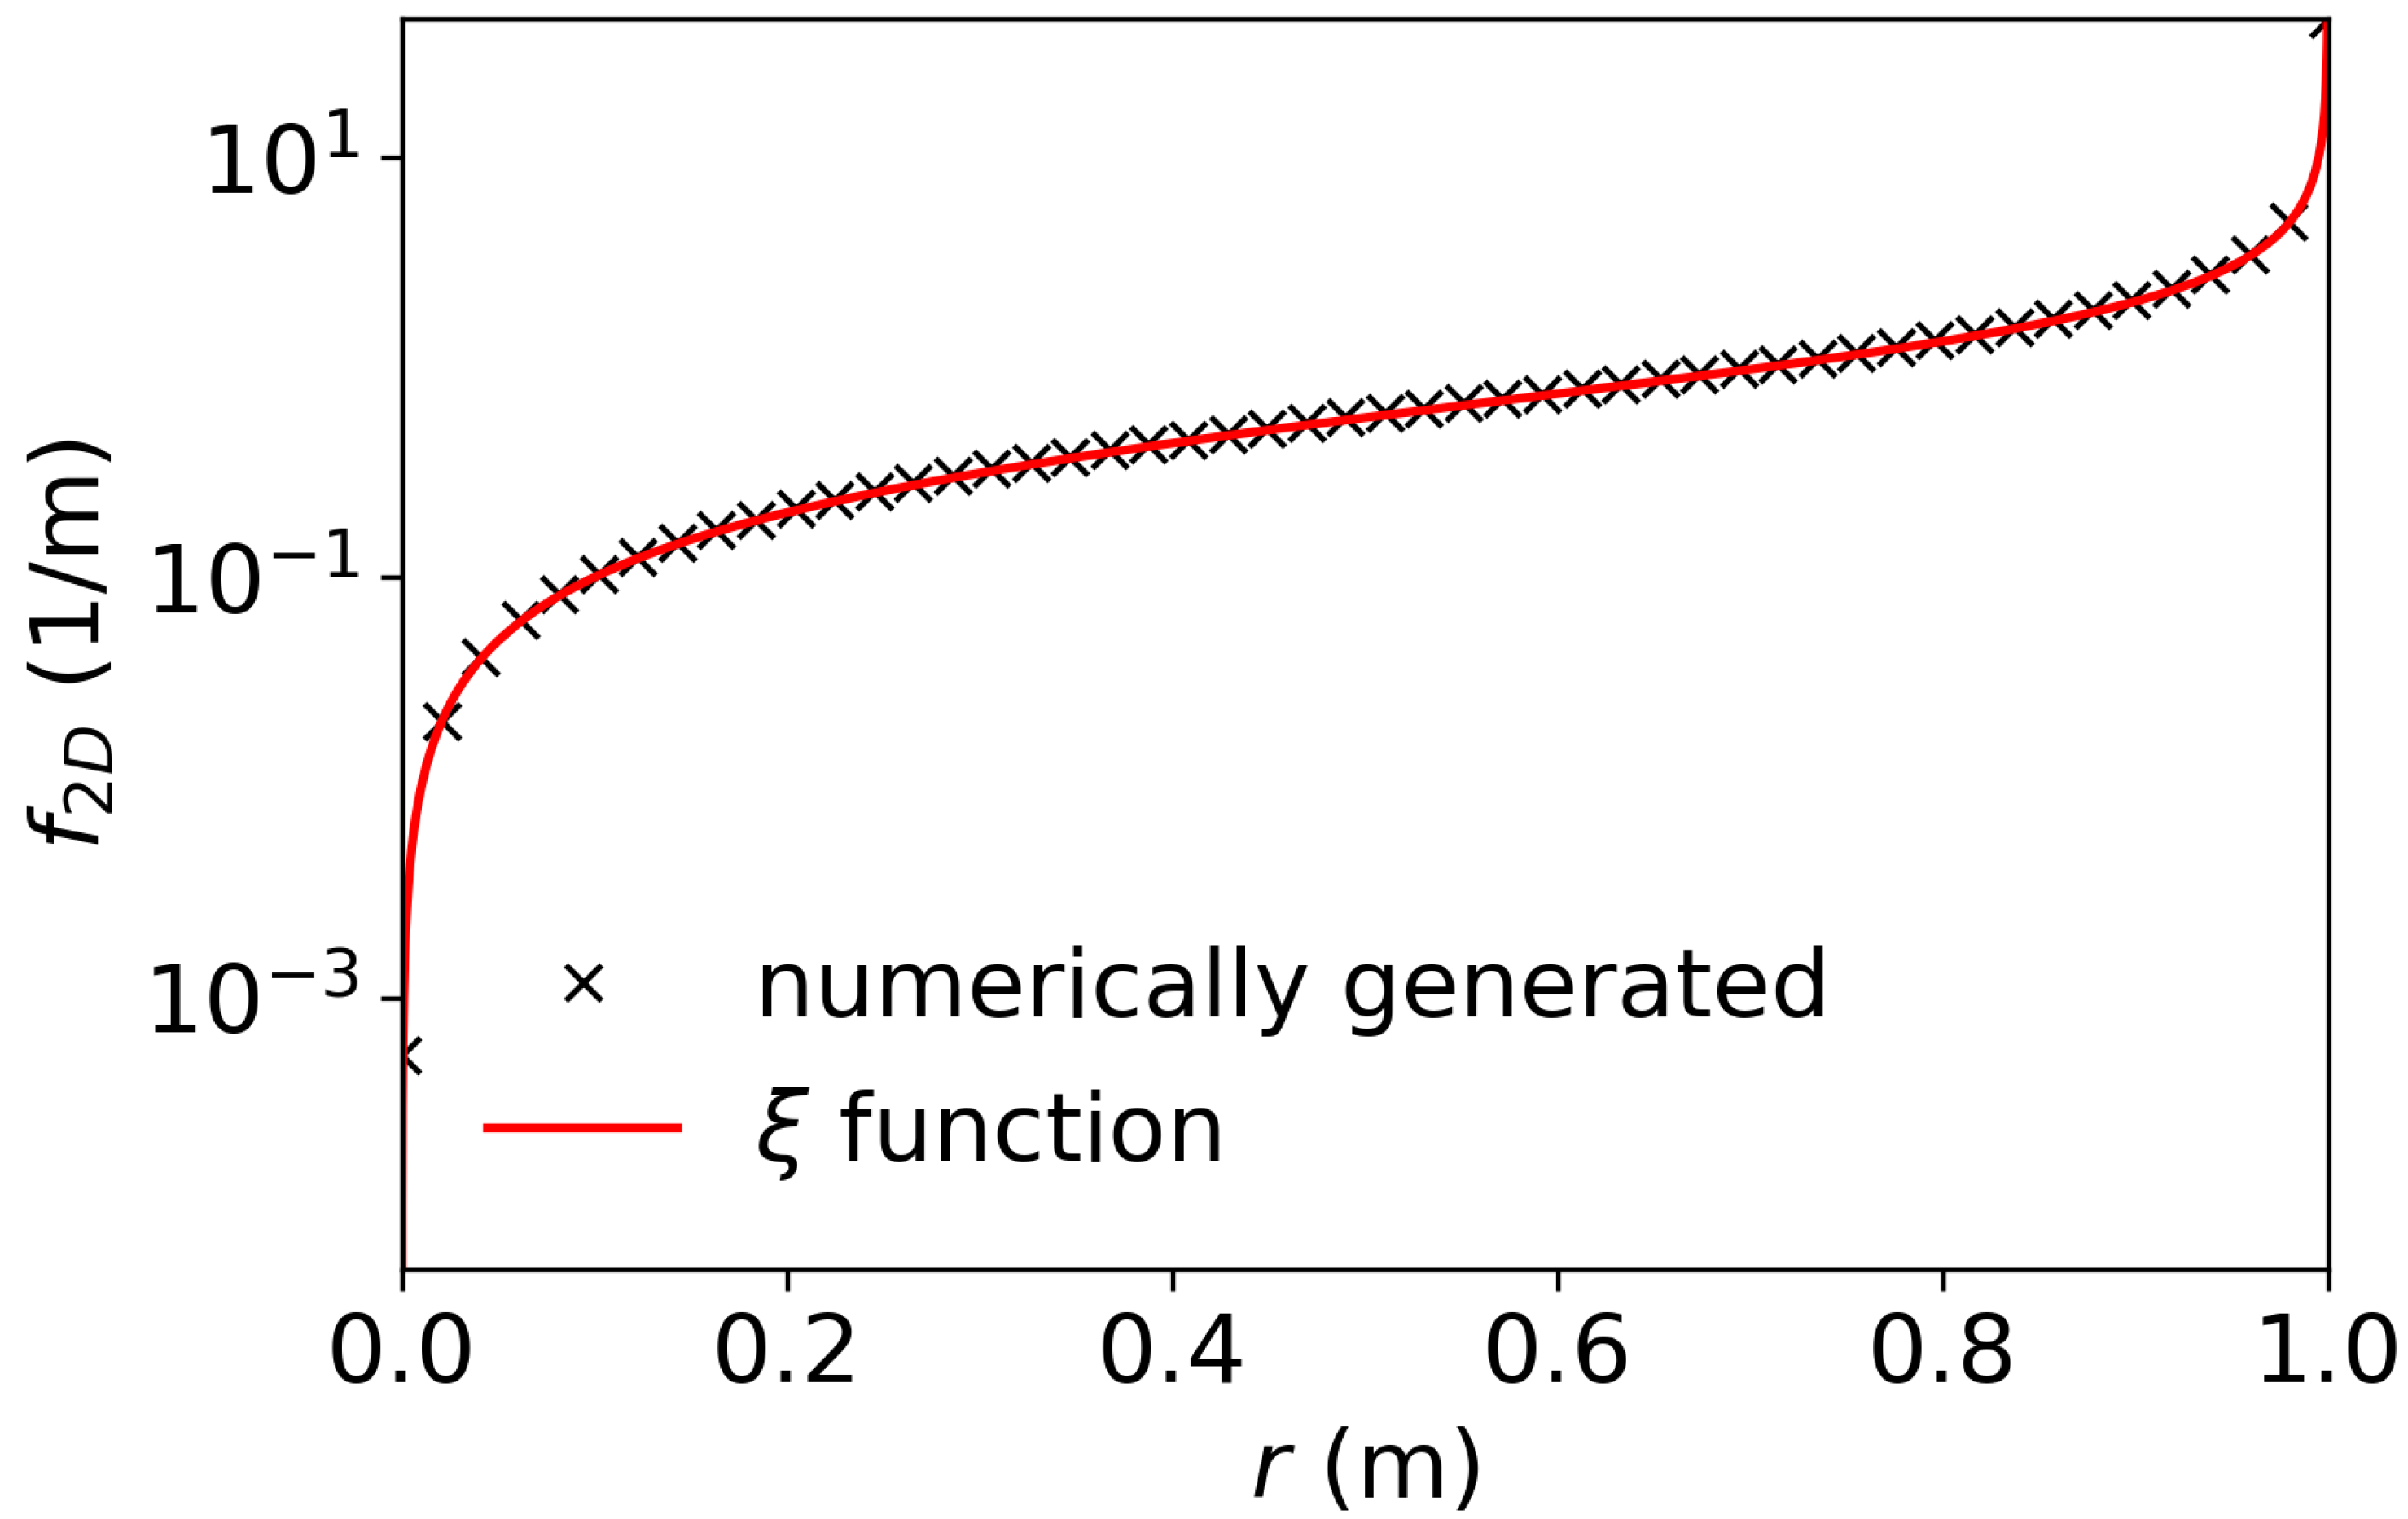
Figure 3.
Comparison of the numerically and analytically generated distribution functions Equation (15) for a monodisperse particle ensemble.
Figure 3.
Comparison of the numerically and analytically generated distribution functions Equation (15) for a monodisperse particle ensemble.
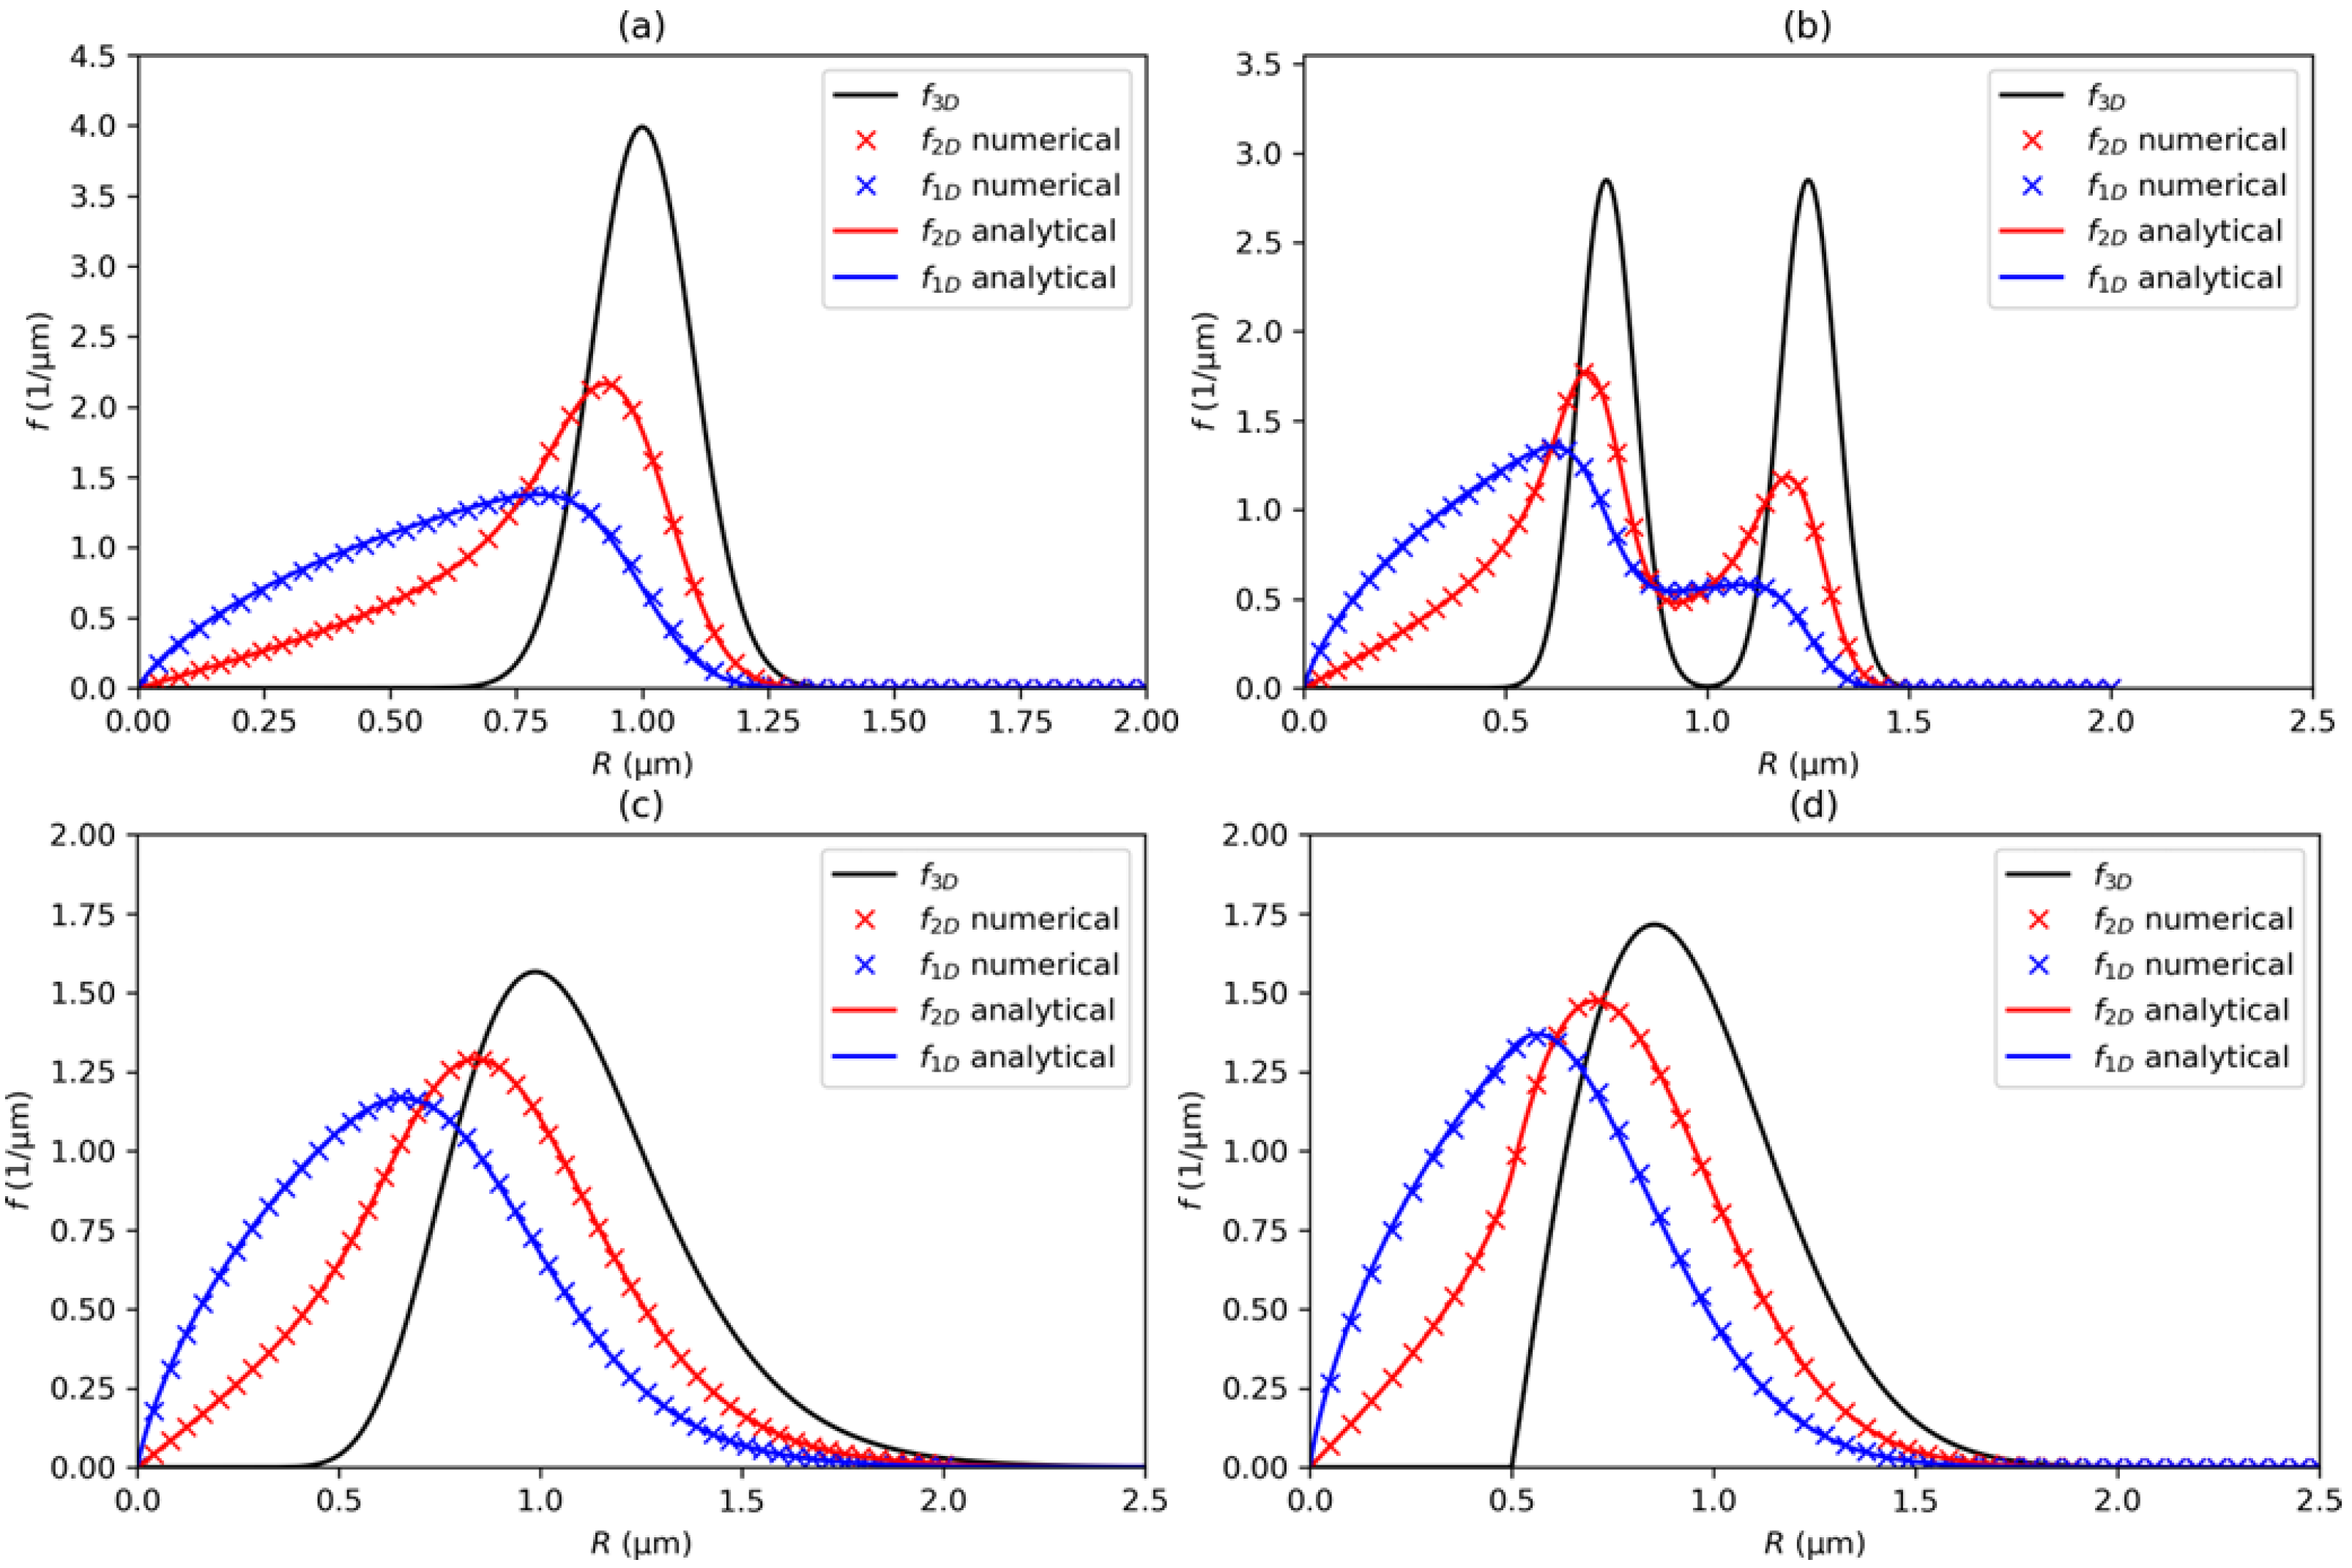
Figure 4.
Comparison of the numerical and analytical 2D and 1D distributions of the radii of cross-sections and linear intercepts considering (a) a normal distribution, (b) a bimodal distribution, (c) a log-normal distribution, and (d) a Weibull distribution. The 3D distribution is shown in the solid black line. The numerically generated 2D and 1D distribution functions are shown in the red and blue crosses, respectively.
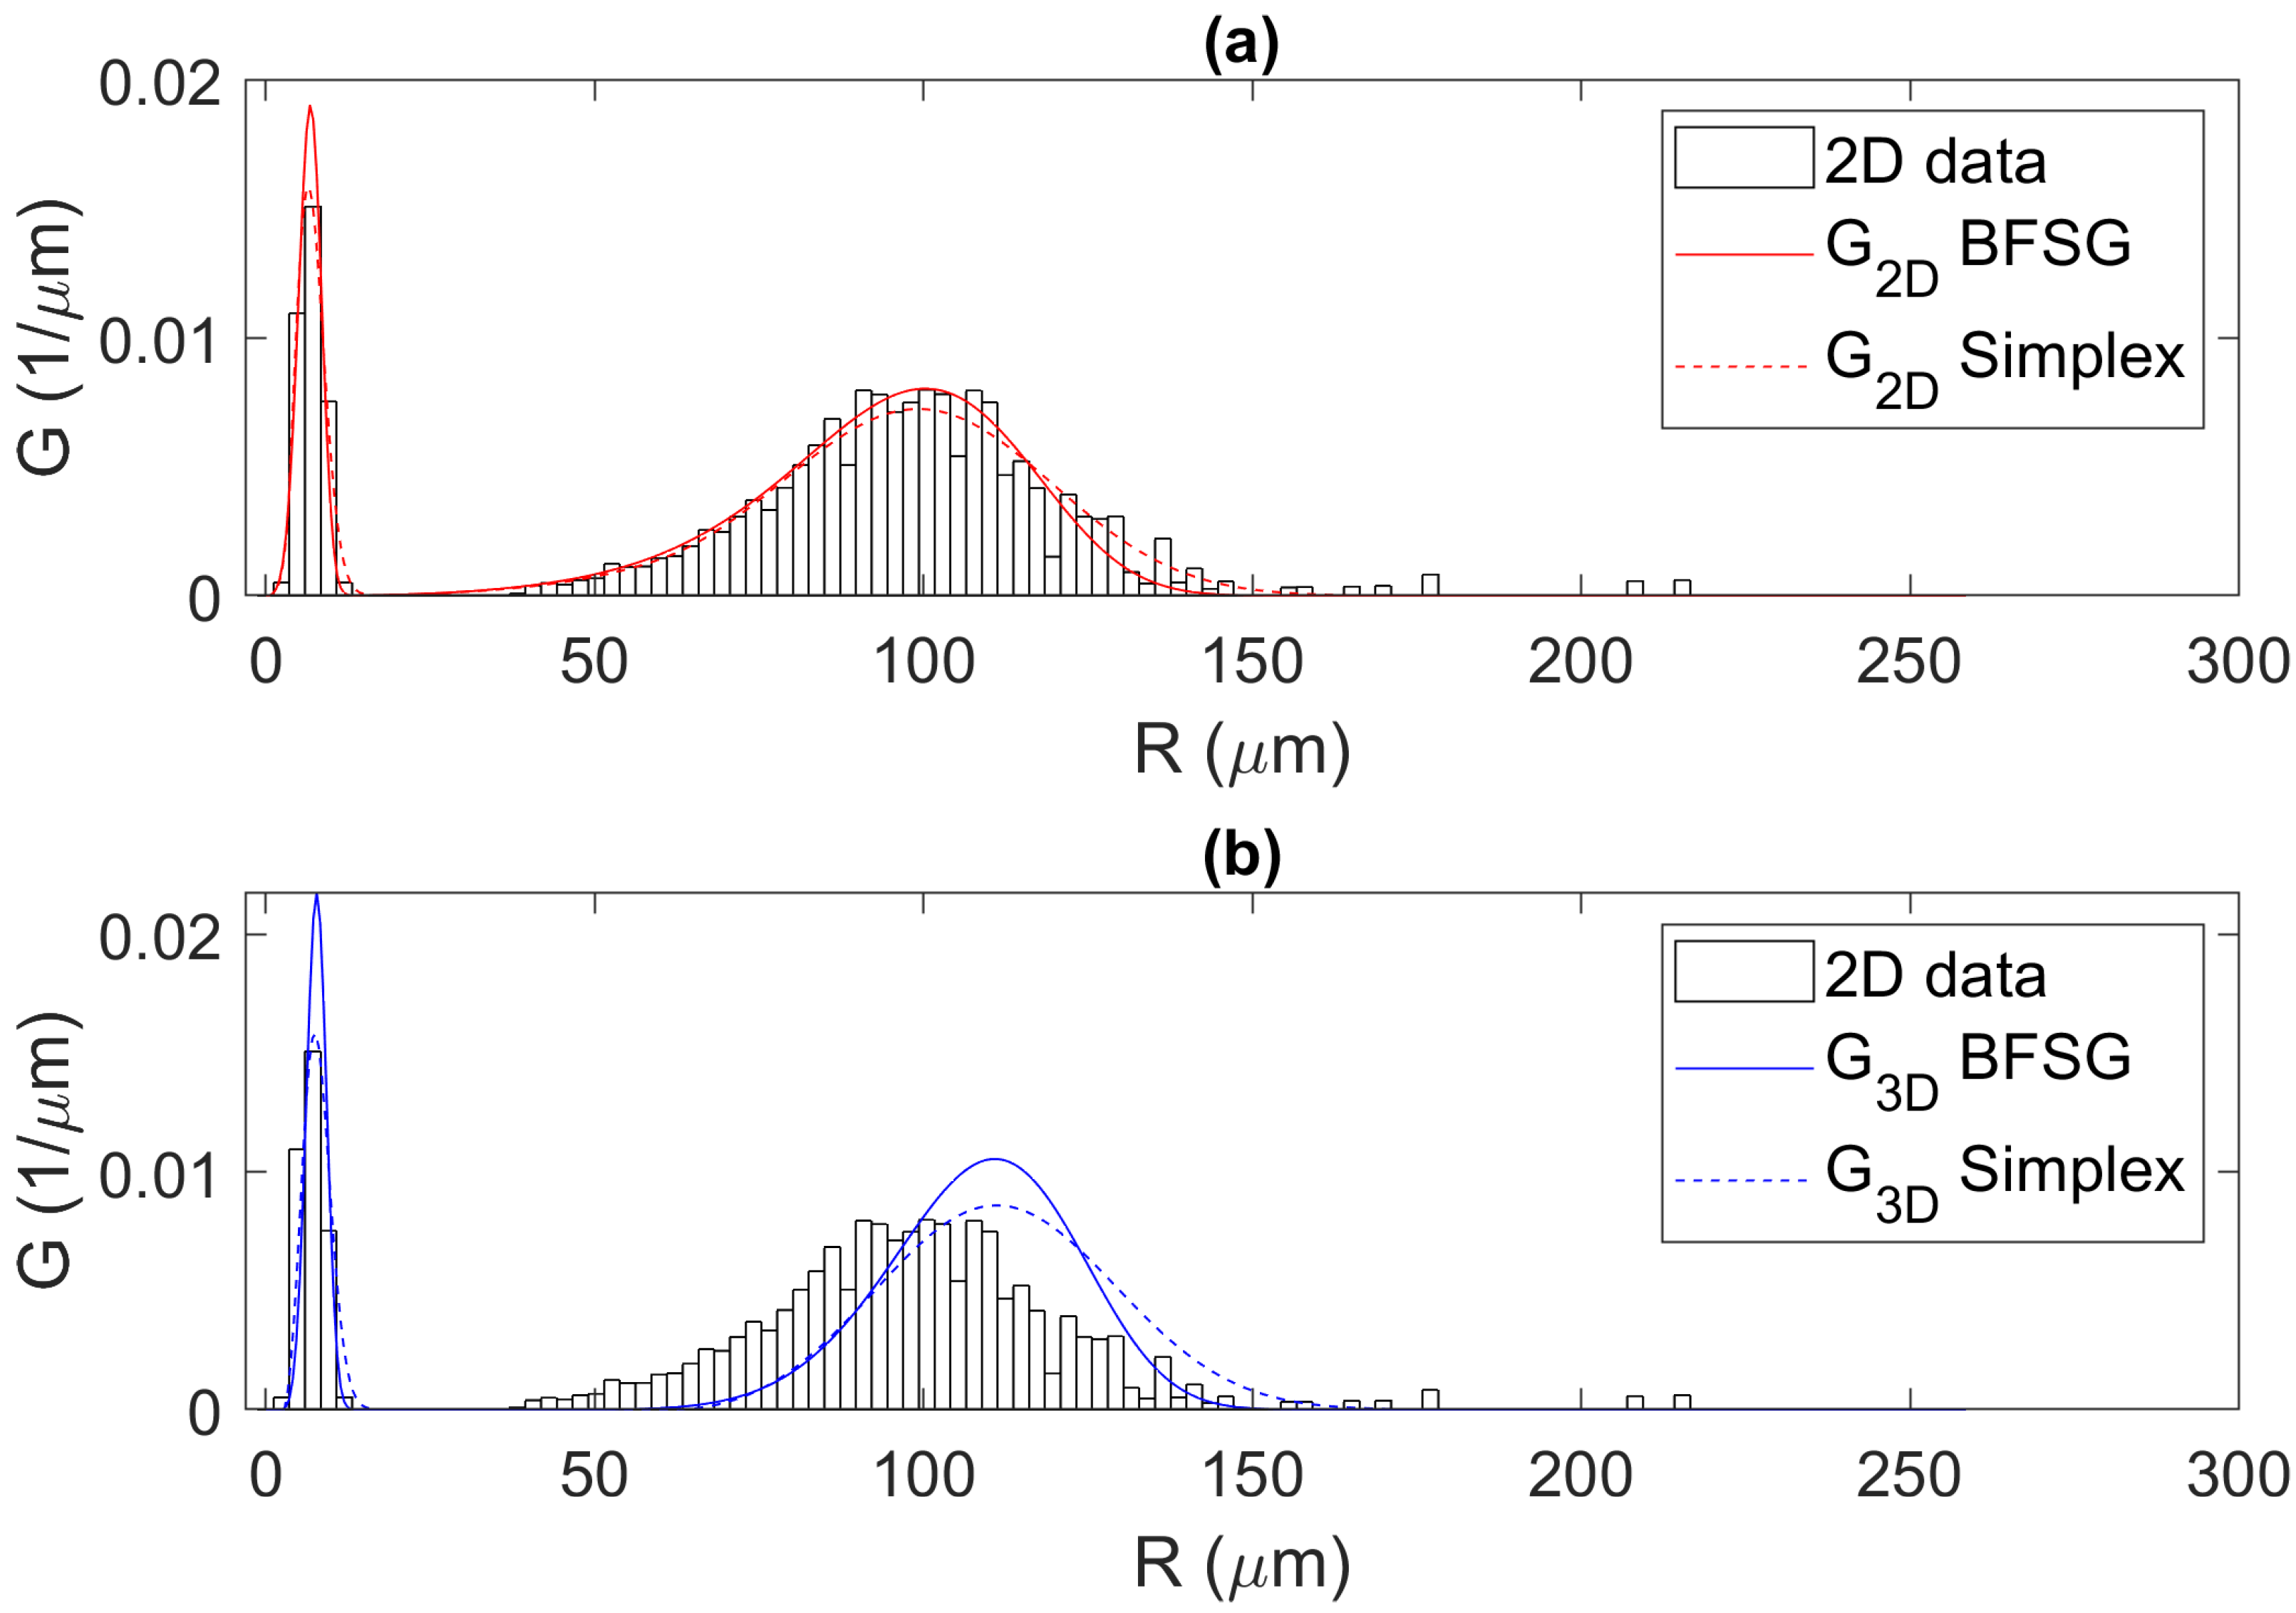
Figure 5.
Example applications of the inverse analysis of the 3D size of the particle distribution, considering (a) the distribution in CC IN738LC aged at 900 C for 10,000 h. (b) The primary in air quenched fine grain RR1000. (c,d) present the measured distribution of particle cross-sections compared with the approximated 3D and 2D distributions obtained using the BFSG algorithm and simplex method.
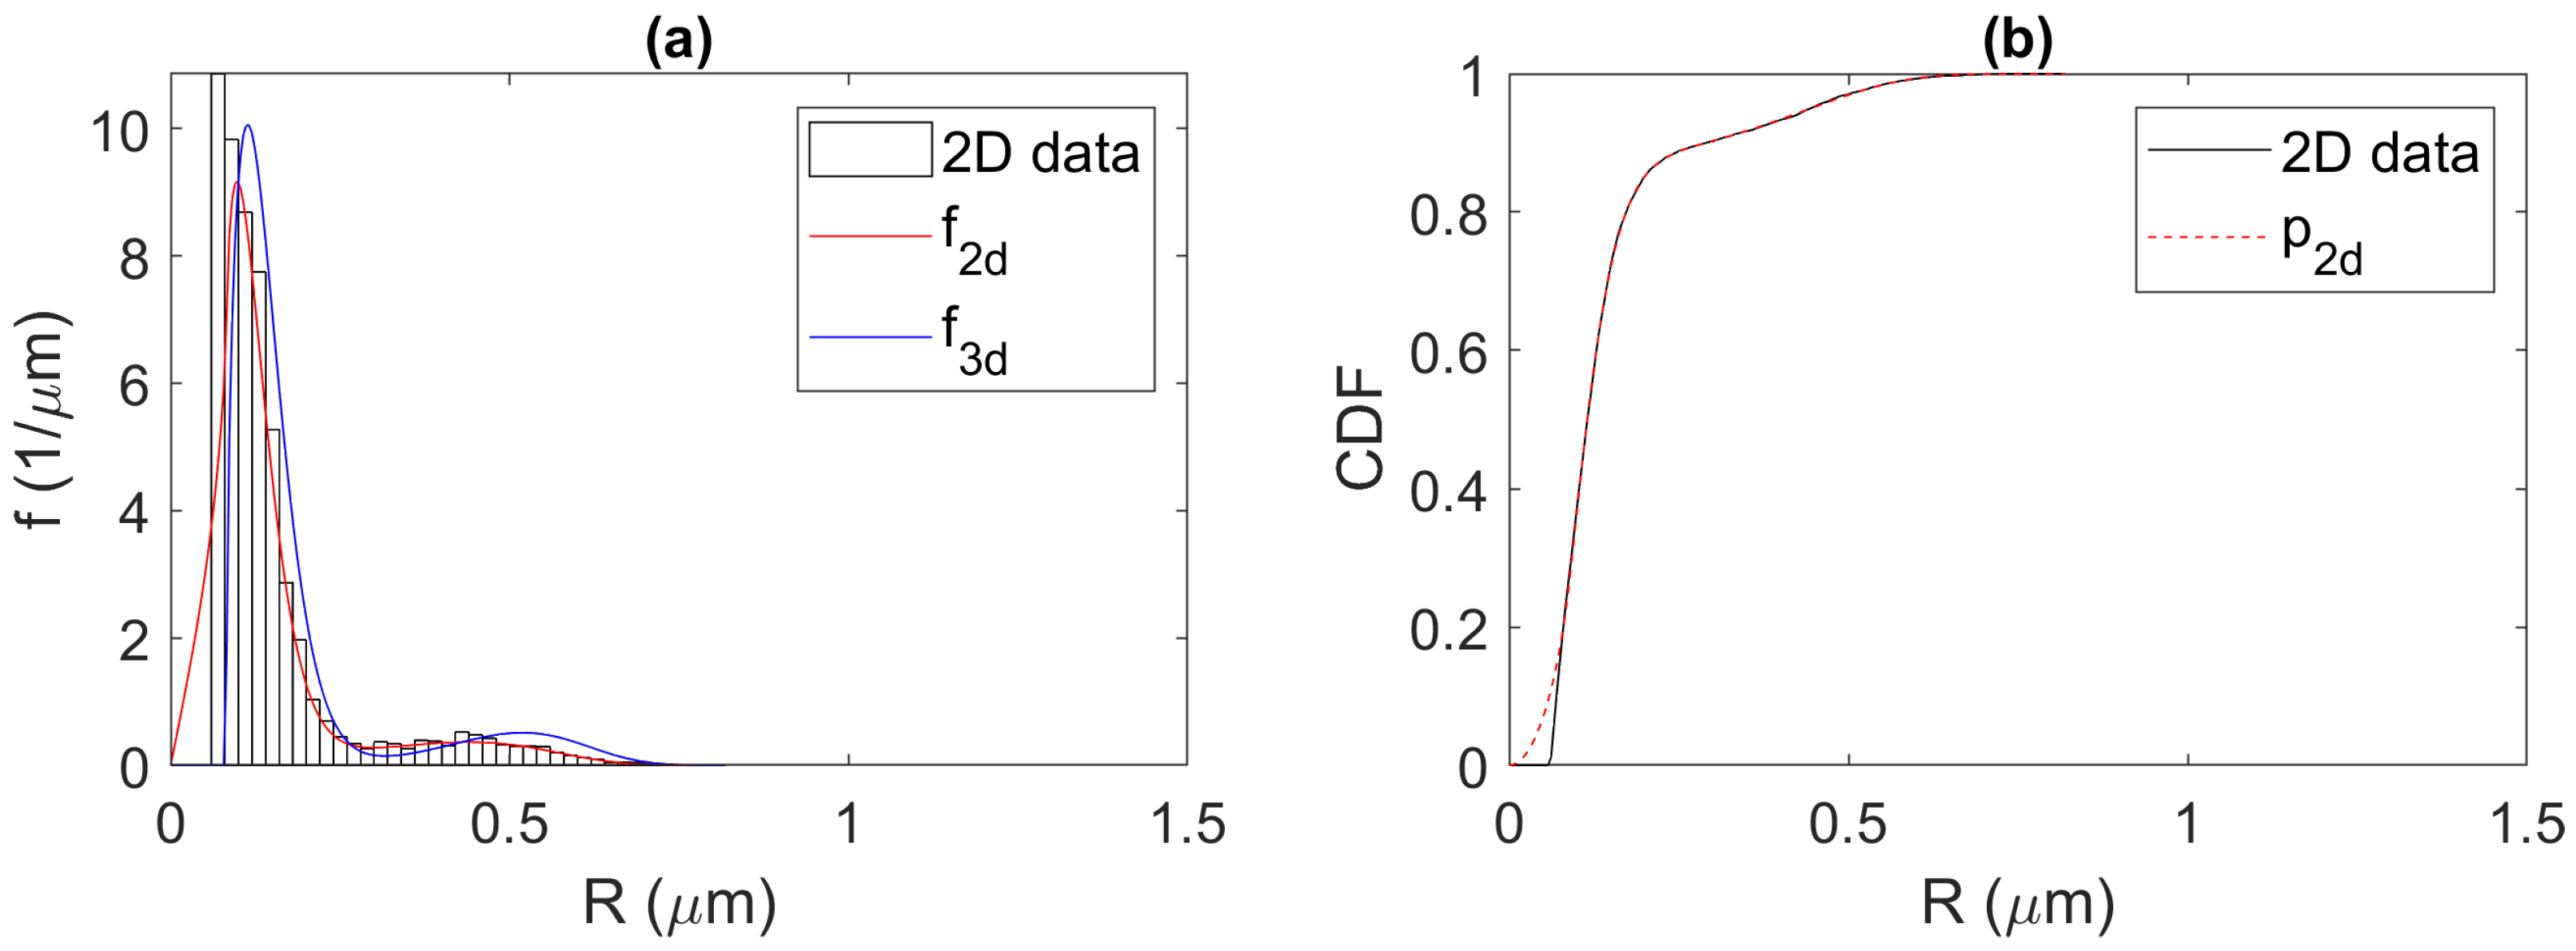
Figure 6.
(a) Comparison of the measured 2D data with the approximated 2D and 3D particle size distribution functions. The histogram presents the data, whilst the red and blue continuous lines describe the calculated 2D and 3D distribution functions. (b) The cumulative distribution functions comparing the 2D data and the 2D model, with the data described using the continuous black line, and the calculation in the dashed red line.
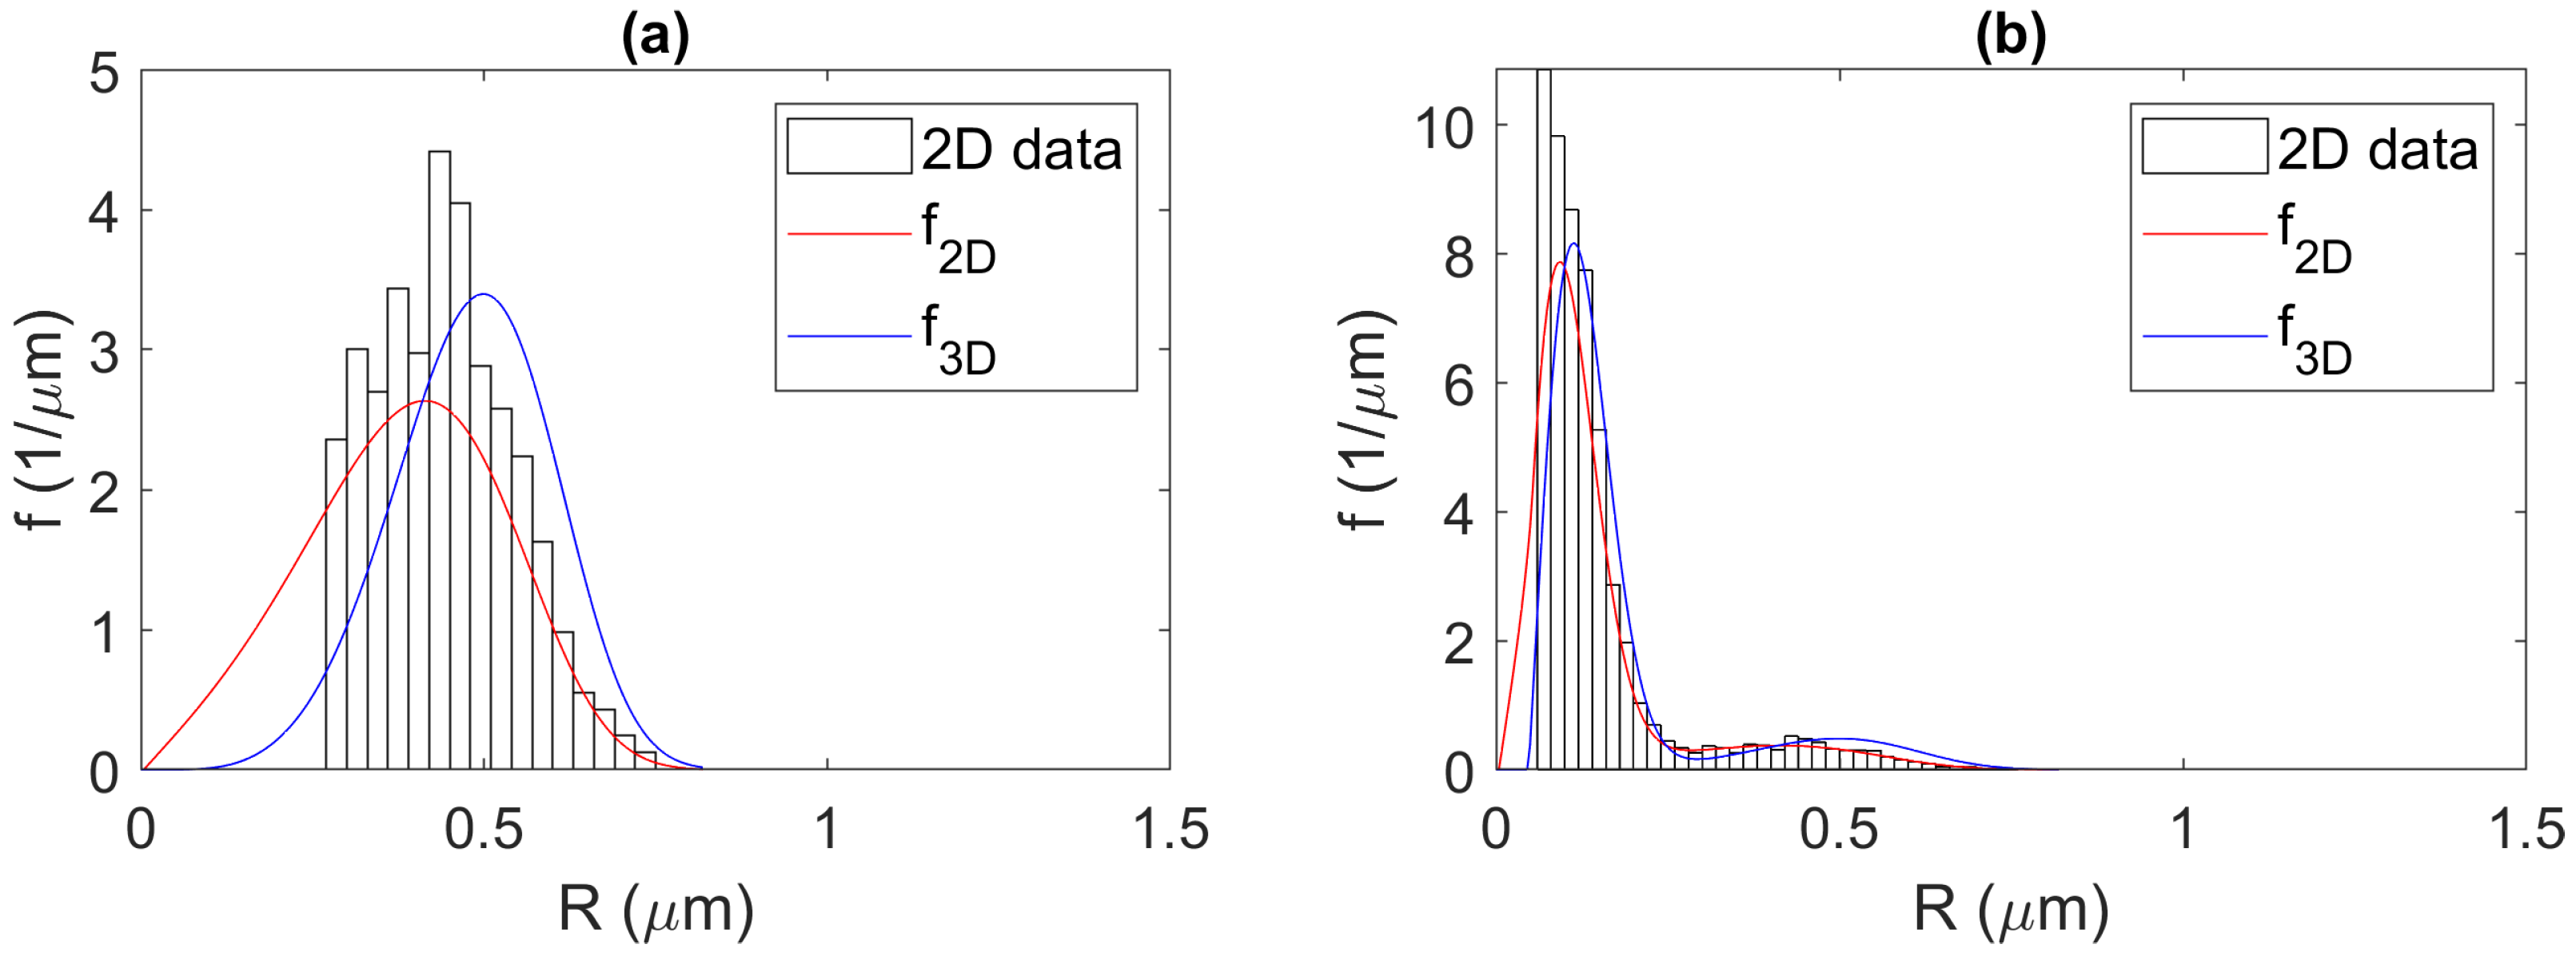
Figure 7.
(a) The comparison of the measured and calibrated probability size distribution functions, showing the 2D data, 2D prediction, and approximated 3D size distribution considering only the primary particles. (b) The comparison of the measured and calibrated probability size distribution functions for both primary and secondary populations.
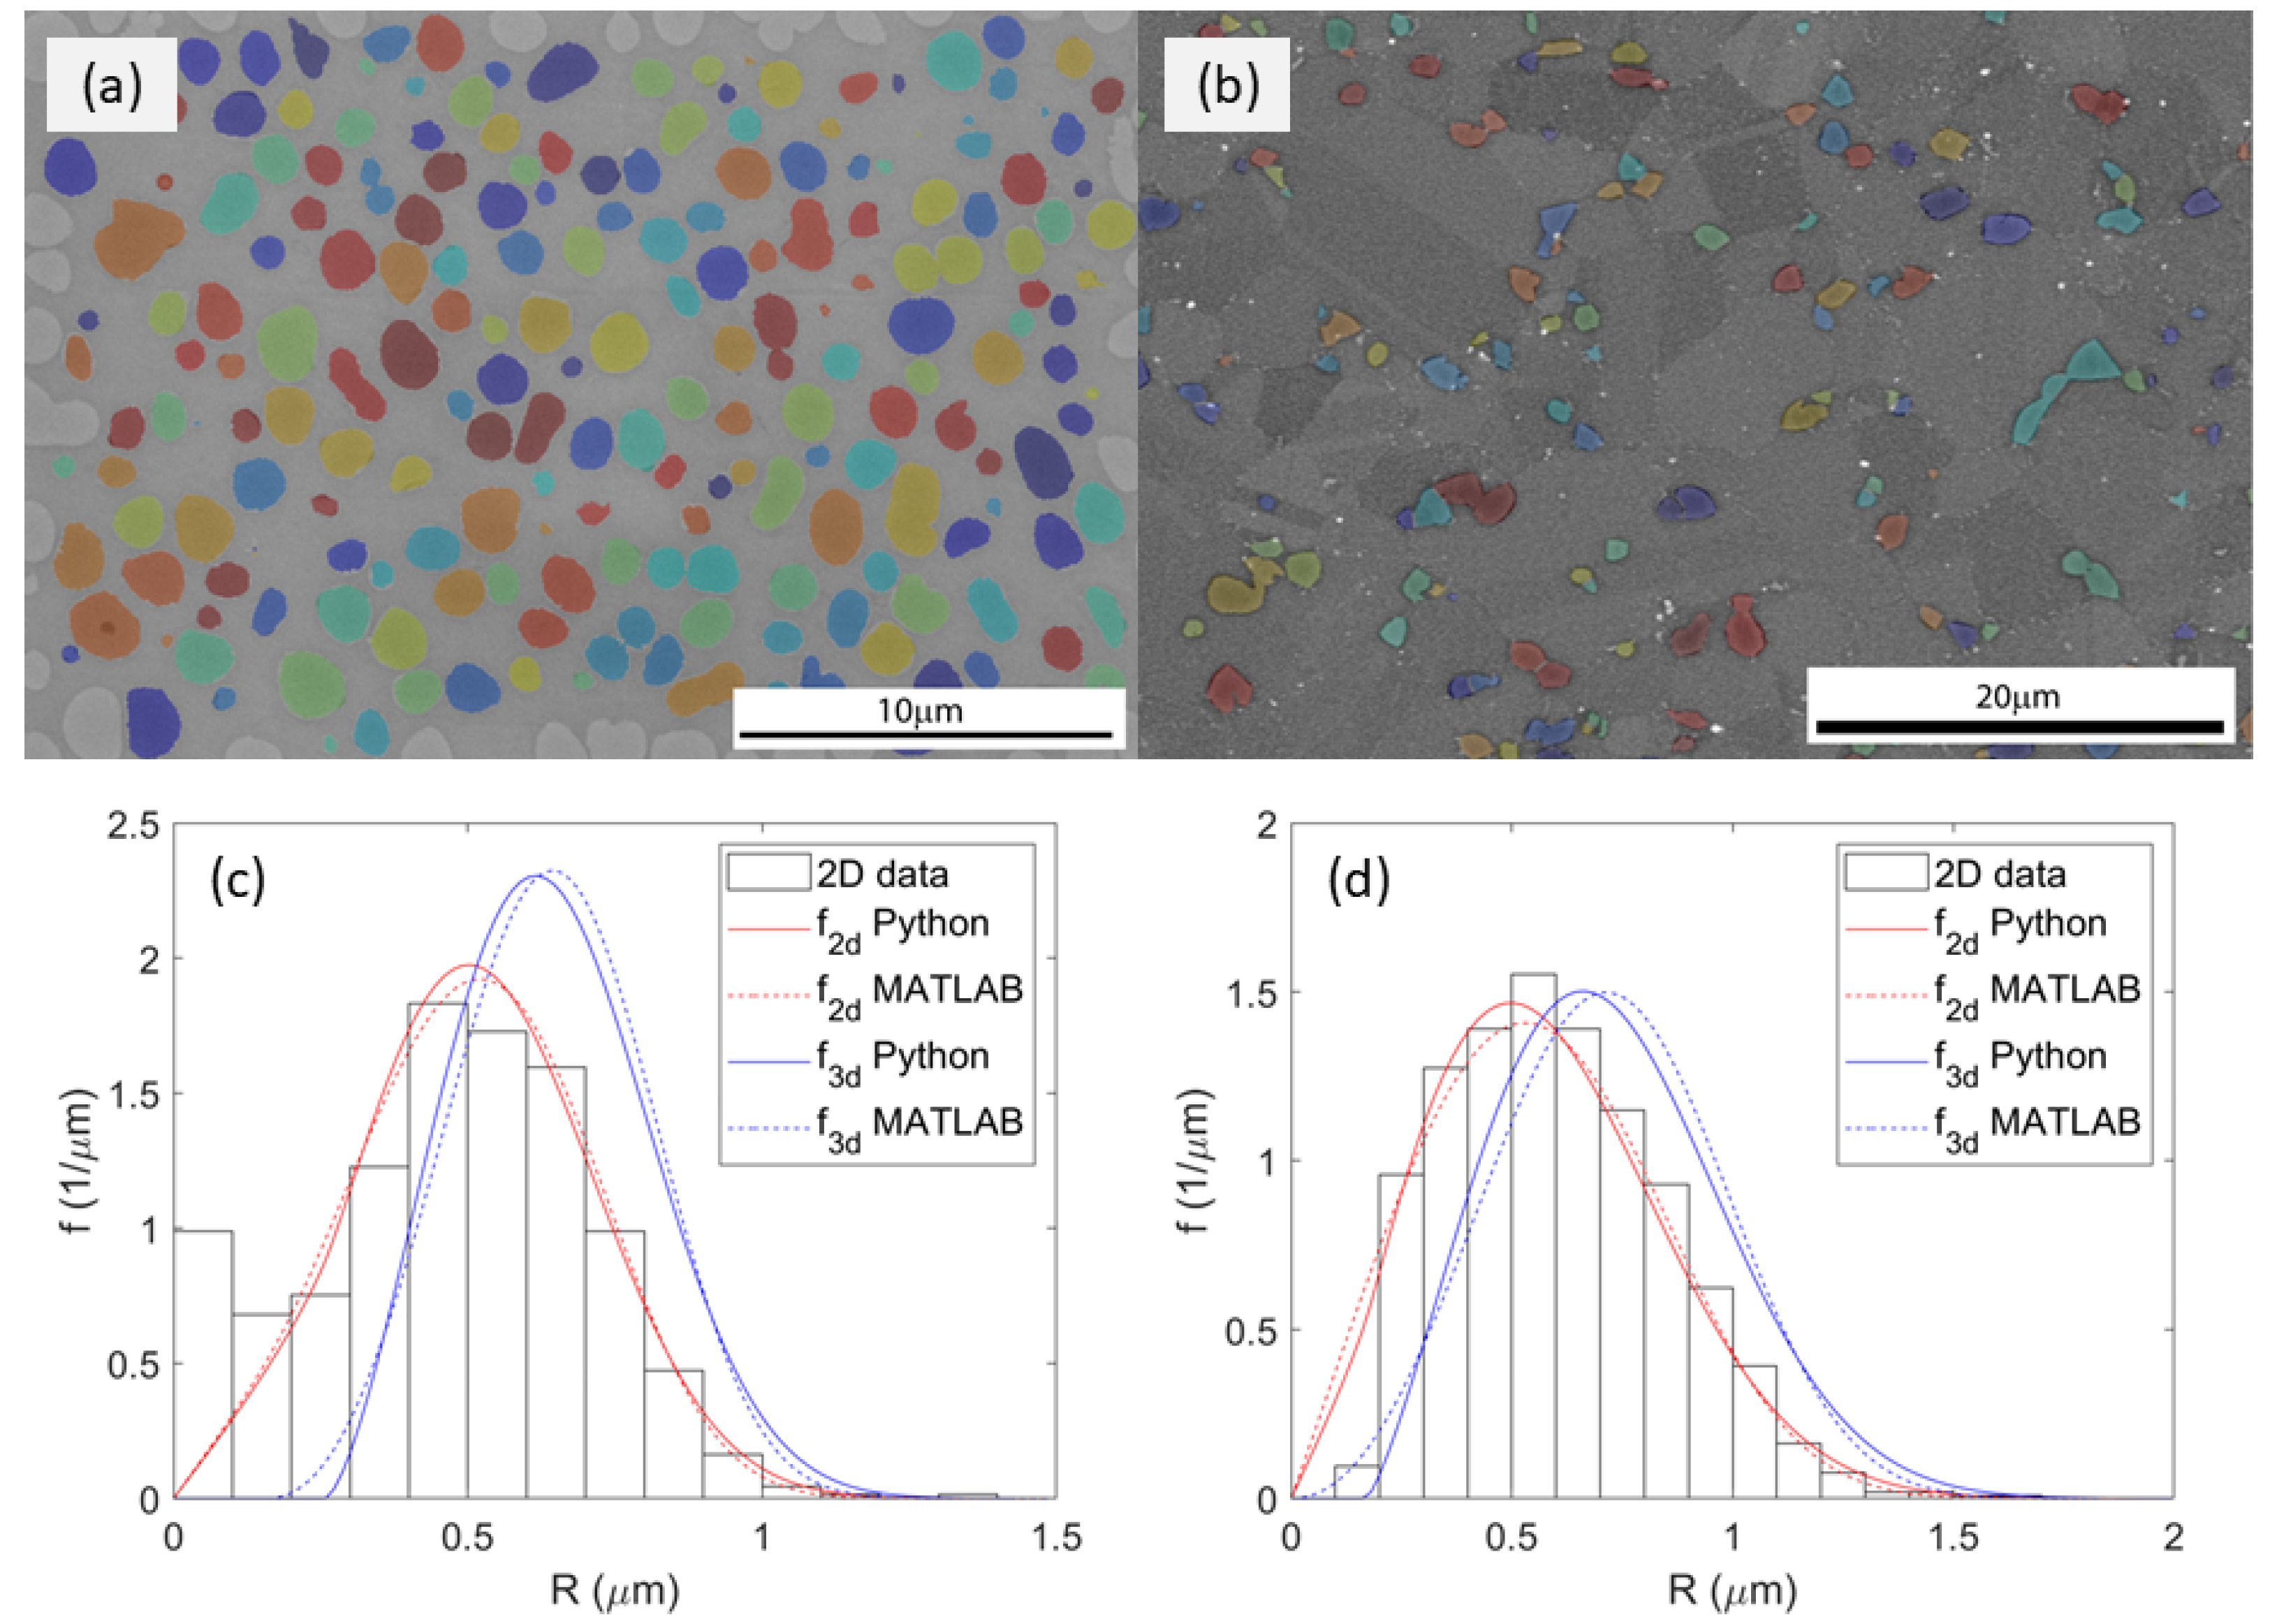
Figure 8.
The results from the inverse analysis of the bimodal size distribution in as-heat-treated coarse grain RR1000, comparing the simplex and BFSG methods. (a) presents the measured 2D distribution of particle cross-sections compared with calibrated 2D approximations of the data obtained from a Python and MATLAB implementation. (b) presents the approximated 3D size distributions in comparison to the measured 2D data.
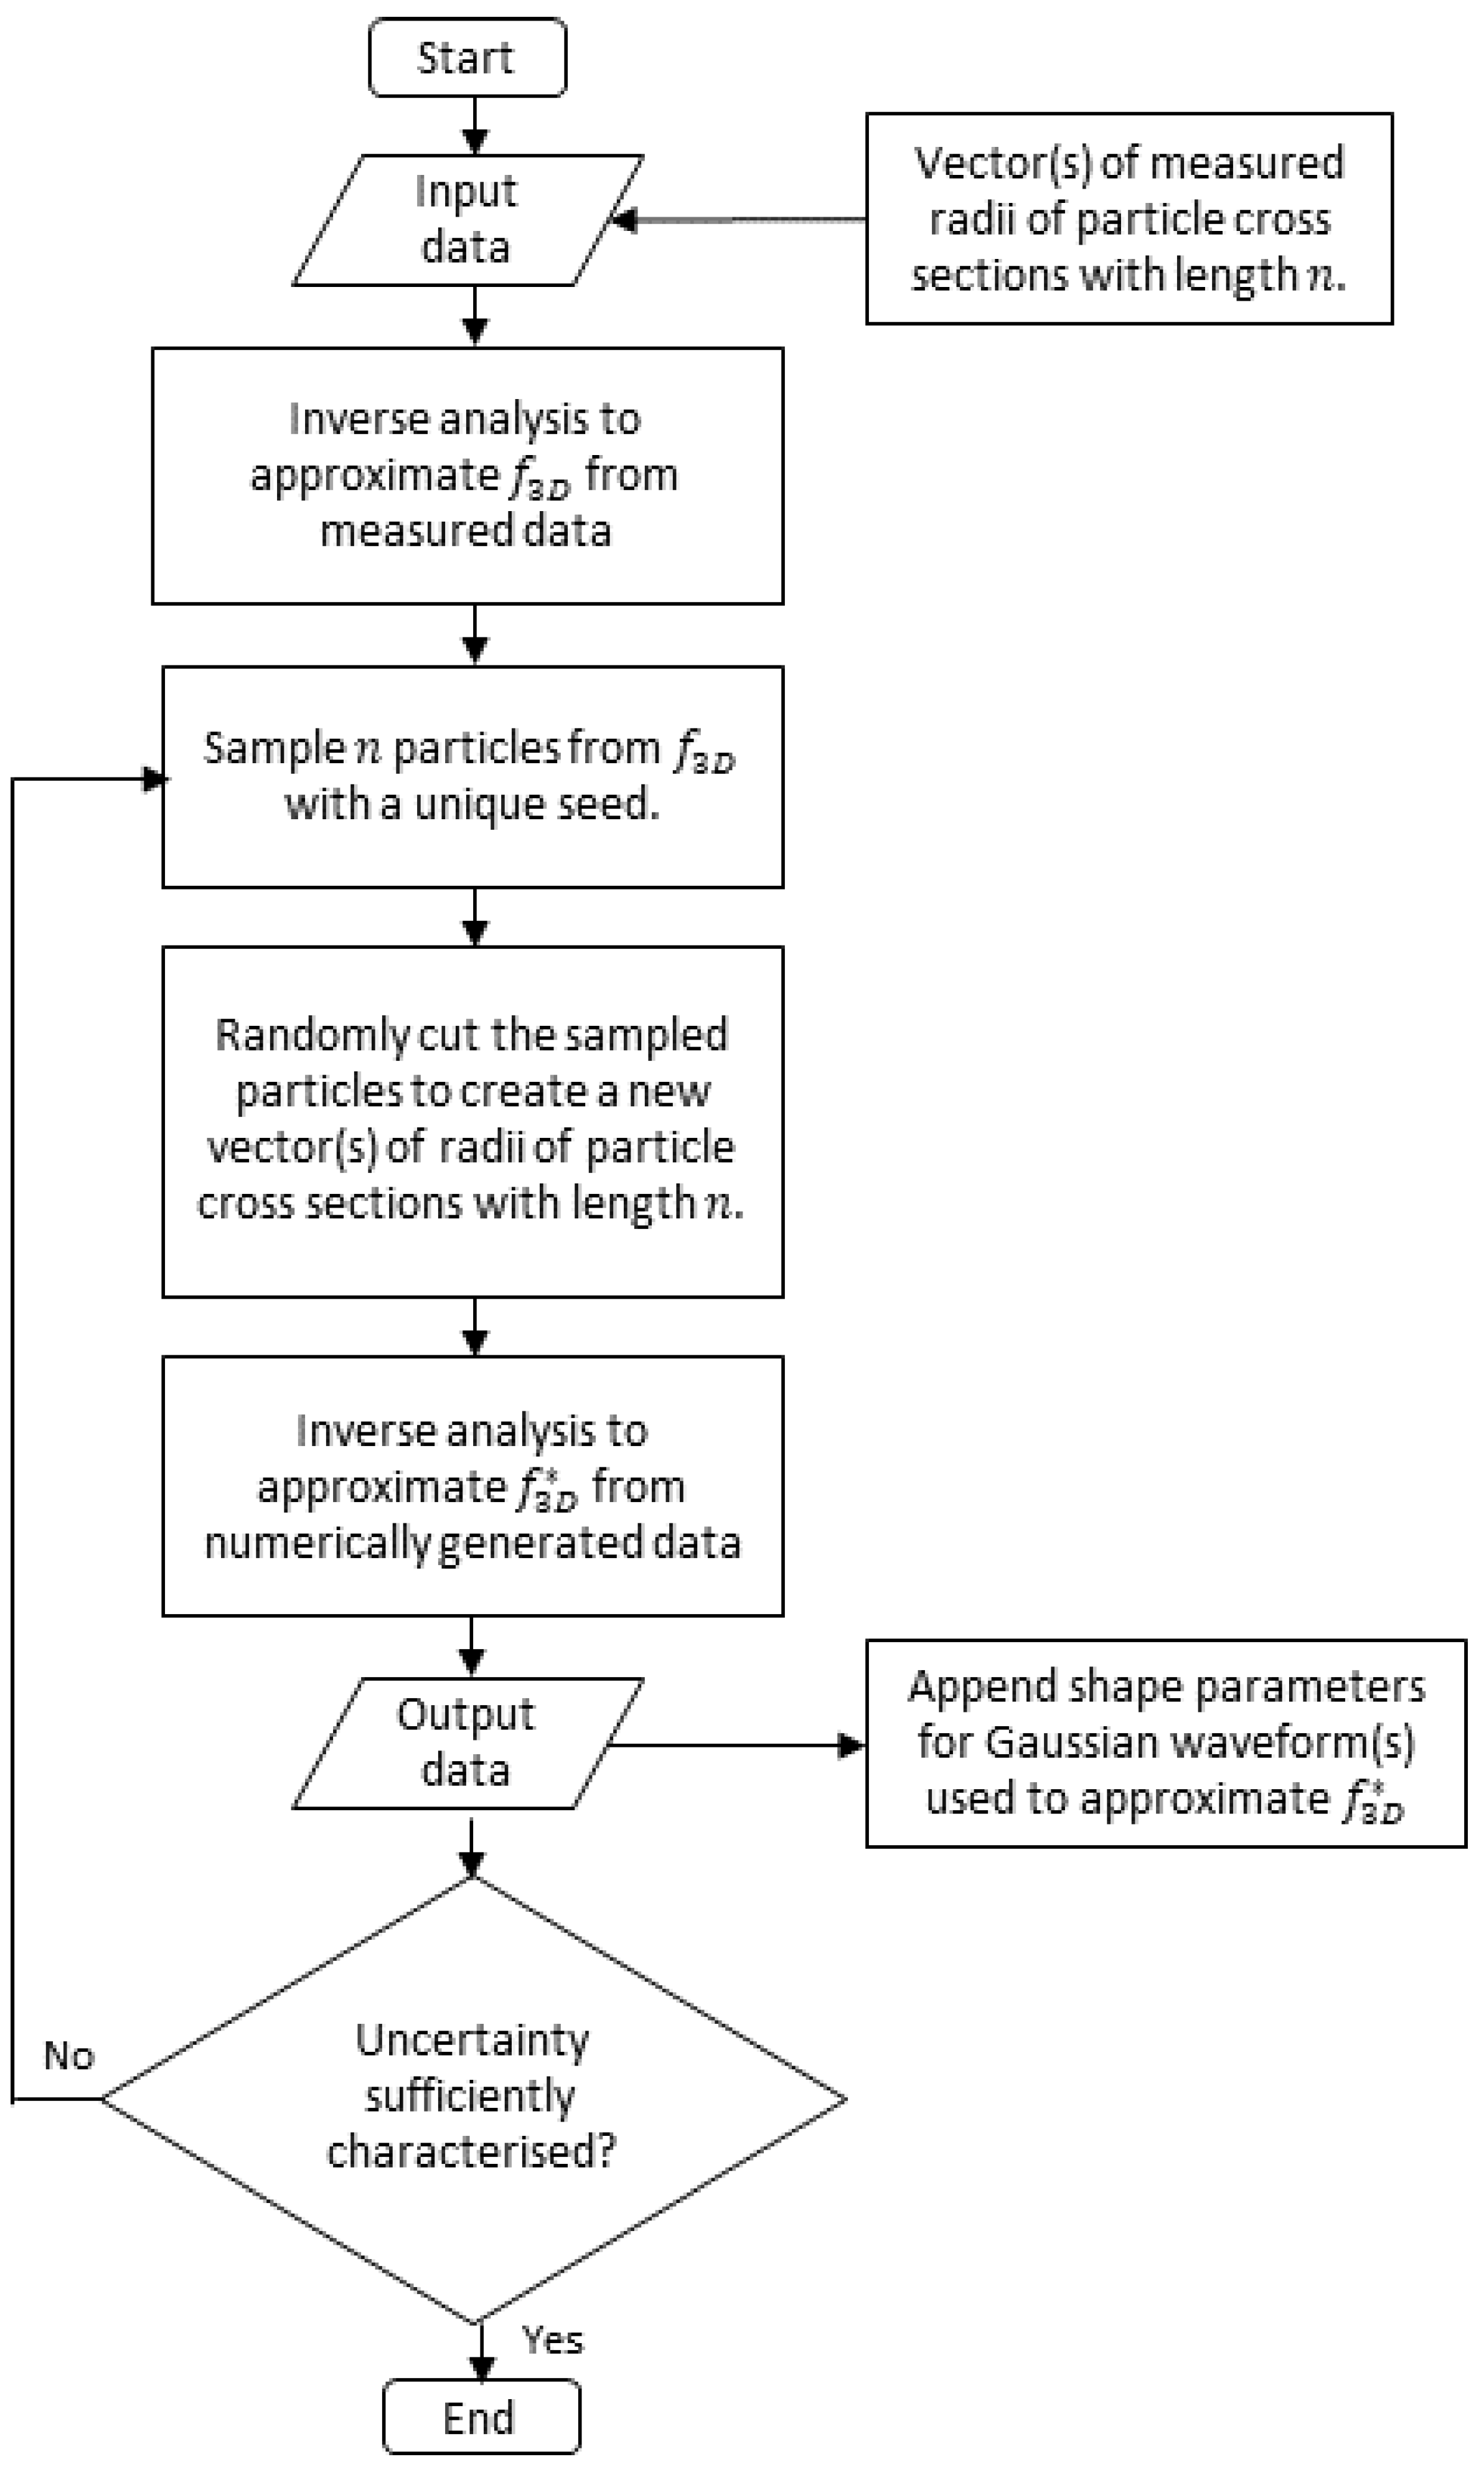
Figure 9.
A flowchart for uncertainty quantification when approximating the 3D size distribution from cross-sectional data.
Figure 9.
A flowchart for uncertainty quantification when approximating the 3D size distribution from cross-sectional data.
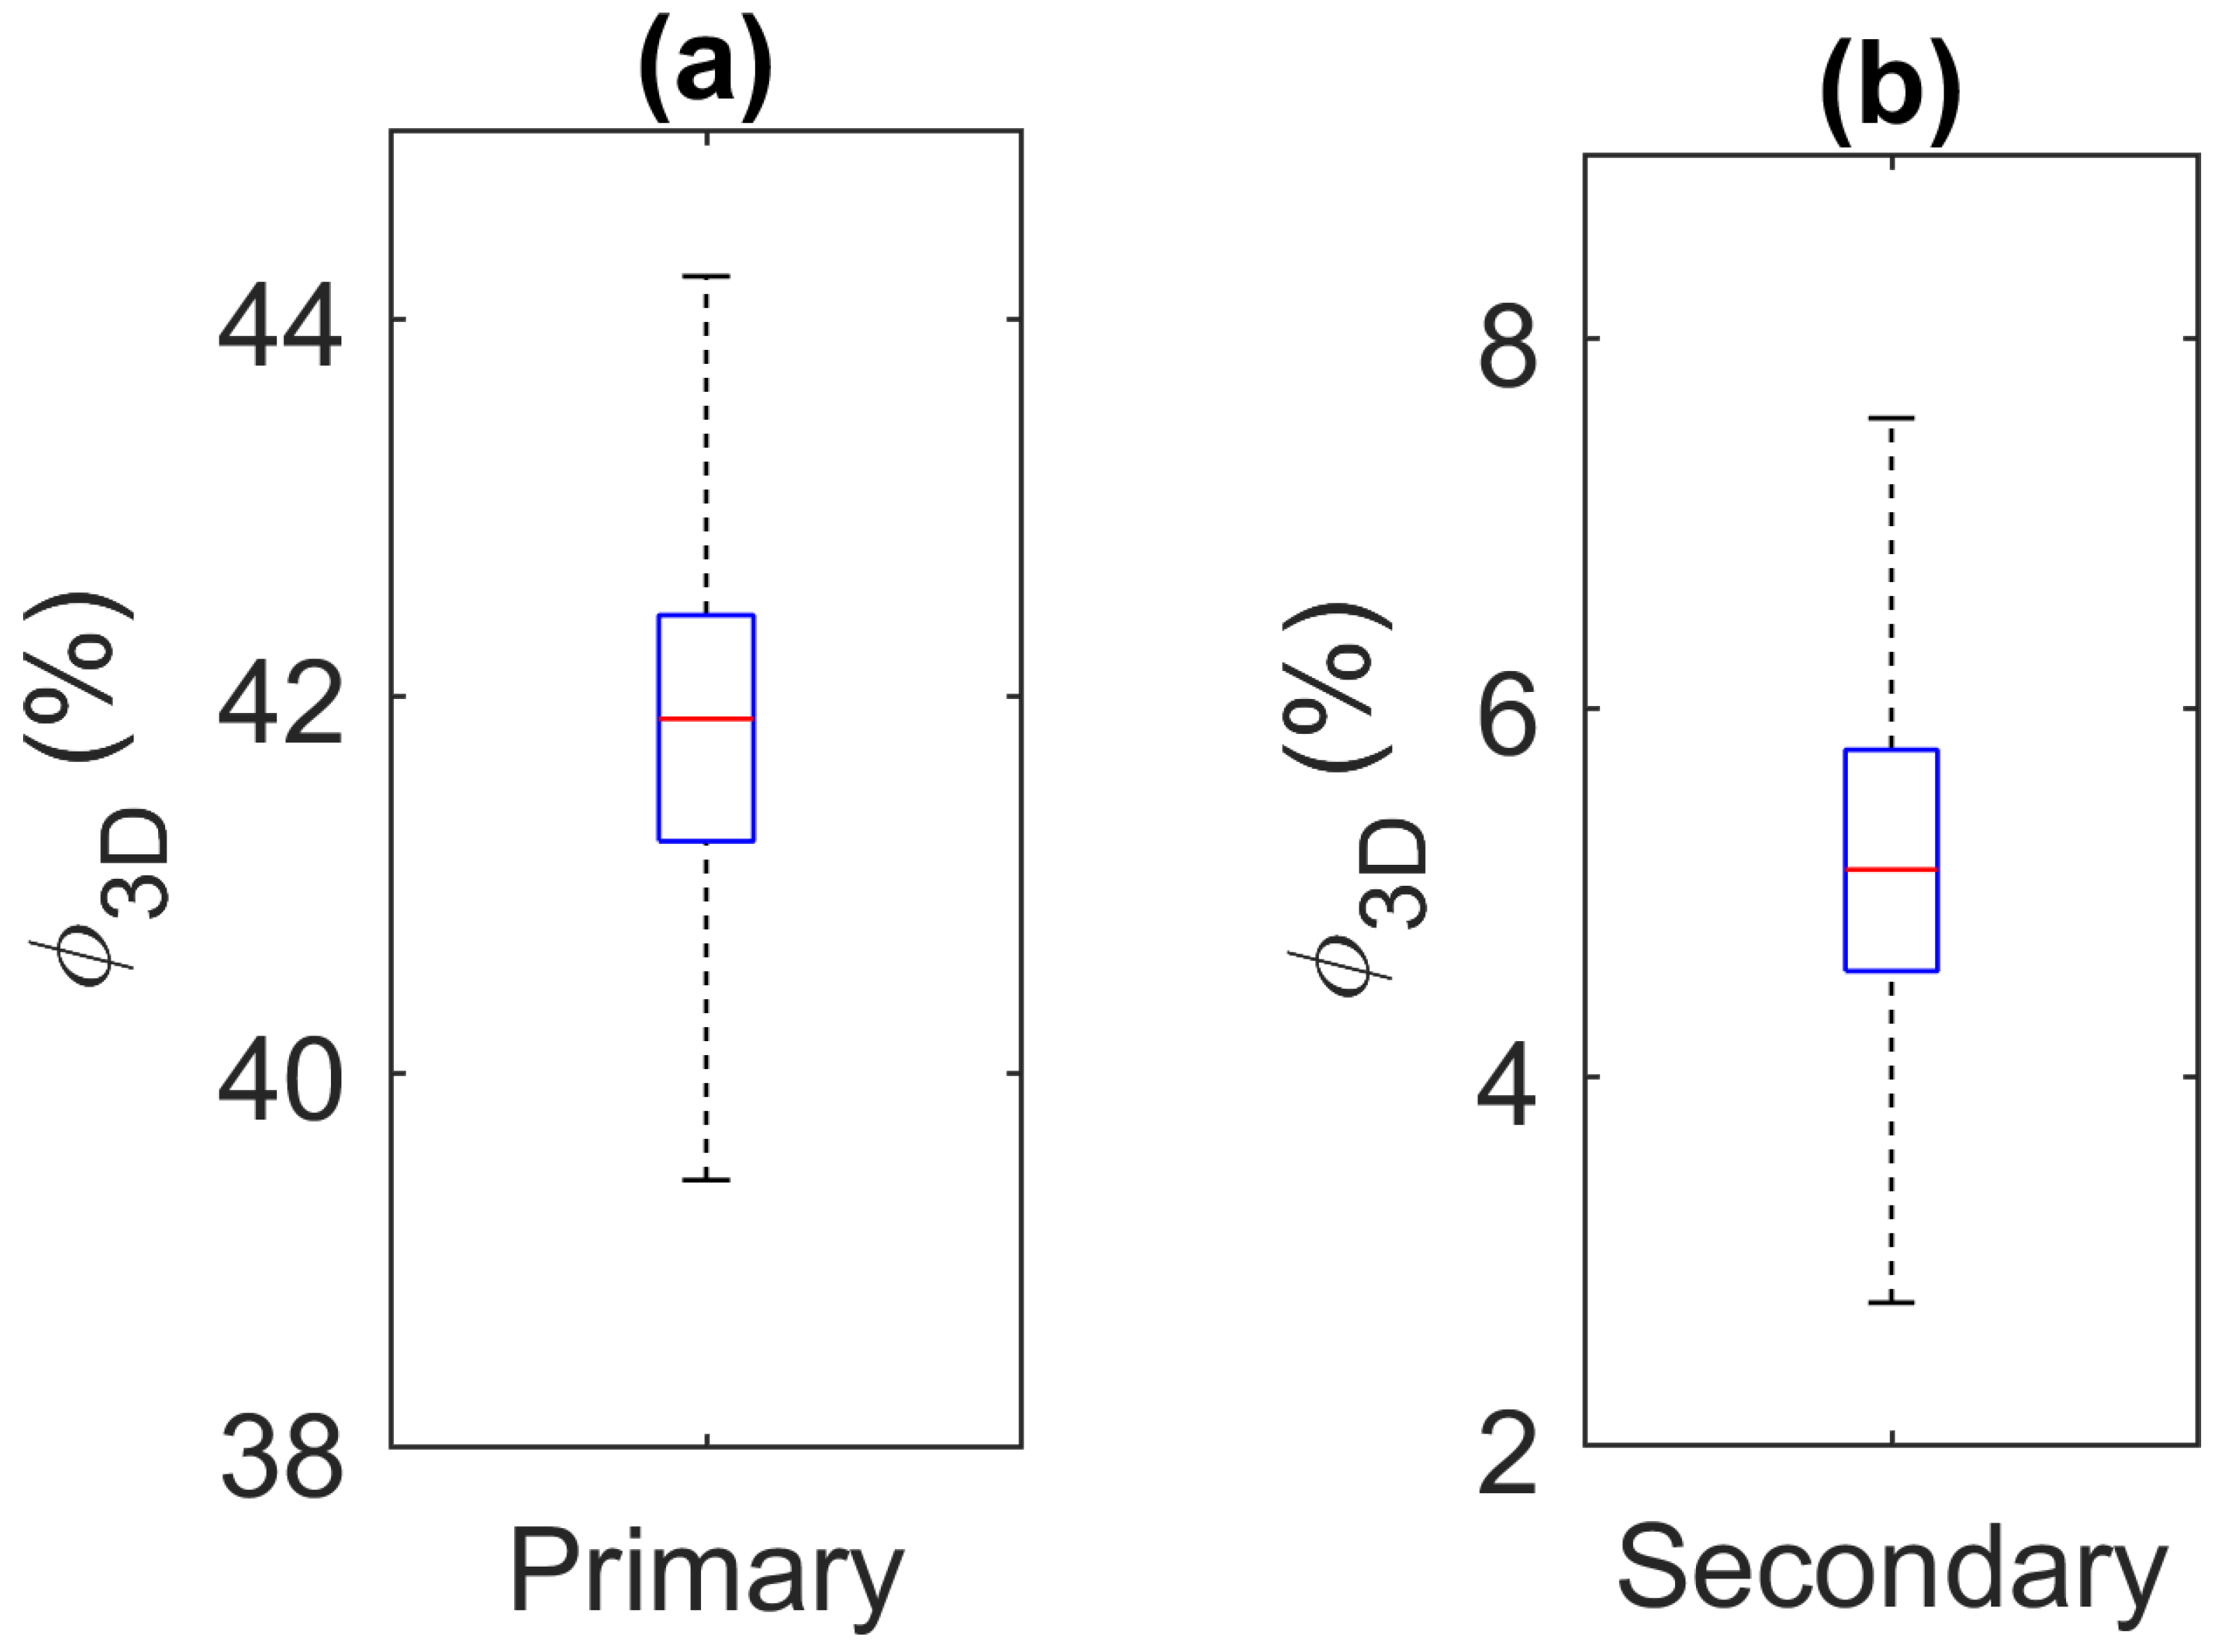
Figure 10.
Boxplots show the scatter in the predicted volume fraction of the (a) primary and (b) secondary particle populations considering a total of 2748 particle measurements.
Figure 10.
Boxplots show the scatter in the predicted volume fraction of the (a) primary and (b) secondary particle populations considering a total of 2748 particle measurements.
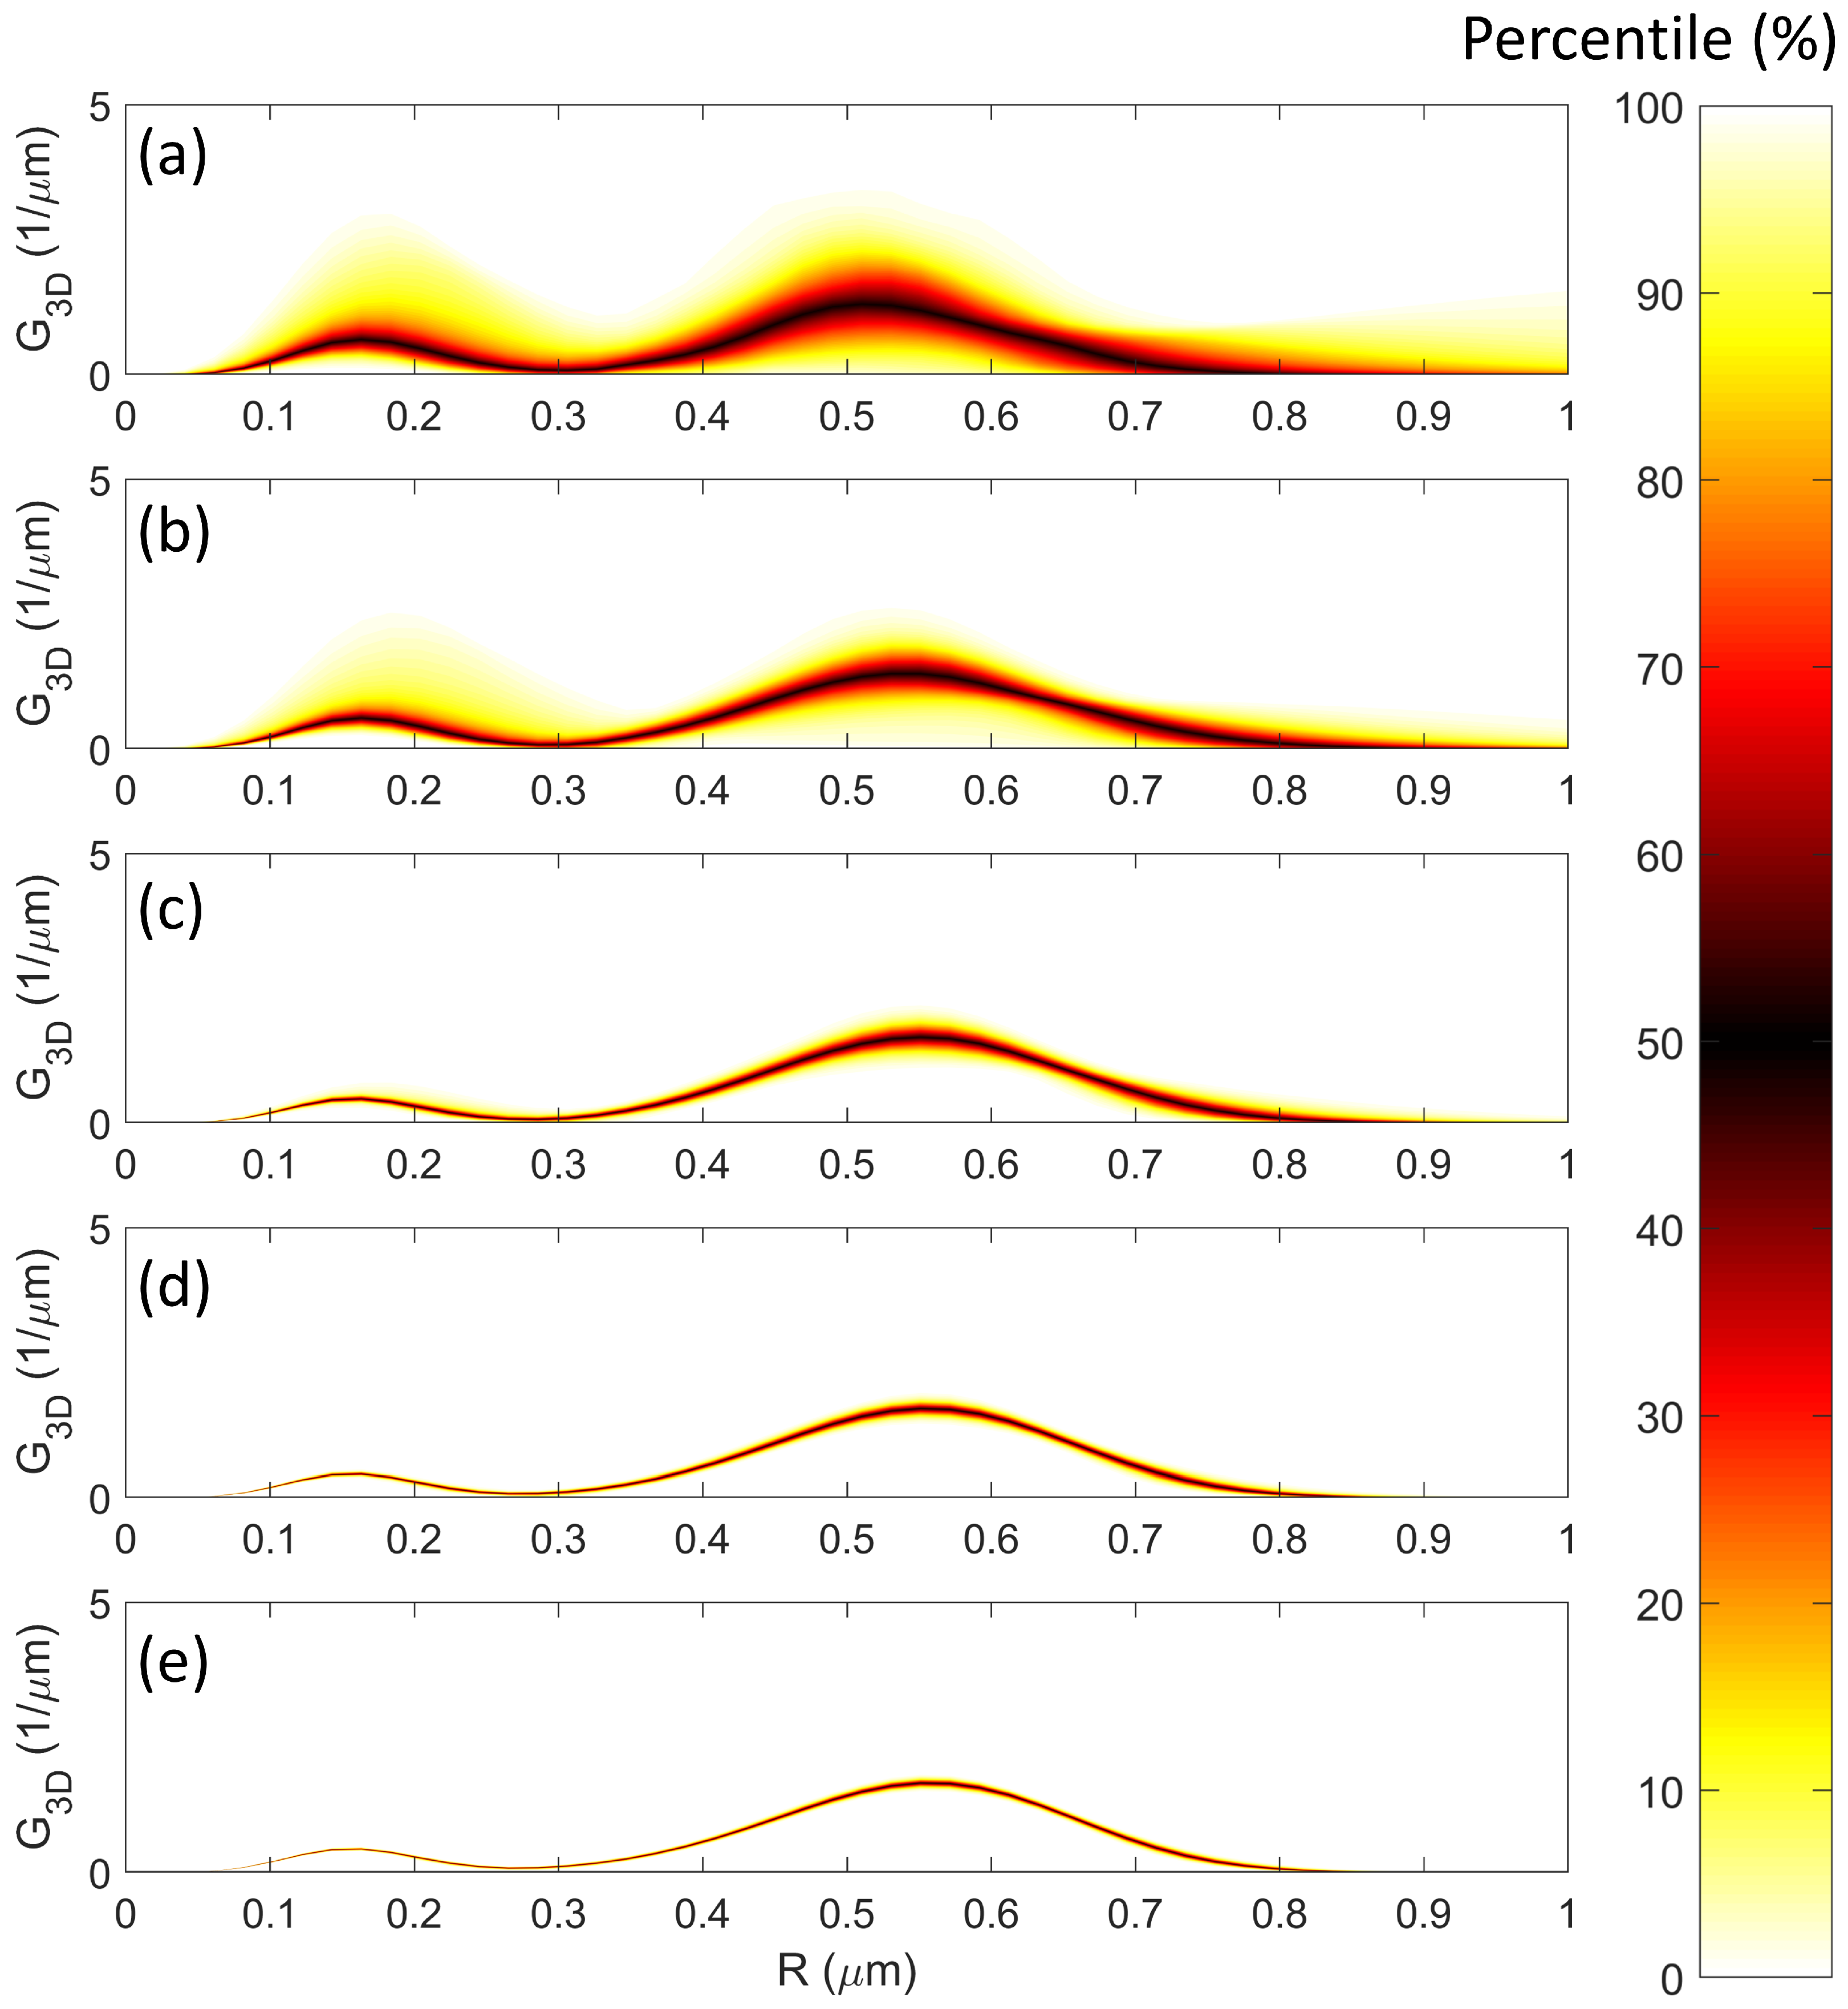
Figure 11.
The error and Uncertainty in the approximated 3D size distribution as a function of sample size, where (a) has a sample size of 300, (b) has 1000, (c), has 3000, (d) has 10,000, and (e) has a sample size of 30,000.
Figure 11.
The error and Uncertainty in the approximated 3D size distribution as a function of sample size, where (a) has a sample size of 300, (b) has 1000, (c), has 3000, (d) has 10,000, and (e) has a sample size of 30,000.
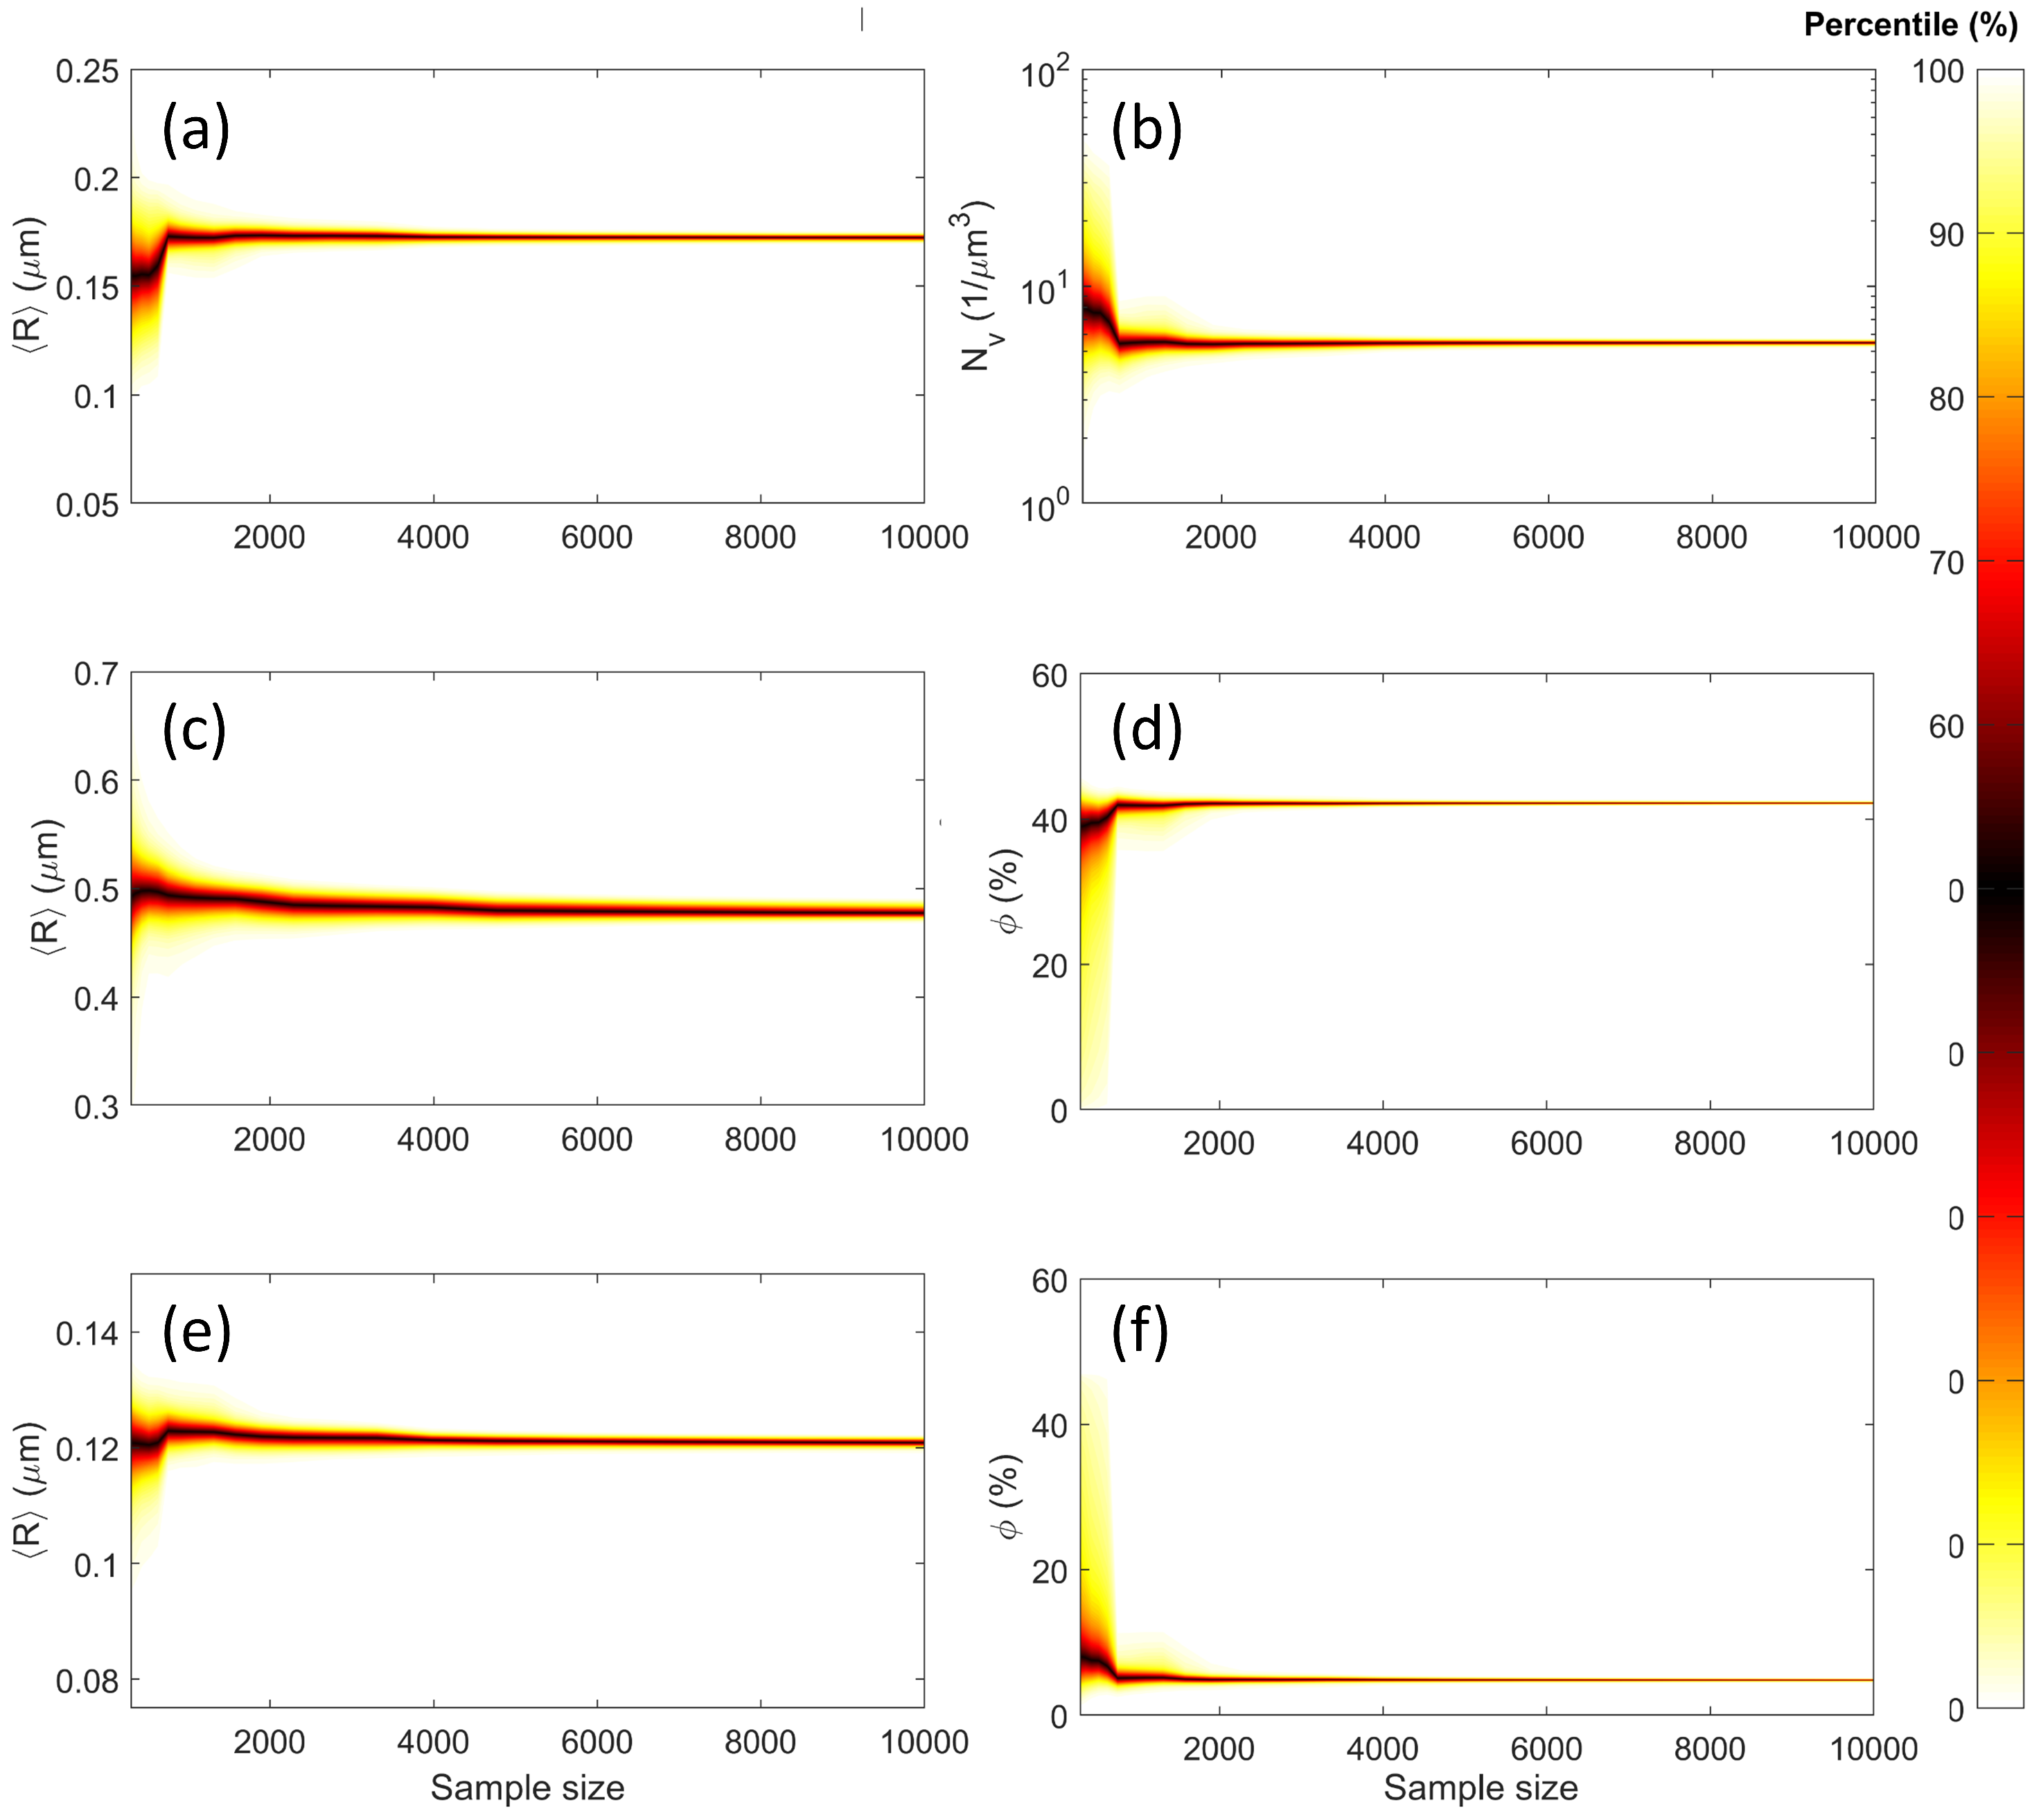
Figure 12.
Variation in predicted particle statistics as a function of sample size. (a,b) show the variation in percentiles for the mean particle radius and particle concentration considering the entire dispersion. (c,d) compare the mean particle radius and particle volume fraction for the primary particles, whilst (e,f) show the variation in mean particle radius and volume fraction for the secondary particles.
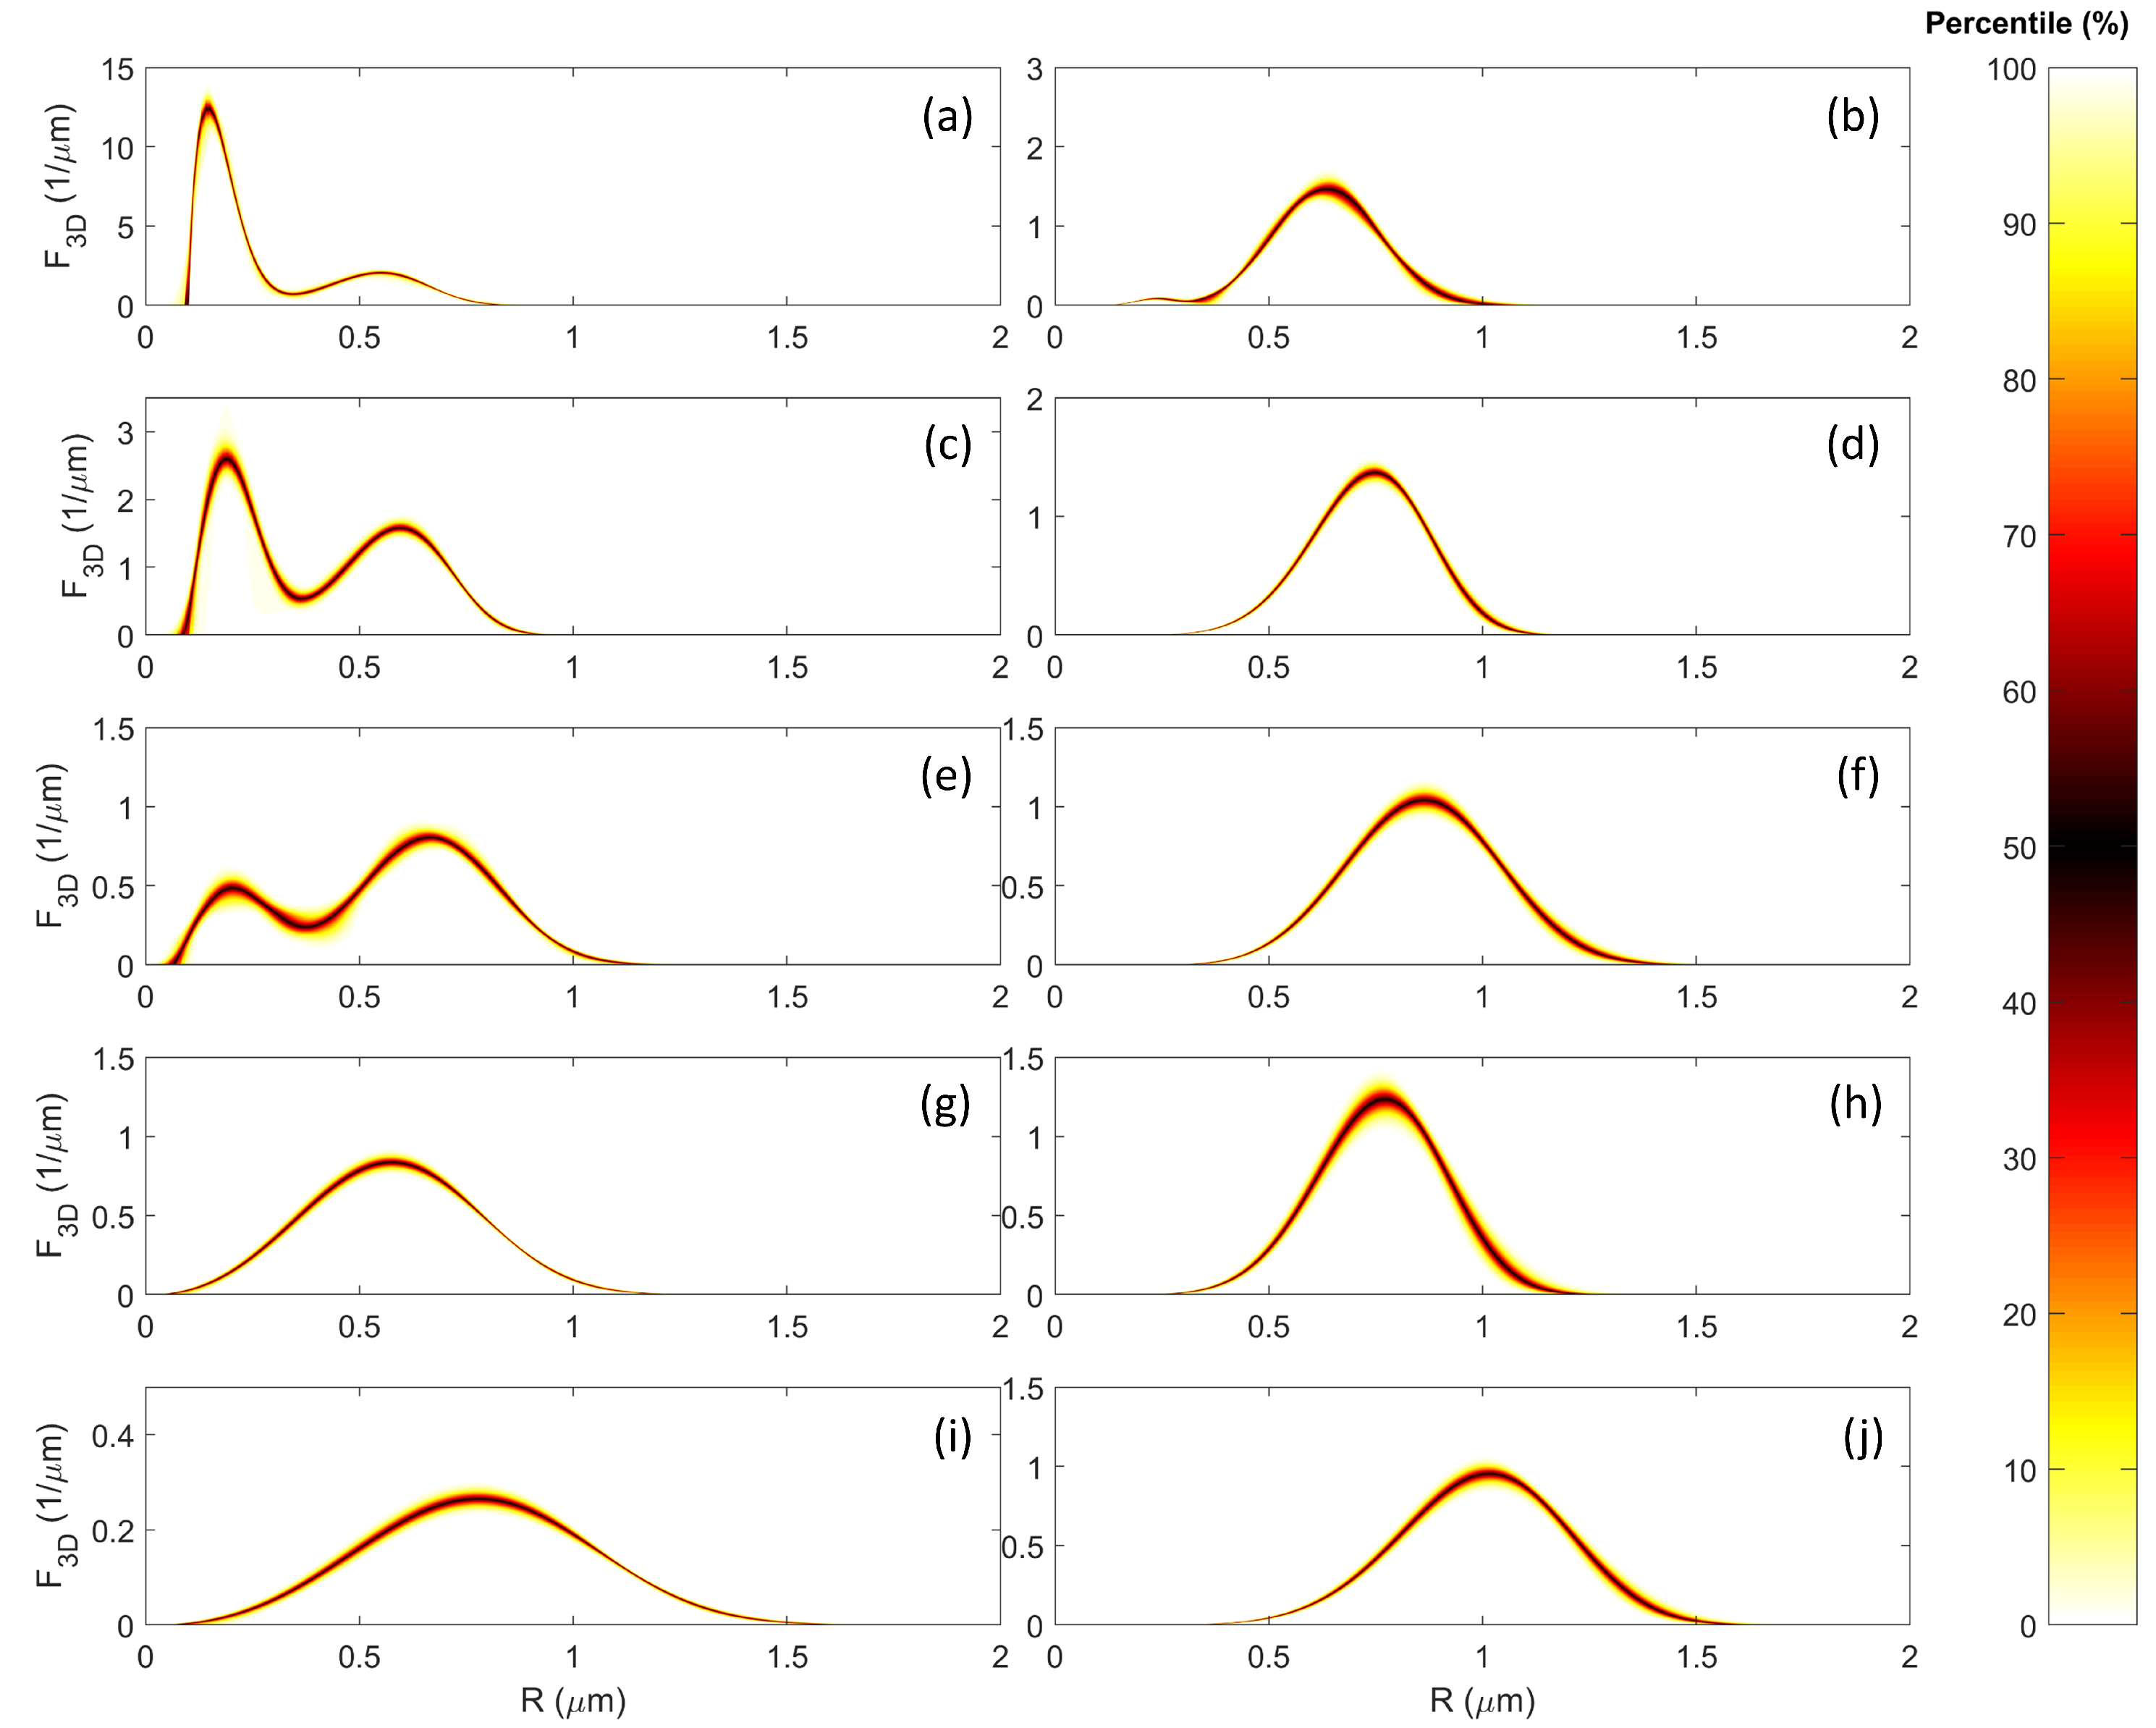
Figure 13.
The scatter and variation in approximated 3D particle size distributions in precipitates in IN738LC, aged at 850 °C and 900 °C for 1000 h, 2000 h, 3000 h, 10,000 h, and 20,000 h. (a,c,e,g,i) show the results from aging at 850 °C whilst figures (b,d,f,h,j) show the results from aging at 900 °C. (a,b) refer to aging times of 1000 h, (c,d) to 2000 h, (e,f) for 3000 h, (g,h) to 10,000 h, and (i,j) to 20,000 h.
Table 1.
This table lists the Gaussian waveforms used to assess the 3D → 2D conversion functions.
Table 1.
This table lists the Gaussian waveforms used to assess the 3D → 2D conversion functions.
| Gaussian Waveforms | | |
|---|
| (a) Normal unimodal | | (25) |
| (b) Normal bimodal | | (26) |
| (c) Log-normal | | (27) |
| (d) Weibull | | (28) |
Table 2.
The parameters to generate different shapes of particle size distributions, corresponding to the waveforms presented in
Table 1.
Table 2.
The parameters to generate different shapes of particle size distributions, corresponding to the waveforms presented in
Table 1.
| Distribution Type | (m) | (m) | | (m) | | (m) |
|---|
| (a) Normal-unimodal | 1 | 0.1 | - | - | - | - |
| (b) Normal-bimodal | 0.75, 1.25 | 0.07, 0.25 | 0.5 | - | - | - |
| (c) Lognormal | 0.05 | 0.25 | - | - | - | - |
| (d) Weibull | - | - | - | 0.5 | 3 | 0.5 |


