Article

Rapid Bio-Assisted Synthesis and Magnetic Behavior of Zinc Oxide/Carbon Nanoparticles

by
Omar H. Abd-Elkader
1,*,
Nasrallah M. Deraz
2 and
Lotfi Aleya
3
1
Physics and Astronomy Department, Science College, King Saud University, P.O. Box 2455, Riyadh 11451, Saudi Arabia
2
Physical Chemistry Department, National Research Centre, Giza P.O. Box 12622, Egypt
3
Chrono-Environnement Laboratory, UMR CNRS 6249, Bourgogne, Franche-Comté University, CEDEX, F-25030 Besançon, France
*
Author to whom correspondence should be addressed.
Crystals 2023, 13(7), 1081; https://doi.org/10.3390/cryst13071081
Submission received: 27 May 2023 / Revised: 17 June 2023 / Accepted: 6 July 2023 / Published: 11 July 2023
(This article belongs to the Special Issue Crystalline Magnetic Compounds)

Abstract

:
The biomimetic synthesis of a ZnO/C nanocomposite has been achieved using the egg white-assisted self-combustion method. The characterization of this composite has been carried out using different techniques, such as XRD, FTIR, Raman, SEM/EDS and TEM. A comparative study was conducted between ZnO in the form of this composite and pristine ZnO, which was prepared via the same procedures but without the egg white. The resulting ZnO had a hexagonal structure, similar to wurtzite, with a P63mc space group. When this egg white method was used to produce a ZnO-based material, a ZnO/C nanocomposite was developed, and the ZnO’s crystallite size was significantly decreased. The structural properties—including the unit cell volume, strain, atom displacement and dislocation density—of this ZnO crystal are increased as a result of the presence of a C atom. On the other hand, the length of the Zn–O bond is reduced by the presence of the C atom. Results derived from a combination of Raman, FTIR, and EDS demonstrate that the carbonaceous layers and ZnO nanoparticles were integrated with a close interfacial contact. The preparation method used here brought about obvious changes in the morphological and magnetic behaviors of the as-prepared materials. Using a small amount of egg white resulted in the transformation of the particle’s shape from a hexagonal cone-type structure to an ellipsoidal structure. Based on an analysis of diffuse reflectance, the ZnO and ZnO/C band gap values were revealed using UV–VIS spectra. ZnO and ZnO/C exhibit band gap energies of 3.09 and 2.60 eV, respectively. A phase transition from weakly ferromagnetic to completely diamagnetic magnetic was discovered.

1. Introduction

Many research organizations are very interested in transition metal oxides. Due to its unique physical and chemical characteristics, zinc oxide (ZnO) holds a significant position amongst these oxides. As a result of the unique properties of ZnO, it has shown many important applications in many fields, including in the industrial and biomedical sectors [1,2,3,4,5]. Creating, exploring, and characterizing ZnO-based materials has led to the revelation of novel and significantly improved physicochemical and biological properties, as well as distinctive phenomena and functionalities, playing out in the nanoscale range [3,4,5]. As such, ZnO nanoparticles (NPs) have been of considerable interest as a multifunctional material because of their applicability in solar cells, gas sensors, photocatalysts, luminescent and biomedical materials, and rubbers and textiles [6,7,8].
ZnO NPs have been subjected to numerous attempts to develop their various characteristics. ZnO nanostructures’ surfaces can be adjusted to do so; alternatively, ZnO is compatible with other materials, including metals, non-metals, and organic molecules [9]. Carbonaceous substances are considered efficient non-metal modifiers of ZnO, improving its photocatalytic activity, electrochemical performance, and magnetization [10,11,12,13,14,15]. In this regard, various studies have confirmed that carbon materials (graphite, carbon fiber, carbon tubes, multilayer graphene, and fullerenes), when used as an intercomponent, have a significant impact on the mechanical, electrical, photocatalytic, corrosion resistance-related, thermal stability, adsorbability, and other properties of different inorganic compounds, due to their ability to undergo positive synergies with these compounds, thus yielding hybrid composites [9,10,11,12,13,14,15,16]. The modification of the surface of nanostructured ZnO has yielded improvements in its properties via the formation of a hybrid composite able to overcome some of the intrinsic defects of ZnO [17,18]. In fact, significant advances have been made in these ZnO/C systems, allowing the fabrication of new materials for Li batteries, photocatalysts for wastewater treatment, solar and mechanical energy converters, transparent electronics and highly sensitive biosensors [19,20,21,22,23].
ZnO/C composites have been synthesized using a variety of techniques, including polymer-template synthesis, biosynthesis, metal–organic chemical vapor deposition, chemical precipitation, sol-gel, solid-state pyrolysis, mechanical activation, and solution-free mechanochemical methods [13,14,24,25,26]. As one such promising strategy, egg white-assisted biomimetic synthesis has emerged as an important, environmentally friendly route for the fabrication of new hierarchical nanostructures. Due to its distinctive ability to gel, foam, and emulsify, as well as integrate with metal ions, egg white could prove a favorable choice for biomimetic synthesis [27]. The biomimetic synthesis of a Zn/C system using egg white is not complicated, and does not consume much time or energy. In addition, the process is simple, inexpensive, bio-safe and environmentally friendly [28]. When small amounts of carbon atoms are met with ZnO, the homogeneous diffusion of carbon occurs, taking the form of either free carbon that envelopes the ZnO surface or of a dopant that dissolves in the crystal lattice of ZnO. This dissolution entails either incorporation at the interstitial sites of the host material, without the presence of any atomic bindings, or the substitution of Zn or O atoms, forming Zn–C or O–C bonds [29].
The novelty of our work is in using the egg white-assisted combustion method to obtain zinc oxide doped with carbon residues, themselves resulting from the burning of egg white. That is, we have self-doped zinc oxide with a very small amount of carbon, which is a by-product.
As such, the aim of this study was the egg white-assisted biomimetic synthesis of a Zn/C system. We then identified the structural, vibrational, morphological, optical, and magnetic characteristics of pure ZnO and the ZnO/C nanocomposite.

2. Materials and Methods

2.1. Materials

Zn (NO3)2·6H2O, a chemical compound, was used as the active ingredient. The Sigma-Aldrich Company (Darmstadt, Germany) provided this material. No additional processing was necessary for this reagent because it was used quantitatively. Fresh eggs from Egyptian chicks were used to derive the egg whites.

2.2. Preparation Method

One zinc oxide sample (S2) was produced via an egg white-mediated combustion process. This sample was produced by thoroughly mixing 2.9749 g of zinc nitrate hydrate with 5 mL of egg white in a crucible. To increase the viscosity of the materials under study, the mixture was first spun at 60 °C to let the water vaporize. The temperature was then increased to 120 °C, which turned the mixture into a gel. The resulting precursor gel was calcined for 15 min at 300 °C on a hot plate to reach the crucible temperature. A spark appeared in one corner and quickly spread throughout the sample, with the appearance of an incandescent combustion; the result was a dense, fluffy solid that began to take the shape of a large volume of foam. The S1 sample was prepared by heating 2.9749 g of zinc nitrate hydrate at 300 °C for 15 min in a crucible. During this method, we did not need to add water or any other solvent as was done in previous research, as we relied directly on the characteristics of the egg white in dissolving the zinc nitrate and initially obtaining a milky white solution, then a gel, which was then roasted on a hot plate at 300 °C for 15 min with an increment of 3 °C/min to obtain the final product, consequentially stored for further use [19].

2.3. Characterization Systems

Using a BRUKER D8 advance diffractometer (Karlsruhe, Germany) and X-ray diffraction technology, structural measurements of several nanoparticles were taken. Cu K radiation with a 2° min-1 scanning speed was used in running the patterns at 40 kV and 40 mA. Based on X-ray diffraction line broadening and the Scherrer equation, Equations (1)–(4) have been utilized to determine the mean crystallite size (d), stress (ε), and dislocation density (δ) of the zinc oxide and Zn/C oxide contained in the studied product, as follows [30]:
d = B λ/β cos θ
δ = 1/ d2
ε = β cos θ/4
where d is the average crystallite size of the phase under investigation, B is the Scherrer constant (0.89), λ is the X-ray beam’s wavelength, β is the full-width half maximum (FWHM) of diffraction, θ is the Bragg’s angle, and δ is the dislocation.
A Perkin–Elmer Spectrophotometer (type 1430) was used to measure the Fourier-transmission infrared spectra (FTIR) of various materials. Here, 200 mg of vacuum-dried IR-grade KBr was combined with 2 mg of each solid sample. The FTIR spectra’s measurement range was from 1000 to 4000 cm−1. The mixture was processed for three minutes in a vibrating ball mill followed by scattering it in a steel die with a 13 mm diameter. A double-grating FTIR spectrophotometer container was filled with identical disks.
The Raman spectra of the ZnO samples were taken using an i-Raman Plus 532S portable laser Raman spectrometer combined with a BAC151C Raman Video Micro-Sampling System (B&W TEK, USA) and 20-100X lenses.
The ultraviolet–visible absorption spectra (UV–VIS) of the prepared samples were measured using a V-570 spectrophotometer (JASCO corp., Tokyo, Japan) applied over the spectral range, with an accuracy of ±0.1 nm. All spectra were recorded at room temperature.
With the assistance of the JEOL JAX-840A and JEOL Model 1230 (both from JEOL, Tokyo, Japan), transmittance electron micrographs (TEM) and scanning electron micrographs (SEM), respectively, were captured. In order to disperse individual particles over the mount setup and Copper grids, the samples were first dissolved in ethanol and then subjected to rapid ultrasonic processing.
A Delta Kevex device connected to an electron microscope, the JED-2200 Series (JEOL, Tokyo, Japan), was used to conduct the energy dispersive X-ray analysis (EDS). The following parameters were applied: a window width of 6 m, a 20 kV accelerating voltage, and a 120 s accumulation duration. The surface molar composition was determined using the Asa technique, Zaf-correction, and Gaussian approximation.
A vibrating sample magnetometer (VSM; 9600-1 LDJ, Lowell, MA, USA) was used to investigate the magnetic properties of the studied solids with a maximum applied field of 20 kOe.

3. Results

3.1. Structural Analysis

Figure 1 displays X-ray diffractograms of the S1 and S2 samples. The diffraction line profiles in this figure range from 2θ = 0° to 2θ = 80°. The lattice planes of the S1 solid in this figure are (100), (002), (101), (102), (110), (103), (200), (112), (201), (004), and (202). These planes can be observed at 2θ values of 31.78°, 34.44°, 36.27°, 47.56°, 56.61°, 62.88°, 66.37°, 67.96°, 69.71°, 72.96°, and 76.99°. These planes are consistent with the standard spectra of a hexagonal phase of wurtzite-type ZnO with the P63mc space group (PDF no. 5-664). Examination of this figure confirms the following: (i) The diffraction peaks of the S1 specimen are sharp with good crystallinity, and contain no additional peaks related to any another crystallized phase. (ii) The same diffraction peaks were identified in the XRD pattern of the S2 sample, prepared using the egg white-assisted combustion method for the fabrication of ZnO. Moreover, the biomimetic synthesis of ZnO using egg white resulted in a shift in all diffraction peaks and reduction in their height, along with an increase in their FWHM. (iii) We can determine some of the ZnO’s structural properties in the S1 and S2 specimens according to the XRD results. Table 1 shows the ZnO’s calculated lattice characteristics, which include the crystallite size (d), lattice constants (a, c, and c/a), unit cell volume (V), Atomic displacement to neighboring (μ), Zn-O bond length (L), dislocation density (δ), and stress (ε). Using egg white in the fabrication of ZnO led to an increase in its unit cell volume, dislocation density, and strain and lattice constants (c and a), with a subsequent decrease in the ratio between these constants (c/a). On the other hand, reductions in the values of the crystallite size, atom displacement and bond length of ZnO were enabled via the preparation with egg white.

3.2. FTIR Analysis

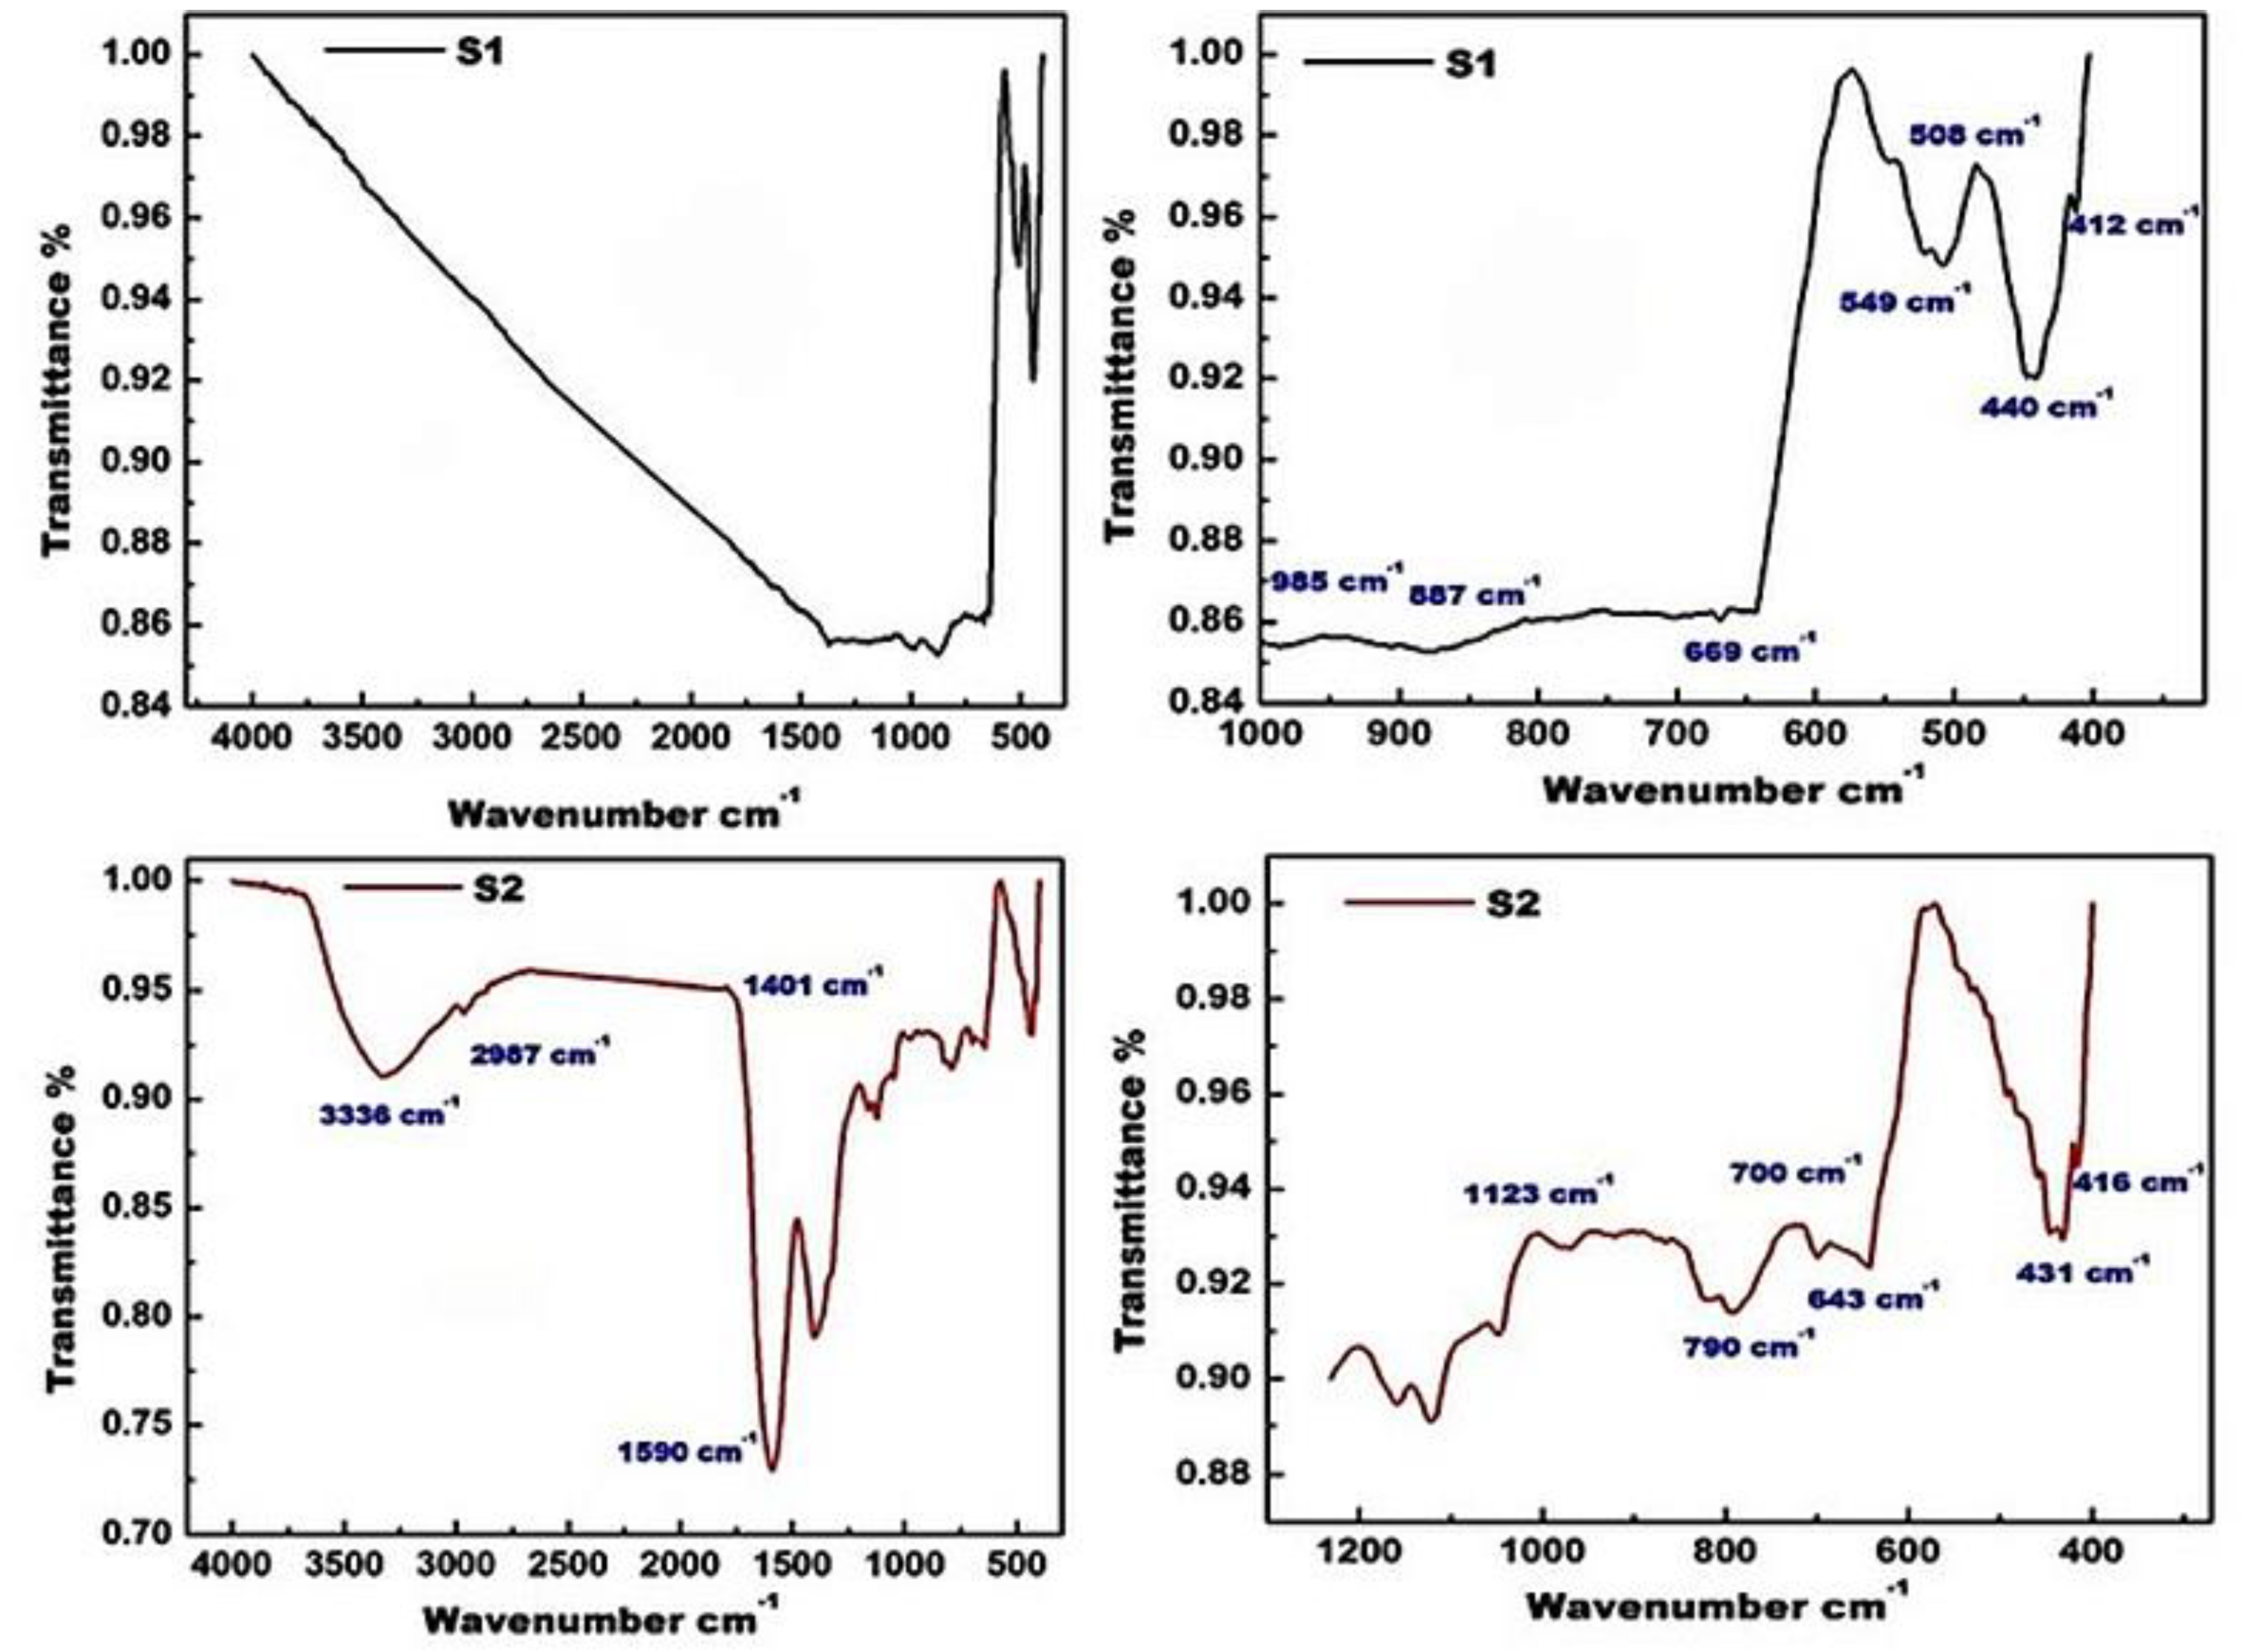
The synthesized systems of S1 (ZnO) and S2 (ZnO/C) were subjected to FTIR analysis in order to determine the various characteristic functional groups associated with their nanoparticles. As shown in the FTIR spectrum illustrated in Figure 2, the S1 specimen featured absorption bands in the range of 1000–400 cm−1, corresponding to the metal–oxygen vibration mode. Two significant basic absorption bands can be seen in this spectrum at 440 cm−1 and 508 cm−1, while two weaker bands are visible at 412 and 549 cm−1. These bands relate to the ZnO nanoparticles’ Zn–O stretching vibration mode [31]. In addition, the three weak bands located at 669, 887 and 985 cm−1 are attributable to the Zn–OH group [32,33,34]. The intensities of bands in the range of 549–412 cm−1 were reduced, with the appearance of additional bands in the range of 4000–1000 cm−1, after the formation of the ZnO/C system, as shown in the FTIR spectrum of S2 in Figure 2. This sample (S2) features absorption bands at 416, 431, 643, 700, 790, 1123, 1401, 1590, 2987 and 3336 cm−1. O–H bond stretching vibrations are indicated by a wide band at 3336 cm−1, which denotes the presence of moisture. The band at 1590 cm−1 could also be related to another common band attributed to the bending mode of absorbed water [28,35]. The typical bands at 416 and 431 cm−1 are related to the metal oxide stretching vibrations of Zn–O bonds, while the bands at 643, 700 and 790 cm−1 correspond to the Zn–OH group [30]. On the other hand, the bands at 1123, 1401, and 2987 cm−1 can be attributed to the various vibration modes of carbon groups. These bands are ascribed to the stretching vibration of C–O, C–OH and/or C–H bonds [28,36].

3.3. Raman Analysis

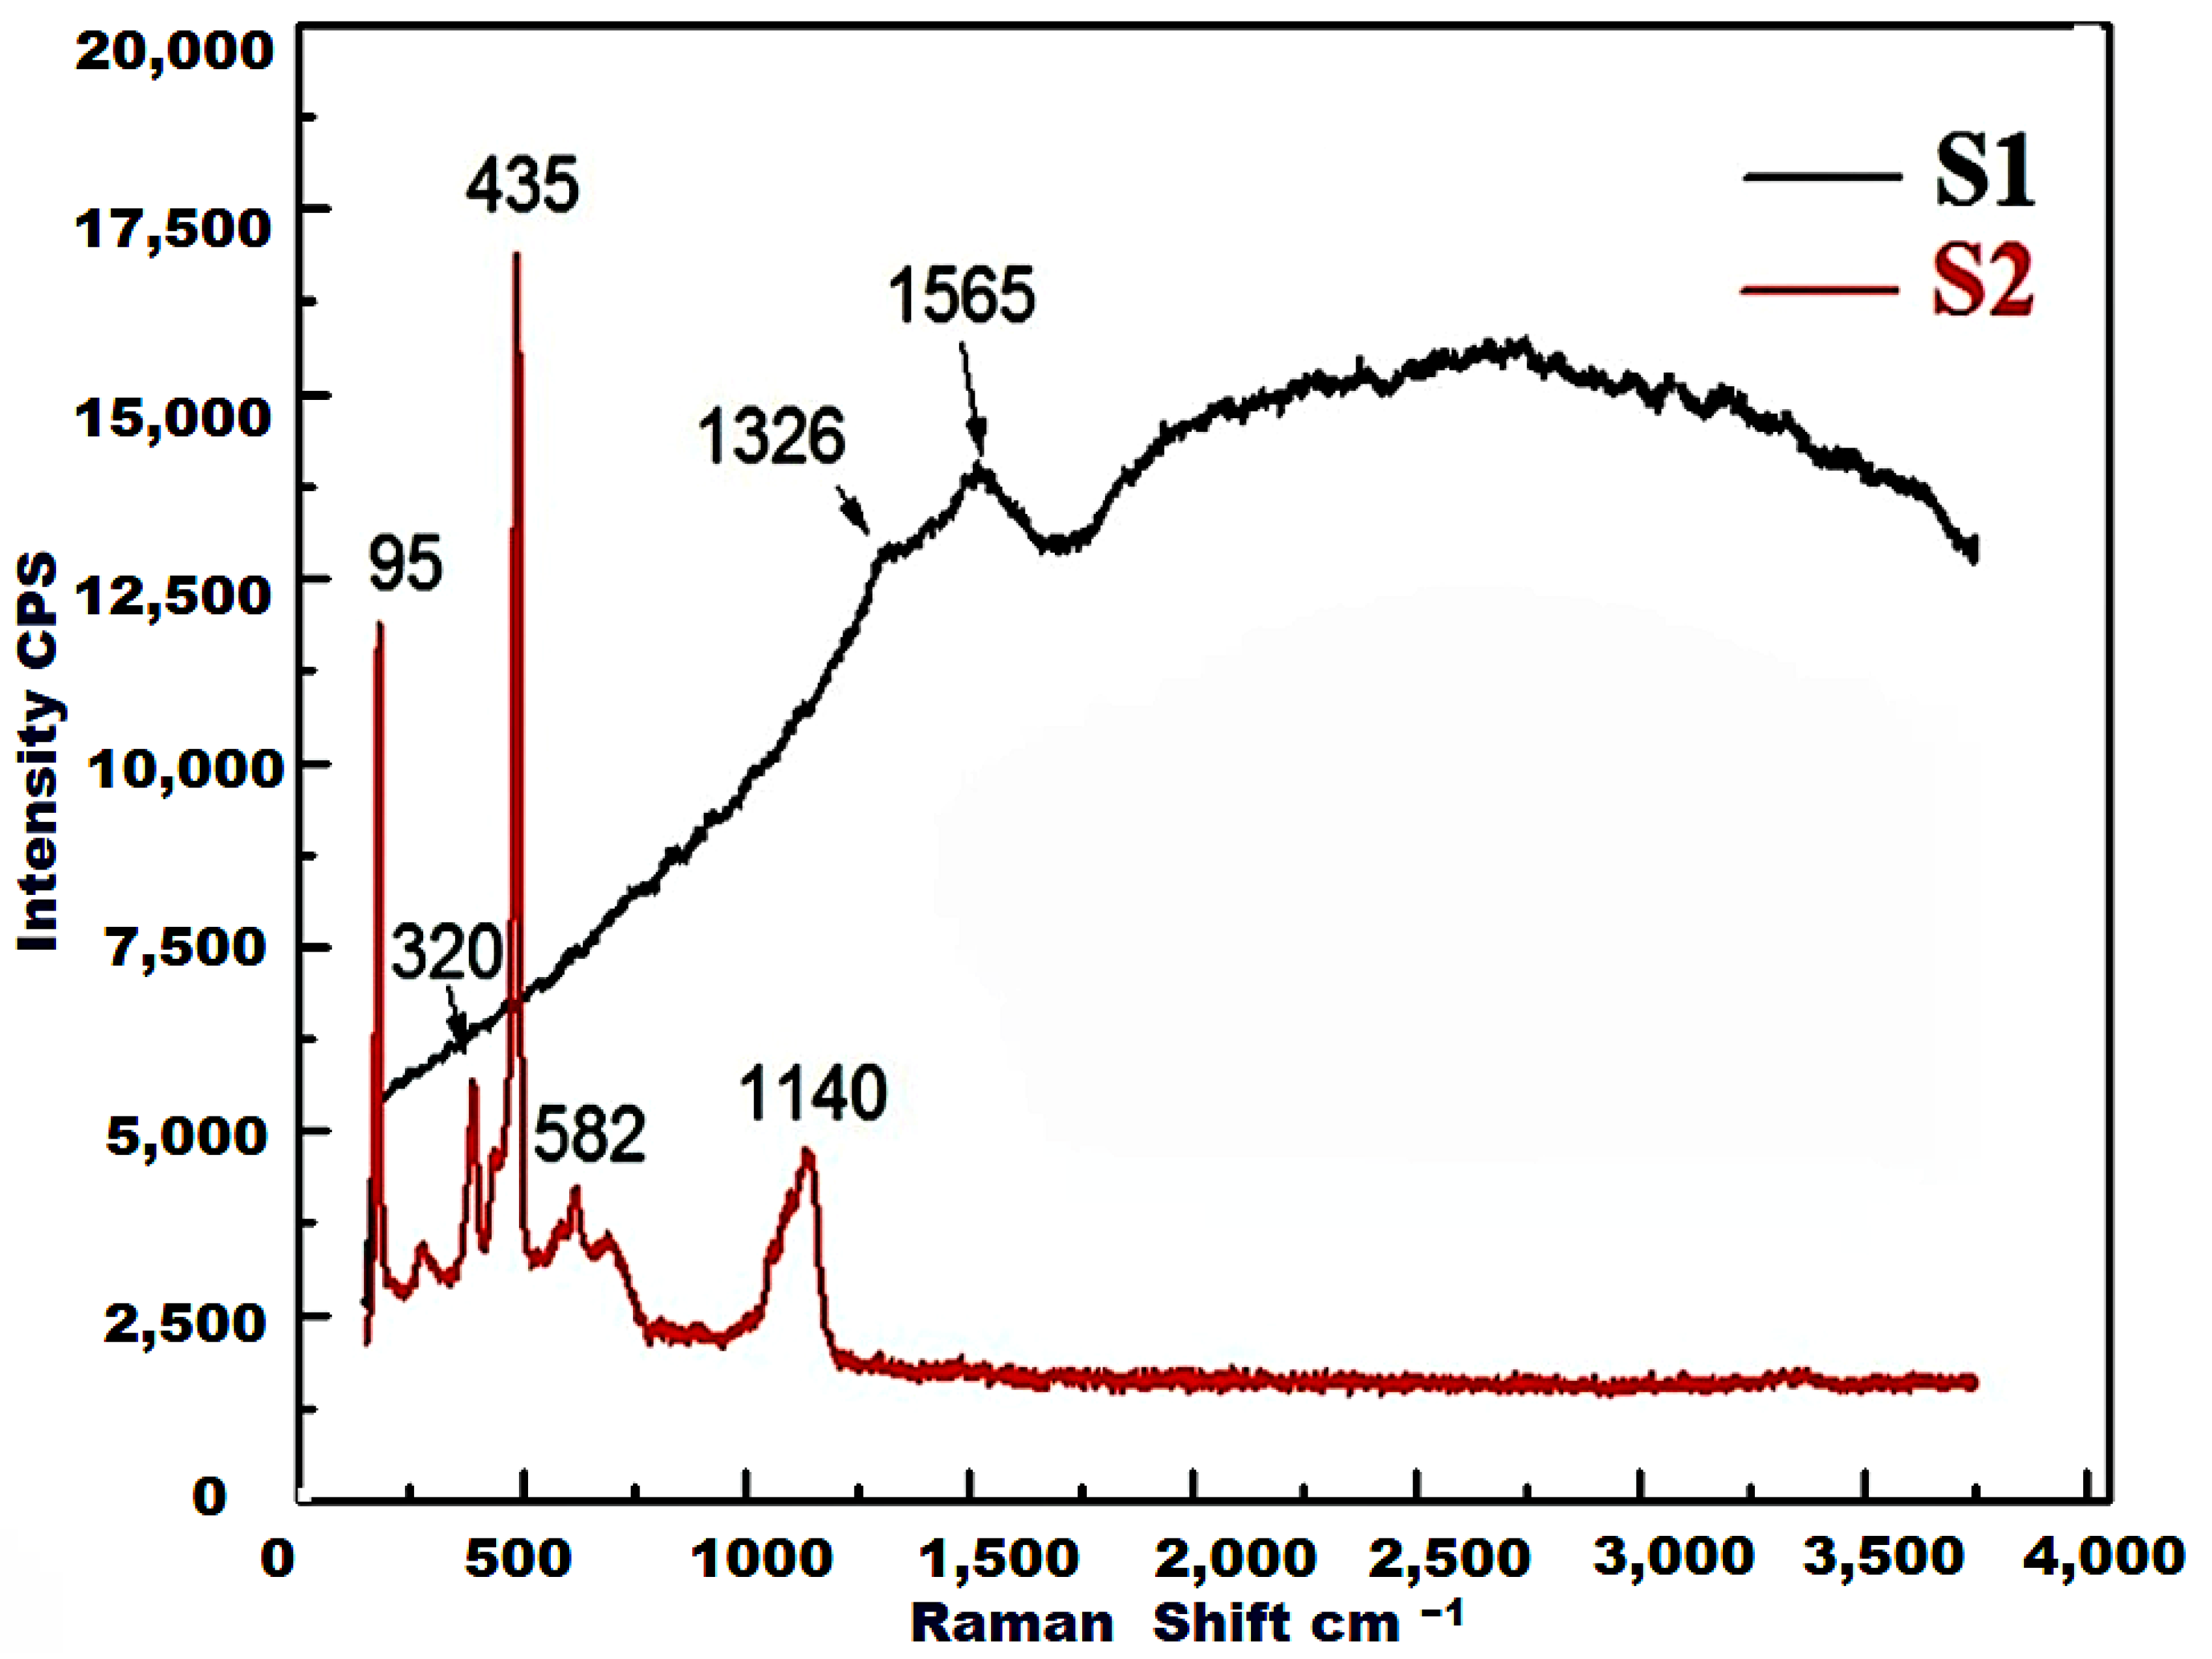
The vibrational characteristics of the S1 and S2 samples were studied using the Raman technique. Figure 3 shows the 50–4000 cm−1 Raman spectra of the investigated materials at room temperature. All vibrational modes characteristic of ZnO crystals may be seen in S1’s Raman spectra. The ZnO vibration mode is denoted by the formula A1 + 2B1+ E1 + 2E2 [37,38,39,40]. The first order Raman-active modes are A1, E1, and E2. E2 is a nonpolar mode, while A1 and E1 are polar modes. These relate to transverse-optical (TO) and longitudinal-optical (LO) modes. Under electrostatic forces, the polar phonons A1 and E1 exhibit frequencies characteristic of the transverse-optical (TO) mode. E2 is a non-polar phonon mode distinguishable into two frequencies: E2 (high), connected to oxygen atoms, and E2 (low), related to the Zn sub lattice. B1 is a quiet mode, which is both Raman- and infrared-inactive. As shown in Figure 3, the S1 spectra in their entirety comprised two more intense Raman peaks at 95 cm−1 and 435 cm−1 and seven low-intensity peaks at 150 cm−1, 320 cm−1, 405 cm−1, 582 cm−1, 664 cm−1, 1065 cm−1 and 1140 cm−1. The two prominent peaks at 95 cm−1 and 435 cm−1 can be assigned to the E2 (high) and E2 (low) Raman activity modes, respectively. These peaks are fundamentally characteristic of a wurtzite-type crystal structure [41]. In addition, the strong E2 (high) mode is an indication of good crystallinity [42]. Around 150 cm−1 is where the second-order phonon mode, designated 2E2 (low), first appears. The peak at 320 cm−1 is attributable to the second-order Raman spectrum produced by the hexagonal ZnO zone-boundary phonons “E2 (high)–E2 (low)”. The Zn and O atoms move parallel to the c axis in the ZnO hexagonal structure, manifesting an A1 (TO) phonon oxygen-dominated polar mode, which is responsible for the peak at 405 cm−1. The multi-phonon scattering modes emerge at 582 and 1065 cm−1, which are assigned to the modes E1(TO) + E2(low) and A1(TO) + E1(TO) + E2(low), respectively. Additionally, the results of the acoustic combination of A1 and E2 can be observed around 1140 cm−1 [43].
On the other hand, no peaks indicating a ZnO crystal could be observed in the Raman spectrum of the S2 sample. The Raman spectrum of this sample consists exclusively of two broad peaks at 1565 cm−1 and 1326 cm−1, corresponding to the G- and D-bands, respectively, which are characteristic of typical carbon materials [44]. The G-band at 1565 cm−1 is a fundamental characteristic of sp2-hybridized carbon materials. This band contains information on the in-plane vibration of sp2-bonded carbon domains [45]. Conversely, the D-band, which appears at 1326 cm−1, suggests the existence of sp3 defects or disorders inside the hexagonal graphitic structure [46]. Additionally, edges that violate the symmetry and selection rule, a hexagonal graphitic structure, and amorphous carbon can be linked to this band [47]. In line with the Ferrari and Robertson model, the size of the crystallite, which is less than 2 nm in the case of amorphous carbon, is reflected in the ratio (ID/IG) between the intensities of these bands [48]. In this investigation, a low value of the former ratio indicates that non-crystallized carbon was formed in the S2 sample.

3.4. Morphology Study

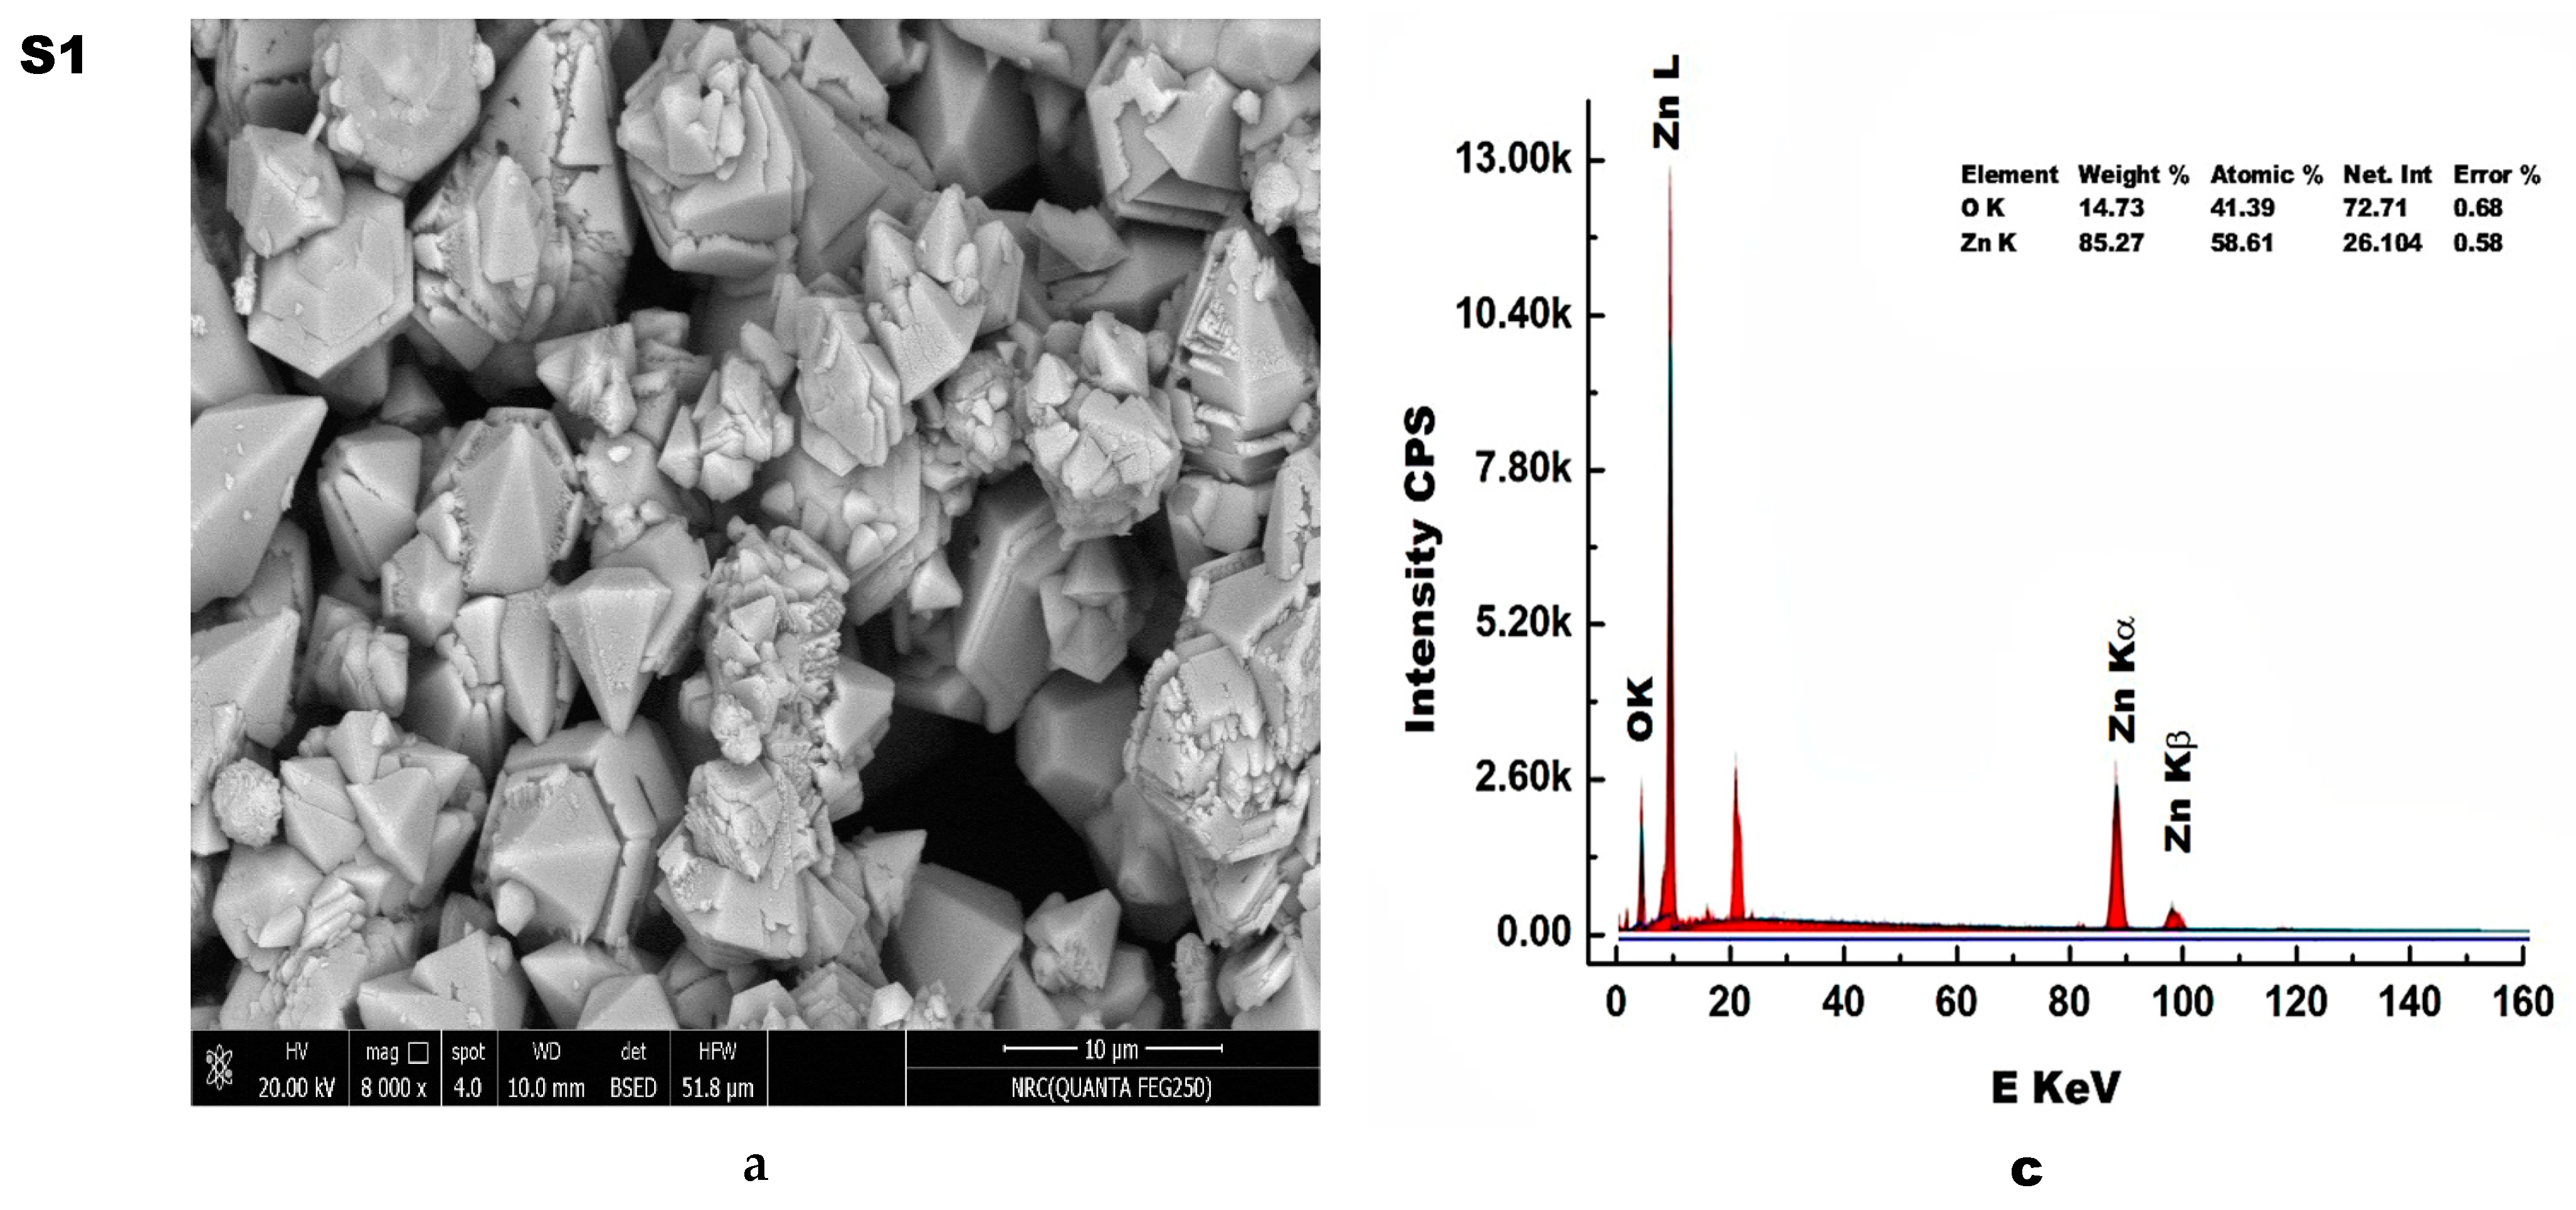
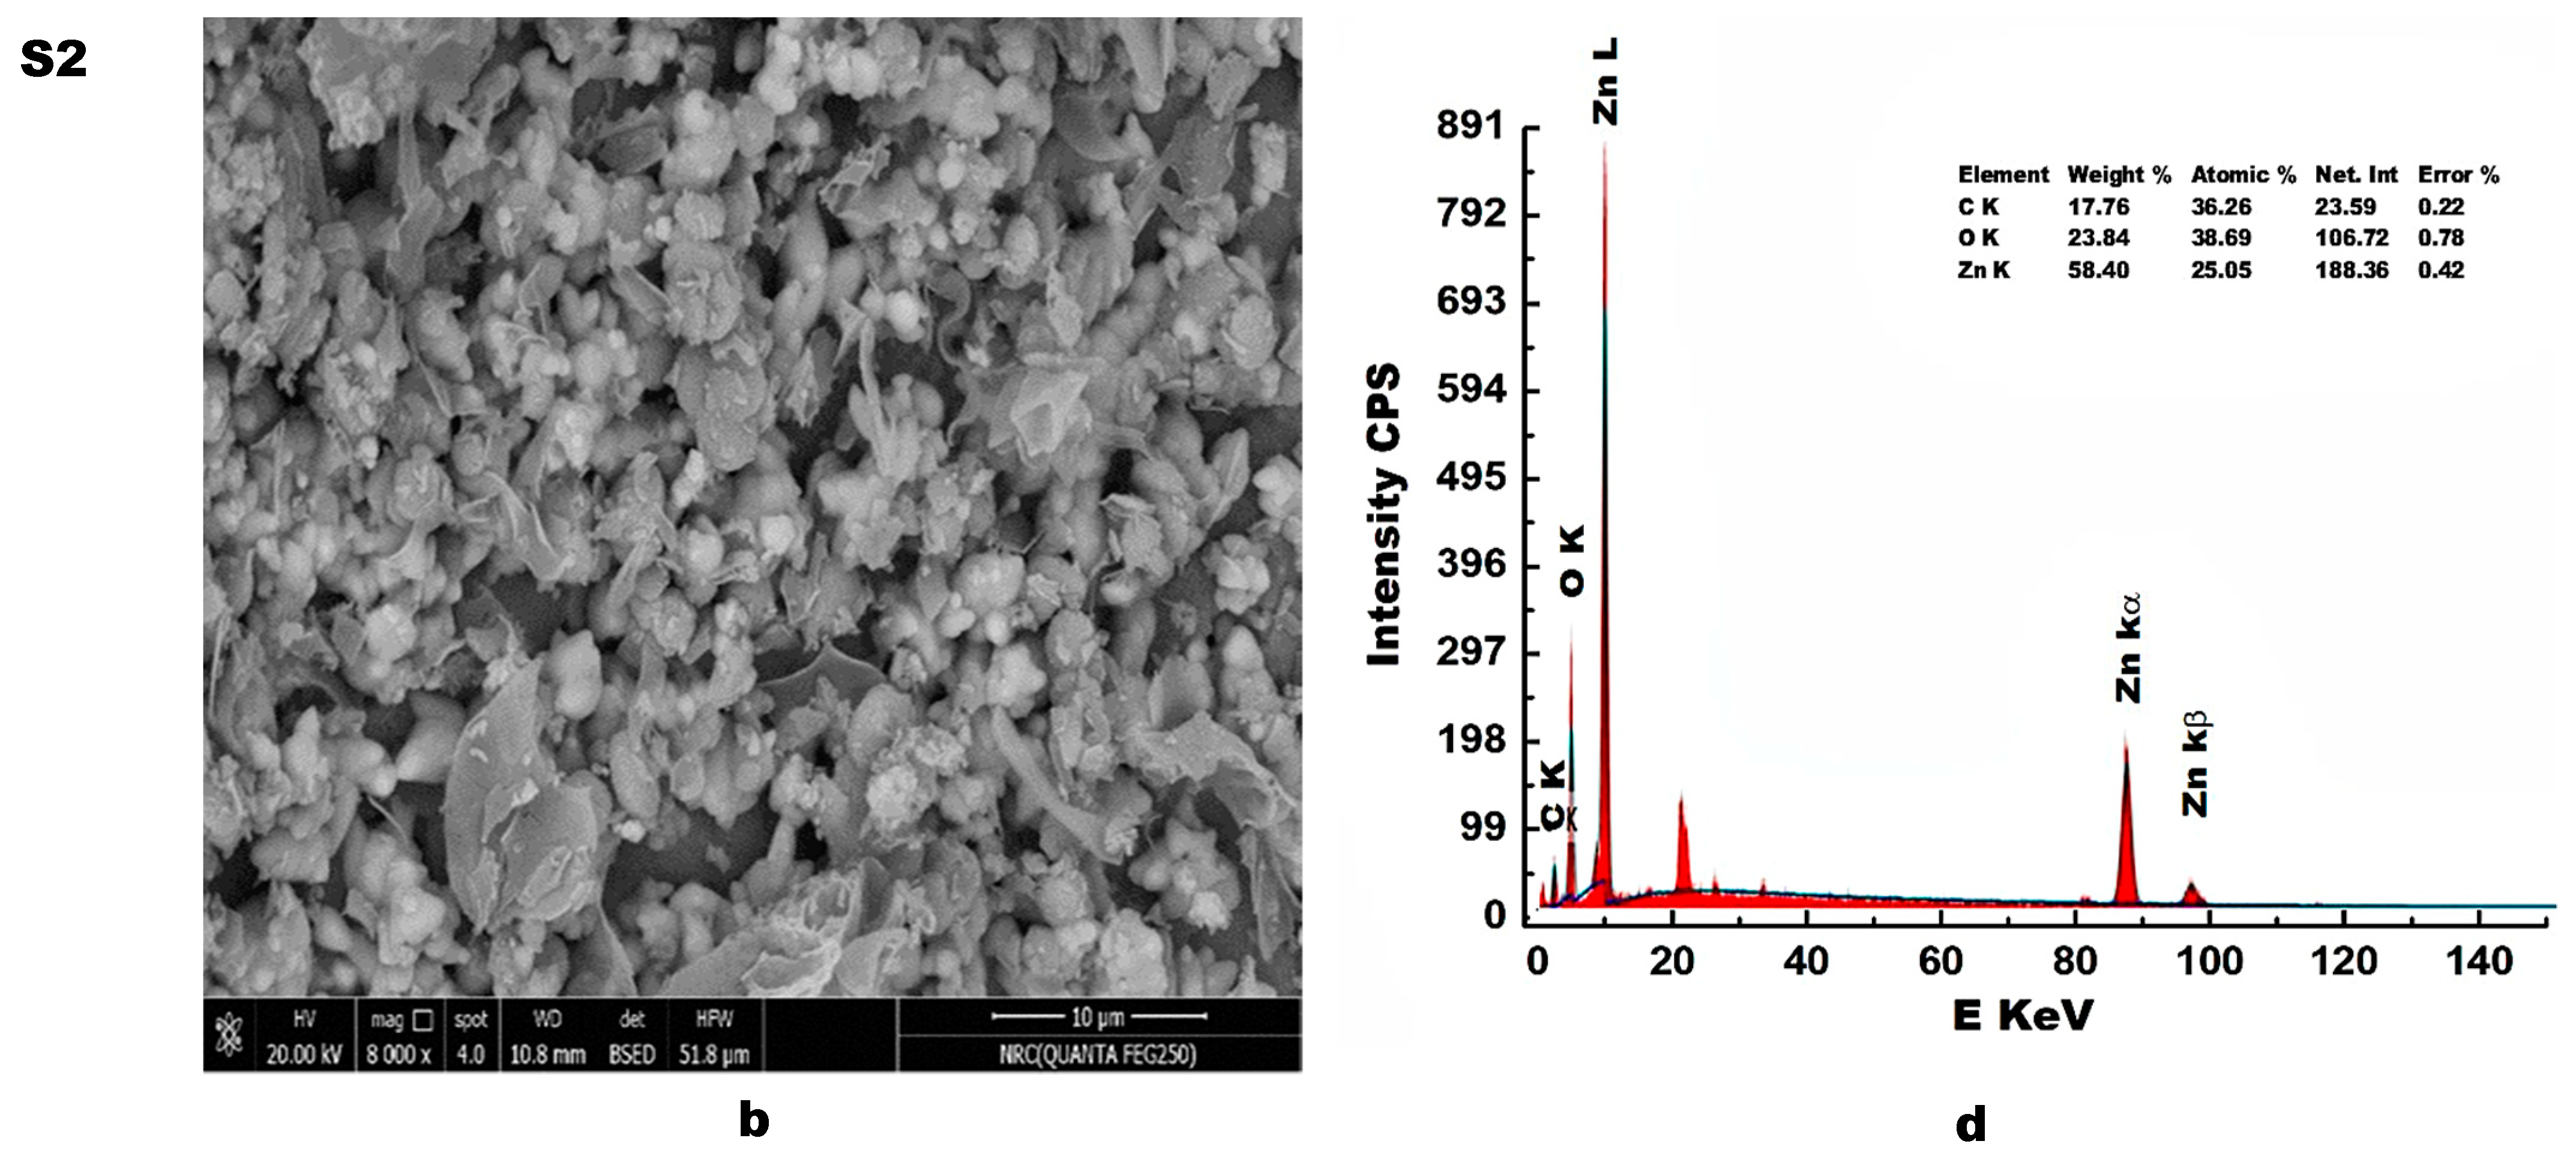
The surface morphologies of samples S1 and S2 were revealed using the SEM and TEM techniques. Figure 4a,b show the SEM and Figure 4c,d show the EDS results of S1 and S2. It is clear from this figures that S1 has a hexagonal cone-shaped morphology with roughness characteristics on the surface of its particles. These cones with hexagonal cross-sections are one of the characteristic forms of ZnO crystals. Some hexagonal cone-shaped ZnO particles are developed with peaked or sharpened tips, while others form tips with cramped hexagonal shapes. ZnO particles permeate into a lot of the cavities and a lot of the pits resulting from the shattering of some of the particles. The shape of sample S2 was condensed to produce irregular nanoflakes and numerous ellipsoidal ZnO particles with tapered tips, as shown in Figure 4b. It is also evident that the particle was not a fully symmetrical ellipsoid; rather, one end of the particle was slightly sharper than the opposite end, with connections to other particles yielding some agglomerations. The authors believe that the flakes were composed entirely of carbon and some spherical ZnO particles. Thus, we can assume that the carbon acted as a cross-linking agent that held the ZnO nanoparticles together.
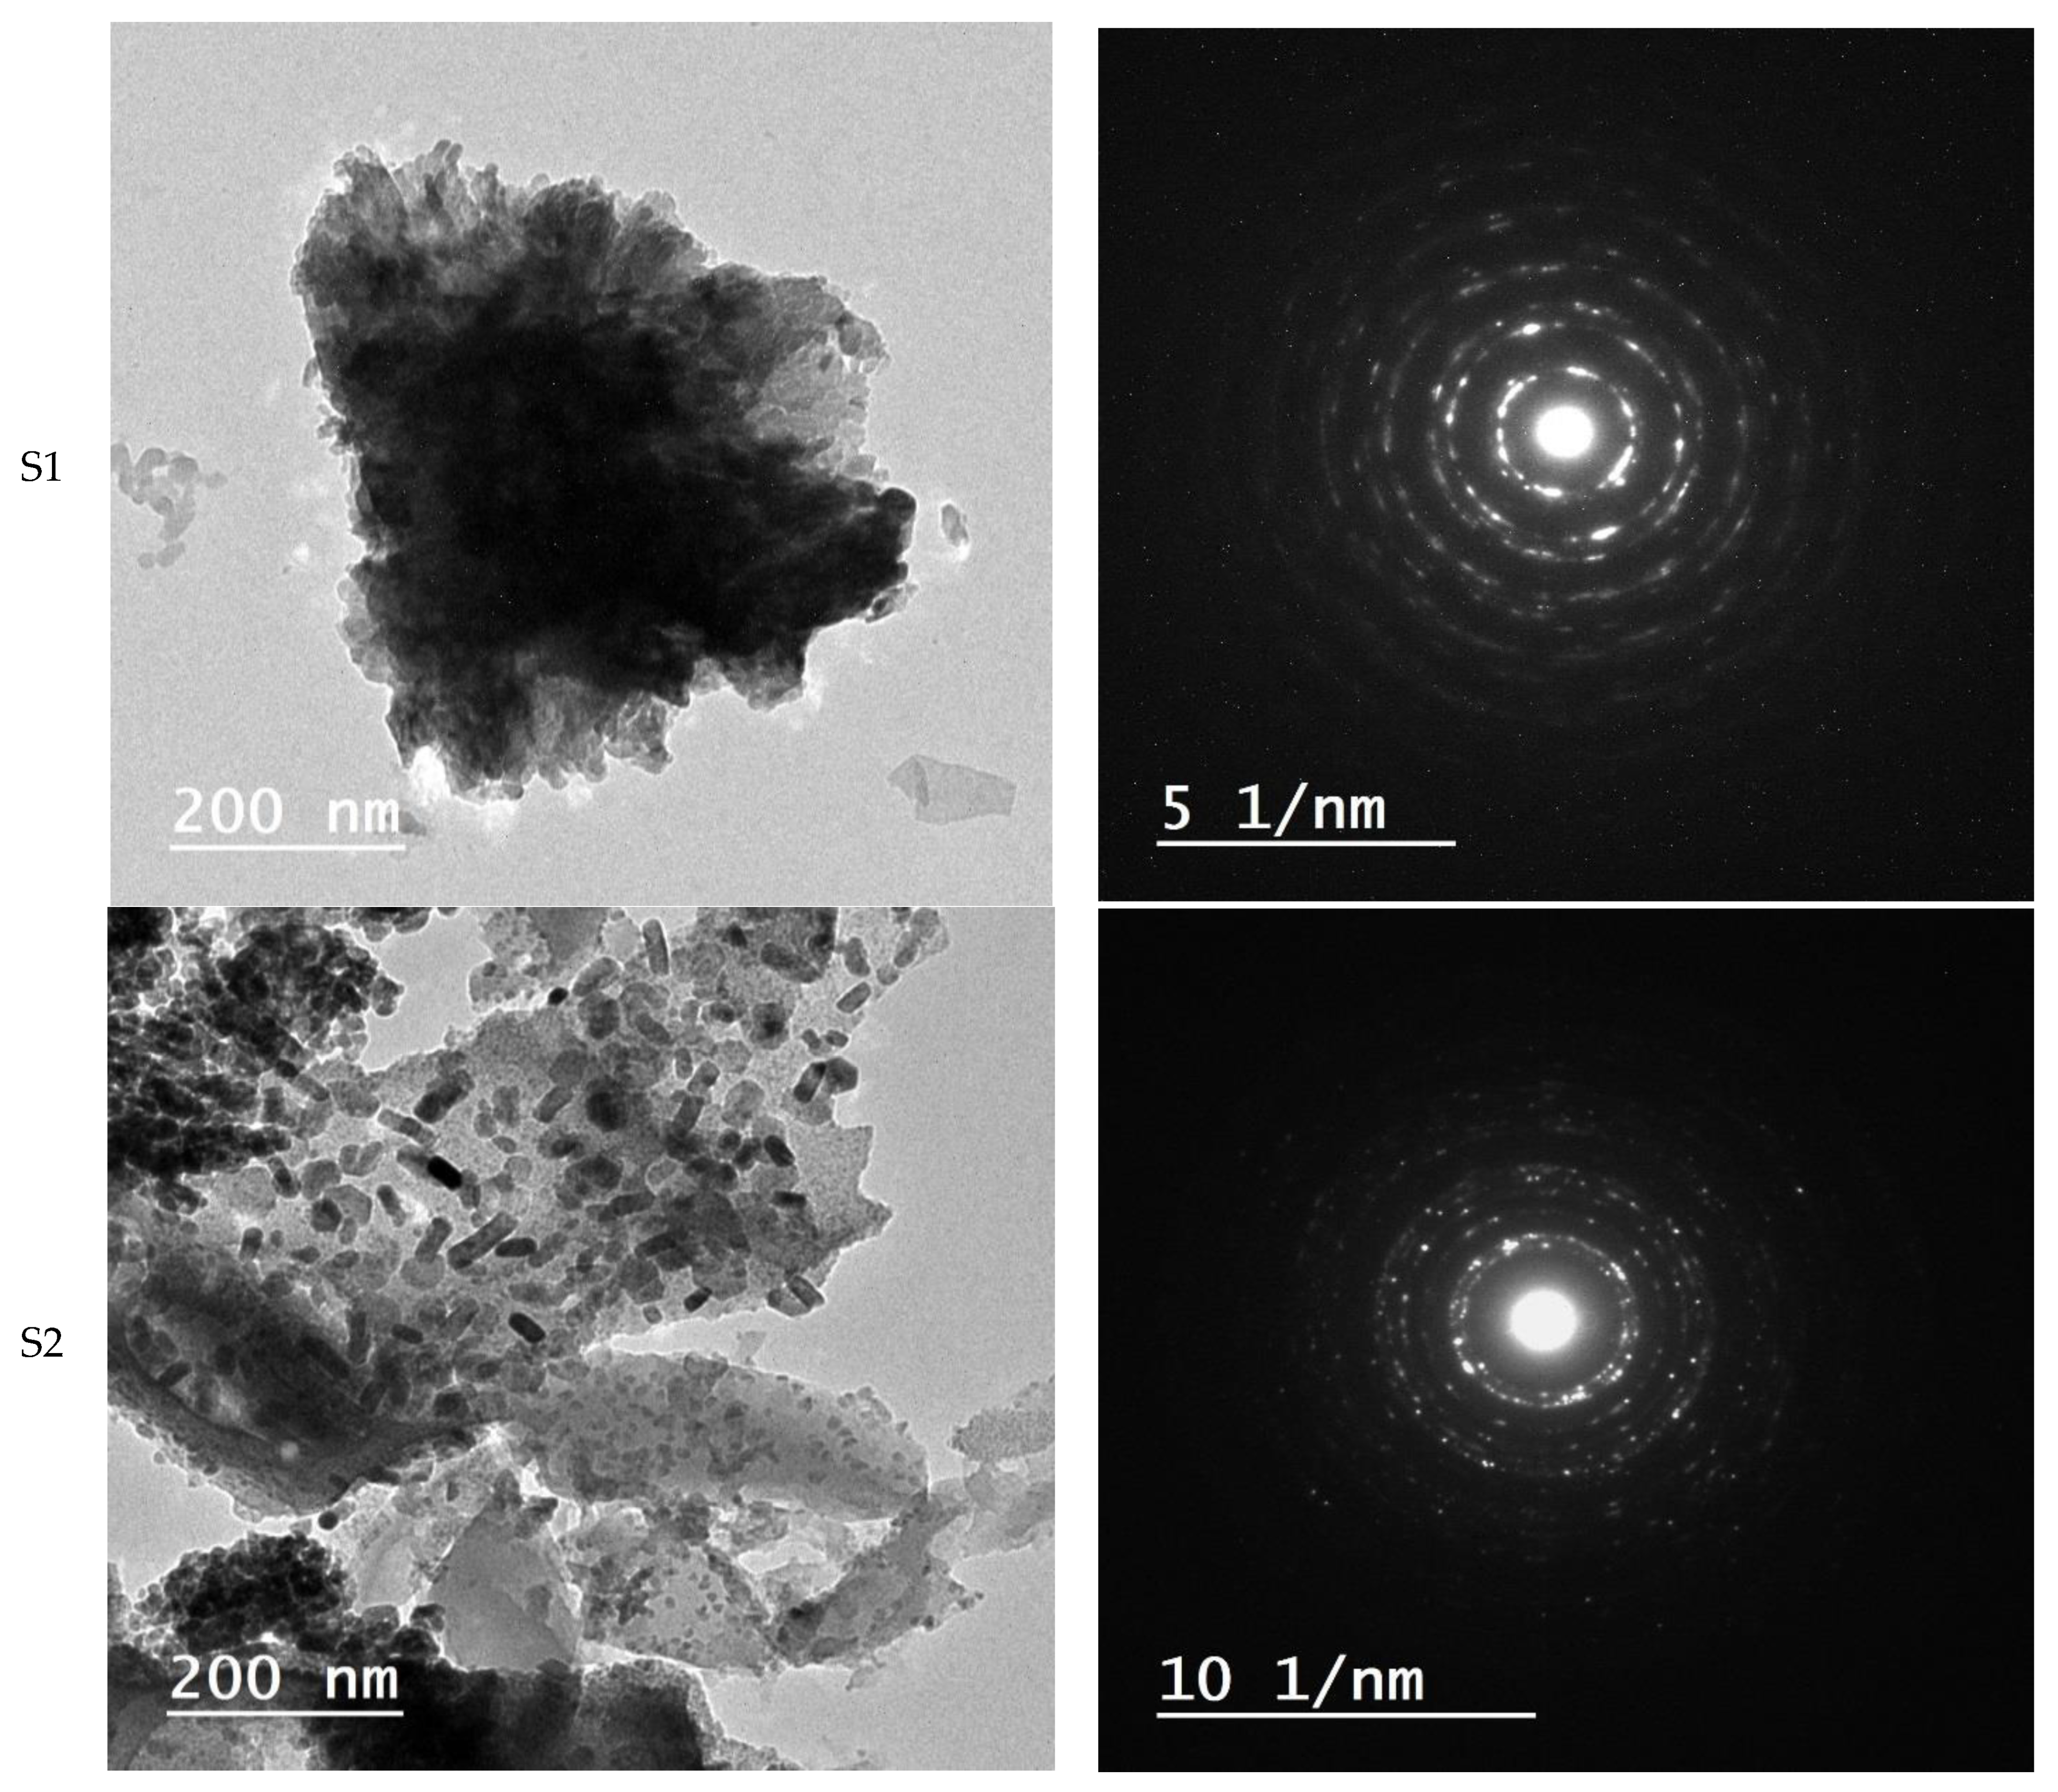
Confirmation of the morphological features of S1 and S2 and their evolution as observed in the SEM study was obtained via TEM studies that yielded further information, as shown in Figure 5. This figure contains TEM images, selected area electron diffraction (SAED) data and histograms of the crystallite size statistical distribution (HCSD) of the manufactured samples. The TEM image of sample S1 do not show the formation of hexagonal cone-shaped ZnO particles and their transformation into ellipsoidal structures. However, the TEM image coheres with the SEM image and confirms the existence of some agglomerations in the S1 sample, which contained ZnO only. The TEM image of S1 shows the formation of particles with blob shapes, with small sizes and uniformity. On the other hand, the TEM and SEM images agree in showing that the S2 sample contains crystallized ZnO nanoparticles dispersed in a carbon matrix. The obvious edge in the TEM image of the S2 sample indicates that the carbonaceous material present in the composite (ZnO/C) took a layered form. It can be seen that the ZnO/C nanocomposite is better dispersed as a result of the reduction in the agglomeration formation rate of ZnO due to presence of a carbon-based wide carrier [49]. The interaction between ZnO and the carbonaceous material could be ascribed to the existence of epoxide and hydroxide groups on the carbon surface, yielding activated reaction sites [50]. In addition, the particles of this composite take different shapes, including spherical and ellipsoidal grains, with the presence of some rods. These findings confirm that the environmentally friendly egg white-mediated synthesis of ZnO results in a hybridization structure with nanosized particles.
In order to confirm that the preparation method used in this study led to a reduction in the particle size of the prepared materials, HCSDs had to be constructed, as shown in Figure 5. The HCSDs indicate a decrease in the average particle size, from nm to nm scale, when moving from S1 to S2. In addition, the SAED images in Figure 5 show rings containing different spots, confirming the formation of polycrystalline crystals of different sizes. The total circumference of the different spots in the S1 sample is greater than that in the S2 sample, as a result of its larger grain size. In other words, the SAED of S1 shows elongated spots compared with the S2 sample.

3.5. Elemental Analysis

Chemical characterization/elemental analysis of S1 and S2 was performed using the EDS technique. The EDS patterns of the synthesized samples are shown in Figure 4. Indeed, the FTIR results confirm that the S2 sample contained a small amount of carbonaceous material, and this material was absent from the S1 sample. This fact is reaffirmed via EDS analysis, which shed more light on the topography of the S1 and S2 samples. The EDS patterns confirm that the S1 sample consisted entirely of both Zn (85.27 wt.%) and O (14.73 wt.%), thus yielding the highest-purity ZnO NPs. This finding is consistent with the results of XRD and FTIR, which display the successful fabrication of a ZnO lattice in a single phase form. In addition, the different peaks at 1 keV, 8.6 keV, and 9.6 keV are ascribed to the Zn atom, and that observed at 0.5 keV belongs to the O atom. Moreover, the EDS study confirmed the existence of Au, resulting from using gold coating to achieve better SEM images. On the other hand, the EDS pattern of S2 proves the presence of Zn (58.4 wt.%), O (23.84 wt.%) and C (17.76 wt.%), yielding a ZnO/C nanocomposite. This is in good agreement with the FTIR results, which confirm the successful formation of a ZnO/C system.

3.6. Optical Properties

It was found that there was a big difference in the colors of the S1 and S2 materials, as can be seen in Figure 6a. This difference gives a clear indication of the different light absorption properties of these materials. As such, the optical band gap properties of the S1 and S2 samples have been studied using UV–VIS spectroscopy. Figure 6b shows the UV–VIS spectra for the S1 and S2 samples. According to this figure, the diffused reflectance values of these samples show the same trends of increase and decrease with increases in wavelength. It is observed that the absorption edge of the S2 material is shifted to the right compared to the S1 material. This shift towards the higher-energy wavelength of light implies band gap narrowing in the S2 sample, as confirmed in the analysis of the spectroscopic data using Tauc plots, shown in Figure 6c. The optical band gap energy Eg of the prepared materials was estimated using the Tauc equation [51].
(αhυ)n = A (hυ − Eg)
where n is either 2 for direct transition or 1/2 for indirect transition, depending on the nature of the possible electronic transitions; α is the absorption coefficient; A is the proportionality constant, which depends on the nature of the material; h is the Planck’s constant, and υ represents the frequency of the incident photon. In the Tauc equation, plotting (α hυ)2 against the photon energy (hυ) of the investigated sample yields a specific curve; the intersection of the extrapolated linear portion of this curve with the (hυ) axis indicates the value of the optical band gap. The band gap energies of S1 and S2 are 3.09 and 2.60 eV, respectively. S2 showed a smaller band gap compared to S1 due to the presence of carbon.

3.7. Magnetic Properties

The magnetic properties of the S1 and S2 samples were determined at room temperature via the application of a magnetic field around the value of ±20 kG. These measurements allowed us to obtain a hysteresis loop, through which we were able to obtain the different values of most of the magnetic properties. The hysteresis loops reveal the values of the coercive field (Hc), remanent magnetization (Mr), saturation magnetization (Ms) and squareness (Mr/Ms) of S2. The values of these parameters have enabled us to calculate both the anisotropy constant (Ka) and the magnetic moment (μm) per unit formula in Bohr magnetrons of the sample studied. Ka and μm can be calculated according to the following expression [28]:
μm = MwMs/5588
Ka = HcMs/0.96
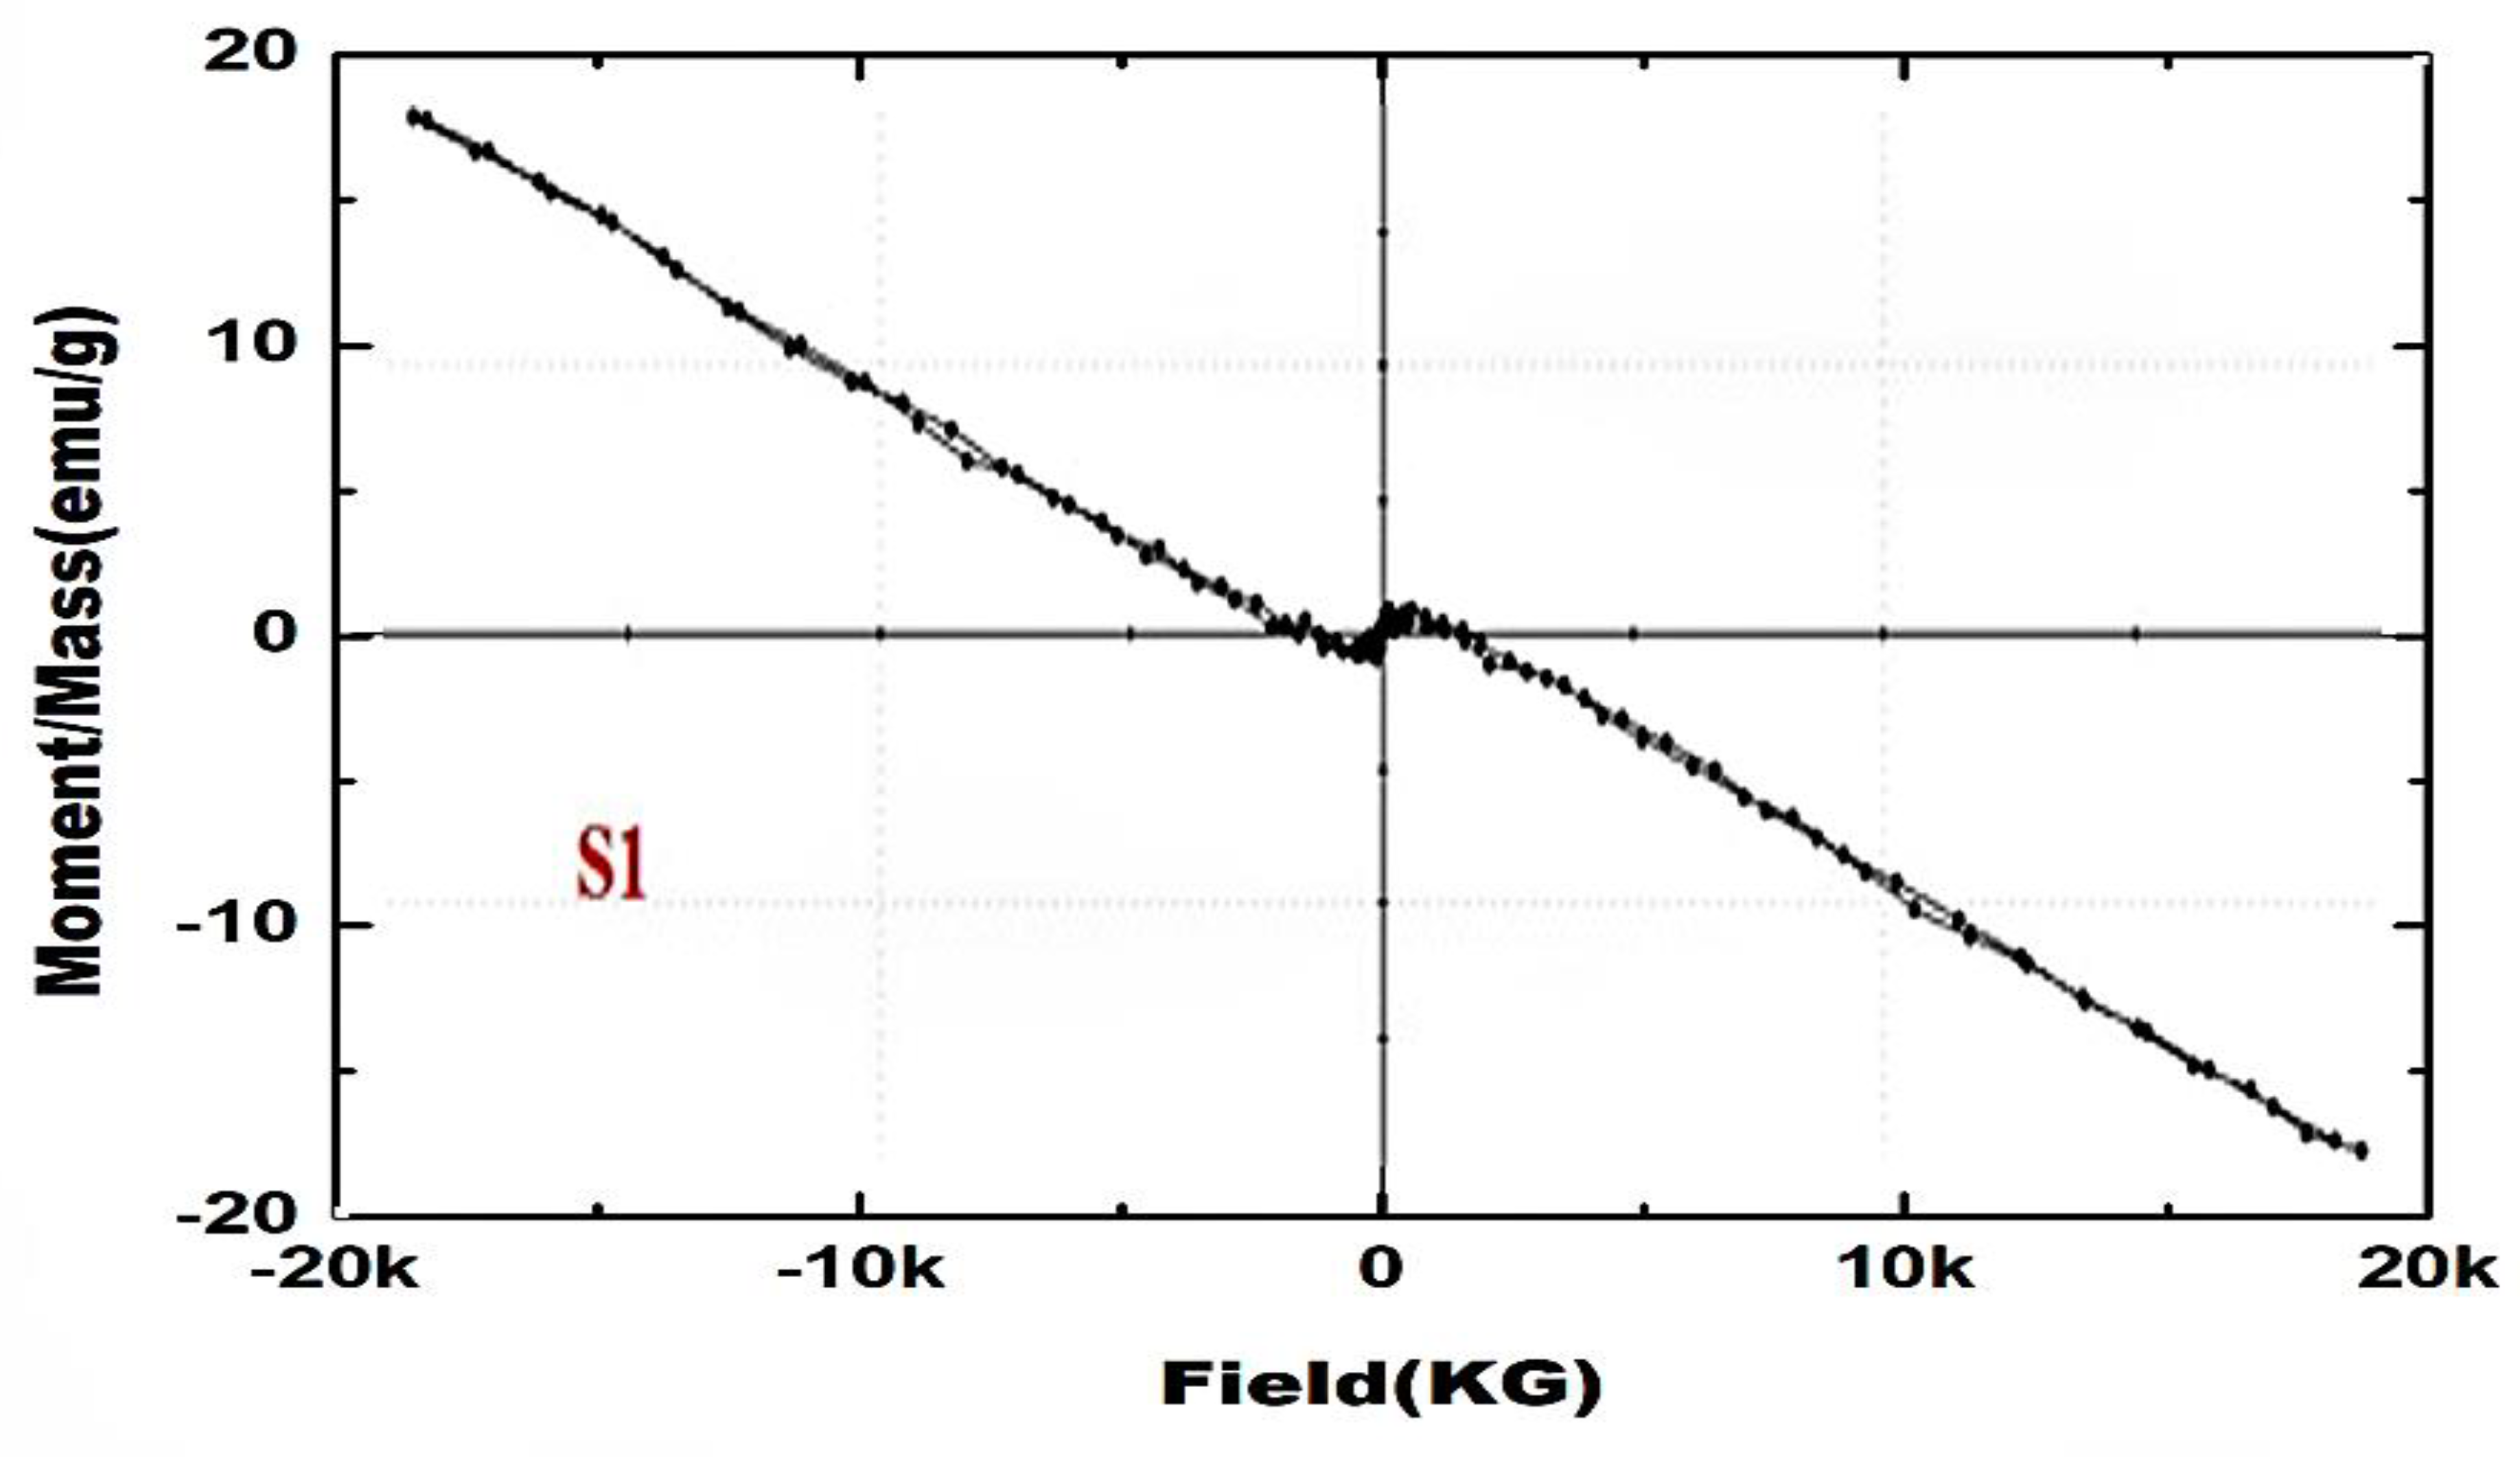
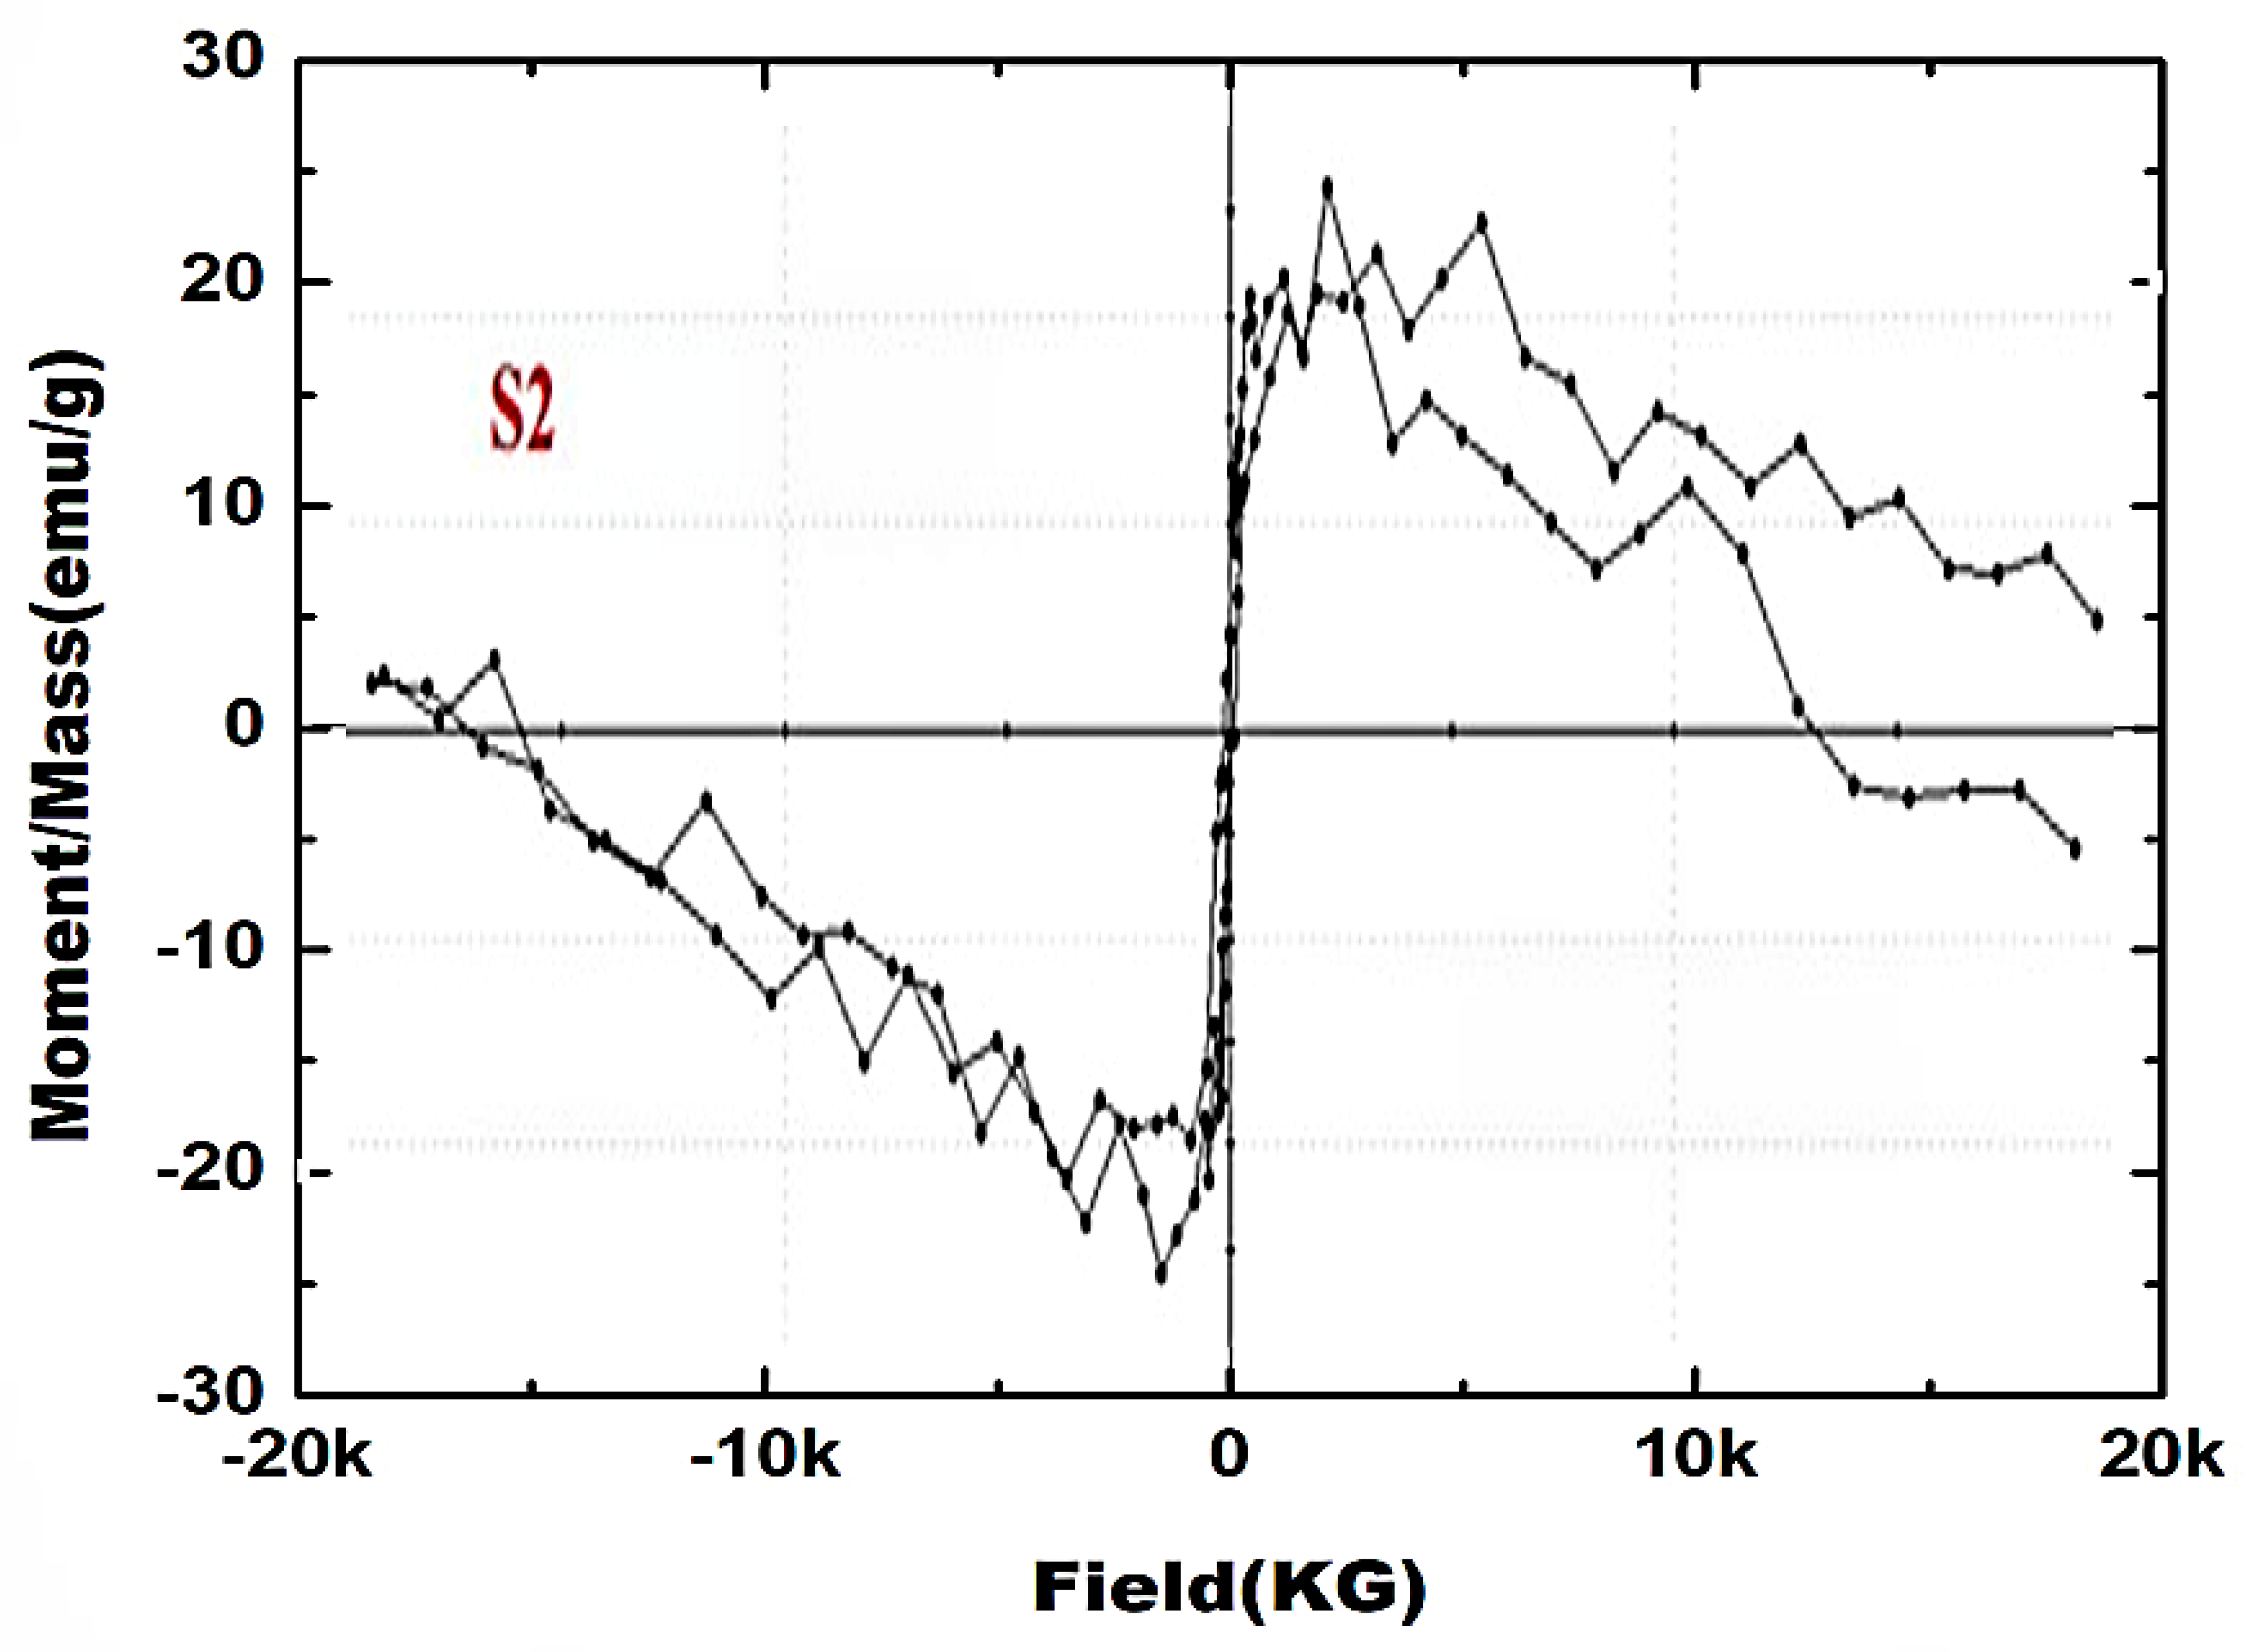
where Mw is the molecular weight of the investigated material. The hysteresis loop is illustrated in Figure 7, and all the values of the resulting magnetic factors of the S2 sample are shown in Table 2. As can be seen from Figure 7, pure ZnO (S1) exhibits intrinsic diamagnetism (DM). Interestingly, S2 shows a partially S-shaped hysteresis loop, which clearly indicates the presence of a small signature related to room-temperature ferromagnetism (RTFM). In this study, the transition from DM to RTFM behavior could be attributed the effects of the preparation method employed, which led to the presence of some carbon atoms in the ZnO.

4. Discussion

Pure ZnO with a high degree of crystallinity (S1) was obtained through the direct heating of zinc nitrate at 300 °C for 15 min. ZnO with a moderate degree of crystallinity (S2) was obtained through the direct heating of a mixture of zinc nitrate and 5 mL of egg whites for 15 min. Note that a displacement occurred in the diffraction peaks of ZnO in the S2 sample, with a decrease in their height and an increase in their width. These observations confirm that the S2 specimen originally consisted of ZnO and a significant proportion of highly disordered material in the form of amorphous carbon, yielding the fabrication of a ZnO/C nanocomposite. Amorphous carbon is a product of the combustion taking place in the egg white-assisted combustion method of ZnO synthesis. The details of the (100) and (002) planes of ZnO shown in Figure 1 clearly show that the full width at half maximum (FWHM) increased, with a shift in their positions toward lower angles, when using egg white in the preparation process. In addition, the crystallite sizes of ZnO were 71 and 19 nm in the S1 and S2 specimens, respectively, indicating the effective incorporation of some carbon into the ZnO crystal. One cannot ignore the deposition of the remaining carbon on the ZnO’s surface, forming a Zn/C system.
With reference to Table 1, some points can help explain the formation of a solid solution between the constituents of the ZnO/C nanocomposite, such as the following: (i) The lattice constants of ZnO were a = 0.32578 nm and c = 0.52153 nm; their ratio (c/a) ~1.6001 was near to the typical value for a hexagonal cell (c/a = 1.6020). This confirms that the ZnO phase synthesized in the ZnO/C nanocomposite had a hexagonal wurtzite structure. (ii) The value of c/a in the S2 sample was lower than that of the S1 sample, indicating the incorporation of some carbon in the ZnO crystal present in the ZnO/C nanocomposite. (iii) The value of parameter “μ” is inversely proportional to the value of “c/a”, in order to maintain the hexagonal dimensions related to angle distortion. As such, the value of μ of S2 increased with the decrease in c/a ratio, as shown in Table 1. Moreover, the observed decrease in the bond length of Zn–O confirms the dissolution of C in the lattice of ZnO. These observations confirm the incorporation of C into the lattice of ZnO, yielding a solid solution-like ZnO/C composite [28,29]. (iv) It is assumed that the incorporation of carbon into a ZnO crystal causes its contraction, with a subsequent increase in the unit cell volume related to the small ionic radii of carbon in relation to zinc. However, the results recorded in Table 1 indicate that the unit cell volume of ZnO increased, as it contained carbon. This increase in the value of “V” could be attributed to an increase in the strain, dislocation density and atom displacement, as shown in the case of the S2 sample.
Qualitative chemical analysis of the S1 and S2 materials using FTIR indicated the presence of typical absorption bands of ZnO in the range of 1000–400 cm−1, which relate to metal oxide stretching vibrations of the Zn–O bond. The egg white-assisted green synthesis of ZnO results in additional bands in the range of 4000–1000 cm−1, related to the various vibration modes of different groups, such as C–O, OH and C–H. However, a progressive drop in the intense metal–oxygen (ZnO stretching vibrations) vibration mode was observed, as shown in the FTIR spectra of the S2 sample. It is interesting to note that the intensity of the bands associated with the Zn–OH groups around 700 cm−1 and 800 cm−1 increased significantly for the ZnO/C nanocomposite. The absorption bands at 3336, 1590, 1401 and 1123 cm−1, related to C–O, OH and C–H groups, were broad. These results indicate that the anchoring of ZnO to a carbon material through these groups could be preferential, causing a subsequent decrease in the particle size of this composite. This demonstrates the low degree of crystallinity of the ZnO nanoparticles, consistent with the measured X-ray diffraction pattern.
The S1 sample displays conclusively diamagnetic behavior. On the other hand, the ferromagnetism in S2 could be interpreted as competing with the diamagnetic behavior of this sample. The preparation of ZnO using the egg white (5 mL)-assisted combustion method resulted in the formation of a weakly ferromagnetic ZnO/C system with a non-saturating behavior up to 15 kOe. This finding confirms that the current preparation method overcomes the diamagnetic nature of solid ZnO. In other words, the magnetic properties of the ZnO/C system undergo a magnetic phase transition from diamagnetism to ferromagnetism.
The S1 sample contained solidly crystalline ZnO nanoparticles with a number of intrinsic defects, which are diamagnetic at room temperature. On the contrary, S2, including a moderate amount of crystalline ZnO and amorphous carbon, exhibited RT ferromagnetism related to the minimal intrinsic defects of ZnO.
Previous research has shown that doping, precursors, and the method of synthesis all affect a material’s stoichiometry [52]. These elements alter the produced material’s flaw profile, and consequently its properties. Therefore, the imperfections created by adjusting the preparation technique are linked to the presence of non-stoichiometry in the compound, which results in the production of structural imperfections. The structural defects of ZnO arise in the form of anionic and cationic interstitials and vacancies, i.e., Zn interstitials, O interstitials, Zn vacancies and O vacancies [53]. In the present work, the incorporation of C at O sites in the ZnO host lattice led to room temperature ferromagnetism, as observed in the S2 sample. RTFM in the S2 sample was clearly observed as a result of the inclusion of carbon into the ZnO matrix. Thus, the initial increase in the magnetization of the examined S2 specimen containing a small amount of carbon is quite consistent with the results in the literature [52,53,54]. Pan et al. [54] previously proposed the RTFM process in the ZnO/C system. Strong interactions between the s and p orbitals of carbon and the s orbital of zinc cause the carbon atoms to split into two 2p orbitals close to the Fermi energy level, which is the main source of the magnetic moment. As a result of replacing oxygen with carbon in some locations, the localized 2p of the carbon spins become associated with the holes in O 2p states. The ZnO–C system displays ferromagnetism as a result of this p–p interaction.
Finally, the distinct difference between the absorption characteristics of the S1 and S2 samples indicates that some C atoms are successfully incorporated into ZnO nano particles. Indeed, the incorporation of nonmetals, such as carbon, into ZnO results in the formation of intermediate energy levels between the band gap, enabling it to absorb visible light [55,56,57].

5. Conclusions

In this manuscript, a ZnO/C nanocomposite was manufactured via the egg white-mediated combustion method. The structural, morphological, and magnetic properties can be summarized as follows:
  • The use or exclusion of egg white led to the self-combustion-based fabrication of ZnO or ZnO/C, respectively. The resulting zinc oxide had a wurtzite-type hexagonal structure;
  • Using the egg white-assisted self-combustion method led to a decrease in the crystallite size and bond length of the ZnO crystal. The increase in the unit cell volume of ZnO was due to the increase in dislocation density and strain;
  • The FTIR spectra confirm the formation of ZnO, based on the presence of typical absorption bands of ZnO in the range of 1000–400 cm−1, and in particular, the existence of fundamental absorption bands at 440 cm−1 and 508 cm−1. The intensity of these bands decreased in the presence of the carbon that resulted from the burning of egg white during the preparation of ZnO using the combustion method. The presence of this carbon resulted in the emergence of absorption bands at 1123, 1401 and 20,968 cm−1, related to C–O, C–H and C–OH, respectively. In the Raman spectra of the S2 sample, the appearance of two broad peaks at 1565 cm−1 and 1326 cm−1, related to the D- and G-bands of the carbonaceous material, confirms the formation of ZnO/C nanocomposite. Thus, the presence of carbon in the composite was detected by FTIR, EDS and Raman analyses;
  • Using small amount of egg white resulted in the transformation of the shape of ZnO particles from hexagonal cone-type structures to ellipsoidal structures;
  • UV–visible spectroscopy showed that the S2 (ZnO/C) sample underwent band gap narrowing compared to the S1 (pure ZnO) sample. The values of optical band gap energy for S1 and S2 are 3.09 and 2.60 eV, respectively;
  • The magnetization curve of ZnO/C nanoparticles indicates the alteration of this system to ferromagnetism. The magnetic behavior of ZnO nanoparticles changes from completely diamagnetic to weakly ferromagnetic depending on the incorporation of a carbon atom in the crystal lattice of ZnO.

Author Contributions

Conceptualization, O.H.A.-E. and N.M.D.; methodology, O.H.A.-E.; software, O.H.A.-E.; validation, L.A.; formal analysis, L.A.; data curation, N.M.D.; writing—original draft, O.H.A.-E. and N.M.D.; writing—review and editing, N.M.D.; visualization, L.A.; funding acquisition, O.H.A.-E. All authors have read and agreed to the published version of the manuscript.

Funding

This work has been supported by Researchers Supporting Project number (RSP2023R468), King Saud University, Riyadh, Saudi Arabia.

Institutional Review Board Statement

Not applicable.

Informed Consent Statement

Not applicable.

Data Availability Statement

The data presented in this study are available on request from the corresponding author.

Acknowledgments

The authors would like to extend their sincere appreciation to Researchers Supporting Project number (RSP2023R468), King Saud University, Riyadh, Saudi Arabia.

Conflicts of Interest

The authors declare no conflict of interest.

References

  1. Janotti, A.; Van de Walle, C.G. Fundamentals of zinc oxide as a semiconductor. Rep. Prog. Phys. 2009, 72, 126501. [Google Scholar] [CrossRef] [Green Version]
  2. Zhang, Y.; Ram, M.K.; Stefanakos, E.K.; Goswami, D.Y. Synthesis, Characterization, and Applications of ZnO Nanowires. J. Nanomater. 2012, 2012, 624520. [Google Scholar] [CrossRef] [Green Version]
  3. Schmidt-Mende, L.; MacManus-Driscoll, J.L. ZnO–nanostructures, defects, and devices. Mater. Today 2007, 10, 40–48. [Google Scholar] [CrossRef]
  4. Raghupathi, K.R.; Koodali, R.T.; Manna, A.C. Size-Dependent Bacterial Growth Inhibition and Mechanism of Antibacterial Activity of Zinc Oxide Nanoparticles. Langmuir 2011, 27, 4020–4028. [Google Scholar] [CrossRef]
  5. Rasmussen, J.W.; Martinez, E.; Louka, P.; Wingett, D.G. Zinc oxide nanoparticles for selective destruction of tumor cells and potential for drug delivery applications. Expert Opin. Drug Deliv. 2010, 7, 1063–1077. [Google Scholar] [CrossRef] [PubMed] [Green Version]
  6. Nohavica, D.; Gladkov, P. ZnO nanoparticles and their applications-new achievements. Olomouc Czech Repub. EU 2010, 10, 12–14. [Google Scholar]
  7. Sahoo, S.; Maiti, M.; Ganguly, A.; George, J.J.; Bhowmick, A.K. Effect of zinc oxide nanoparticles as cure activator on the properties of natural rubber and nitrile rubber. J. Appl. Polym. Sci. 2007, 105, 2407–2415. [Google Scholar] [CrossRef]
  8. Hatamie, A.; Khan, A.; Golabi, M.; Turner, A.P.F.; Beni, V.; Mak, W.C.; Sadollahkhani, A.; Alnoor, H.; Zargar, B.; Bano, S.; et al. Zinc Oxide Nanostructure-Modified Textile and Its Application to Biosensing, Photocatalysis, and as Antibacterial Material. Langmuir 2015, 31, 10913–10921. [Google Scholar] [CrossRef]
  9. Fu, D.; Han, G.; Chang, Y.; Dong, J. The synthesis and properties of ZnO–graphene nano hybrid for photodegradation of organic pollutant in water. Mater. Chem. Phys. 2012, 132, 673–681. [Google Scholar] [CrossRef]
  10. Yang, G.Z.; Song, H.W.; Cui, H.; Liu, Y.C.; Wang, C.X. Ultrafast Li-ion battery anode with superlong life and excellent cycling stability from strongly coupled ZnO nanoparticle/conductive nanocarbon skeleton hybrid materials. Nano Energy 2013, 2, 579–585. [Google Scholar] [CrossRef]
  11. Hsieh, C.T.; Lin, C.Y.; Chen, Y.F.; Lin, J.S. Synthesis of ZnO@ Graphene composites as anode materials for lithium ion batteries. Electrochim. Acta 2013, 111, 359–365. [Google Scholar] [CrossRef]
  12. Abbas, S.M.; Hussain, S.T.; Ali, S.; Ahmad, N.; Ali, N.; Abbas, S. Structure and electrochemical performance of ZnO/CNT composite as anode material for lithium-ion batteries. J. Mater. Sci. 2013, 48, 5429–5436. [Google Scholar] [CrossRef]
  13. Alshammari, A.S.; Chi, L.; Chen, X.; Bagabas, A.; Kramer, D.; Alromaeh, A.; Jiang, Z. Visible-light photocatalysis on C-doped ZnO derived from polymer-assisted pyrolysis. RSC Adv. 2015, 5, 27690–27698. [Google Scholar] [CrossRef] [Green Version]
  14. Liu, Y.; Kang, Z.H.; Chen, Z.H.; Shafiq, I.; Zapien, J.A.; Bello, I.; Zhang, W.J.; Lee, S.T. Synthesis, Characterization, and Photocatalytic Application of Different ZnO Nanostructures in Array Configurations. Cryst. Growth Des. 2009, 9, 3222–3227. [Google Scholar] [CrossRef]
  15. Wojnarowicz, J.; Omelchenko, M.; Szczytko, J.; Chudoba, T.; Gierlotka, S.; Majhofer, A.; Twardowski, A.; Lojkowski, W. Structural and Magnetic Properties of Co–Mn Codoped ZnO Nanoparticles Obtained by Microwave Solvothermal Synthesis. Crystals 2018, 8, 410. [Google Scholar] [CrossRef] [Green Version]
  16. Abduev, A.K.; Akhmedov, A.K.; Asvarov, A.S.; Rabadanov, K.S.; Emirov, R.M. Formation of a ZnO–C Composite with a Nanocrystalline Structure. Tech. Phys. 2019, 64, 666–673. [Google Scholar] [CrossRef]
  17. Cho, S.; Jang, J.-W.; Lee, J.S.; Lee, K.-H. Carbon-doped ZnO nanostructures synthesized using vitamin C for visible light photocatalysis. CrystEngComm 2010, 12, 3929–3935. [Google Scholar] [CrossRef] [Green Version]
  18. Mu, J.; Shao, C.; Guo, Z.; Zhang, Z.; Zhang, M.; Zhang, P.; Chen, B.; Liu, Y. High photocatalytic activity of ZnO−carbon nanofiber heteroarchitectures. ACS Appl. Mater. Interfaces 2011, 3, 590–596. [Google Scholar] [CrossRef]
  19. Molaei, P.; Rahimi-Moghadam, F. Optimized synthesis of ZnO nanostructures by egg-white content ratio manipulation for photocatalytic applications. Mater. Res. Express 2019, 6, 1250h7. [Google Scholar] [CrossRef]
  20. Kim, C.H.; Kim, B.-H. Zinc oxide/activated carbon nanofiber composites for high-performance supercapacitor electrodes. J. Power Sources 2015, 274, 512–520. [Google Scholar] [CrossRef]
  21. Sampaio, M.J.; Bacsa, R.R.; Benyounes, A.; Axet, R.; Serp, P.; Silva, C.G.; Silva, A.M.; Faria, J.L. Synergistic effect between carbon nanomaterials and ZnO for photocatalytic water decontamination. J. Catal. 2015, 331, 172–180. [Google Scholar] [CrossRef]
  22. Chung, R.-J.; Wang, A.-N.; Liao, Q.-L.; Chuang, K.-Y. Non-Enzymatic Glucose Sensor Composed of Carbon-Coated Nano-Zinc Oxide. Nanomaterials 2017, 7, 36. [Google Scholar] [CrossRef] [Green Version]
  23. Yang, S.; Chen, F.; Shen, Q.; Lavernia, E.J.; Zhang, L. Microstructure and Electrical Properties of AZO/Graphene Nanosheets Fabricated by Spark Plasma Sintering. Materials 2016, 9, 638. [Google Scholar] [CrossRef] [PubMed] [Green Version]
  24. Pardeshi, S.K.; Patil, A.B. Effect of morphology and crystallite size on solar photocatalytic activity of zinc oxide synthesized by solution free mechanochemical method. J. Mol. Catal. A Chem. 2009, 308, 32–40. [Google Scholar] [CrossRef]
  25. Agarwal, H.; Venkat Kumar, S.; Rajeshkumar, S. A review on green synthesis of zinc oxide nanoparticles—An eco-friendly approach. Resour. Effic. Technol. 2017, 3, 406–413. [Google Scholar] [CrossRef]
  26. Rani, S.; Suri, P.; Shishodia, P.K.; Mehra, R.M. Synthesis of nanocrystalline ZnO powder via sol–gel route for dye-sensitized solar cells. Sol. Energy Mater. Sol. Cells 2008, 92, 1639–1645. [Google Scholar] [CrossRef]
  27. Ahmed, F.; Arshi, N.; Jeong, Y.S.; Anwar, M.S.; Dwivedi, S.; Alsharaeh, E.; Koo, B.H. Novel Biomimatic Synthesis of ZnO Nanorods Using Egg White (Albumen) and Their Antibacterial Studies. J. Nanosci. Nanotechnol. 2016, 16, 5959–5965. [Google Scholar] [CrossRef]
  28. Al-Senani, G.M.; Al-Fawzan, F.F.; Almufarij, R.S.; Abd-Elkader, O.H.; Deraz, N.M. Magnetic Behavior of Virgin and Lithiated NiFe2O4 Nanoparticles. Crystals 2023, 13, 69. [Google Scholar] [CrossRef]
  29. Zhang, G.; Zhang, H.; Zhang, X.; Zeng, W.; Su, Q.; Du, G.; Duan, H. Solid-solution-like ZnO/C composites as excellent anode materials for lithium ion batteries. Electrochim. Acta 2015, 186, 165–173. [Google Scholar] [CrossRef]
  30. Sedrati, C.; Alleg, S.; Boussafel, H.; Hacine, A.B. Structure and magnetic properties of nickel ferrites synthesized by a facile co-precipitation method: Effect of the Fe/Ni ratio. J. Mater. Sci. Mater. Electron. 2021, 32, 24548–24559. [Google Scholar] [CrossRef]
  31. Das, J.; Khushalani, D. Nonhydrolytic route for synthesis of ZnO and its use as a recyclable photocatalyst. J. Phys. Chem. C 2010, 114, 2544–2550. [Google Scholar] [CrossRef]
  32. Noei, H.; Qiu, H.; Wang, Y.; Löffler, E.; Wöll, C.; Muhler, M. The identification of hydroxyl groups on ZnO nanoparticles by infrared spectroscopy. Phys. Chem. Chem. Phys. 2008, 10, 7092–7097. [Google Scholar] [CrossRef]
  33. Silva, C.G.; Sampaio, M.J.; Carabineiro, S.A.; Oliveira, J.W.; Baptista, D.L.; Bacsa, R.; Machado, B.F.; Serp, P.; Figueiredo, J.L.; Silva, A.M.; et al. Developing highly active photocatalysts: Gold-loaded ZnO for solar phenol oxidation. J. Catal. 2014, 316, 182–190. [Google Scholar] [CrossRef]
  34. Kołodziejczak-Radzimska, A.; Markiewicz, E.; Jesionowski, T. Structural Characterisation of ZnO Particles Obtained by the Emulsion Precipitation Method. J. Nanomater. 2012, 2012, 656353. [Google Scholar] [CrossRef] [Green Version]
  35. da Trindade, L.G.; Minervino, G.B.; Trench, A.B.; Carvalho, M.H.; Assis, M.; Li, M.S.; de Oliveira, A.J.; Pereira, E.C.; Mazzo, T.M.; Longo, E. Influence of ionic liquid on the photoelectrochemical properties of ZnO particles. Ceram. Int. 2018, 44, 10393–10401. [Google Scholar] [CrossRef]
  36. Ansari, S.P.; Mohammad, F. Studies on Nanocomposites of Polyaniline and Zinc Oxide Nanoparticles with Supporting Matrix of Polycarbonate. ISRN Mater. Sci. 2012, 2012, 129869. [Google Scholar] [CrossRef] [Green Version]
  37. PK Shishodia, M.T.; K Shishodia, M.T. Ferromagnetism in sol-gel derived ZnO: Mn nanocrystalline thin films. Adv. Mater. Lett. 2016, 7, 116–122. [Google Scholar] [CrossRef]
  38. Sahoo, S.; Sharma, G.L.; Katiyar, R.S. Raman spectroscopy to probe residual stress in ZnO nanowire. J. Raman Spectrosc. 2011, 43, 72–75. [Google Scholar] [CrossRef]
  39. Pal, B.; Giri, P.K. Defect mediated magnetic interaction and high T c ferromagnetism in Co doped ZnO nanoparticles. J. Nanosci. Nanotechnol. 2011, 11, 9167–9174. [Google Scholar] [CrossRef]
  40. Wang, J.B.; Huang, G.J.; Zhong, X.L.; Sun, L.Z.; Zhou, Y.C.; Liu, E.H. Raman scattering and high temperature ferromagnetism of Mn-doped ZnO nanoparticles. Appl. Phys. Lett. 2006, 88, 252502. [Google Scholar] [CrossRef]
  41. Cuscó, R.; Alarcón-Lladó, E.; Ibanez, J.; Artús, L.; Jiménez, J.; Wang, B.; Callahan, M.J. Temperature dependence of Raman scattering in ZnO. Phys. Rev. B 2007, 75, 165202. [Google Scholar] [CrossRef]
  42. Thangavel, R.; Moirangthem, R.S.; Lee, W.S.; Chang, Y.C.; Wei, P.K.; Kumare, J. Cesium doped and undoped ZnO nanocrystalline thin films: A comparative study of structural andmicro-Raman investigation of optical phonons. J. Raman Spectrosc. 2010, 41, 1594–1600. [Google Scholar] [CrossRef]
  43. Silambarasan, M.; Saravanan, S.; Soga, T. Raman and photoluminescence studies of Ag and Fe-doped ZnO nanoparticles. Int. J. Chemtech Res. 2015, 7, 1644–1650. [Google Scholar]
  44. Zhang, R.; Fan, L.; Fang, Y.; Yang, S. Electrochemical route to the preparation of highly dispersed composites of ZnO/carbon nanotubes with significantly enhanced electrochemiluminescence from ZnO. J. Mater. Chem. 2008, 18, 4964–4970. [Google Scholar] [CrossRef]
  45. Min, Y.; Zhang, K.; Chen, L.; Chen, Y.; Zhang, Y. Ionic liquid assisting synthesis of ZnO/graphene heterostructure photocatalysts with tunable photoresponse properties. Diam. Relat. Mater. 2012, 26, 32–38. [Google Scholar] [CrossRef]
  46. Graf, D.; Molitor, F.; Ensslin, K.; Stampfer, C.; Jungen, A.; Hierold, C.; Wirtz, L. Spatially Resolved Raman Spectroscopy of Single- and Few-Layer Graphene. Nano Lett. 2007, 7, 238–242. [Google Scholar] [CrossRef] [PubMed] [Green Version]
  47. Sim, L.C.; Leong, K.H.; Ibrahim, S.; Saravanan, P. Graphene oxide and Ag engulfed TiO2 nanotube arrays for enhanced electron mobility and visible-light-driven photocatalytic performance. J. Mater. Chem. A 2014, 2, 5315–5322. [Google Scholar] [CrossRef]
  48. Ferrari, A.C.; Robertson, J. Interpretation of Raman spectra of disordered and amorphous carbon. Phys. Rev. B 2000, 61, 14095–14107. [Google Scholar] [CrossRef] [Green Version]
  49. Huang, X.; Yin, Z.; Wu, S.; Qi, X.; He, Q.; Zhang, Q.; Yan, Q.; Boey, F.; Zhang, H. Graphene-based materials: Synthesis, characterization, properties, and applications. Small 2011, 7, 1876–1902. [Google Scholar] [CrossRef]
  50. Park, S.; Lee, K.-S.; Bozoklu, G.; Cai, W.; Nguyen, S.T.; Ruoff, R.S. Graphene Oxide Papers Modified by Divalent Ions—Enhancing Mechanical Properties via Chemical Cross-Linking. ACS Nano 2008, 2, 572–578. [Google Scholar] [CrossRef] [PubMed]
  51. Salem, S.M.; Deraz, N.M.; Saleh, H.A. Fabrication and characterization of chemically deposited copper–manganese sulfide thin films. Appl. Phys. A 2020, 126, 700. [Google Scholar] [CrossRef]
  52. Jindal, K.; Tomar, M.; Katiyar, R.S.; Gupta, V. Transition from diamagnetic to ferromagnetic state in laser ablated nitrogen doped ZnO thin films. AIP Adv. 2015, 5, 027117. [Google Scholar] [CrossRef]
  53. Il’ves, V.G.; Sokovnin, S.Y. Structural and Magnetic Properties of Nanopowders and Coatings of Carbon-Doped Zinc Oxide Prepared by Pulsed Electron Beam Evaporation. J. Nanotechnol. 2017, 2017, 4628193. [Google Scholar] [CrossRef] [Green Version]
  54. Pan, H.; Yi, J.B.; Shen, L.; Wu, R.Q.; Yang, J.H.; Lin, J.Y.; Feng, Y.P.; Ding, J.; Van, L.H.; Yin, J.H. Room-Temperature Ferromagnetism in Carbon-Doped ZnO. Phys. Rev. Lett. 2007, 99, 127201. [Google Scholar] [CrossRef] [PubMed] [Green Version]
  55. Zhang, L.; Cheng, H.; Zong, R.; Zhu, Y. Photocorrosion Suppression of ZnO Nanoparticles via Hybridization with Graphite-like Carbon and Enhanced Photocatalytic Activity. J. Phys. Chem. C 2009, 113, 2368–2374. [Google Scholar] [CrossRef]
  56. Chen, L.-C.; Tu, Y.-J.; Wang, Y.-S.; Kan, R.-S.; Huang, C.-M. Characterization and photoreactivity of N-, S-, and C-doped ZnO under UV and visible light illumination. J. Photochem. Photobiol. A Chem. 2008, 199, 170–178. [Google Scholar] [CrossRef]
  57. Liu, S.; Li, C.; Yu, J.; Xiang, Q. Improved visible-light photocatalytic activity of porous carbon self-doped ZnO nanosheet-assembled flowers. CrystEngComm 2011, 13, 2533–2541. [Google Scholar] [CrossRef]
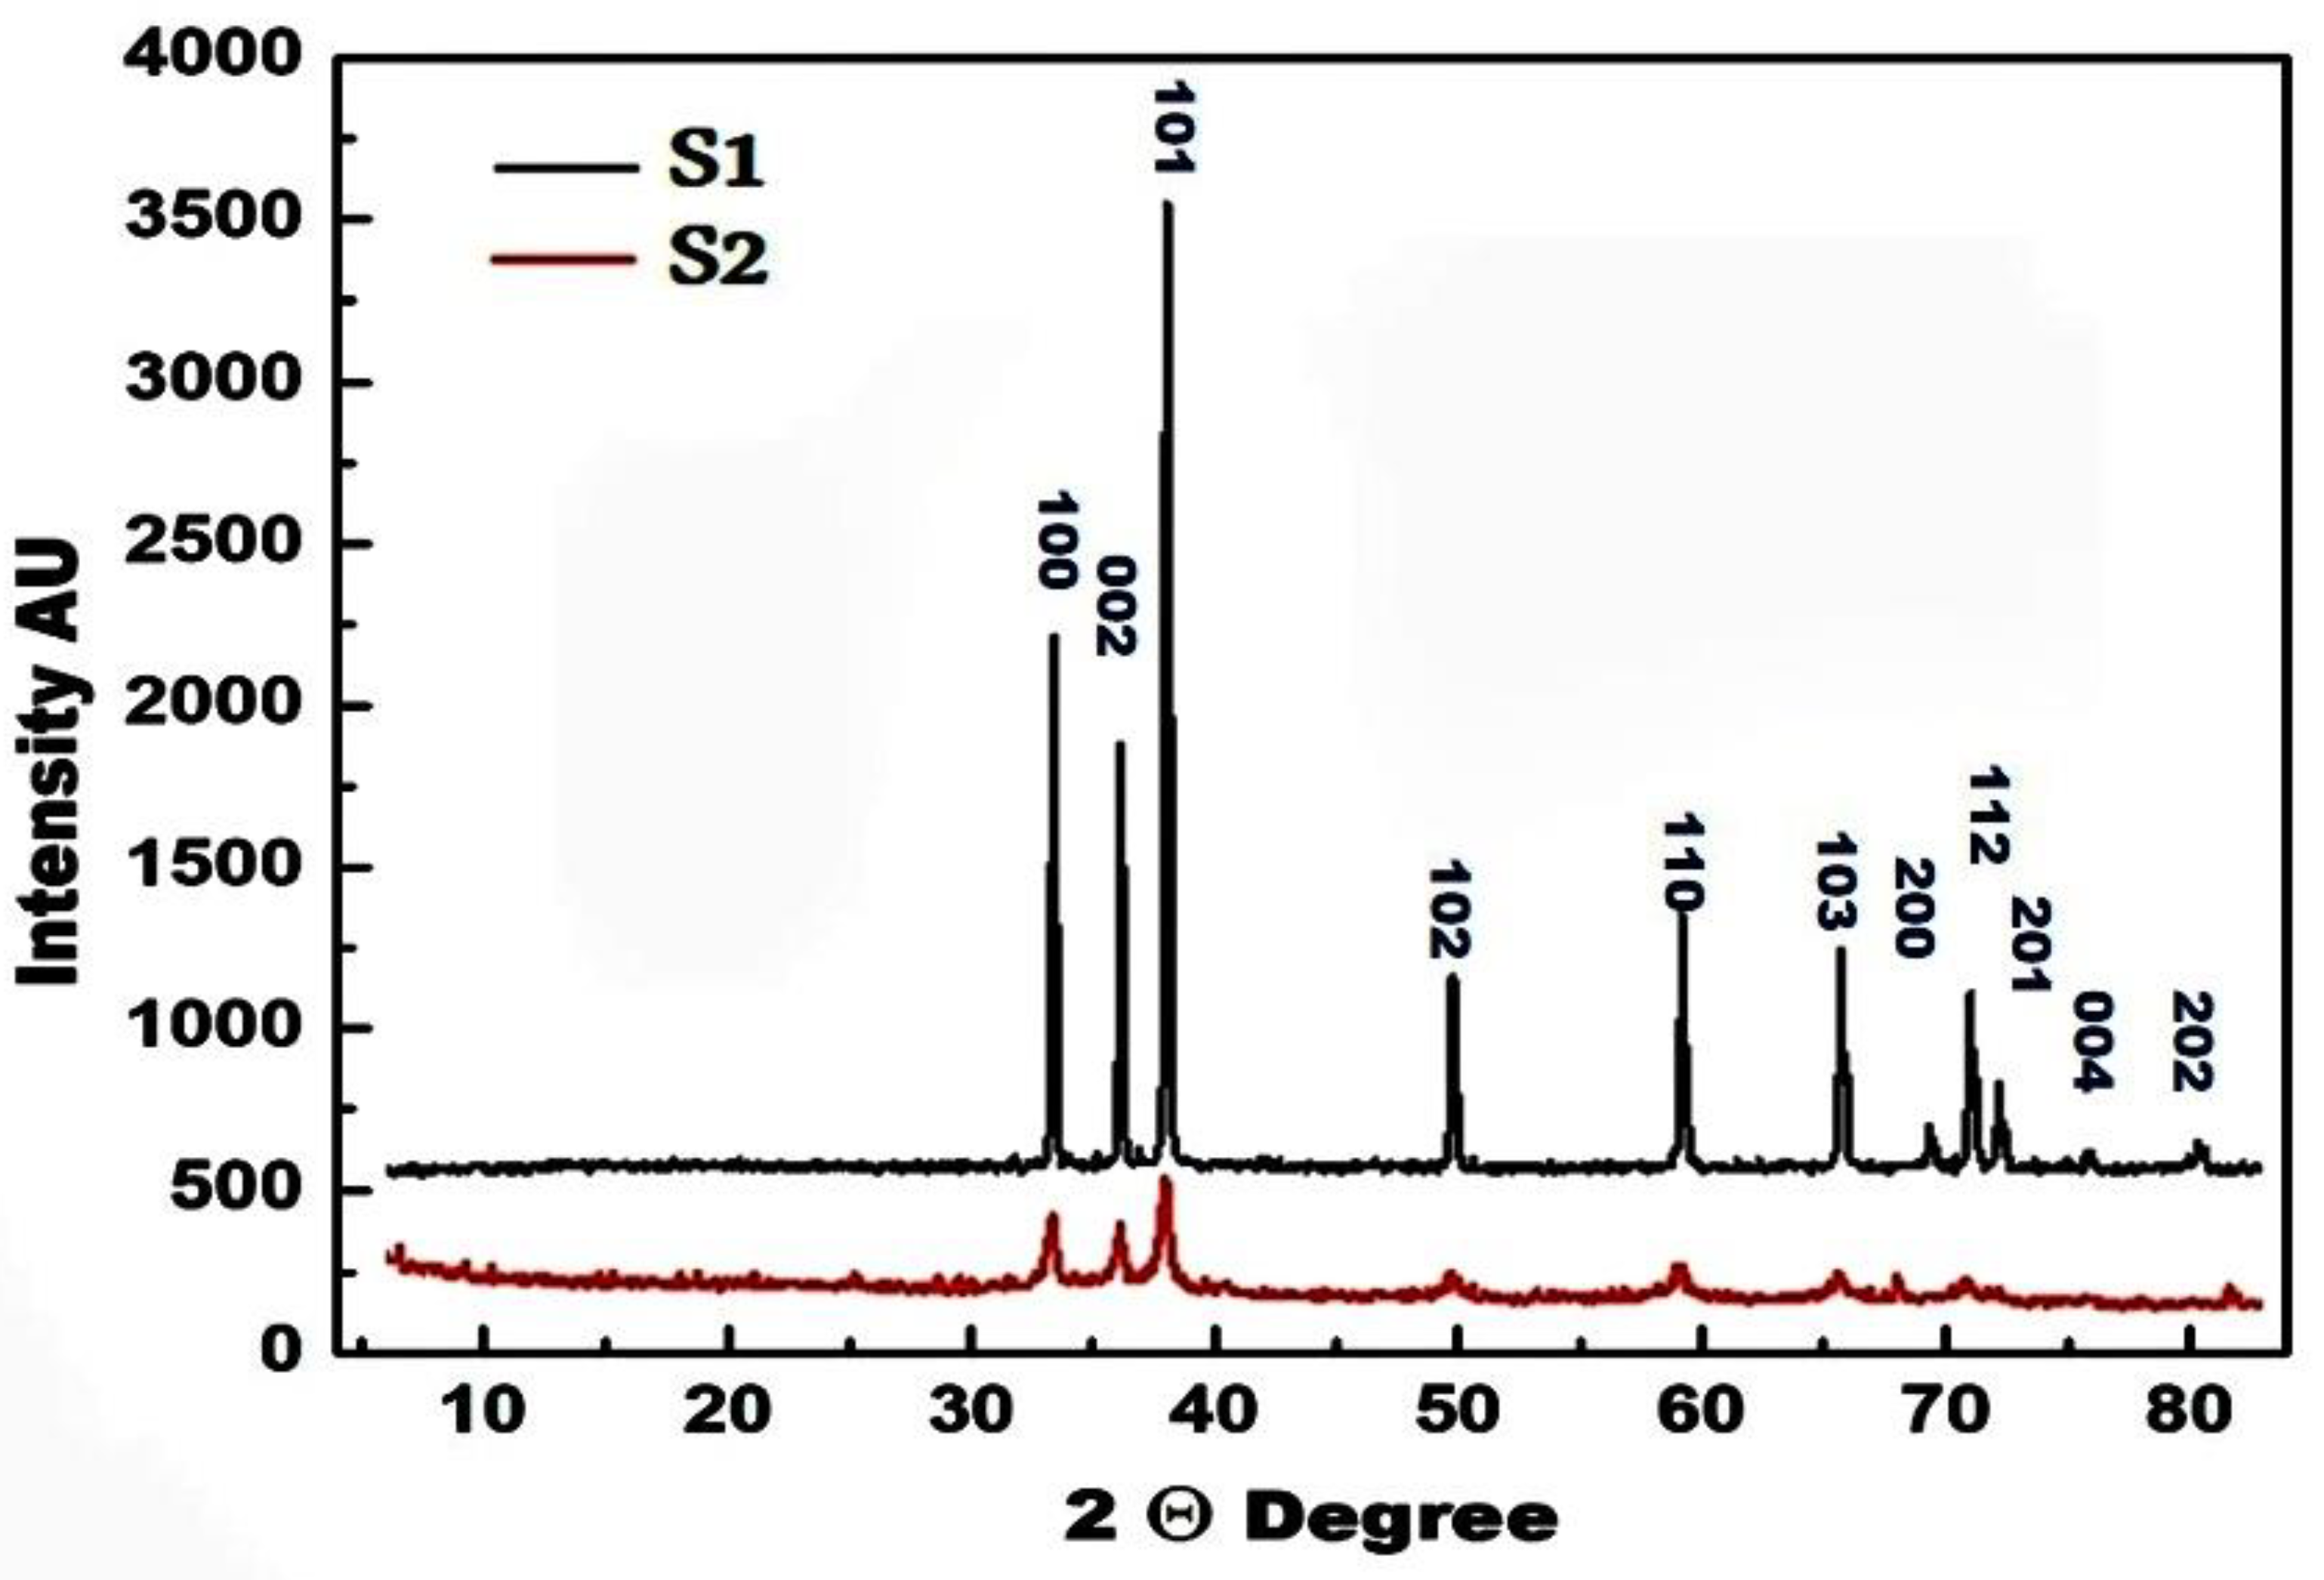
Figure 1. X-ray diffractograms of the S1 and S2 solids.
Crystals 13 01081 g001
Figure 2. FTIR spectrum of S1 (wavenumbers ranging from 300 to 1000 and 300 to 4300 cm−1 for S1, and from 300 to 1300 and 300 to 4300 cm−1 for S2).
Crystals 13 01081 g002
Figure 3. Vibrational characteristics in the Raman spectra of S1 and S2 at room temperature.
Crystals 13 01081 g003
Figure 4. Surface morphology (a,b) and EDS elemental analysis (c,d) of the S1 and S2 specimens.
Crystals 13 01081 g004aCrystals 13 01081 g004b
Figure 5. TEM images and selected area electron diffraction (SAED) of the samples S1 and S2.
Crystals 13 01081 g005
Figure 6. Colors of Samples (a), UV–visible spectra (b) and band gap energies (c) of the S1 and S2 samples.
Crystals 13 01081 g006
Figure 7. Hysteresis loops of S1 and S2 at room temperature.
Crystals 13 01081 g007aCrystals 13 01081 g007b
Table 1. Lattice parameters of ZnO.
ParametersS1Error %S2Error %
d, nm710.408190.526
a, nm0.324810.2500.325780.549
c, nm0.520400.3060.52153−0.090
c/a1.60220.1371.60010.006
V, nm30.047550.3160.049350.411
μ0.37970.1840.39020.295
L, nm0.19770.2530.1966−0.304
δ, Lines/nm20.198 × 10−30.4212.77 × 10−30.457
ε0.00160.1420.00610.335
Table 2. The magnetic properties of the S2 samples.
SamplesMs × 10−3
(emu/g)
Mr × 10−3
(emu/g)
Mr/MsHc
(Oe)
μm × 10−4Ka
(erg/cm3)
S221.1212.060.5710107.253.0772.265
Disclaimer/Publisher’s Note: The statements, opinions and data contained in all publications are solely those of the individual author(s) and contributor(s) and not of MDPI and/or the editor(s). MDPI and/or the editor(s) disclaim responsibility for any injury to people or property resulting from any ideas, methods, instructions or products referred to in the content.