Article

Microstructure Evolution and Mechanical Properties of TiB2/Al–Cu–Mn–Cd Composite with the Adoption of Two-Stage Solution and Aging Treatment

1
College of Materials Science and Engineering, Beijing University of Technology, Beijing 100124, China
2
College of Materials Engineering; North China Institute of Aerospace Engineering, Langfang 065014, China
3
Sinoma Science & Technology (Suzhou) Co., Ltd., Suzhou 215021, China
*
Author to whom correspondence should be addressed.
Crystals 2024, 14(10), 836; https://doi.org/10.3390/cryst14100836
Submission received: 29 August 2024 / Revised: 21 September 2024 / Accepted: 23 September 2024 / Published: 26 September 2024
(This article belongs to the Special Issue Processing, Structure and Properties of Metal Matrix Composites)

Abstract

:
In this study, in order to obtain excellent mechanical properties in TiB2/Al–Cu–Mn–Cd composite, an optimized heat treatment, i.e., short-time solution treatment at 535 °C for 1 h following long-time solution at 523 °C for 11 h, and aging treatment, i.e., aged at 170 °C for 12 h, is proposed. In addition, this study investigated the connection between microstructure evolution and mechanical properties during heat treatment. The results show that with adoption of the optimized solution treatment, the area fraction of second and eutectic Al2Cu phases decreased from 5.08% in the as-cast state to less than 0.36% owing to improvement of dissolution efficiency in the high-temperature short-time solution. Comparing mechanical properties of the composite in the as-cast state and in the peak-aged state, average ultimate tensile strength and yield strength increased from 211.9 MPa to 523.0 MPa and from 115.8 MPa to 451.8 MPa, respectively. However, average elongation slightly decreased from 8.78% to 8.24%. Strength contribution of the peak-aged TiB2/Al–Cu–Mn–Cd composite was mainly ascribed to Cd-rich, θ″ and θ′ precipitates. In the peak-aged state, number density and average diameter of the plate-like θ″ and θ′ precipitates reached 4.266 × 10²¹ m3 and 64.30 nm, respectively, and severe lattice distortions occurred around the Cd-rich precipitates, providing the strongest precipitation strengthening. These findings indicate that the two-stage solution treatment successfully solved the problem of the eutectic phase at the triangular grain boundary being difficult to dissolve in a TiB2/Al-Cu-Mn-Cd composite, and excellent mechanical properties were acquired with the optimized aging treatment.

1. Introduction

Particle-reinforced aluminum matrix composites (PAMC) demonstrate superior comprehensive performance, such as high elastic modulus, excellent isotropy and good wear resistance [1,2,3]. Specifically, particle-reinforced Al–Cu composites have widespread applications [4,5]. Compared with other ceramic particles, such as Al2O3, SiC and TiC [6,7,8], TiB2 exhibits regular morphology and excellent thermal stability. In particular, there are two common coherent interface orientations (i.e., Al(111)/TiB2(0001) and Al(001)/TiB2(0001)) [9,10]. Li et al. [11] studied the microstructure, mechanical properties and aging behavior of a TiB2 particle-reinforced Al–Cu composite. They reported that with the addition of TiB2 particles, the average grain size decreased by 15.88%, and the dislocation density increased by approximately 34% owing to the hindering effect of the TiB2 particles. Accordingly, the ultimate tensile strength and yield strength of the composite increased by about 13.12% and 4.95%, respectively, and the Young’s modulus increased by about 6.02%. As modern industry develops rapidly, high requirements for strength and toughness are placed on certain special structural components. To meet these demands, an effective and convenient method to enhance the mechanical properties of TiB2 particle-reinforced Al–Cu composites (i.e., TiB2/Al–Cu composite) is required. In general, Al–Cu alloy, a heat-treatable alloy, can be modified by controlling the solution and aging precipitation sequence. Similarly, heat treatment also can significantly improve the mechanical properties of Al–Cu matrix composites with simple processes and low cost [12,13].
Typical heat treatment of Al–Cu matrix composite mainly includes solution and aging processes. In the solution process, Cu atoms gradually dissolve into the Al matrix. Post quenching, a supersaturated solid solution of Cu atoms forms, which provides precipitation force for Cu-containing precipitates in the aging process. Therefore, maximum dissolution of Cu atoms is pursued in order to acquire the maximum precipitation force during the aging process. Solution temperature and time significantly influence Cu atom dissolution. Specifically, low-temperature solution treatment cannot ensure a high and homogeneous solute concentration, but high-temperature solution may cause over-burning defects [14,15]. Especially, Hong et al. [16] and Du et al. [17] identified particle migration towards grain boundaries facilitated by solid/liquid interface during solidification and interwoven with the eutectic Al2Cu phase. They reported that a shell-like structure impeded solute Cu atom diffusion during solution processing, thereby impeding second-phase dissolution. In addition, a particle-reinforced Al–Cu matrix composite tends to be non-equilibrium solidified, and severe component segregation may occur in local areas, such as triangle grain boundaries. Those non-equilibrium Al2Cu phases located in the triangle grain boundaries are difficult to dissolve into the Al matrix under the conventional solution process. The microstructure characteristics of a particle-reinforced Al–Cu matrix composite inevitably lead to complex solution processes. Li et al. [18] investigated the effect of nano-sized SiC particles on solution behavior and properties of 1 wt.% SiCp/Al–Cu composites. They reported that abundant eutectic Al2Cu phase still existed in composite solutionized at 540 °C for 10 h, while over-burning defects and coarse grain boundaries appeared after composite was solutionized at 550 °C for 10 h. The results of Li et al. [18] indicated that the traditional single-stage solution treatment made it difficult to completely dissolve eutectic Al2Cu phase into Al matrix. Yang et al. [19] proposed a two-stage solution treatment to completely dissolve the Cu-containing phase without over-burning defects. They employed a first stage (495 °C/8 h) to dissolve most of the Cu-containing phases while avoiding incipient melting, and a subsequent stage (515 °C/4 h) aimed at promoting spheroidization of eutectic Si phase. Moreover, Wu et al. [20] reported that most of the second phases had dissolved into Al matrix after a two-stage solution treatment. In addition, grain size of composites did not increase significantly in the high-temperature solution process (the second stage) owing to effective pinning of grain boundaries caused by TiB2 particles. Moller et al. [21] reported that eutectic phases were dissolved to a great extent by adopting a two-step solution treatment: solutionized at 490 °C for 24 h followed by a short-time solution at 520 °C for 2 h in 2139 alloy, and over-burning defects were successfully avoided. However, they did not conduct an in-depth study into microstructure evolution during their two-stage solution treatment process. Accordingly, the two-stage solution treatment combined the advantages of low-temperature and high-temperature solution and could potentially address the challenge of completely dissolving eutectic Al2Cu phase into the Al matrix in particle-reinforced Al–Cu matrix composites. Although two-stage heat treatment has been widely used in industry, there is still a lack of in-depth research about quantitative characterization of the second phase’s dissolution behavior.
Similar to what is seen with Al–Cu alloy, it is widely accepted that the precipitation sequence in particle-reinforced Al–Cu matrix composites is supersaturated solid solution (SSS)→GP zone→θ″→θ′→θ [22,23]. The θ′ precipitates with a composition of Al2Cu and a tetragonal crystal structure (space group I4/mmm, a = 0.404 nm, c = 0.580 nm) are well known as the most effective strengthening precipitation [24]. The aging process is controlled by diffusion of solute atoms. In the diffusion of solute atoms from the matrix, precipitates increase in size while precipitates with smaller size re-dissolve, which is called Ostwald ripening [25]. Precipitation strengthening capacity is defined by the precipitates’ size, distribution, number density and their coherence with the matrix. Aging temperature and aging time are two necessary parameters in an artificial aging process and directly influence the precipitates’ morphology, size, distribution and interface structure [26]. Aging temperature as the precipitation drive force controls the precipitate number density by affecting nucleation rate. The peak-aging hardness value appears within an adequate time when the aging process is conducted at the optimal aging temperature, while, on the other hand, a long time is needed to reach the peak hardness value at lower temperatures [27]. Alvarez et al. [28] conducted aging treatment at different aging temperatures (160, 180 and 200 °C) to obtain maximum hardness in an Al–Cu–Mg–Si alloy. The results indicated that the aging temperature completely determined the age hardening process, and the maximum hardness value reached 162 HV at 160 °C. In addition, the higher the aging temperature, the faster the peak hardness was reached. However, Alvarez et al. mainly focused on the hardness changes in the aging process, but microstructure evolution, especially the evolution of the precipitates’ size, number density and coherence with the matrix, was not discussed in detail. Moreover, the connection between precipitation strengthening capacity and a precipitate’s characteristics (size, number density and interface structure) was not yet fully understood, especially for the strengthening mechanism of peak-aging TiB2/Al–Cu–Mn–Cd composites.
Therefore, we conducted systematic studies into the microstructure and hardness evolution of a TiB2/Al–Cu–Mn–Cd composite during heat treatment and propose an optimized two-stage solution treatment and single-stage aging treatment (aging temperature and aging time). In addition, previous studies mainly optimized the aging treatment according to variation in hardness, but in this study, the correlation between the aging hardening behavior and the evolution of the precipitates’ type, morphology and interface characteristics was investigated in detail, and contributions to enhancement of the mechanical properties are also discussed.

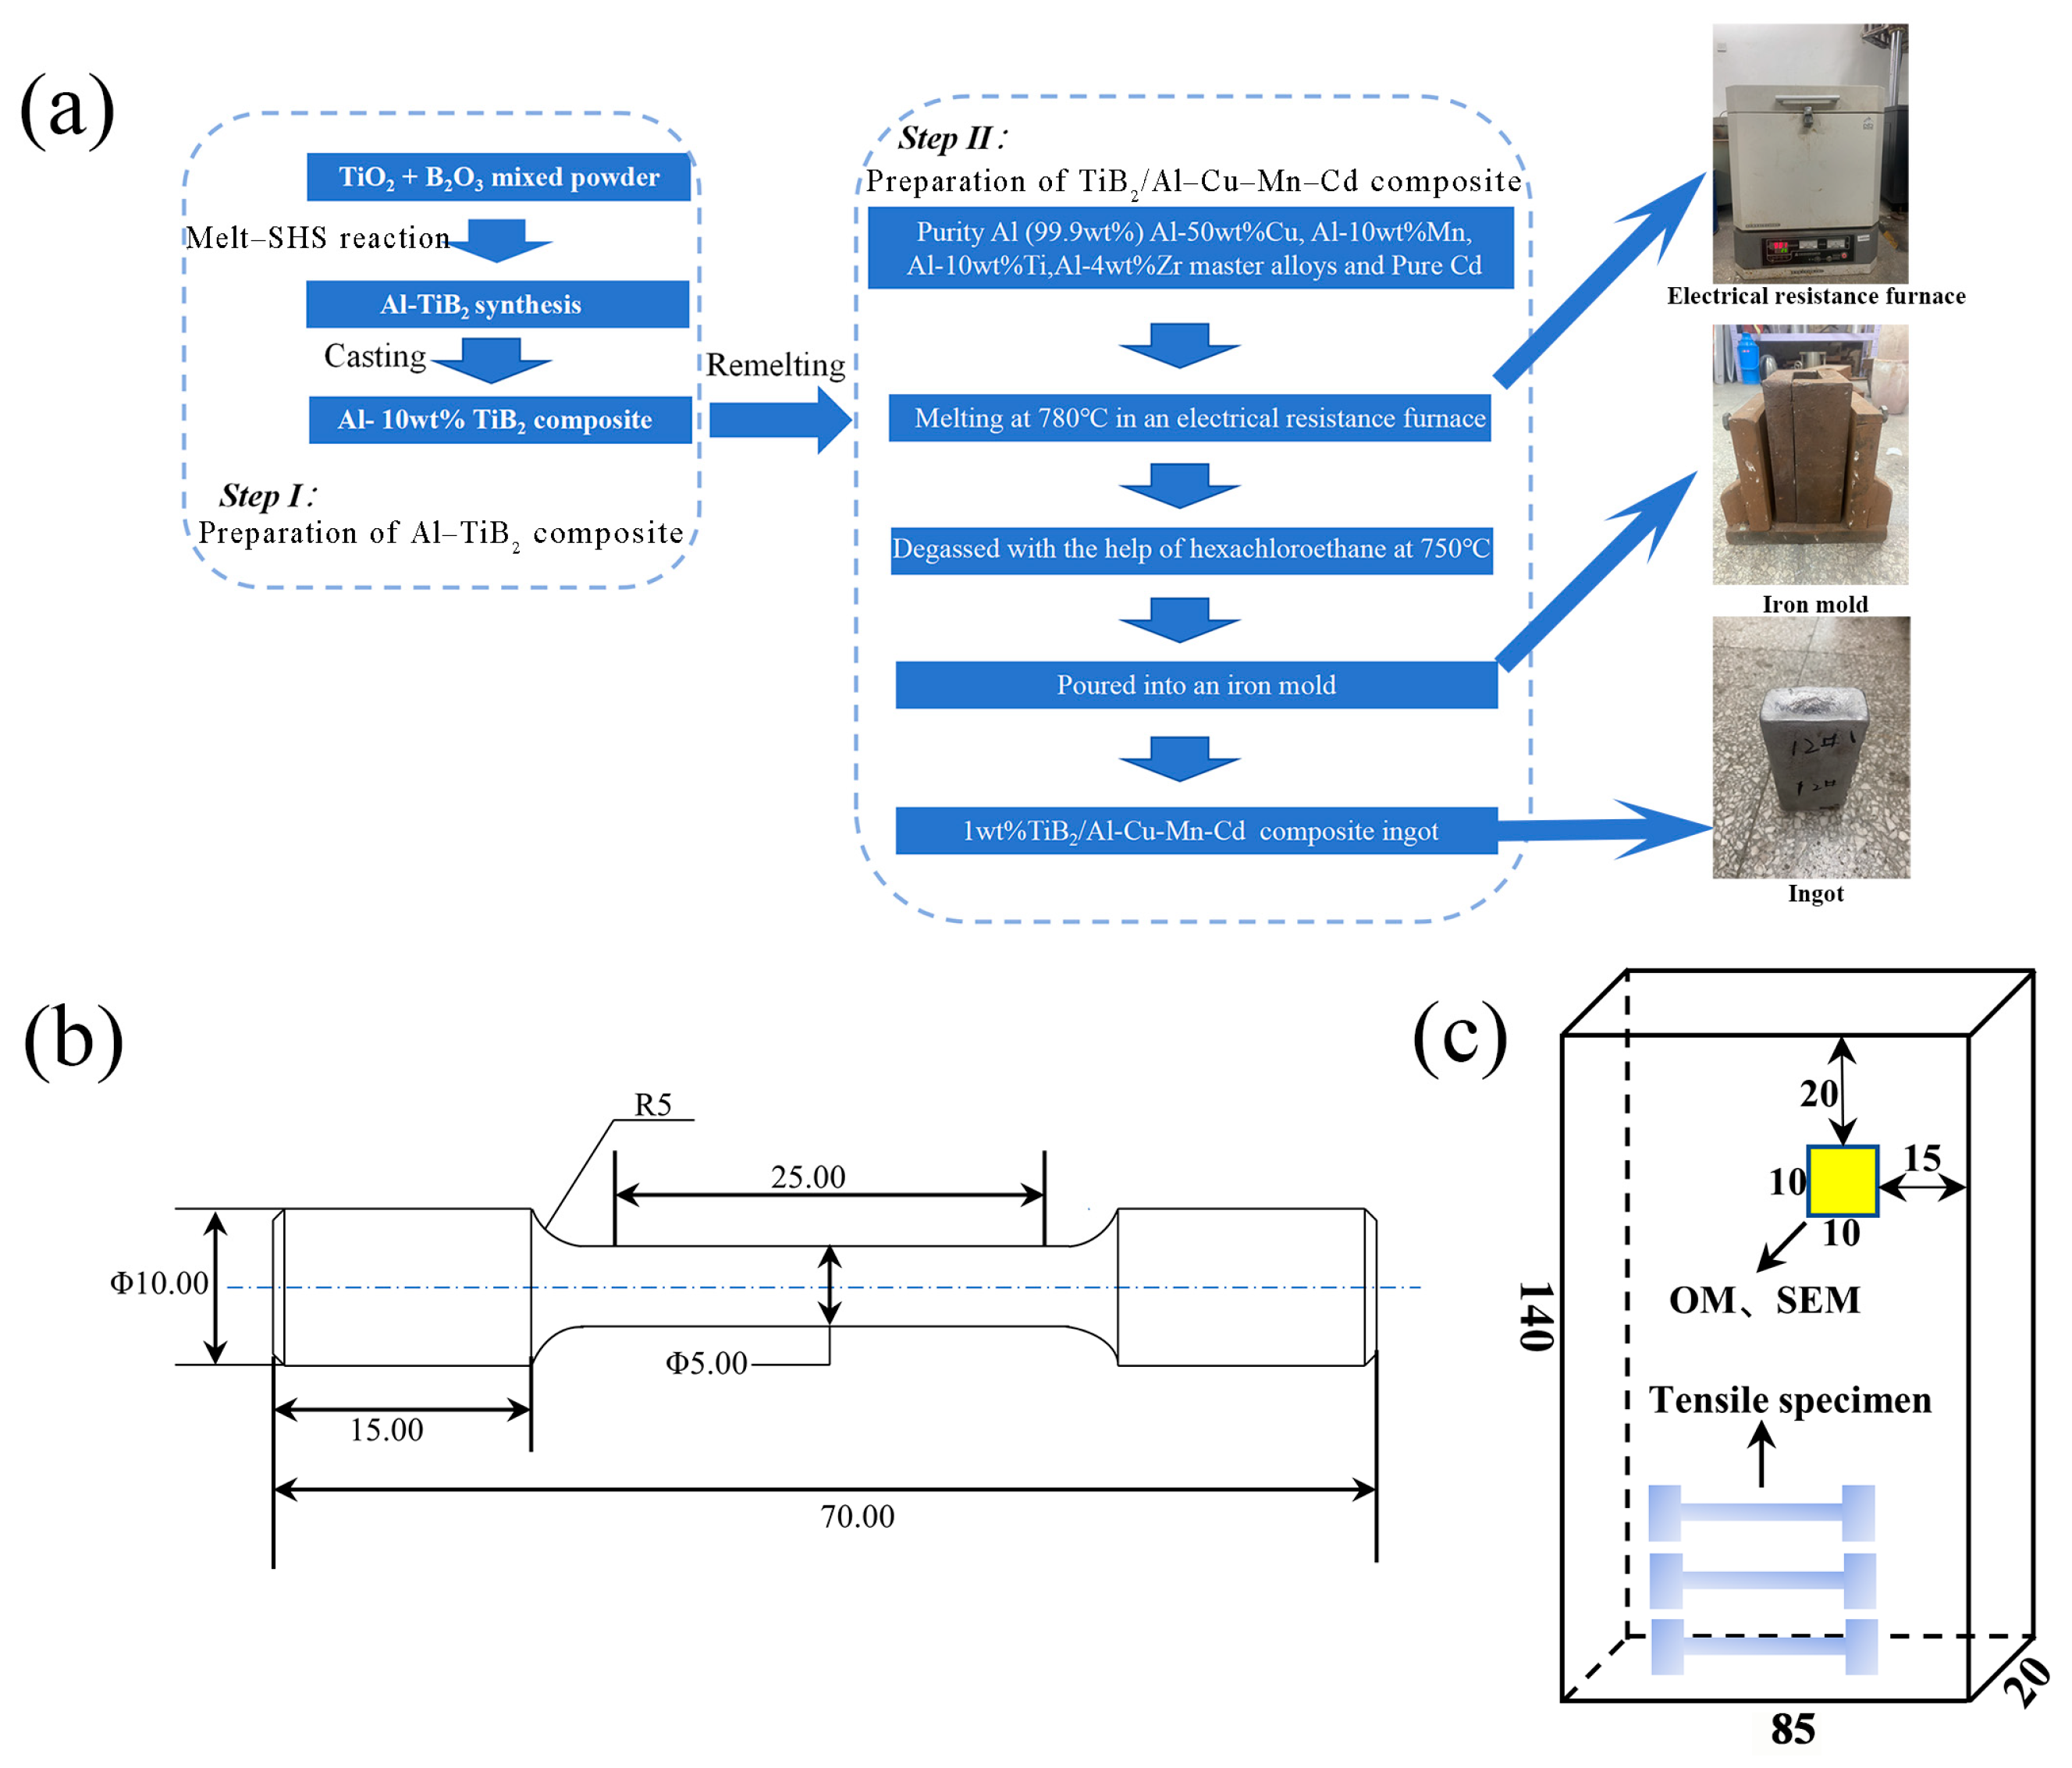
2. Materials and Methods

The composite was prepared by a combination of melt self-spreading reaction (Melt-SHS) and traditional casting. The Melt-SHS method [29] via mixed TiO2 and H3BO3 in molten Al was employed to prepare in situ Al-10 wt%TiB2 master alloy, and 1 wt%TiB2/Al–Cu–Mn–Cd composite was prepared by traditional casting. The preparation process diagram for composite is displayed in Figure 1a. A total of 1000 g of alloy was produced at 780 °C in an electric resistance furnace. We used 99.99 wt% pure aluminum, master alloys such as Al-50wt%Cu, Al-10wt%Mn, Al-10wt%Ti, Al-4wt%Zr and Al-10wt%TiB2 and cadmium metal (99.9%) for this process. Post processing involved hexachloroethane degassing at 750 °C to remove any impurities. Alloy was successfully poured into an iron mold pre-heated at 730 °C and coated with a blend of zinc oxide and sodium silicate in water. To acquire the actual mass fraction of TiB2 in the composite, TiB2 particles were extracted from TiB2/Al–Cu–Mn–Cd composite. The detailed process was as described below. We gently sliced a petite sample measuring 10 mm × 10 mm × 5 mm. This was then immersed in a dilute hydrochloric acid solution until fully dissolved. Next, the particles were isolated via centrifugation, suction filtration and multiple cycles of treating with ionized water. Finally, the particles were dried in an oven at 50 °C for 24 h. The morphology of extracted TiB2 particles exhibited regular polyhedra, and the equivalent average diameter was 0.75 μm, as displayed in Figure S1. The weights of TiB2 particles and the small bulk specimen were measured by analytical balance, and the ratio of the two masses was considered to be the actual mass fraction of the TiB2 particles in the composite. The chemical composition of experimental composite is shown in Table 1, which was confirmed by inductively coupled plasma atomic emission spectroscopy (ICP).
Subsequently, in order to study the effect of heat treatment on the microstructure and properties, the composite was heated by resistance furnace with different heat treatments. To avoid the over-burning defects during heat treatment processes, differential scanning calorimetry (DSC 214 Polyma 2019) was used to measure the melting point of the second phases in the as-cast microstructure.
The sample was cut from the rectangular ingot at the same position for microstructure characterization. Schematic figures of the rectangular ingot and specimen positions are shown in Figure 1c. Microsample solidification speed stands at approximately 49 mm/min while that for tensile samples comes to around 57 mm/min, as calculated with the square root law of solidification.
To prepare samples, we started with routine mechanical polishing followed by etching with Keller’s solution (comprising 95% H2O, 2.5% HNO3, 1.5% HCl and 1% HF). Optical microscopy (OM) was employed to examine the as-cast alloy structures. The grain size and distribution frequency were determined with Nano-meter 1.2 software, scrutinizing over 100 grains. X-ray Diffraction (XRD) was performed to analyze the type of phase in the as-cast microstructure. Scanning electron microscopy and EDS analyses were employed to observe the microstructure and tensile fractographs. JEM-2100F TEM (produced by Japan Electronics Co., LTD, Tokyo, Japan) were used to observe the precipitation within the microstructure. The phase identity was identified via SAED and EDS systems incorporated in the TEM. Samples were gently ground to around 100 μm, followed by a warm (−25 °C) polishing bath in a blend of 30 vol% HNO3 and 70 vol% CH3OH. The number density of precipitates in per units volume was statistically obtained from a mass of representative TEM micrographs (the number of statistics was greater than 50) using the method mentioned in the literature [30]. In the literature, the number density of plate-like precipitates in per units volume is estimated by the following formula [31];
N V = N × 4 A 1 / 2 + 4 t + π D t A 3 / 2 ( 4 t + π D t )
where Nv is the number of plate-like precipitates in per units volume, N is the number of plate-like precipitates in the image field of vision, A is the image area, Dt is the diameter of plate-like precipitates, and t is the foil thickness of the beam direction, which is determined by measuring the spacing of Kossel–Mollenstedt fringes in a {022} Al reflection in a <100> Al two-beam convergent beam electron diffraction pattern [32] and can be estimated to be 85 nm.
We performed five Vickers hardness measurements on each specimen using an HDX-1000TM/LCD electric Vickers hardness tester with a 200 g load and a 10 s dwell time. We conducted three tensile tests, each with a gauge length of φ5 mm × 25 mm and a steady strain rate of 1.6 × 10⁻² mm/s, at a temperature of 25 ± 2 °C using the MTS810 (Produced by MTS Systems, Eden Prairie, MN, USA) Systems testing machine. All samples were selected from the same region, as illustrated in Figure 1b,c.

3. Results

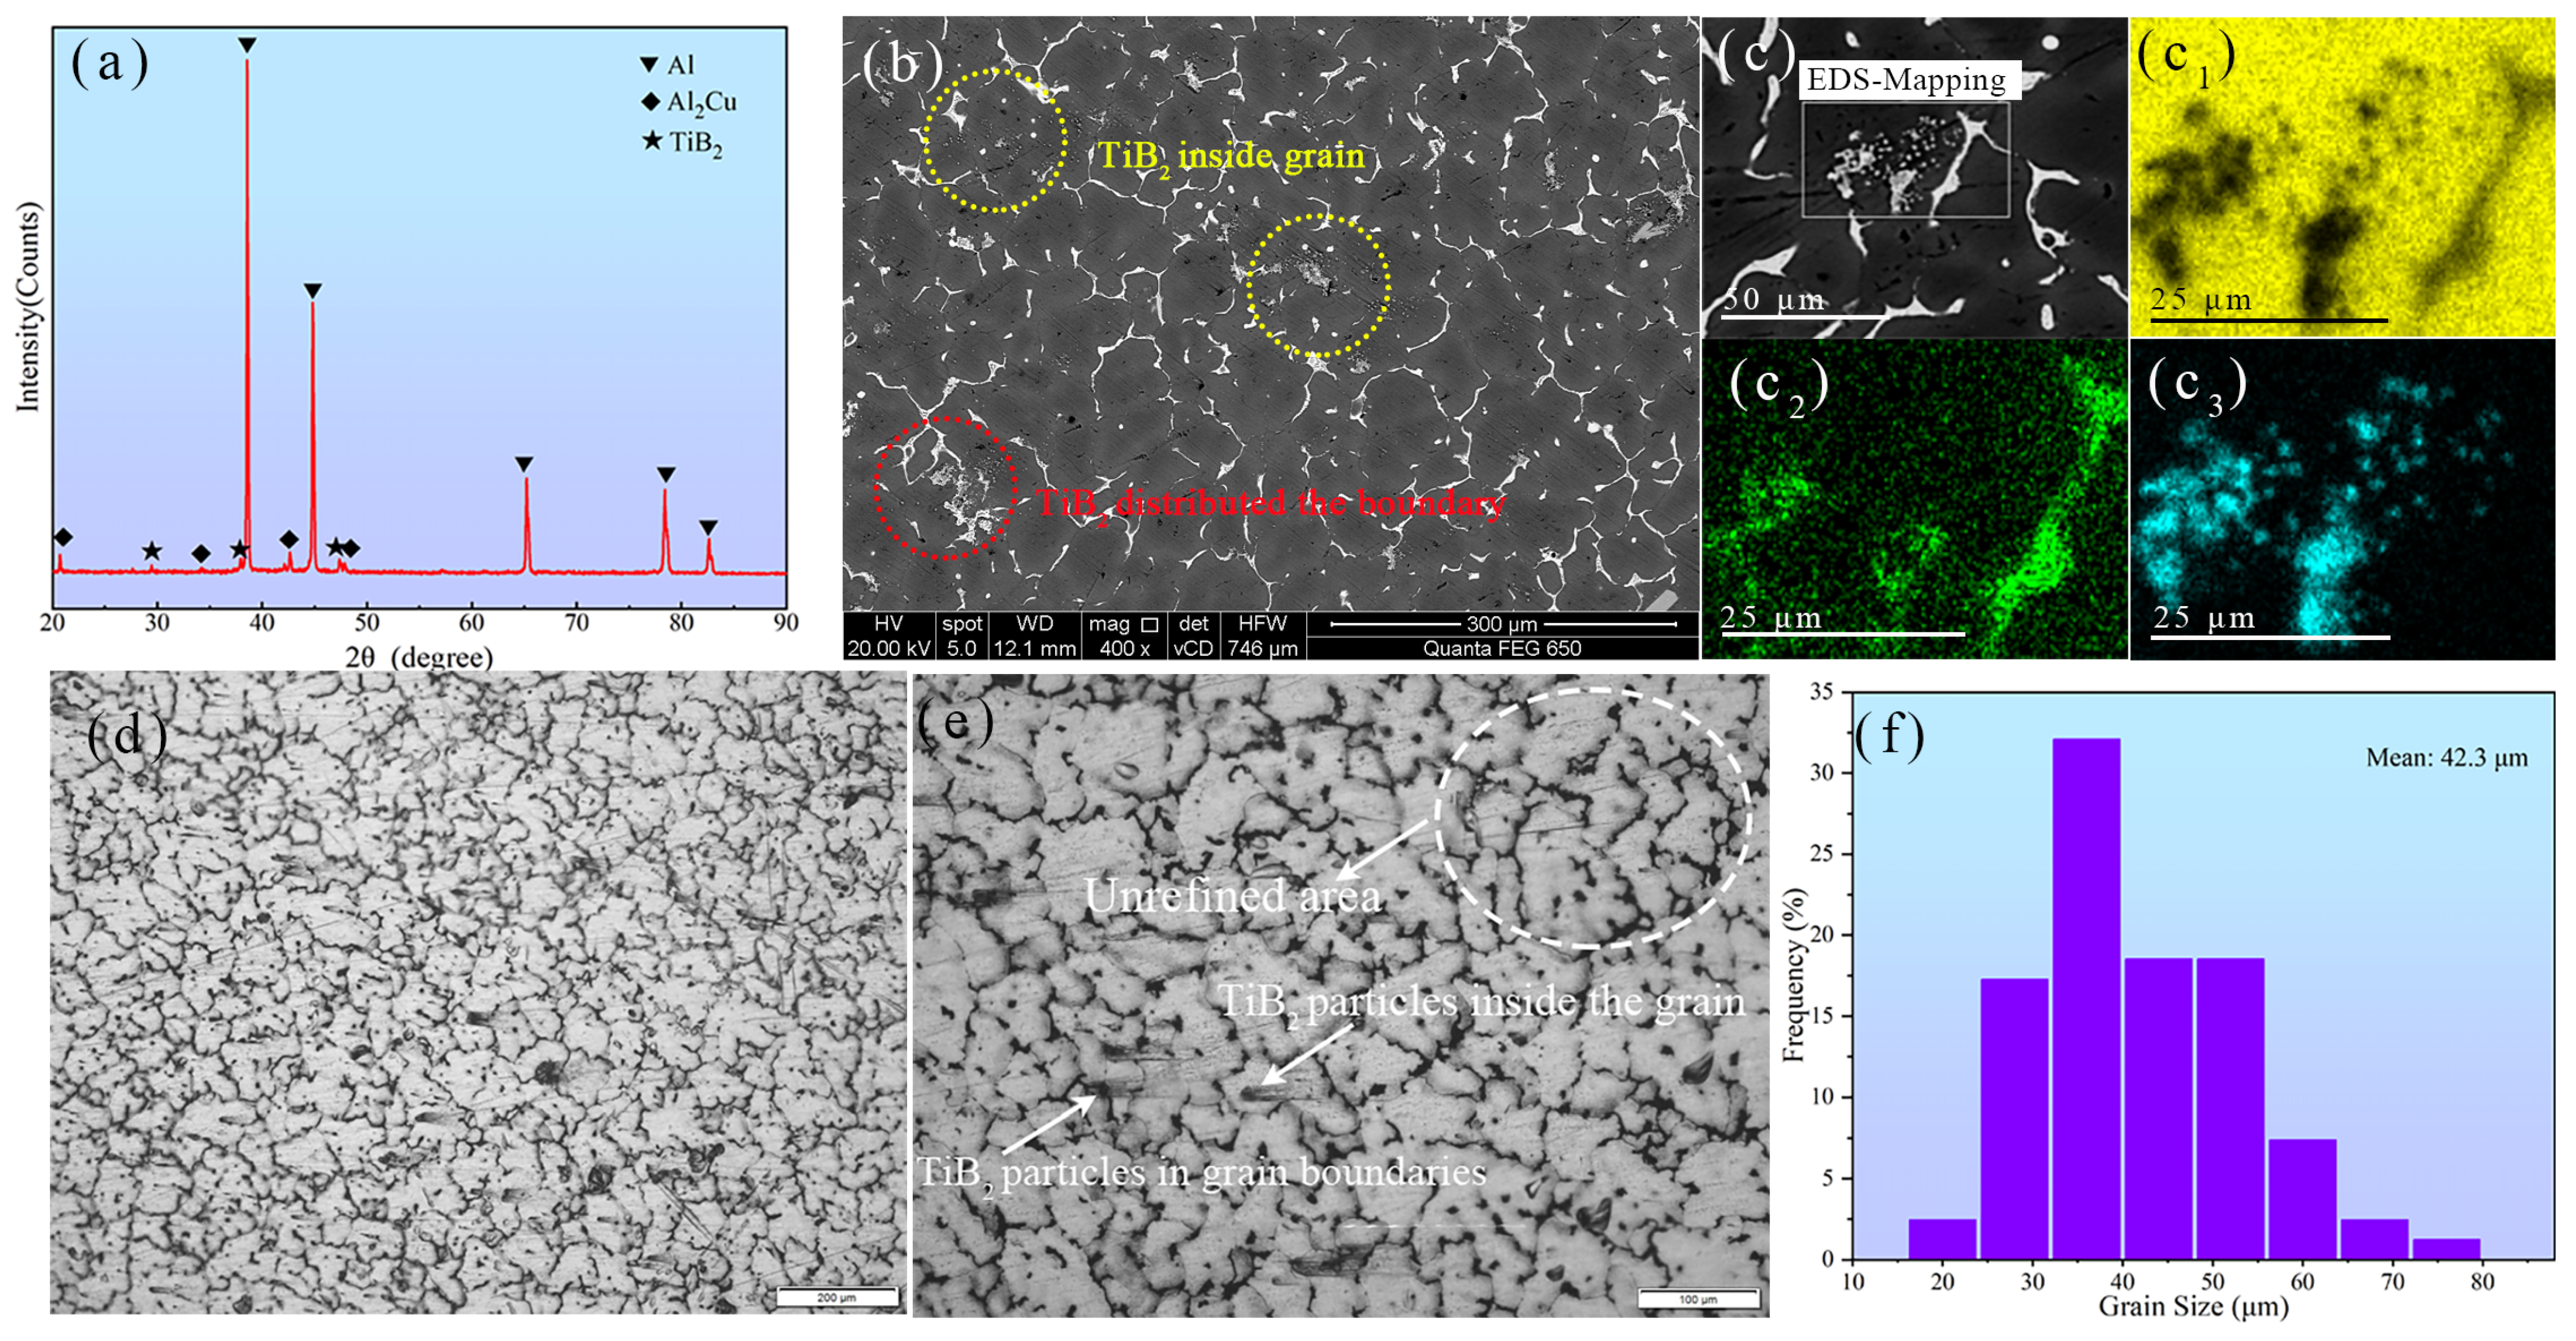
3.1. Microstructure of the As-Cast TiB2/Al–Cu–Mn–Cd Composite
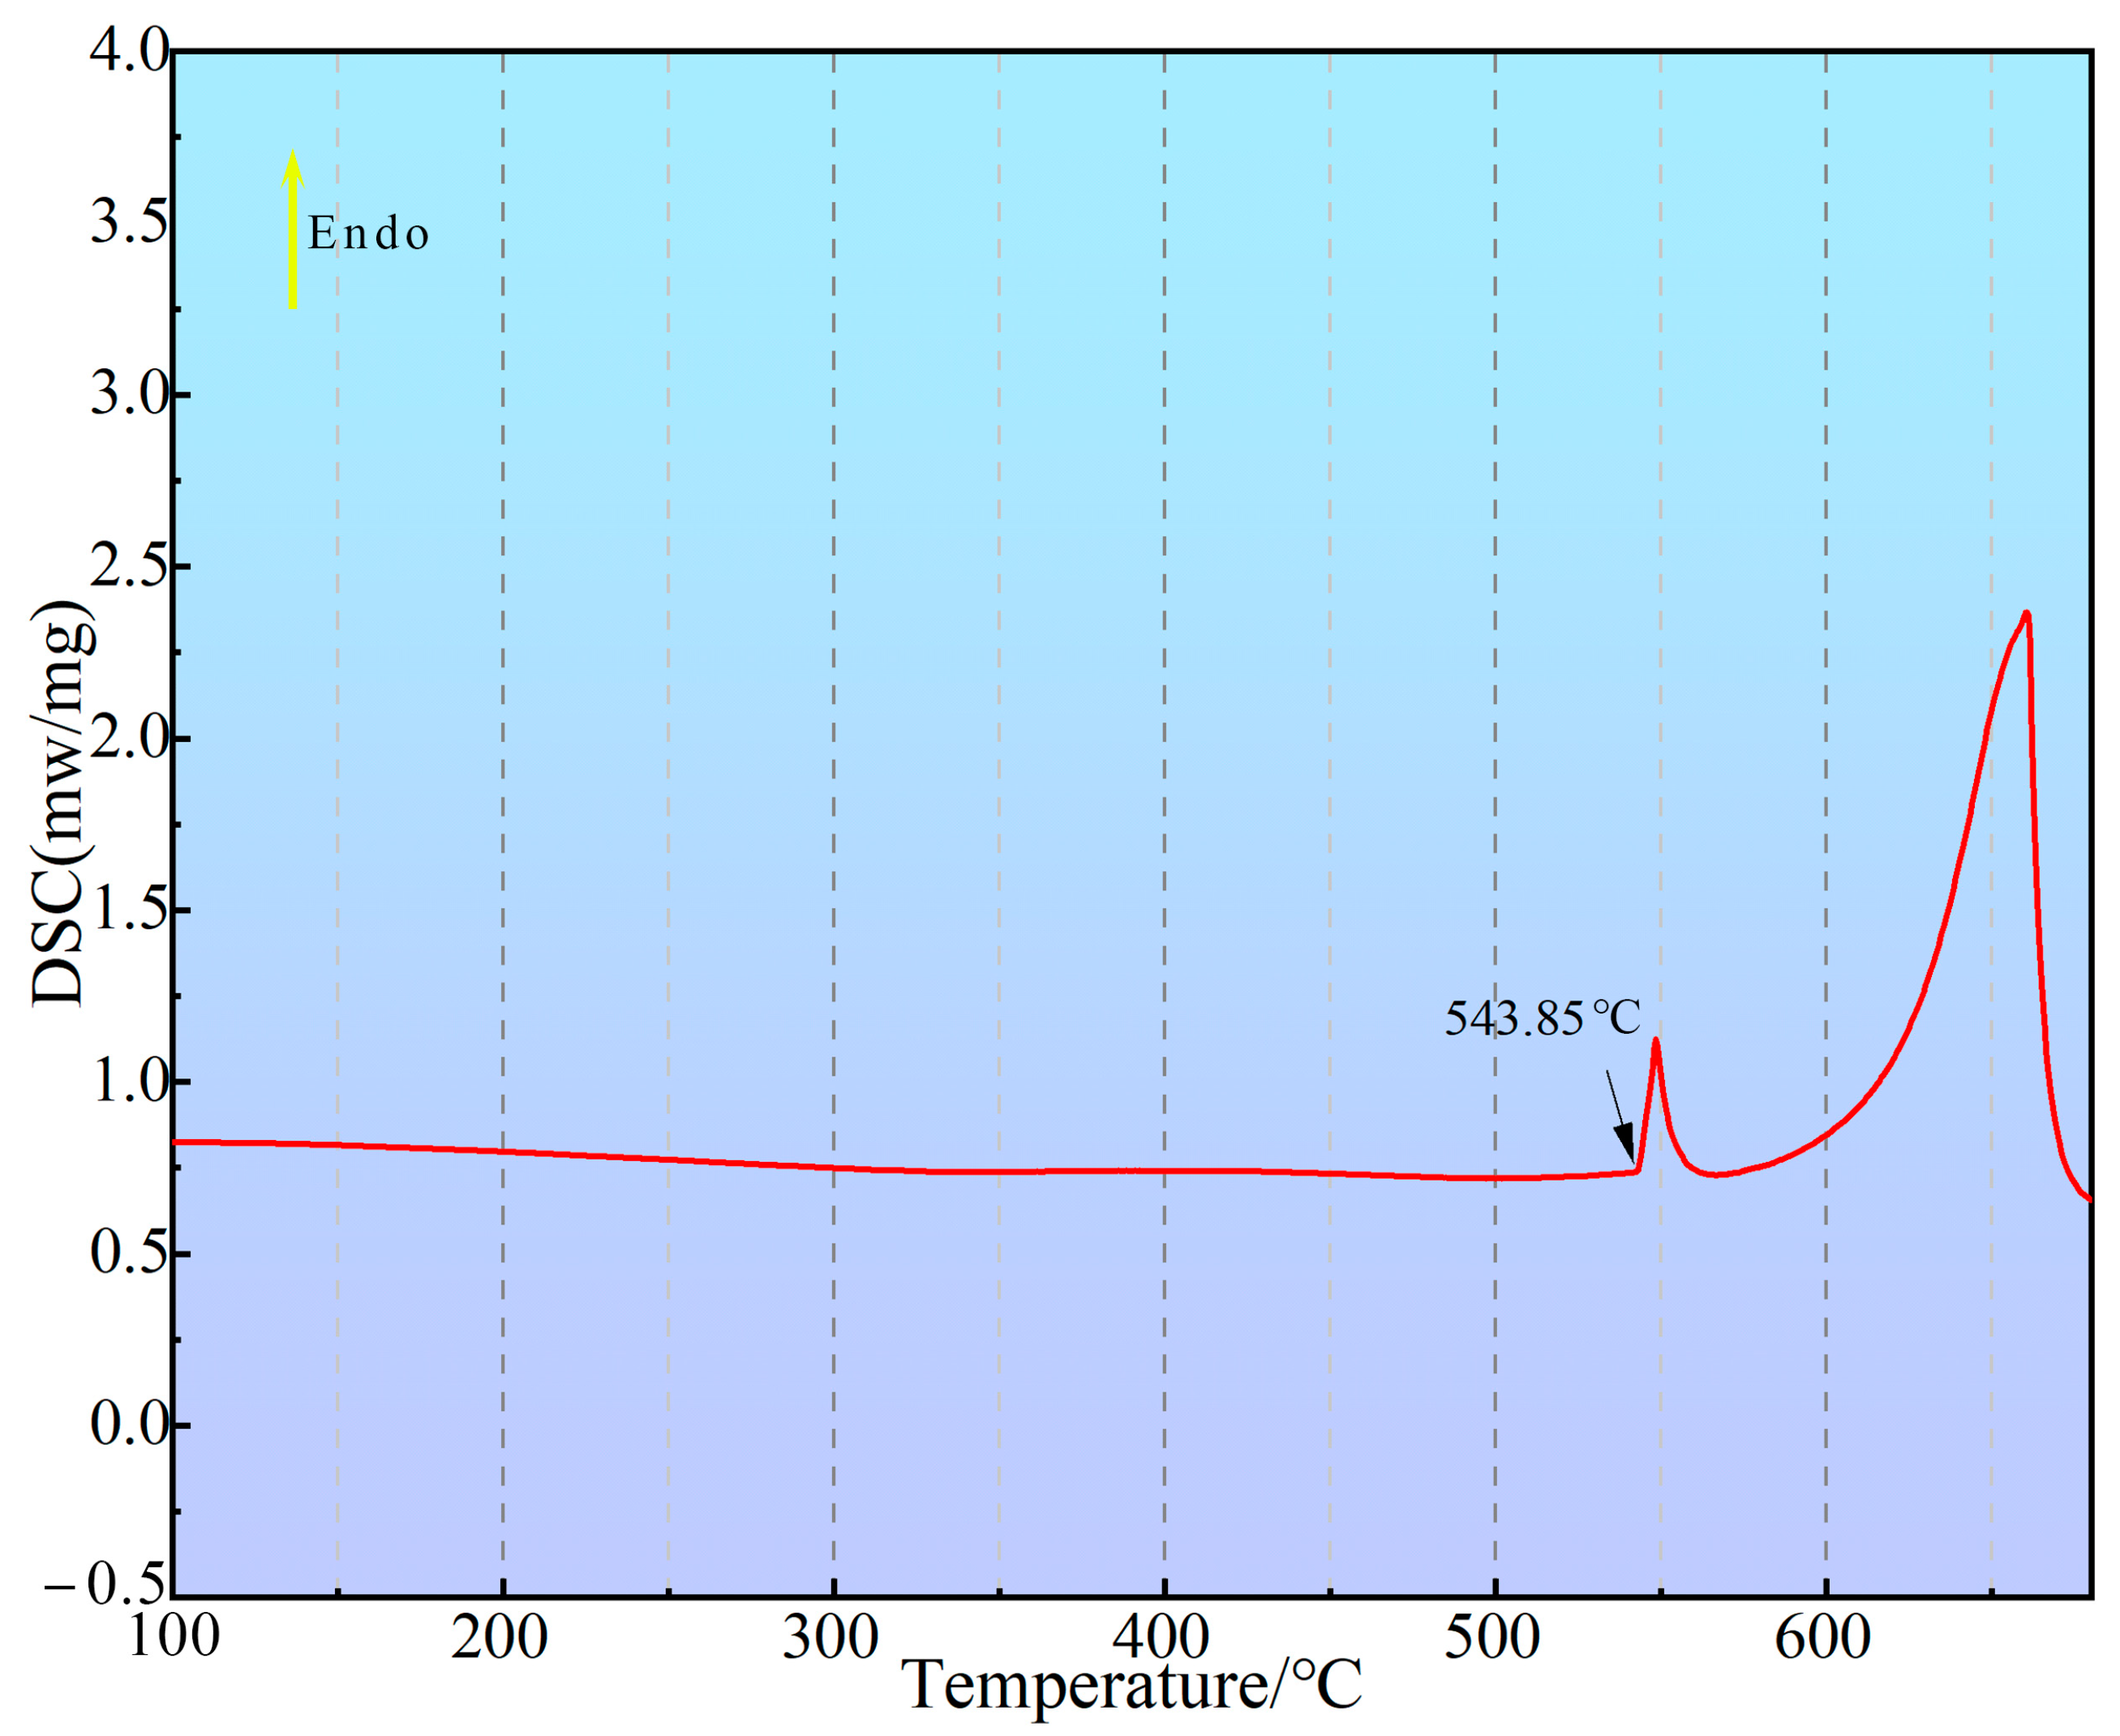
Figure 2 shows the microstructure of the as-cast TiB2/Al–Cu–Mn–Cd composite and the XRD pattern. The as-cast microstructure mainly contained α (Al) matrix, eutectic-phase Al2Cu and TiB2 phase, as displayed in Figure 2a. Due to low content of the microalloying elements, other phases containing microalloying elements such as Mn, Ti, Cd et al. could not be observed. As shown in Figure 2b,c, the as-cast microstructure of the composite was mainly composed of α (Al) matrix and eutectic-phase Al2Cu at the grain boundary. Specifically, most of the Mn and Cd elements were saturated in the Al matrix and precipitated in the aging process. In addition, most of the TiB2 particles were located within the α (Al) grain (marked with dotted yellow circles), and part of the TiB2 particles were distributed along the grain boundary (marked with a dotted red circle). The EDS mapping showed that the TiB2 particles distributed in the grain boundary coexisted with eutectic-phase Al2Cu, as displayed in Figure 2c–c3. Figure 2d,e show the as-cast grain morphology and size, and the composite exhibited fine equiaxed morphology. As displayed in the partially enlarged image, Figure 2e shows that the grain where the TiB2 particles existed was finer compared to the grain without TiB2 (marked by a dotted white circle), indicting that TiB2 enhanced the grain refinement. By grain-size statistics, the as-cast grain size of the TiB2/Al–Cu–Mn–Cd composite was 42.3 μm, as displayed in Figure 2f.

3.2. DSC Analysis

Over the process of heating from 25 °C to 600 °C, the DSC result of the composite exhibited heat absorption peaks at 543.85 °C and 660 °C, as displayed in Figure 3. Combined with the XRD result in Figure 2a, the peak at 543.85 °C represents the melting process of eutectic-phase Al2Cu. Based on the above results, to avoid over-burning defects a solution temperature below 543.85 °C is reasonable.

3.3. Optimization of the Solution Process

Optimization of the solution treatment can be acquired by a two-step method. For the first step, the composite was solutionized at 518 °C, 523 °C, 528 °C and 532 °C for 12 h to find the optimized solution temperature (OST). Subsequently, the composite was solutionized at the optimized temperature (determined by the first step) for various times (0–14 h) to acquire the optimized solution time. The above experimental scheme is displayed in Table 2.

3.3.1. Microstructure Evolution of TiB2/Al–Cu–Mn–Cd Composite in the Single-Stage Solution Treatment

Figure 4 shows the microstructure evolution of the TiB2/Al–Cu–Mn–Cd composite heated at different temperatures for 12 h and the EDS mapping results. Eutectic-phase Al2Cu distributed along the grain boundary dissolved into the α (Al) matrix during the solution treatment process. However, abundant residual phase still existed after solution treatment at 518 °C for 12 h, as displayed in Figure 4a. The EDS results in Figure 4b–b3 show that the residual phase is eutectic Al2Cu phase. Figure 4c displays that the residual phase further decreased when the solution temperature increased to 523 °C, suggesting that increasing the solution temperature could improve the dissolution efficiency. However, when the temperature further increased to 528 °C, black contrast phases appeared (marked by dotted yellow Yboxes) and were continuously distributed at the grain boundaries, as displayed in Figure 4d,e. EDS mapping results in Figure 4e–e4 show that the black contrast phase mainly contained oxygen elements, which is a typical feature of over-burning defects. This indicates that the solution temperature should be below 528 °C to avoid occurrence of over-burning defects, detrimental to overall mechanical strength. Therefore, the optimal process temperature is identified as 523 °C.
Figure 5 displays the microstructure evolution of the TiB2/Al–Cu–Mn–Cd composite heated at 523 °C for various periods (3–14 h). As the solution time continued, the second phase at the grain boundary gradually dissolved into α (Al). Figure 5a–d show that a large number of residual phases still existed in the microstructure when the solution time prolonged to 9 h. When the solution time extended to 11 h, most of the second phases were dissolved into the α (Al) matrix, as seen in Figure 5e. After further prolonging to 14 h, as displayed in Figure 5h, over-burning defects appeared in the microstructure. Figure 5i is the statistics of the area fraction for the residual phase and the hardness evolution in the solution process. With the solution time extended from 0 h to 14 h, the area fraction of the residual phase decreased from 5.08% to 0.36%. Specifically, the area fraction of the residual phase decreased sharply in the first 3 h, and further gently decreased in the period from 3 h to 10 h. Finally, the area fraction remained below 0.5% after solutionized at 523 °C for 11 h. The above results are consistent with the microstructure evolution in Figure 5a–h.
Meanwhile, in terms of microhardness, due to lack of solid solution strengthening of Cu atoms, the microhardness of the as-cast composite was only 76.55 HV. After the solution treatment at 523 °C for 14 h, the microhardness increased obviously from 76.55 HV to the peak hardness 87.9 HV. The hardness curve exhibits a similar rising tendency, ascribing to increase of the solid solubility of Cu atoms in the α (Al) matrix during the solution process. During the period 11 h to 14 h, the hardness exhibited a stable trend owing to the Cu atoms being greatly dissolved into the α (Al) matrix, manifesting that the Cu atoms had basically achieved complete dissolution. However, as a microstructure feature in Figure 5g,h, over-burning defects appeared when the solution time extended to 13 h and 14 h. To sum up, the microstructure evolution and microhardness curve indicate that treatment at 523 °C for 11 h is the optimal single-stage solution treatment.

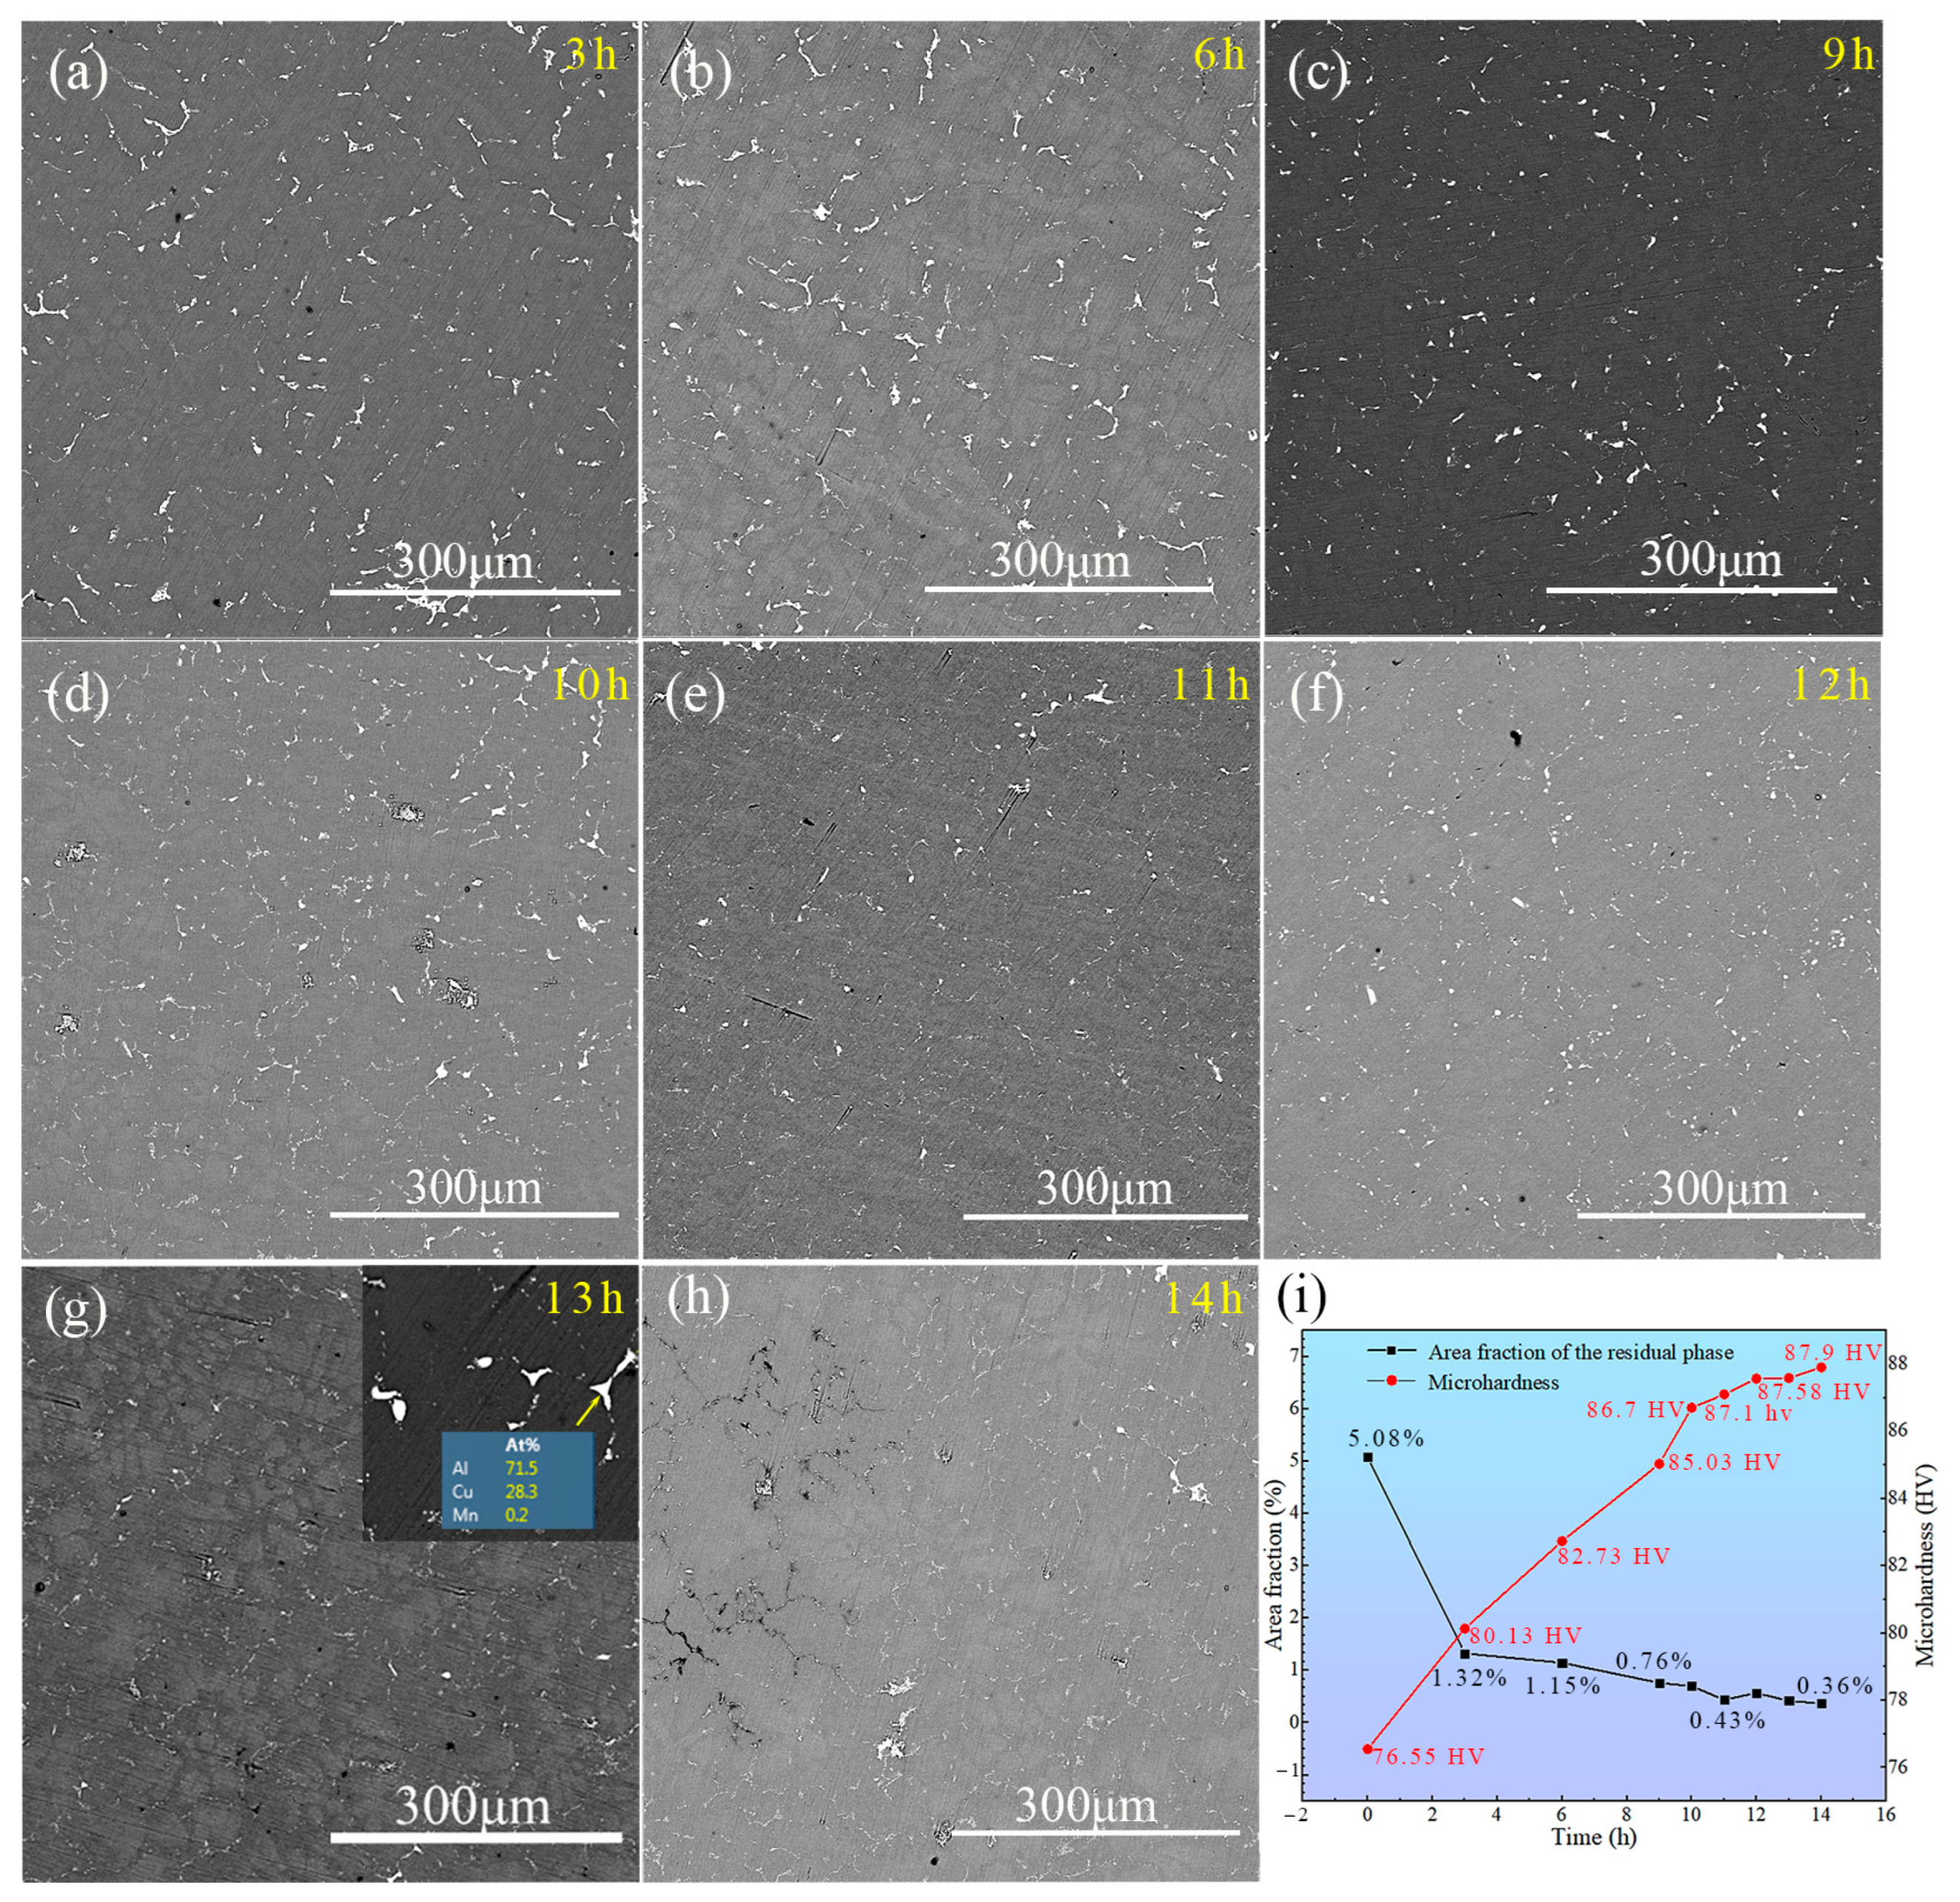
3.3.2. Microstructure Evolution of TiB2/Al–Cu–Mn–Cd Composite in Second-Stage Solution Treatment

However, as seen in the illustration in Figure 5g, some residual phases still existed in the triangle grain boundary. Because the diffusion path is longer in the triangle grain boundary, dissolution of those residual phases into matrix was hard to achieve at 523 °C. In addition, in increasing the single-stage solution temperature or extending the solution time, the over-burning defects appeared. Therefore, a second-stage solution treatment at higher temperature was conducted to solve the above phenomenon.
Figure 6 displays the microstructure evolution of the TiB2/Al–Cu–Mn–Cd composite (after pretreatment at 523 °C for 11 h) when heated at 535 °C for various periods (0.5–2 h). As seen in Figure 6a, the residual phase located in the triangle grain boundary further dissolved into the α (Al) matrix, and only a small amount of the residual phase existed in a local area (marked by dotted red boxes). Specifically, a lot of sub-micro phases were distributed discontinuously at the grain boundary, as shown in Figure 6e, and EDS point results indicated those phases consisted of Al, Cu and Mn elements. The phenomenon is consistent with the result of Ref. [33], and the sub-micro phases can be considered as T (Al20Cu2Mn3) phase. The T (Al20Cu2Mn3) phase is a highly temperature stable phase, so it is hard to dissolve into the α (Al) matrix. Fortunately, the size of the T phase is relatively fine and doesn’t damage mechanical properties. With the solution time extended to 1 h, the residual phases located in the triangle grain boundary completely disappeared, which indicates that the residual phase located in the triangle grain boundary could be further dissolved by increasing the second-stage solution temperature to 535 °C and holding for 1 h, as displayed in Figure 6b,f. However, after further extending to 1.5 h and 2 h, over-burning defects (marked by dotted red circles) appeared in the microstructure, as displayed in Figure 6c,d, and can be obviously observed in the enlarged images in Figure 6g,h, which indicates that the solution temperature exceeded the melting point of the residual phase. Therefore, treatment at 535 °C for 1 h is the optimal second-stage solution treatment.

3.4. Optimization of the Aging Process

3.4.1. Aging-Hardening Behavior at Different Temperatures

Figure 7 shows the variations of the hardness with the increasing aging times at 150 °C, 170 °C and 190 °C. Each data point represents an average of five measurements, with standard deviation shown as error bars. Hardening curves at 150 °C, 170 °C and 190 °C were quite similar. Initially, a particularly rapid increase appeared in the hardness curves at the three different aging temperatures. As the aging continued, peak hardness was achieved with 145.6 HV at 15 °C, 164 HV at 170 °C and 157 HV at 19 °C. Towards the later stages, the hardness values slightly declined but remained consistent. Comparing the hardness curves at 15 °C, 170 °C and 190 °C, the peak hardness at 170 °C was the highest and at 150 °C was the lowest. However, in terms of aging response, the composite aged at 190 °C required less time to reach the peak hardness. Based on the above hardness curves results, aging at 170 °C for 12 h is the optimal aging treatment.

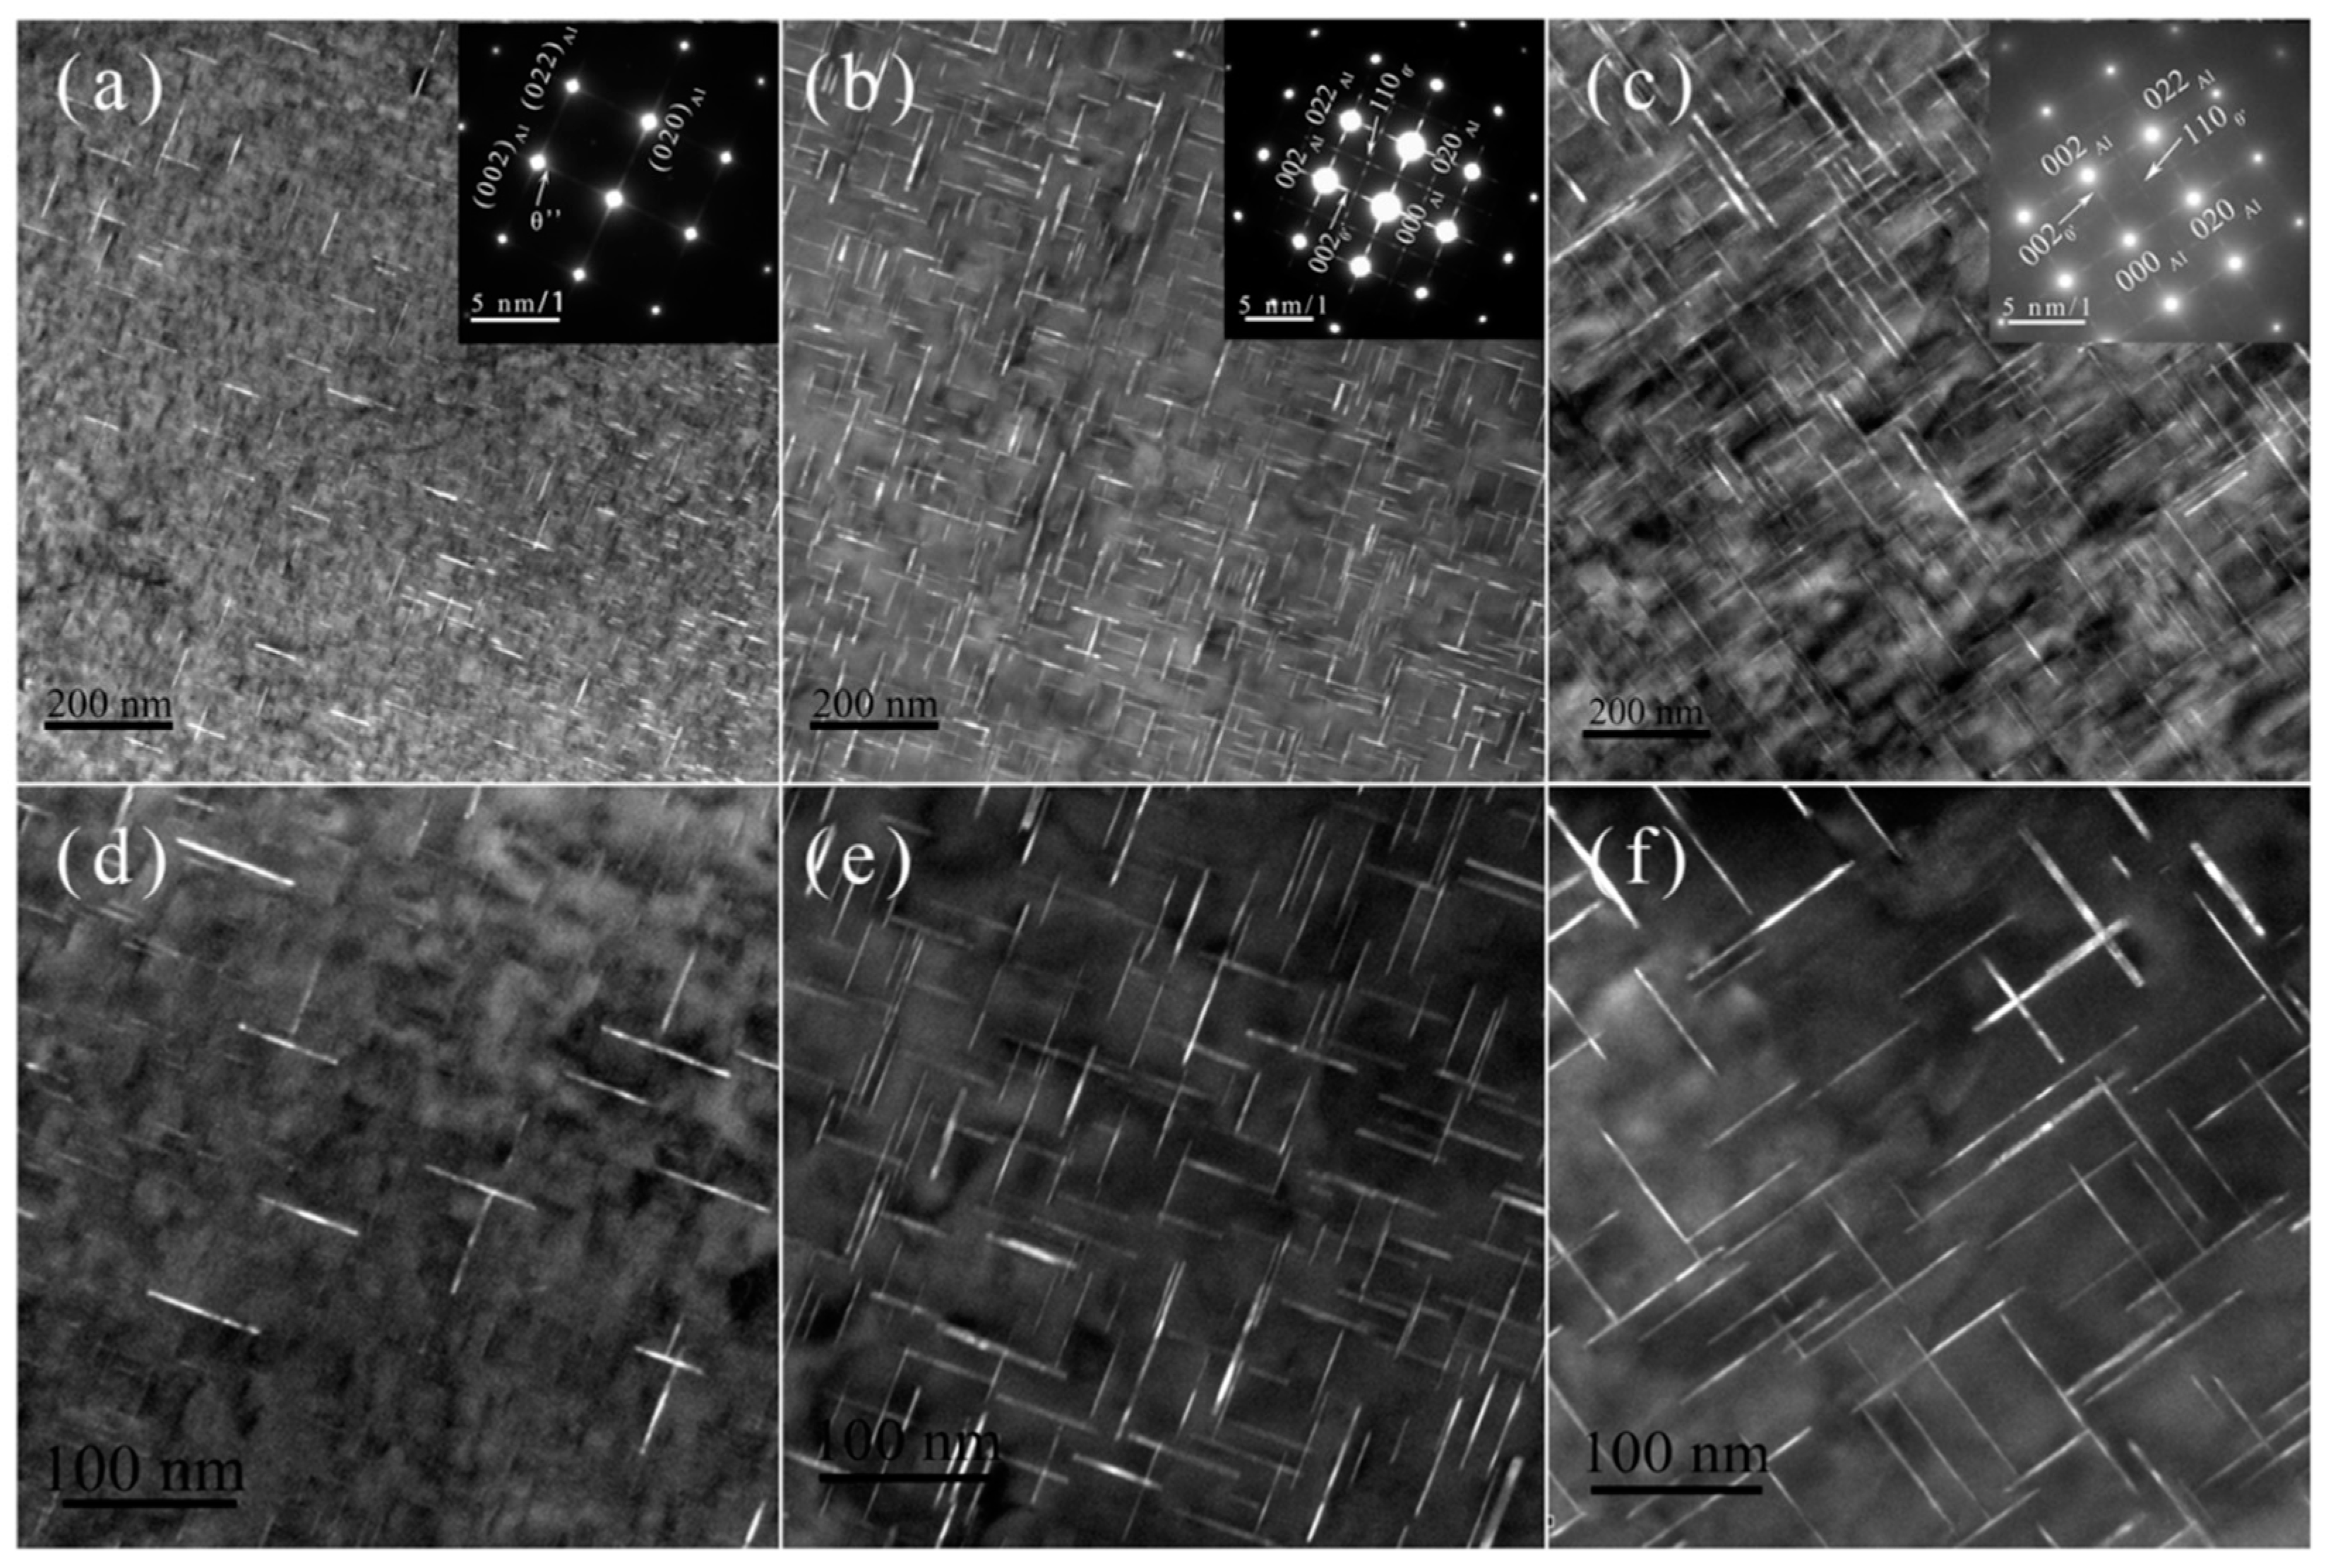
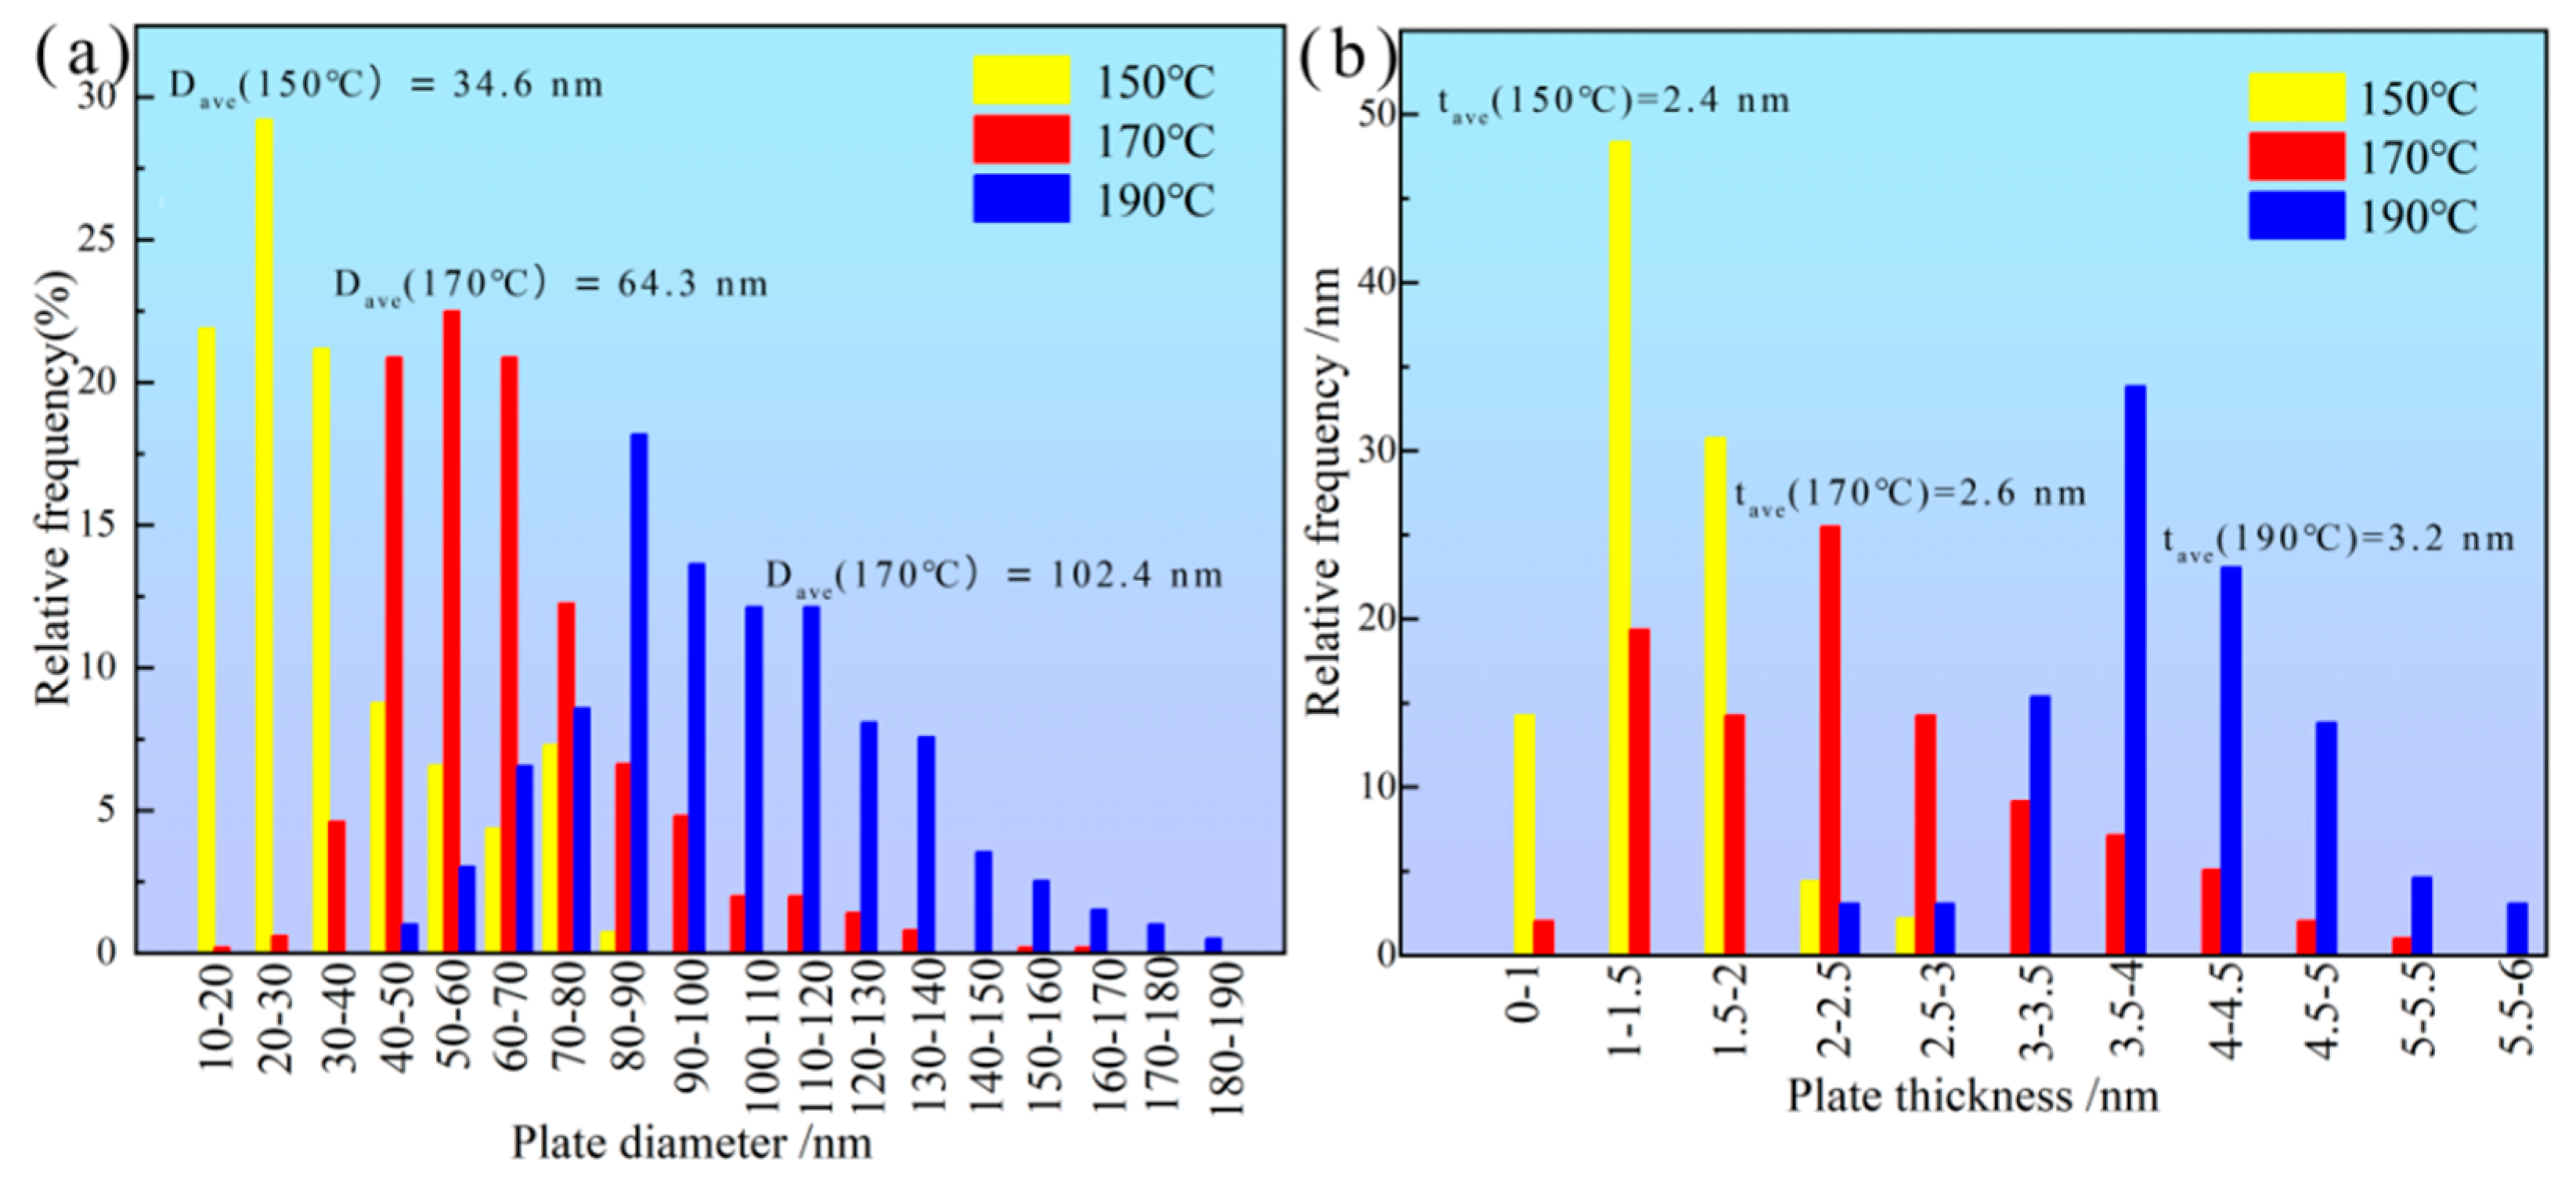
3.4.2. Peak-Aged Microstructure at Different Temperatures

Reportedly, heat treatment can enhance the strength of Al–Cu alloys, resulting in formation of metastable precipitates. For Al–Cu alloys, θ′ phase is the dominating precipitate, and the precipitation sequence is Alss→Guinier–Preston (GP I zones)→θ″ (GP II zones)→θ′ (Al2Cu)→θ (Al2Cu) [34,35]. Therefore, it was necessary to observe the type, size and quantity of the dominating precipitates in the peak-aged composite. Figure 8 displays the TEM micrograph and SAED results of the peak-aged TiB2/Al–Cu–Mn–Cd composite at the different aging temperatures. As displayed in Figure 8a–c, nanoscale plate-like precipitates with high densities were evident in the peak-aged composite, which could be identified as θ″ and θ′ [36]. The corresponding SAED were performed to determine the type of precipitates, as shown in the upper-right corner of Figure 8a–c. The SAED pattern in Figure 8a shows that a series of weak streaks appeared around {002}Al spots, which indicates that the dominating plate-like precipitates of the peak-aged state at 150 °C were θ″. With the aging temperature increased to 170 °C, apart from the weak streaks caused by θ″, spots representing θ′ (marked by white arrows in the SAED pattern) could also be observed, as displayed in Figure 8b. The above SAED results indicate that the plate-like precipitates were composed of θ′ and θ″. Meanwhile, compared to the plate-like precipitates in Figure 8a,d, the number density of the plate-like precipitates in Figure 8b,e is less than in the aging treatment at 150 °C. The number density of plate-like precipitates further decreased when the aging temperature increased to 190 °C, as shown in Figure 8c,f. In addition, the SAED pattern in Figure 8c reveals that the weak streaks around the {002} Al spots disappeared, and the spots representing θ′ became more obvious. This phenomenon manifests that most of the plate-like precipitates were θ′ after the aging treatment at 190 °C for 2 h.
Figure 9 shows the diameter and thickness distribution of the plate-like precipitates. With the aging temperature increasing from 150 °C to 190 °C, the average diameter of the plate-like precipitates in the peak-aged state increased from 34.6 nm to 102.4 nm, and the average thickness of the precipitates in the peak-aged state increased from 2.4 nm to 3.2 nm, as displayed in Figure 9a,b. Specifically, comparing the size distribution at the different aging temperatures, the size of the plate-like precipitates treated at 170 °C were more uniform, with an average diameter of 64.3 nm and a thickness of 2.6 nm.

3.5. Mechanical Properties

3.5.1. Tensile Property at Room Temperature
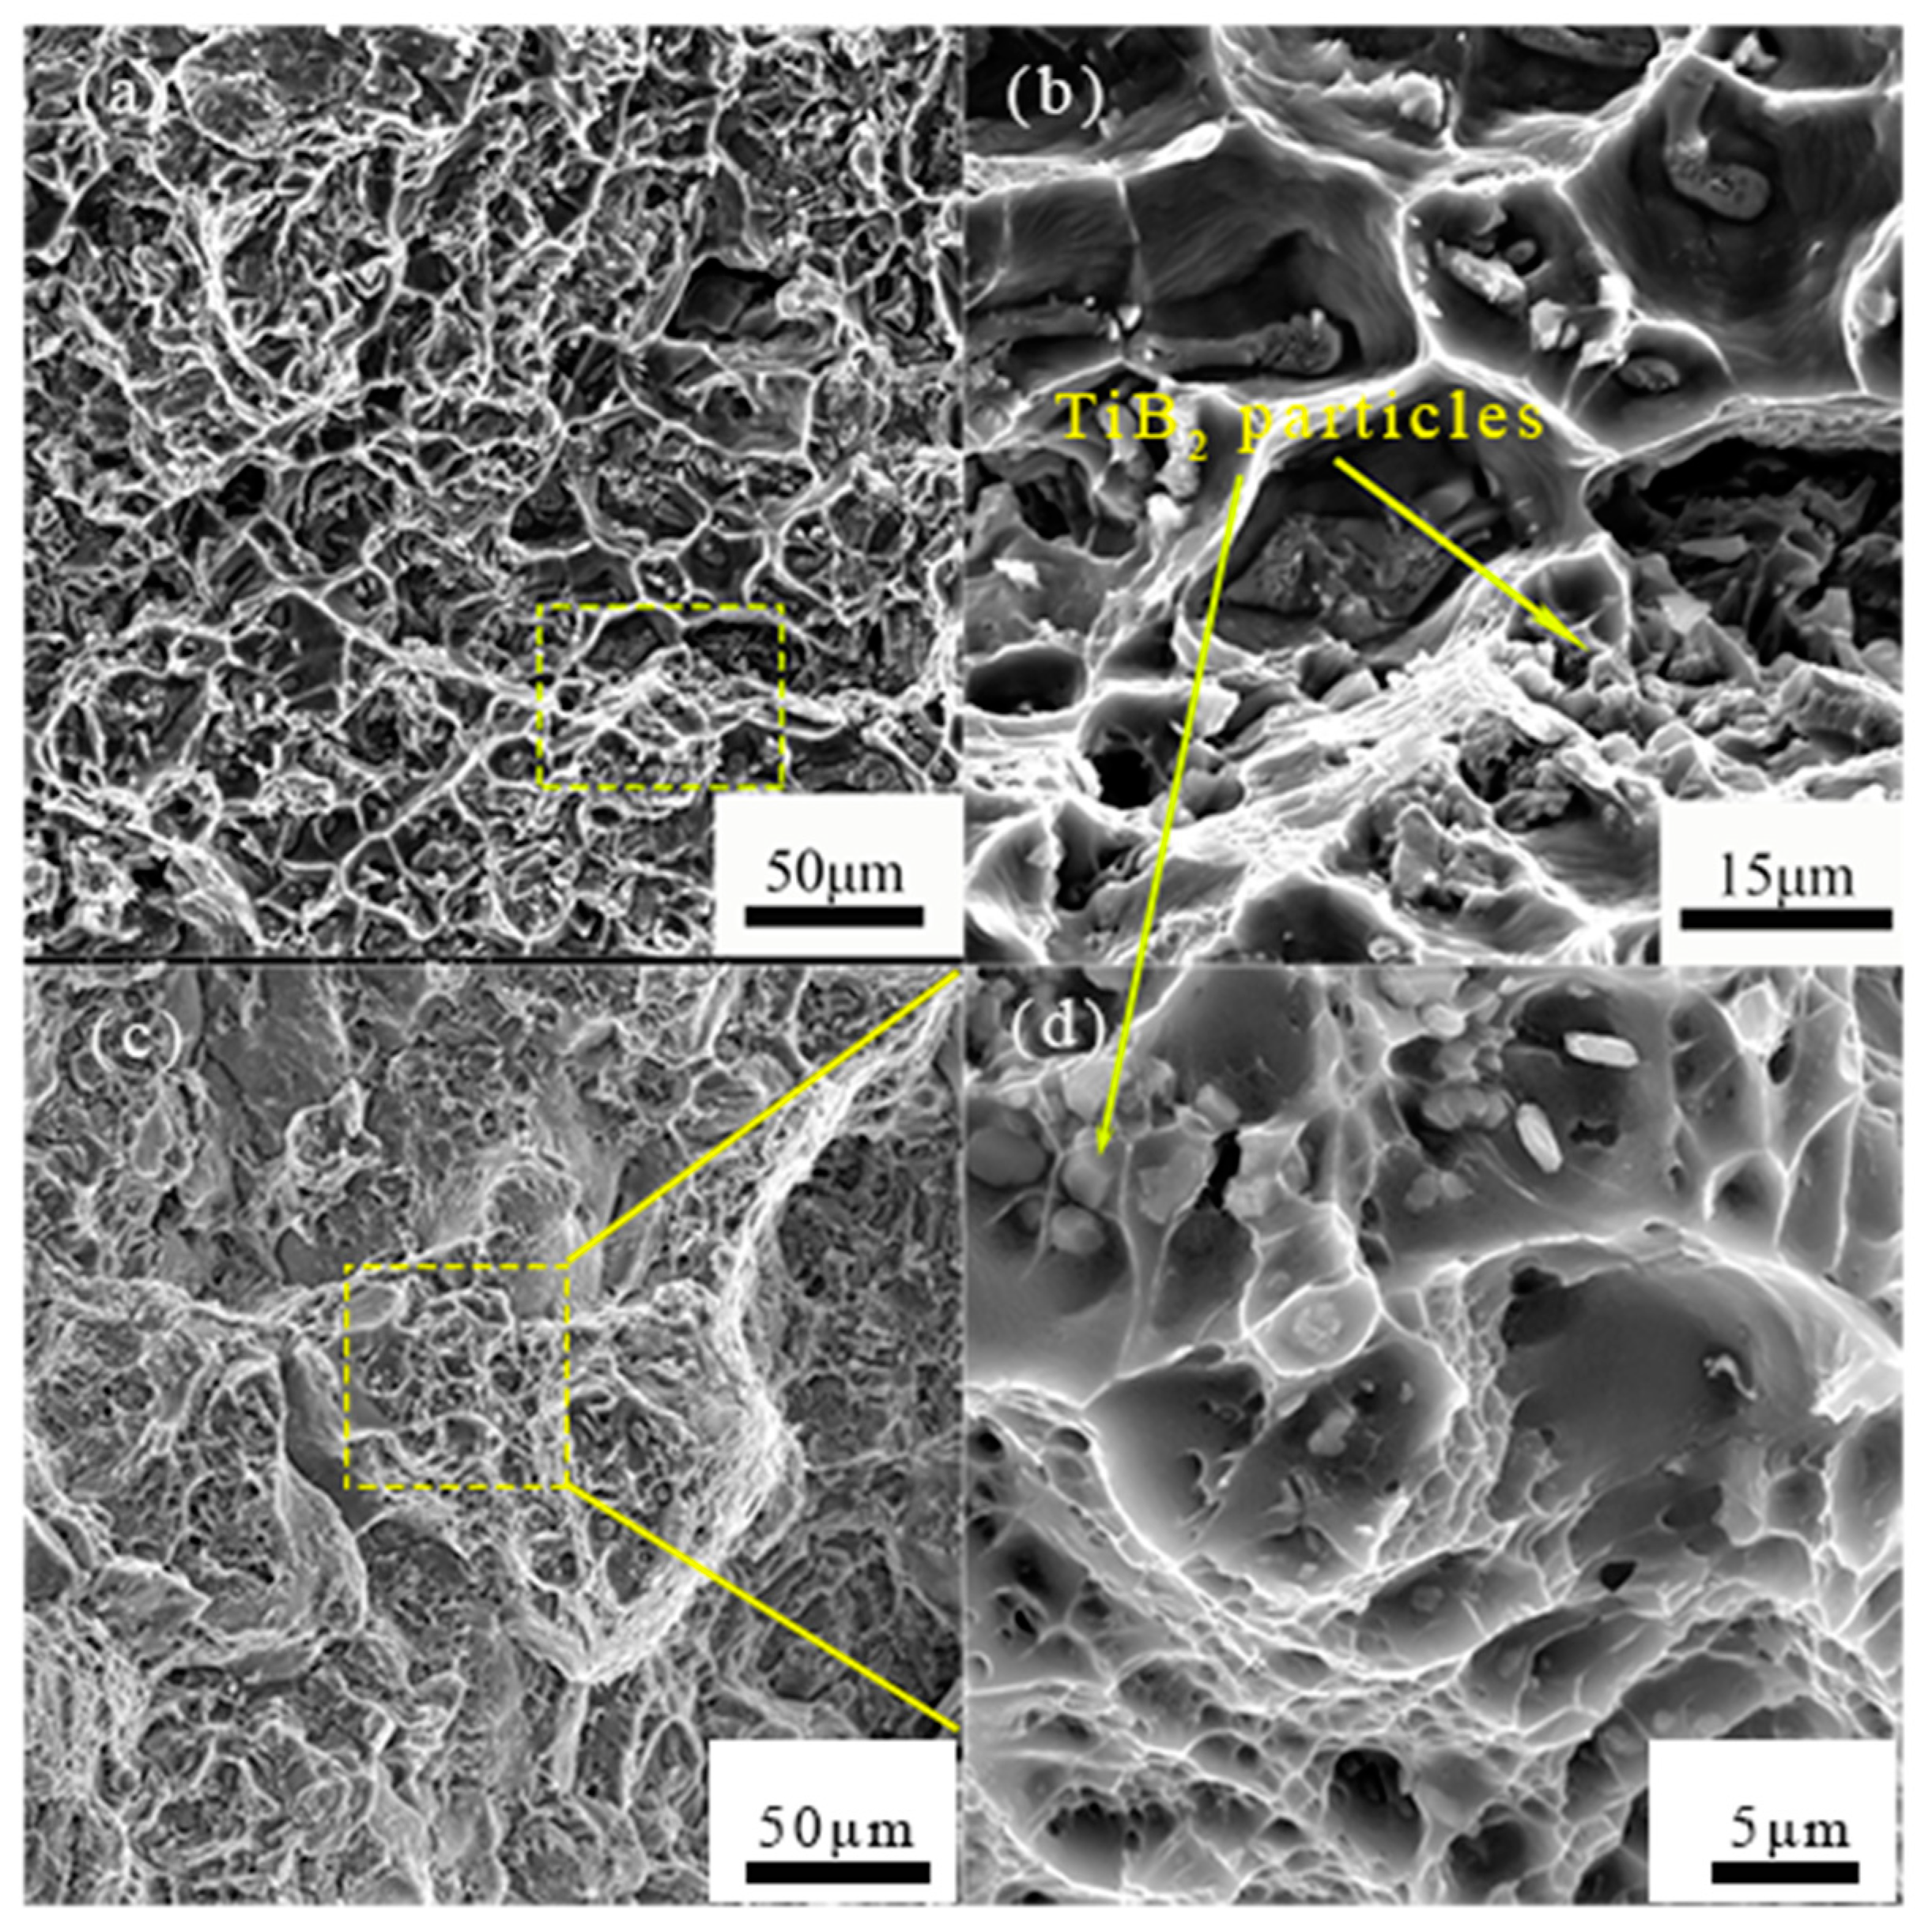
The average ultimate tensile strength (UTS), yield strength (YS) and elongation (EL) in the different states are exhibited in Figure 10. The UTS, YS and EL of the as-cast composite were 211.9 MPa, 115.8 MPa and 8.38%, respectively. After taking the above optimal heat treatment (first-step solution at 523 °C for 11 h followed by second-step solution at 535 °C for 1.0 h and aged at 170 °C for 12 h), the UTS and YS reached 523.0 MPa and 451.8 MPa, respectively. However, the value of EL slightly decreased from 8.78% to 8.24%
Table 3 presents the summary of the tensile properties of the reported particle-reinforced Al–Cu matrix composites [11,18,20,37,38]. Comparatively, the TiB2/Al–Cu–Mn-Cd composite subjected to the optimal heat treatment in our work has exhibited better strength–elongation combinations.

3.5.2. Fractography

Figure 11 displays the fractograph of the TiB2/Al–Cu–Mn–Cd composite in the as-cast and peak-aged states. As shown in Figure 11a,c, abundant tear edges are observed in Figure 11a, indicting a shear fracture mode. With adoption of the heat treatment, small dimple and cleavage planes simultaneously appeared, implying that the fracture mode had changed to a shear/cleavage mixed mode [40], as displayed in Figure 11c. Particularly, Figure 11b,d show that TiB2 particles appeared in the center of a small dimple (as marked by yellow arrows), manifesting that the TiB2 particles played the role of bearing stress during the deformation and fracture process.

4. Discussion

4.1. Nucleation Behavior at Different Aging Temperatures

The precipitation process of the supersaturated solid solution was mainly controlled by diffusion of the solute, and the aging driving force in the different aging temperatures was also different [39].
On the one hand, according to nucleation theory, the nucleation process would be accompanied by an increase in surface free energy and a decrease in volume free energy. The increase in the surface free energy would hinder the precipitation process, while existence of supercooling, i.e., the temperature difference between solution and aging treatment, as a driving force would promote the precipitation process. When the composite was aged at 190 °C, the degree of supercooling was relatively small; that is, the precipitation driving force was powerless, which was not conducive to nucleation precipitates. Finally, the number density of the precipitates was relatively low in the peak-aged composite at 190 °C, as displayed in Figure 8c,f. However, the time to reach peak hardness was shortened owing to the faster diffusion rate of Cu atoms at 190 °C, and the hardness dramatically increased in the early aging stage (0–2 h), as shown in Figure 7.
On the other hand, the growth of the plate-like precipitates was controlled by the diffusion of Cu atoms. According to diffusion theory, the temperature was the most important factor affecting the diffusion process. When the aging temperature was 150 °C, the aging temperature was relatively low, and the migration of Cu atoms was slow at 150 °C. This would eventually result in retarded growth of the plate-like precipitates, and lead to finer sizes of the plate-like precipitates with weak strengthening ability, so the hardness value of the TiB2/Al–Cu–Mn–Cd composite peak-aged at 150 °C was also maintained at a low level.
When the composite aged at 170 °C, the degree of supercooling required for nucleation of the plate-like precipitates and for sufficient diffusion rates of Cu atoms could be provided. A sufficient number density of the plate-like precipitates precipitated under the supercooling provided at 170 °C. On the other hand, the plate-like precipitates grew to a size large enough to effectively impede dislocation slips. Therefore, the peak-aged hardness aged at 170 °C reached the highest point.

4.2. Kinetics Behavior of Precipitation during Aging at 170 °C

Figure 12 shows the precipitates evolution of the TiB2/Al–Cu–Mn–Cd composite aged at 170 °C for various time (0.5 h, 3 h, 12 h and 24 h). As displayed in Figure 12a, a large amount of uniformly dispersed needle-like precipitates were observed in the Al matrix. The corresponding SAED in Figure 12e indicated that those precipitates were θ″. With the aging time extended to 3 h and 12 h, the size of the precipitates became coarse, and spots representing θ′ appeared (as marked in the SAED pattern) in Figure 12b,c. After further increasing the aging time to 24 h, the weak streaks caused by θ″ disappeared, indicating that the plate-like precipitates were mainly composed of θ′, as displayed in Figure 12d. Dark-field images exhibited well the variation of the number density of the plate-like precipitates at different aging times, as displayed in Figure 12f–h. Figure 13a is the statistics of the precipitates sizes during aging at 170 °C for 0.5 h, 3 h, 12 h and 24 h. The result implies that with the aging time increasing, the average diameter of the plate-like precipitates also increased from 13.75 nm at 0.5 h to 38.20 nm at 3 h, 64.30 nm at 12 h and 73.59 nm at 24 h. The number density of the plate-like precipitates gradually decreased as the aging time increased. With the aging time extended to 24 h, the number density of the plate-like precipitates decreased from 7.011 × 10²² m−3 at 0.5 h to 2.482 × 10²² m−3 at 3 h, 4.266 × 10²¹ m−3 at 12 h and 3.872 × 10²¹ m−3 at 24 h, as revealed in Table 4.
In addition, apart from the plate-like precipitates, there were abundant spherical precipitates with an average diameter of ~3 nm in the Al matrix (marked by red arrows), as shown in Figure 12b,c. The obvious spherical precipitates are exhibited in Figure 12i. A part of the spherical precipitates existed in isolation, and the other part were adjacent to the ends of the θ′ precipitates (marked by dotted yellow circles). An enrichment of Cd in the spherical precipitates was confirmed based on the EDS mapping results in Figure 12i1–i4, and no other elements were enriched. This phenomenon indicated that the spherical precipitate was a Cd-rich phase. The Cd-rich precipitates observed in Ref. [41], which were considered to be precipitated in the early aging stage, accompanied an excellent precipitation strengthen in the Cd-containing alloys. Figure 13b shows the size evolution of the Cd-rich precipitates during the aging process at 170 °C, and the diameter of the Cd-rich precipitates slightly increased from 2.33 nm at 3h to 3.76 nm at 12 h and 5.42 nm at 24 h. However, comparing the number density evolution during the aging process, the number density of the Cd-rich precipitates decreased significantly when the aging time extended to 24 h, as shown in Figure 12c,d.
In order to clarify the structure evolution of the plate-like and spherical precipitates over the aging process at 170 °C, HRTEM micrographs and FFT patterns of the precipitates are exhibited in Figure 14. The corresponding HRTEM and FFT images of the plate-like precipitates aged at 170 °C for 0.5 h are given in Figure 14a–a2. A series of bright streaks around spots {002}Al appeared in the FFT pattern, confirming that the precipitates of the A zone in Figure 14a were θ″ or GP zone, as displayed in Figure 14a1. However, GP zone usually tends to precipitate in the naturally aging process, according to the Ref. [42]. Thus, the plate-like precipitates in Figure 14a were θ″ with several atomic layers of thickness. The magnification image of the A zone also confirmed that the interface demonstrated a completely coherent relationship between θ″ and the Al matrix, as displayed in Figure 14a2. Similar interface characteristics were reported in Ref. [35]. With the aging time extended to 3 h and 12 h, the size of the plate-like precipitates obviously coarsened, as shown in Figure 14b,c. Meanwhile, the FFT pattern of the C zone in Figure 14c1 indicated that part of θ″ have transferred to θ′. According to previous research [43], interfaces were coherent between an α (Al) matrix and the broad faces of θ′, but semi-coherent interfaces were often formed between the side faces of θ′ and α (Al). However, as displayed in the enlarged image of the C zone, Figure 14c2 shows that the side faces of θ′ still revealed coherent interface relationships with the α (Al) matrix. Shen et.al [44] observed a similar interface relationship between θ′ and the α (Al) matrix, and they reported that θ′ was found to be formed by in situ transformation from θ″ with the same interface structure characteristic. Thus, the θ′ (Al2Cu) precipitate aged at 170 °C for 12 h may have been formed by in situ transformation from θ″.
In the aspect of the structure evolution for the Cd-rich precipitates, it is worth noting that the Cd-rich precipitates cannot observed in Figure 14a. According to Ref. [45], after APT results had confirmed that Cd existed in a matrix in the form of nano-scale atomic clusters precursor in the early aging stage, Cd could not be observed by HRTEM owing to lower resolution. With the aging time extended to 3 h, the Cd-rich precipitates could be observed in the HRTEM images, as shown in Figure 14b. The enlarged image of the B zone (shown in the top right illustration) showed that the Cd-rich precipitates with diameters of 2~3 nm maintained completely coherent interface relationships. The FFT pattern of the Cd-rich precipitates was consistent with the interface characteristics, as shown in Figure 14b1. No additional sets of diffraction spots arose in the FFT pattern, apart from the spots caused by the Al matrix. The IFFT result of the B zone in Figure 14b2 indicated that lattice distortions did not generate around the interfaces in the α (Al) matrix ascribing to the coherent interfaces between the Cd-rich precipitates and the α (Al) matrix. The enlarged image of the D zone (shown in the illustration of Figure 14c) showed the structure of the Cd-rich precipitates aged at 170 °C for 12 h, and the sizes of the Cd-rich precipitates had increased to 8~10 nm. Compared to the FFT result in Figure 14b1, there were still no extra spots caused by the Cd-rich precipitates. However, the spots caused by the α (Al) matrix became more blurry, as displayed in Figure 14c3. The IFFT result of the D zone showed that severe lattice distortion had occurred inside and around the Cd-rich precipitates, as marked by the “T” red signs in Figure 14c4, which can reasonably explain the blurriness in Figure 14c3.
After further increasing the aging time to 24 h, as shown in Figure 14d, the coherent interfaces between θ′ (Al2Cu) and α (Al) were broken, indicating that the aging treatment at 24 h had destroyed the coherent relationships between the side faces of θ′ (Al2Cu) and the α (Al) matrix.

4.3. The Connection between Hardness and Precipitates Evolution during Aging Process

During the aging process at 170 °C, the hardness trend reflected the evolution of the sizes, number densities and structures of the θ′/θ″ and Cd-rich precipitates. As displayed in Figure 12 and Figure 14, the precipitates experienced a process of nucleation, growth and ripening in the composite aged at 170 °C for 0–24 h.
To deeply clarify the evolution of the microstructure and microhardness during the aging process, the relationship curves between the microhardness and the precipitates characteristics and a schematic diagram of the microstructure evolution are presented in Figure 15. As shown in Figure 15, in the beginning of the aging treatment (0.5 h), the θ″ precipitates with an average diameter of 13.74 nm had nucleated in the Al matrix, and the number density reached 7.011 × 10²² m−3. It is well known that the growth process of θ″ is determined by the diffusion of Cu atoms [46]. The growth of θ″ was hindered because Cu atoms could not be supplied by diffusion in the short aging period (0.5 h) to meet the needs of θ″ growth. So the sizes of the θ″ precipitates exhibited a finer morphology, as displayed in Figure 12a and Figure 14a. However, the sizes of the θ″ precipitates were too small, and the ability to hinder dislocation slip was poor. Meanwhile, the Cd-rich precipitates existed in the matrix in the form of precursor clusters in the early aging stage (0.5 h), so precipitation strengthening from the Cd-rich precipitates was minimal. Therefore, owing to the fine morphology of θ″ and the lack of precipitation strengthening of the Cd-rich precipitates, the hardness value of the composite was only 88.28 HV and in under-aged condition at 0.5 h. As displayed in the schematic diagram of the microstructure, the precipitation strengthening contribution of the composites aged for 0.5 h mainly arose from the θ″ precipitates.
With the aging time increasing to 3 h, part of the θ″ precipitates transformed to θ′ and significant growth occurred, which ascribes to sufficient Cu atoms provided over the longer period (3 h) of diffusion, as displayed in Figure 12b and Figure 14b. In addition, the Cd-rich precipitates with sizes of 2–3 nm emerged in the Al matrix. As shown in Figure 15, the average diameter of the plate-like precipitates increased to 38.20 nm, but the number density decreased to 38.20 × 10²² m−3. Under the synergetic influence of the changes in number density and sizes, the hardness value sharply increased to 141.92 HV. As exhibited in the schematic diagram of the microstructure aged for 3 h in Figure 15, the θ′, θ″ and Cd-rich precipitates together played the role of precipitation strengthening.
After further extending aging time to 12 h, the peak hardness appeared. As shown in Figure 12c, compared with the SAED pattern in Figure 12b, the streaks representing θ″ became weaker, indicating that most of θ″ had transformed to θ′ in the peak-aged state. The sizes of the plate-like precipitates were also coarser than in the under-aged state, and the diameters of the precipitates had grown to 64.30 nm, according to the statistics in Figure 13a. Meanwhile, the Cd-rich precipitates also had grown; the diameters increased to 6–8 nm. However, the number densities of the plate-like and Cd-rich precipitates in the peak-aged state were reduced compared with the under-aged state, which was caused by Ostwald ripening of the precipitates [47]. For precipitation strengthening, the growth of the θ″ and Cd-rich precipitates would inevitably increase the ability to impede dislocation slip, but the decrease in the number densities could also weaken the precipitation strengthening. According to the hardness curve in Figure 7, the increase of the precipitation strengthening caused by the growth of the precipitates played a dominant role in the peak-aged state. In addition, the HRTEM and IFFT images of the Cd-rich precipitates in Figure 14b,b2 showed less distortions around the Cd-rich precipitates. However, according to the HRTEM and IFFT images of the Cd-rich precipitates in Figure 14c,c4, there were serious distortions around the Cd-rich precipitates, which indicated that the Cd-rich precipitates in the peak-aged state owned the stronger strengthening effect. As exhibited in the schematic diagram of the microstructure aged for 12 h, the strength contribution of the peak-aged TiB2/Al–Cu–Mn–Cd composite mainly ascribed to most of θ″, a part of θ′ and the Cd-rich precipitates.
After continuing to extend the aging time to 24 h, the streaks representing the θ″ precipitates had disappeared, which suggested that θ″ had completely transformed to θ′. According to Figure 15, compared to the plate-like precipitates in the peak-aged state, the number density slightly decreased to 4.27 × 10²² m−3 and the average diameter of the plate-like precipitates slightly increased to 73.59 nm. However, as shown in Figure 14d, the interface structure of the plate-like precipitates changed from coherent interfaces to non-coherent interfaces, and the interface bonding strength of the non-coherent interfaces was weaker. Moreover, as displayed in Figure 12d, compared with the Cd-rich precipitates in the peak-aged state, the number density sharply decreased. Thus, the hardness reduced ascribing to the weaker precipitation strengthening contributed from the sparse Cd-rich precipitates. As exhibited in the schematic diagram of the microstructure aged for 24 h, compared with the precipitation strengthening in the peak-aged state, the contribution from the Cd-rich and plate-like precipitates became weaker owing to the sparse number density and non-coherent interfaces, respectively, which diminished the hardness to 156.29 HV.
In summary, with the precipitation strengthening contributed from the θ′, θ″ and Cd-rich precipitates, the hardness of the TiB2/Al–Cu–Mn–Cd reached the peak value after 170 °C for 12 h. In the under-aged state, the ability of the precipitates with fine sizes to obstruct dislocation slip was weaker, thus the hardness was kept at a low level. For the over-aged state, the hardness slightly decreased ascribing to the decrease in the number density of the Cd-rich precipitates and the weaker bonding strength of non-coherent interfaces between θ′ (Al2Cu) and the Al matrix.

5. Conclusions

This study investigated the effects of heat treatment on the microstructure and mechanical properties of a TiB2/Al–Cu–Mn–Cd composite. In conclusion, this study revealed the following findings:
  • An optimized two-stage solution treatment for TiB2/Al–Cu–Mn–Cd composite was proposed. The second and eutectic Al2Cu phases in the as-cast state completely dissolved into the Al matrix with the adoption of the optimized solution treatment, i.e., solutionized at 523 °C for 11 h followed by the high-temperature short-time solution at 535 °C for 1 h.
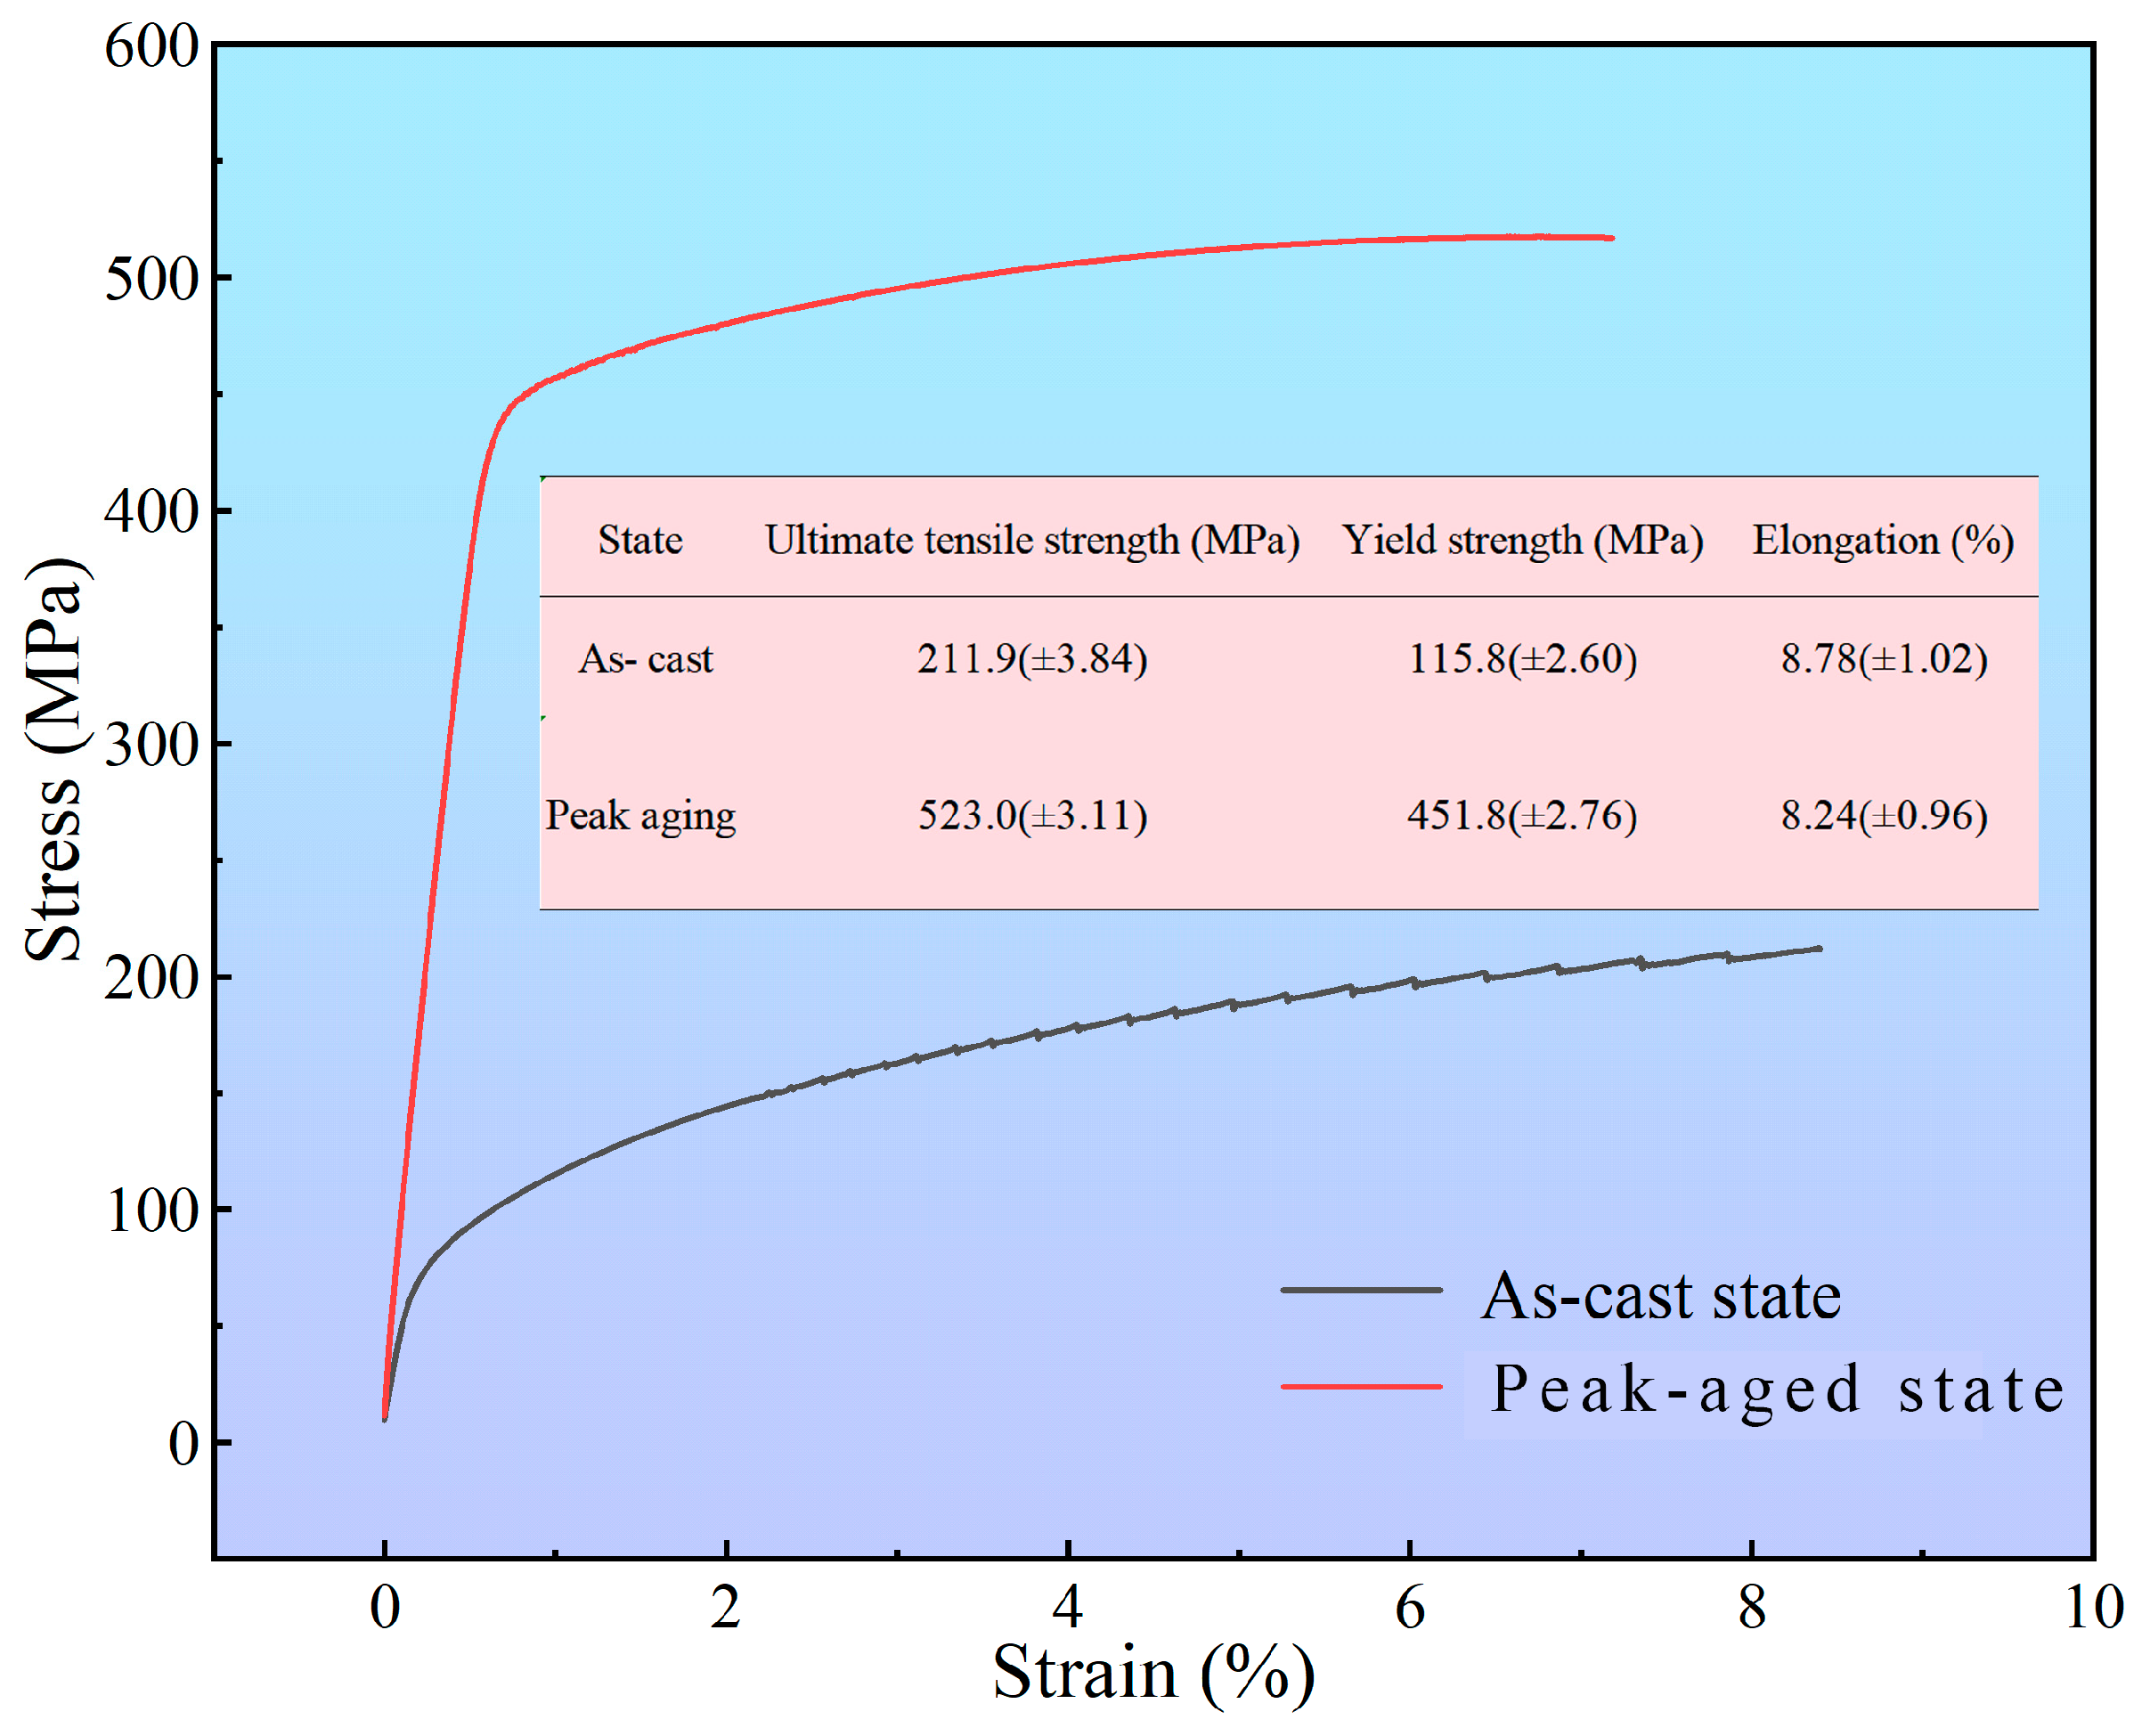
  • The peak hardness for TiB2/Al–Cu–Mn–Cd reached 164.6 HV with the optimized aging at 170 °C for 12 h. Compared to the mechanical properties in the as-cast state, the average ultimate tensile strength and yield strength increased from 211.9 MPa to 523.0 MPa and 115.8 MPa to 451.8 MPa, respectively. However, the value of elongation slightly decreased from 8.78% to 8.24%.
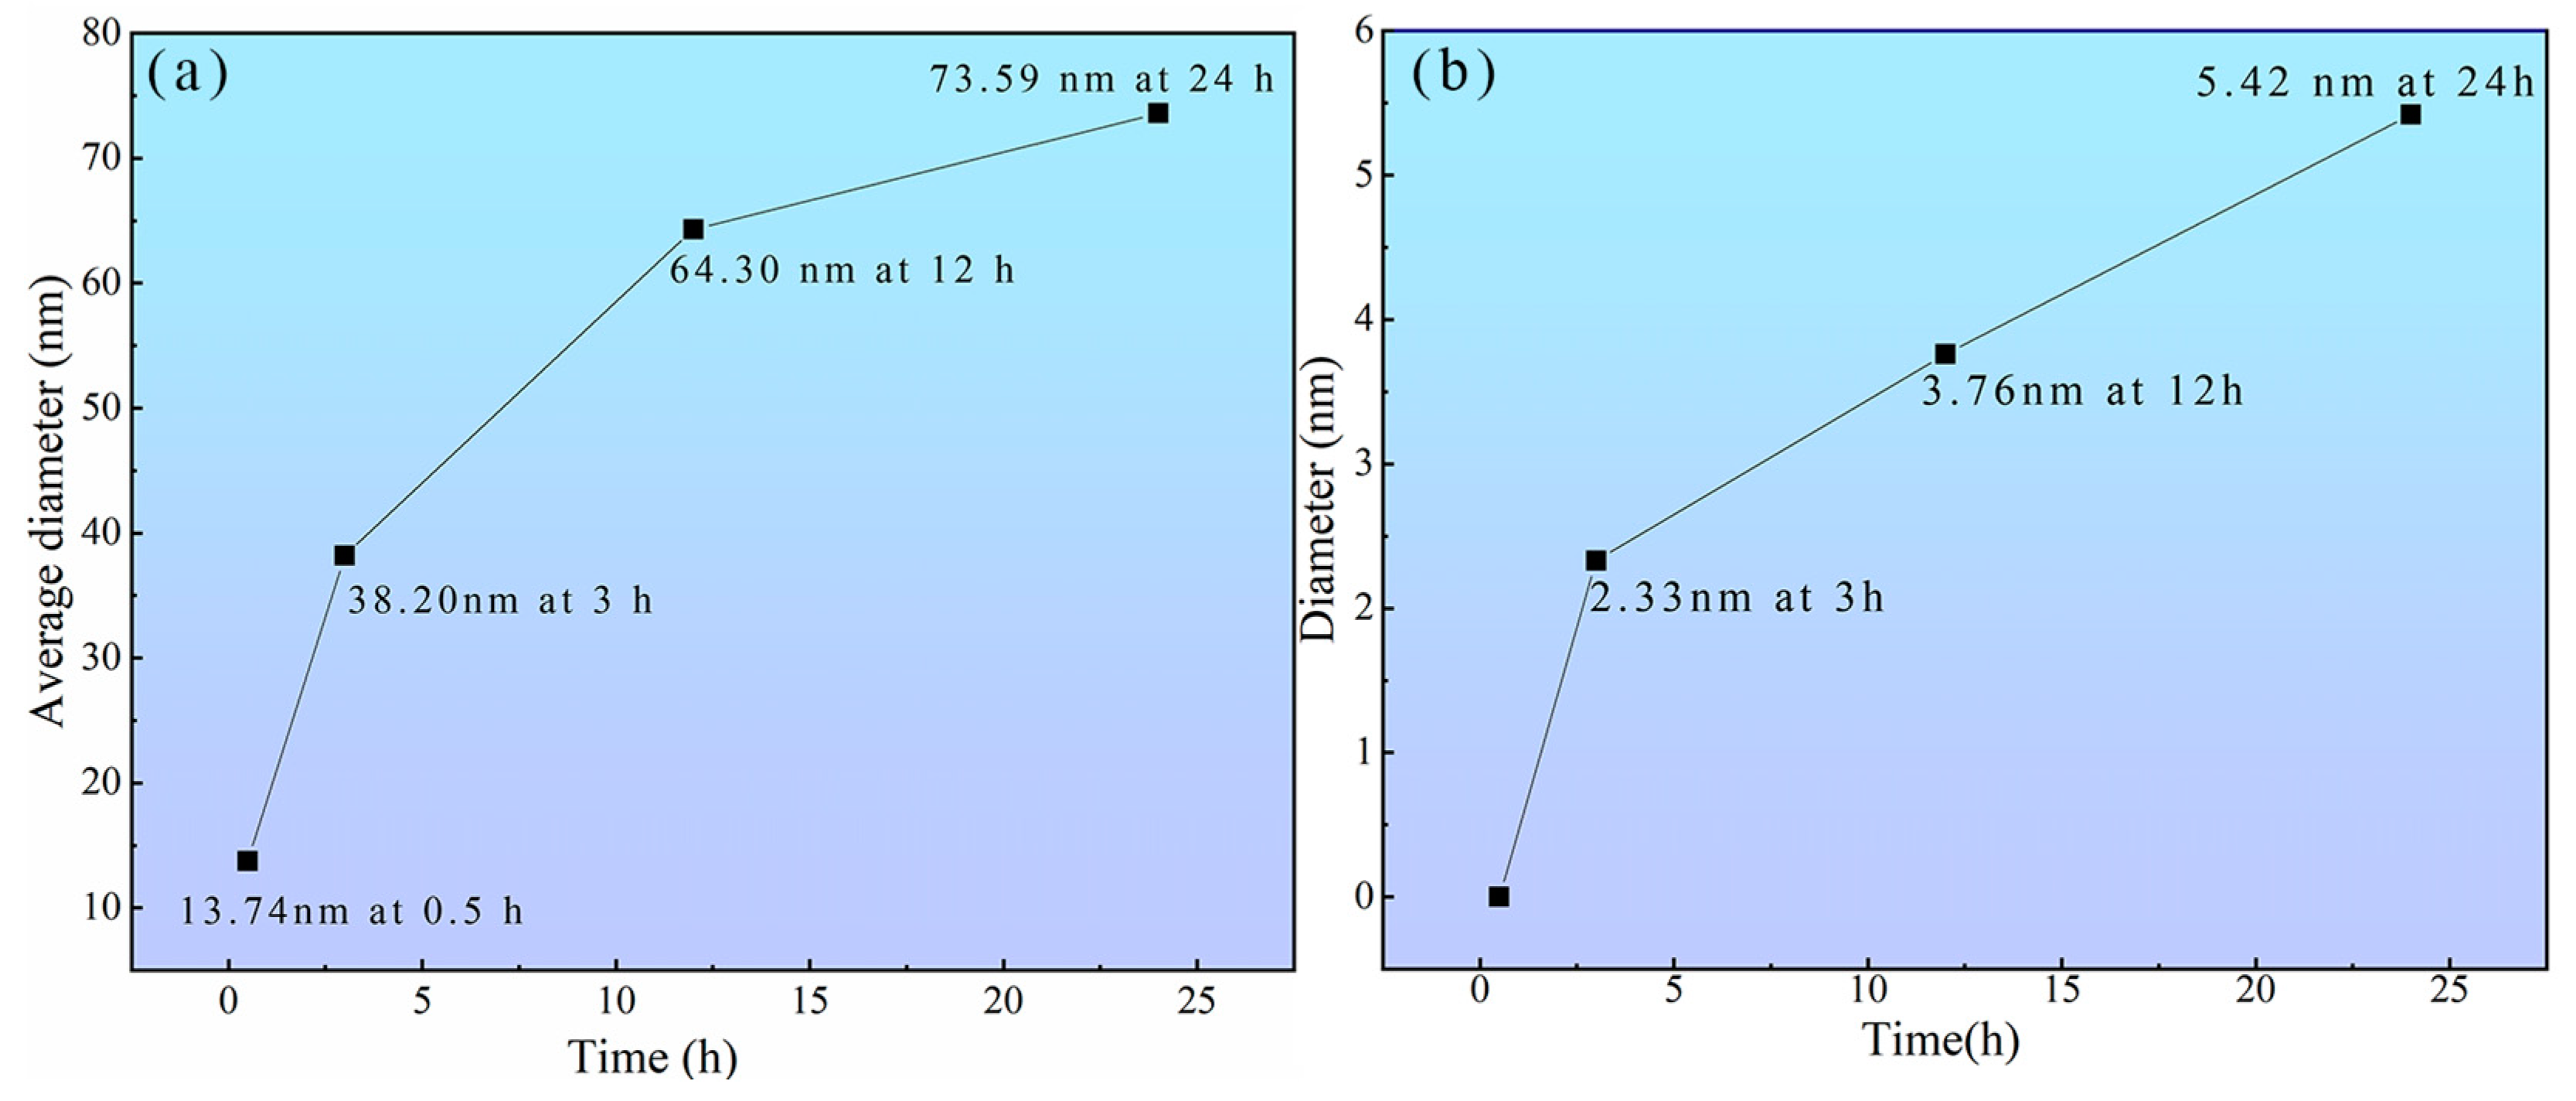
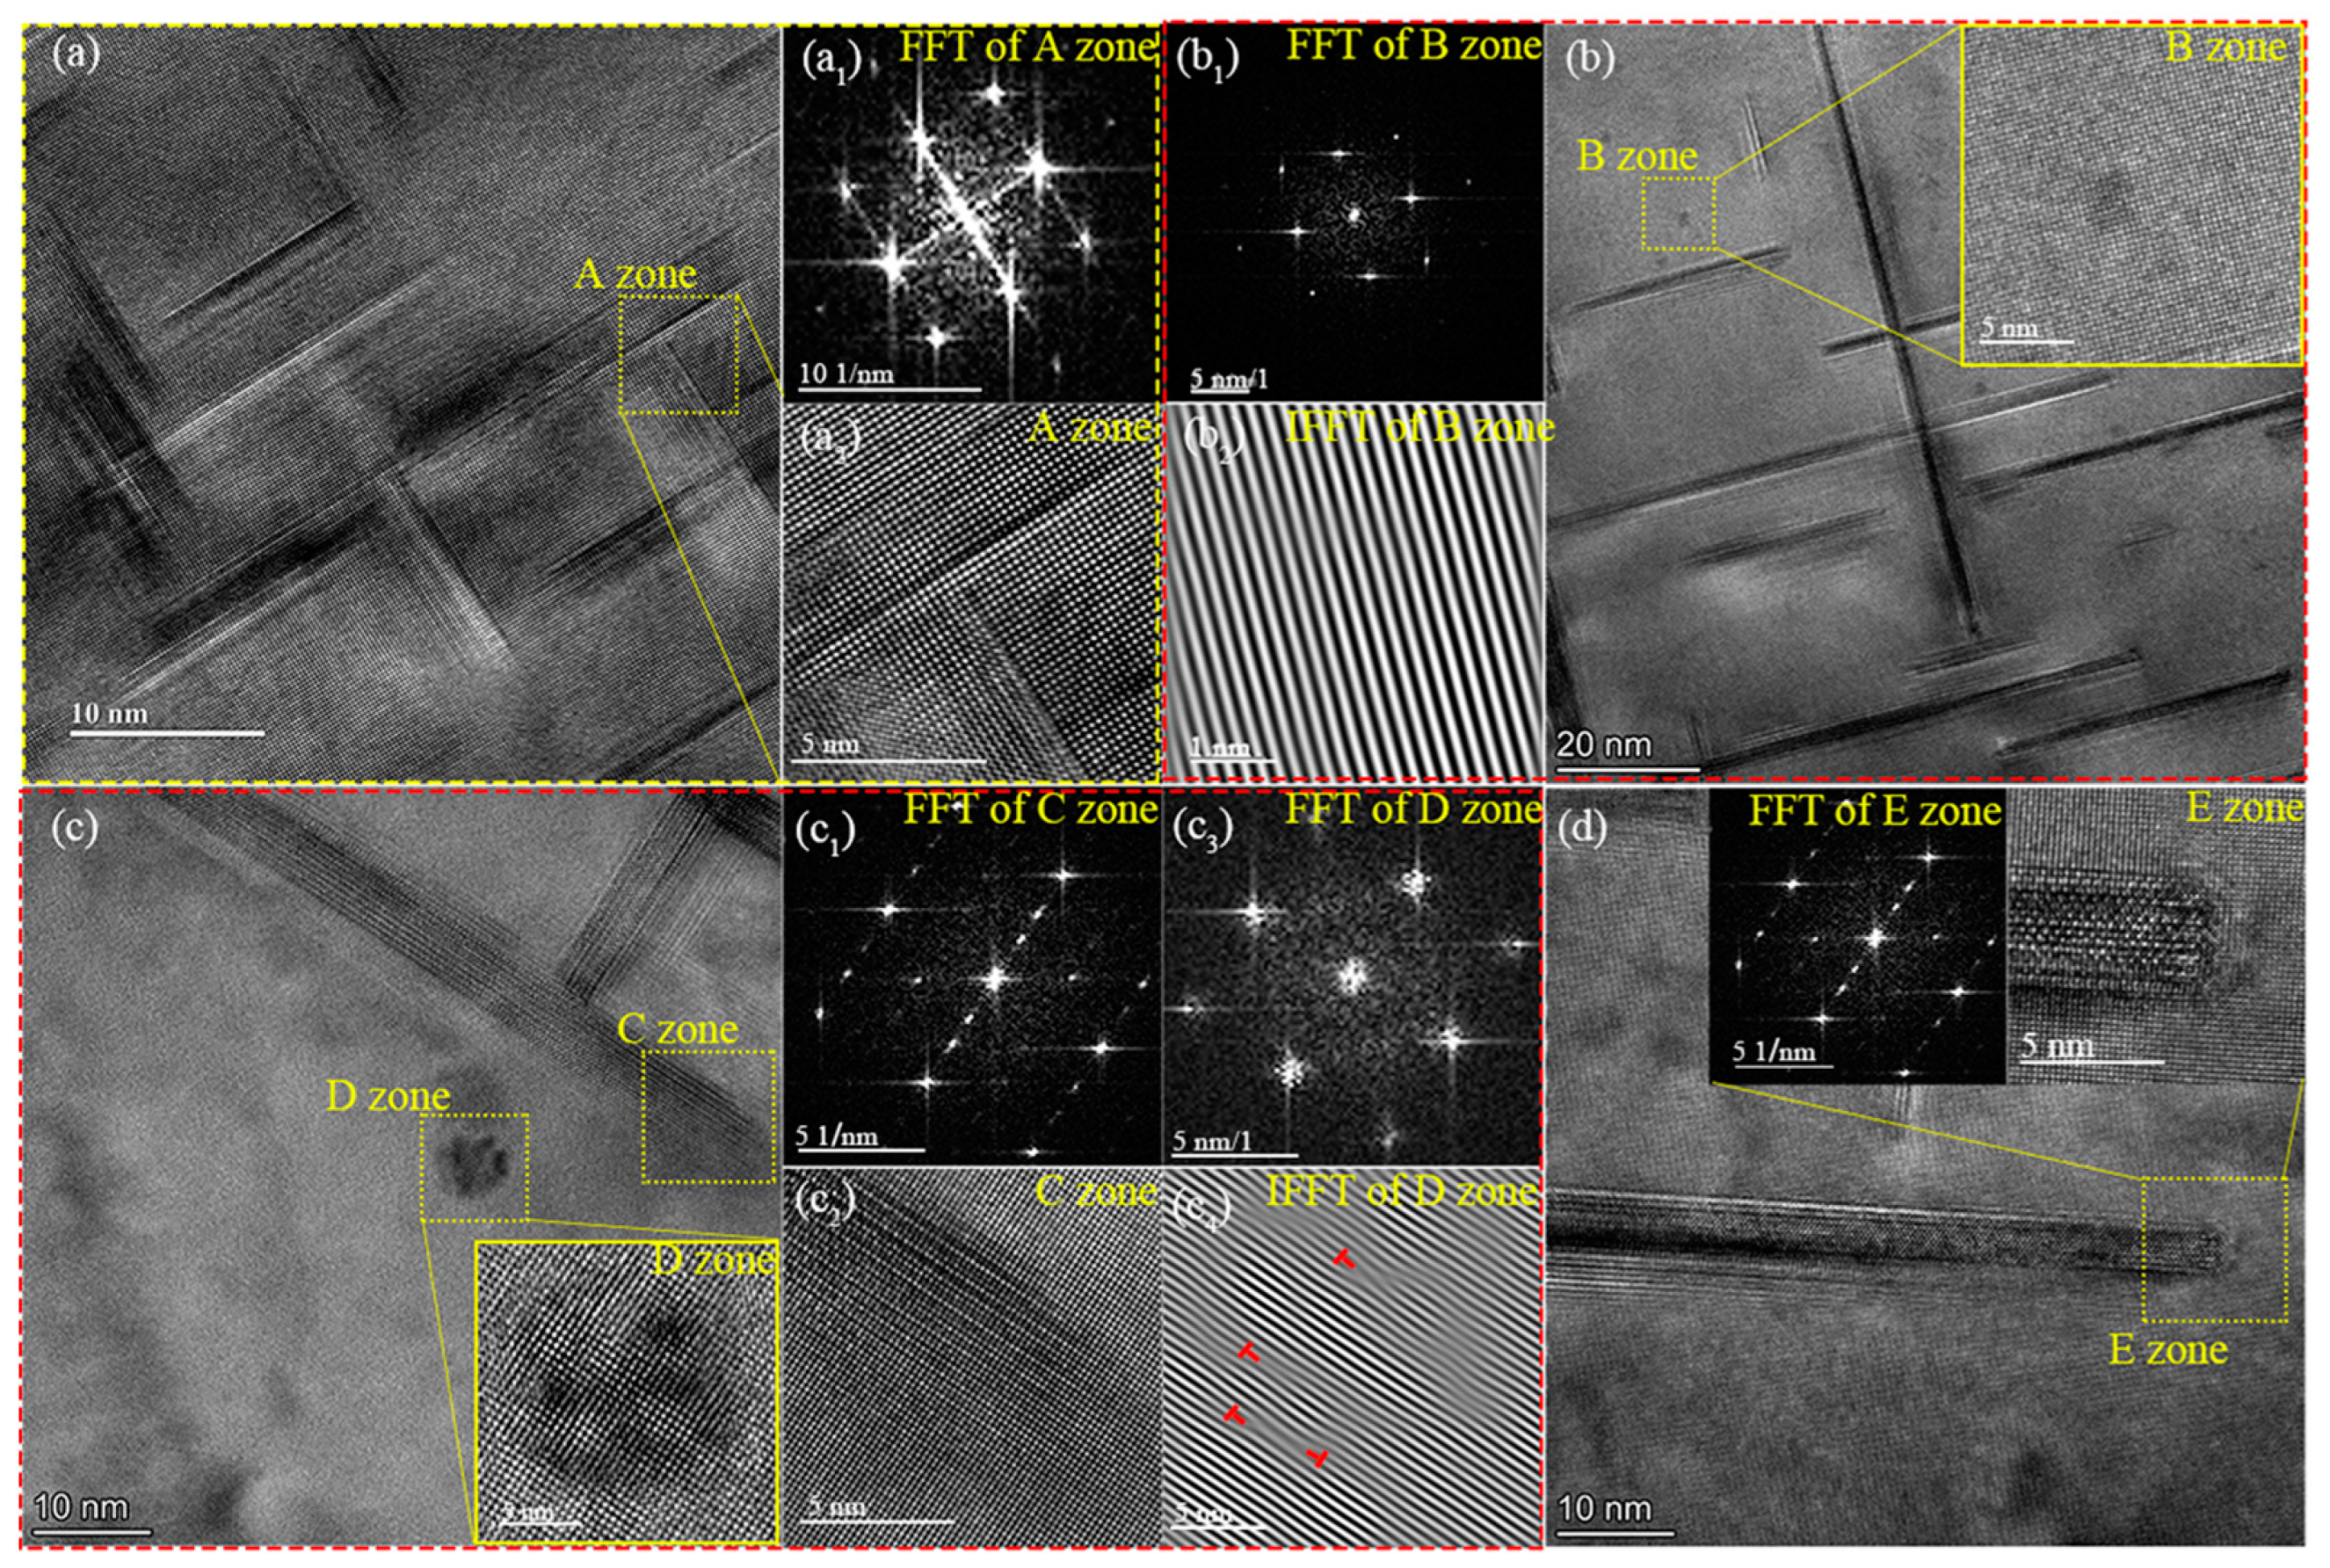
  • The strength contribution of the peak-aged TiB2/Al–Cu–Mn–Cd composite mainly ascribed to the Cd-rich, θ″ and θ′ precipitates. In the peak-aged state, the number density and average diameter of the plate-like precipitates reached 4.266 × 10²¹ m3 and 64.30 nm, which provided the most powerful precipitate strengthening. The smaller sizes and sparser number densities of the precipitates were the reasons for the low hardnesses of the under-aged and over-aged composites, respectively.

Supplementary Materials

The following supporting information can be downloaded at: https://www.mdpi.com/article/10.3390/cryst14100836/s1, Figure S1. The morphology of extracted TiB2 particles.

Author Contributions

Conceptualization, J.L.; methodology, Z.C. and J.L.; validation, J.L. and Z.X.; formal analysis, G.S. and Z.X.; investigation, J.H. and J.L.; resources, W.S. and Z.X.; data curation, Z.Y. and Y.H.; writing—original draft preparation, J.L. and Z.C.; writing—review and editing, J.L. and M.L.; visualization, L.L. and M.L.; supervision, L.L. and M.L. All authors have read and agreed to the published version of the manuscript.

Funding

This work was supported by the Natural Science Foundation of China (No. 51871006).

Data Availability Statement

The authors confirm that the data to support the findings of this study are available within the article.

Acknowledgments

Authors thank the College of Materials Science and Engineering of Beijing University of Technology for the support on this study.

Conflicts of Interest

Author Jingcun Huang was employed by Sinoma Science & Technology (Suzhou) Co., Ltd. The funders had no role in the design of the study; in the collection, analyses, or interpretation of data; in the writing of the manuscript; or in the decision to publish the results.

References

  1. Zhao, K.; Kang, H.; Wu, Y.; Liu, M.; Guo, E.; Chen, Z.; Wang, T. Manipulating the particle distribution of in situ TiB2p/Al composites via acoustic vibration and cooling rate. Mater. Lett. 2019, 262, 127063. [Google Scholar] [CrossRef]
  2. Xu, J.Y.; Zou, B.L.; Tao, S.Y.; Zhang, M.X.; Cao, X.Q. Fabrication and properties of Al2O3-TiB2-TiC/Al metal matrix composite coatings by atmospheric plasma spraying of SHS powders. J. Alloys Compd. 2016, 672, 251–259. [Google Scholar] [CrossRef]
  3. Ma, G.N.; Wang, D.; Liu, Z.Y.; Xiao, B.L.; Ma, Z.Y. An investigation on particle weakening in T6-treated SiC/Al-Zn-Mg-Cu composites. Mater. Charact. 2019, 158, 109966. [Google Scholar] [CrossRef]
  4. Yang, Z.Y.; Fan, J.Z.; Liu, Y.Q.; Nie, J.H.; Yang, Z.Y.; Kang, Y.L. Strengthening and Weakening Effects of Particles on Strength and Ductility of SiC Particle Reinforced Al-Cu-Mg Alloys Matrix Composites. Materials 2021, 14, 1219. [Google Scholar] [CrossRef]
  5. Zhong, X.M.; Li, Q.Y.; Gong, Y.Z.; Duan, X.Z.; Shao, Y.; Yang, H.Y.; Qiu, F.; Jiang, Q.C. Effects of various proportions TiB2p-TiCp reinforced Al-Cu-Mg composites in high-temperature mechanical properties and sliding wear behaviors. J. Mater. Res. Technol. 2024, 30, 4169–4180. [Google Scholar] [CrossRef]
  6. Gao, T.; Liu, L.Y.; Song, J.P.; Liu, G.L.; Liu, X.F. Synthesis and characterization of an in-situ Al2O3/Al-Cu composite with a heterogeneous structure. J. Alloys Compd. 2021, 868, 159283. [Google Scholar] [CrossRef]
  7. Diao, E.; Fan, J.Z.; Yang, Z.Y.; Lv, Z.C.; Gao, H.; Nie, J.H. Hot Deformation Behavior and Mechanisms of SiC Particle Reinforced Al-Zn-Mg-Cu Alloy Matrix Composites. Materials 2023, 16, 7430. [Google Scholar] [CrossRef]
  8. Jin, P.; Zhou, J.; Zhou, J.; Liu, Y.; Sun, Q. Contribution made by double-sized TiC particles addition to the ductility-strength synergy in wire and arc additively manufactured Al-Cu alloys. Compos. Part B Eng. 2024, 268, 111078. [Google Scholar] [CrossRef]
  9. Wang, Q.; Li, Y.Y.; Chen, Z.; Wang, M.L.; Zhu, H.; Wang, H.W. Understanding alloying behaviors of Sc, Ni and Zn additions on Al/TiB2 interfaces based on interfacial characteristics and solute properties. Surf. Interface 2021, 26, 101427. [Google Scholar] [CrossRef]
  10. Schaffer, P.L.; Miller, D.N.; Dahle, A.K. Crystallography of engulfed and pushed TiB2 particles in aluminum. Scr. Mater. 2007, 57, 1129–1132. [Google Scholar] [CrossRef]
  11. Li, L.; Han, Z.; Gao, M.; Li, S.; Wang, H.; Kang, H.; Guo, E.; Chen, Z.; Wang, T. Microstructures, mechanical properties, and aging behavior of hybrid-sized TiB2 particulate-reinforced 2219 aluminum matrix composites. Mater. Sci. Eng. A 2022, 829, 142180. [Google Scholar] [CrossRef]
  12. Tian, W.S.; Zhao, Q.L.; Zhang, Q.Q.; Qiu, F.; Jiang, Q.C. Simultaneously increasing the high-temperature tensile strength and ductility of nano-sized TiCp reinforced Al-Cu matrix composites. Mater. Sci. Eng. A 2018, 717, 105–112. [Google Scholar] [CrossRef]
  13. Sun, J.W.; Wu, G.H.; Zhang, L.; Zhang, X.L.; Liu, L.L.; Zhang, J.S. Microstructure characteristics of an ultra-high strength extruded Al-4.7Cu-1Li-0.5Mg-0.1Zr-1Zn alloy during heat treatment. J. Alloys Compd. 2020, 813, 152216. [Google Scholar] [CrossRef]
  14. Mohamed, A.M.; Samuel, F.H.; Kahtani, S.A. Influence of Mg and solution heat treatment on the occurrence of incipient melting in Al-Si-Cu-Mg cast alloys. Mater. Sci. Eng. A 2012, 543, 22–34. [Google Scholar] [CrossRef]
  15. Han, Y.; Samuel, A.M.; Doty, H.W.; Valtierra, S.; Samuel, F.H. Optimizing the tensile properties of Al-Si-Cu-Mg 319-type alloys: Role of solution heat treatment. Mater. Des. 2014, 58, 426–438. [Google Scholar] [CrossRef]
  16. Hong, T.R.; Li, X.F.; Wang, H.W.; Chen, D. Influence of solution temperature on microstructure and properties of in-situ TiB2/2009 composites. Mater. Sci. Eng. A 2015, 634, 1–4. [Google Scholar] [CrossRef]
  17. Du, R.; Gao, Q.; Wu, S.S.; Lü, S.L.; Zhou, X. Influence of TiB2 particles on aging behavior of in-situ TiB2/Al-4.5Cu composites. Mater. Sci. Eng. A 2018, 721, 244–250. [Google Scholar] [CrossRef]
  18. Li, J.; Lü, S.; Wu, S.; Zhao, D.; Li, F.; Guo, W. Effects of nanoparticles on the solution treatment and mechanical properties of nano-SiCp/Al-Cu composites. J. Mater. Process. Technol. 2021, 296, 117195. [Google Scholar] [CrossRef]
  19. Yang, X.F.; Xu, C.; Lu, G.X.; Guan, S.K. Towards strength-ductility synergy through an optimized two-stage solution treatment in Al-7Si-3Cu-0.5Mg alloys. Mater. Sci. Eng. A 2022, 849, 143504. [Google Scholar] [CrossRef]
  20. Wu, L.; Zhou, C.; Li, X.F.; Ma, N.H.; Wang, H.W. Microstructural evolution and mechanical properties of cast high-Li-content TiB2/Al-Li-Cu composite during heat treatment. J. Alloys Compd. 2018, 739, 270–279. [Google Scholar] [CrossRef]
  21. Möller, H.; Govender, G. The Heat Treatment of Rheo-High Pressure Die Cast Al-Cu-Mg-Ag Alloy 2139. Solid State Phenom. 2012, 173, 192–193. [Google Scholar] [CrossRef]
  22. Stemper, L.; Tunes, M.A.; Dumitraschkewitz, P.; Mendez-Martin, F.; Tosone, R.; Marchand, D.; Curtin, W.A.; Uggowitzer, P.J.; Pogatscher, S. Giant hardening response in AlMgZnCu alloys. Acta Mater. 2021, 206, 116617. [Google Scholar] [CrossRef]
  23. Dai, S.; Zhang, H.; Bian, Z.; Geng, J.; Chen, Z.; Wang, L.; Wang, M.; Wang, H. Insight into the recrystallization behavior and precipitation reaction of in-situ nano TiB2/Al-Cu-Mg composite during heat treatment. Mater. Charact. 2021, 181, 111458. [Google Scholar] [CrossRef]
  24. Ma, P.P.; Liu, C.H.; Zhan, L.H.; Huang, M.H.; Ma, Z.Y. Formation of a new intermediate phase and its evolution toward θ’ during aging of pre-deformed Al-Cu alloys. J. Mater. Sci. Technol. 2019, 35, 885–890. [Google Scholar] [CrossRef]
  25. Shahani, A.; Xiao, X.; Skinner, K.; Peters, M.; Voorhees, P. Voorhees, Ostwald ripening of faceted Si particles in an Al-Si-Cu melt. Mater. Sci. Eng. A 2016, 673, 307–320. [Google Scholar] [CrossRef]
  26. Zhu, X.-H.; Lin, Y.; Wu, Q.; Jiang, Y.-Q. Effects of aging on precipitation behavior and mechanical propertiesof a tensile deformed Al-Cu alloy. J. Alloys Compd. 2020, 843, 155975. [Google Scholar] [CrossRef]
  27. Sjölander, E.; Seifeddine, S. The heat treatment of Al–Si–Cu–Mg casting alloys. J. Mater. Process. Technol. 2010, 210, 1249–1259. [Google Scholar] [CrossRef]
  28. Alvarez-Antolin, J.F.; Segurado-Frutos, E.; Neira-Castaño, H.; Asensio-Lozano, J. Heat Treatment Optimization in Al-Cu-Mg-Si Alloys with or without Prior Deformation. Metals 2018, 8, 739. [Google Scholar] [CrossRef]
  29. Li, H.; Wang, X.M.; Chai, L.H.; Wang, H.J.; Chen, Z.Y.; Xiang, Z.L.; Jin, T.N. Microstructure and mechanical properties of an in-situ TiB2/Al-Zn-Mg-Cu-Zr composite fabricated by Melt-SHS process. Mater. Sci. Eng. A 2018, 720, 60–68. [Google Scholar] [CrossRef]
  30. Zhang, M.S.; Wang, J.S.; Wang, B.; Xue, C.P.; Liu, X.G. Quantifying the effects of Sc and Ag on the microstructure and mechanical properties of Al-Cu alloys. Mater. Sci. Eng. A 2022, 831, 142355. [Google Scholar] [CrossRef]
  31. Delmas, F.; Casanove, M.J.; Lours, P. Quantitative TEM study of the precipitation microstructure in aluminium alloy Al(MgSiCu) 6056 T6. Mater. Sci. Eng. A 2004, 373, 80–89. [Google Scholar] [CrossRef]
  32. Kelly, P.M.; Jostsons, A.; Blake, R.G. The determination of foil thickness by scanning transmission electron microscopy. Phys. Status Solidi (a) 1975, 31, 771–780. [Google Scholar] [CrossRef]
  33. Chen, J.L.; Liao, H.C.; Xu, H.T. Uneven Precipitation Behavior during the Solutionizing Course of Al-Cu-Mn Alloys and Their Contribution to High Temperature Strength. Adv. Mater. Sci. Eng. 2018, 12, 6741502. [Google Scholar] [CrossRef]
  34. Chisholm, M.F.; Shin, D.; Duscher, G.; Oxley, M.P.; Allard, L.F.; Poplawsky, J.D. Atomic structures of interfacial solute gateways to θ’ precipitates in Al-Cu alloys. Acta Mater. 2021, 212, 116891. [Google Scholar] [CrossRef]
  35. Gao, L.; Li, K.; Ni, S.; Du, Y.; Song, M. The growth mechanisms of θ’ precipitate phase in an Al-Cu alloy during aging treatment. J. Mater. Sci. Technol. 2021, 61, 25–32. [Google Scholar] [CrossRef]
  36. Chen, Y.; Weyland, M.; Hutchinson, C.R. The effect of interrupted aging on the yield strength and uniform elongation of precipitation-hardened Al alloys. Acta Mater. 2013, 61, 5877–5894. [Google Scholar] [CrossRef]
  37. Tian, W.-S.; Zhao, Q.-L.; Zhang, Q.-Q.; Qiu, F.; Jiang, Q.-C. Enhanced strength and ductility at room and elevated temperatures of Al-Cu alloy matrix composites reinforced with bimodal-sized TiCp compared with monomodal-sized TiCp. Mater. Sci. Eng. A 2018, 724, 368–375. [Google Scholar] [CrossRef]
  38. Liu, X.; Ji, Z.W.; Song, Y.G.; Wang, B.; Zhu, Y.L.; Qiu, F.; Zhao, Q.L.; Jiang, Q.C. Synergistic effects of the TiC nanoparticles and cold rolling on the microstructure and mechanical properties of Al–Cu strips fabricated by twin-roll casting. Mater. Sci. Eng. A 2021, 812, 141110. [Google Scholar] [CrossRef]
  39. Whelan, M.J. On the Kinetics of Precipitate Dissolution. Met. Sci. J. 1968, 2, 192–193. [Google Scholar] [CrossRef]
  40. Yang, X.; Li, Y.; Luo, X.; Zhou, H.; Cai, Q.; Li, M.; Ma, Y. Microstructural evoluation and mechanical properties of 7075 aluminum alloy prepared by controlled diffusion solidification. China Foundry 2019, 16, 238–247. [Google Scholar] [CrossRef]
  41. Cao, Y.; Chen, X.; Wang, Z.; Chen, K.; Tang, W.; Pan, S.; Yang, X.; Qin, J.; Li, S.; Wang, Y. Effect of Cd micro-addition on microstructure and mechanical properties in ternary Al-Si-Cu alloy. J. Alloys Compd. 2021, 851, 156739. [Google Scholar] [CrossRef]
  42. Ma, P.; Zhan, L.; Liu, C.; Wang, Q.; Li, H.; Liu, D.; Hu, Z. Pre-strain-dependent natural ageing and its effect on subsequent artificial ageing of an Al-Cu-Li alloy. J. Alloys Compd. 2019, 790, 8–19. [Google Scholar] [CrossRef]
  43. Bourgeois, L.; Dwyer, C.; Weyland, M.; Nie, J.-F.; Muddle, B.C. Structure and energetics of the coherent interface between the θ‘precipitate phase and aluminium in Al-Cu. Acta Mater. 2011, 59, 7043–7050. [Google Scholar] [CrossRef]
  44. Shen, Z.; Ding, Q.; Liu, C.; Wang, J.; Tian, H.; Li, J.; Zhang, Z. Atomic-scale mechanism of the θ″→θ′ phase transformation in Al-Cu alloys. J. Mater. Sci. Technol. 2017, 10, 95–100. [Google Scholar] [CrossRef]
  45. Qian, F.; Li, J.; Zhao, D.; Jin, S.; Mørtsell, E.A.; Li, Y. Comparative study of Cd addition effects on precipitation in different aluminium alloys. Mater. Sci. Technol. 2023, 39, 2469–2477. [Google Scholar] [CrossRef]
  46. Heugue, P.; Larouche, D.; Breton, F.; Martinez, R.; Chen, X.G. Evaluation of the Growth Kinetics of θ’ and h-Al2Cu Precipitates in a Binary Al-3.5 wt per Cu Alloy. Metall. Mater. Trans. A 2019, 50, 3048–3060. [Google Scholar] [CrossRef]
  47. Ostwald, W. Studies on the formation and transformation of solid bodies. Z. Phys. Chem. 1897, 22, 289–330. [Google Scholar] [CrossRef]
Figure 1. (a) Schematic diagram of alloy preparation; (b) geometry of tensile test specimens (all dimensions are in mm); (c) schematic diagram of sample locations for microstructure characterization and mechanical testing.
Crystals 14 00836 g001
Figure 2. Microstructure of as-cast TiB2/Al–Cu–Mn–Cd composite and XRD pattern: (a) XRD pattern; (b,c) BSE images, (cc3) EDS mapping results; (d,e) OM image; (f) grain size frequency distribution.
Crystals 14 00836 g002
Figure 3. DSC result of as-cast TiB2/Al–Cu–Mn–Cd composite.
Crystals 14 00836 g003
Figure 4. Microstructure evolution of TiB2/Al–Cu–Mn–Cd composite heated at different temperatures for 12 h and EDS mapping results: (a,b) 518 °C, (bb3) EDS mapping result of residual phase; (c) 523 °C; (d) 528 °C; (e) 532 °C, (ee4) EDS mapping result of over-burning defects.
Crystals 14 00836 g004
Figure 5. Microstructure evolution of TiB2/Al–Cu–Mn–Cd composite heated at 523 °C for various periods (3–14 h): (a) 3 h; (b) 6 h; (c) 9 h; (d) 10 h; (e) 11 h; (f) 12 h; (g) 13 h; (h) 14 h; (i) the statistics for area fraction of residual phase and microhardness in the solution process.
Crystals 14 00836 g005
Figure 6. Microstructure evolution of TiB2/Al–Cu–Mn–Cd composite heated at 535 °C for various periods: (a,e) 0.5 h; (b,f) 1.0 h; (c,g) 1.5 h; (d,h) 2.0 h.
Crystals 14 00836 g006
Figure 7. The hardness curves of TiB2/Al–Cu–Mn–Cd composite during aging processes at 150 °C, 170 °C and 190 °C.
Crystals 14 00836 g007
Figure 8. TEM micrograph and SAED results taken along the <001>Al orientation zone axis of peak-aged TiB2/Al–Cu–Mn–Cd composite at different aging temperatures: (a,d) 150 °C, (b,e) 170 °C, (c,f) 190 °C.
Crystals 14 00836 g008
Figure 9. Size distribution of precipitates in the peak-aged state: (a) diameter; (b) thickness.
Crystals 14 00836 g009
Figure 10. Tensile properties of TiB2/Al–Cu–Mn–Cd composite at room temperature.
Crystals 14 00836 g010
Figure 11. Fractograph of TiB2/Al–Cu–Mn–Cd composite: (a,b) as-cast state; (c,d) peak-aged state.
Crystals 14 00836 g011
Figure 12. TEM micrograph and EDS Mapping taken along the <001> Al orientation zone axis of TiB2/Al–Cu–Mn–Cd composite aged at 170 °C for various times: (a,e) 0.5 h; (b,f) 3 h; (c,g,i) 12 h; (d,h) 24 h; (i1i4) distribution of elements.
Crystals 14 00836 g012
Figure 13. Average diameter evolution of plate-like and Cd-rich precipitates aged at 170 °C for various times: (a) plate-like precipitates; (b) Cd-rich precipitates.
Crystals 14 00836 g013
Figure 14. HRTEM micrograph and FFT pattern taken along the <001>Al orientation zone axis of TiB2/Al–Cu–Mn–Cd composite aged at 170 °C for various times: (aa2) 0.5 h; (bb2) 3 h; (cc4) 12 h; (d) 24 h.
Crystals 14 00836 g014
Figure 15. The relationships between the microhardness, precipitates characteristics and microstructure of TiB2/Al–Cu–Mn–Cd composite during the aging process (aging for 0.5 h, 3.0 h, 12 h and 24 h).
Crystals 14 00836 g015
Table 1. Elemental compositions of the composites (wt%).
CompositionCuMnBCdZrTiTiB2Al
Designed composition5.300.400.050.200.20.151.0Balance
Actual composition5.260.380.040.180.190.151.2Balance
Table 2. Optimization scheme of the single-solution treatment.
Solution TreatmentTemperature/°CTime/hQuenching Transfer Time/s
First step518, 523, 528, 53212 h≤10 s
Second stepOST9, 10, 11, 12, 13, 14≤10 s
Table 3. Tensile properties of the particle-reinforced Al–Cu matrix composites.
CompositeHeat Treatmentσs (MPa)σb (MPa)El (%)
TiB2/Al–Cu–Mn (this study)523 °C, 11 h + 535 °C, 1 h 170 °C 12 h523.0451.8 8.24
TiC/Al–Cu–Mn [37]538 °C, 12 h
165 °C, 10 h
542.0367.011.0
TiB2/Al–Cu–Li [20]500 °C, 32 h + 560 °C 24 h
175 °C 8 h
302.0206.03.7
TiB2/Al–Cu–Mn [11]535 °C, 2 h
175 °C 15 h
446.3344.88.1
TiC/Al–Cu [39]535 °C, 1 h
165 °C, 10 h
401.0245.013.1
SiC/Al–Cu–Mn [18]540 °C, 10 h
180 °C, 10 h
500.1358.08.5
Table 4. Quantitative statistics of plate-like precipitates sizes when aged at 170 °C for different times.
Aging TimePrecipitates TypeA/nm2Dt/nmNV/m−3
0.5 hθ″52,982.8313.747.011 × 1022
3 hθ′, θ″39,302.5838.202.482 × 1022
12 hθ′, θ″86,010.6664.304.266 × 1021
24 hθ′87,325.4773.593.872 × 1021
Disclaimer/Publisher’s Note: The statements, opinions and data contained in all publications are solely those of the individual author(s) and contributor(s) and not of MDPI and/or the editor(s). MDPI and/or the editor(s) disclaim responsibility for any injury to people or property resulting from any ideas, methods, instructions or products referred to in the content.

