4.1. Finite Element Analysis
In the IPS test simulation, the stress components corresponding to each node
σx,
σy, and
τxy were normalised by the nominal shear stress
τIPS calculated from Equation (1).
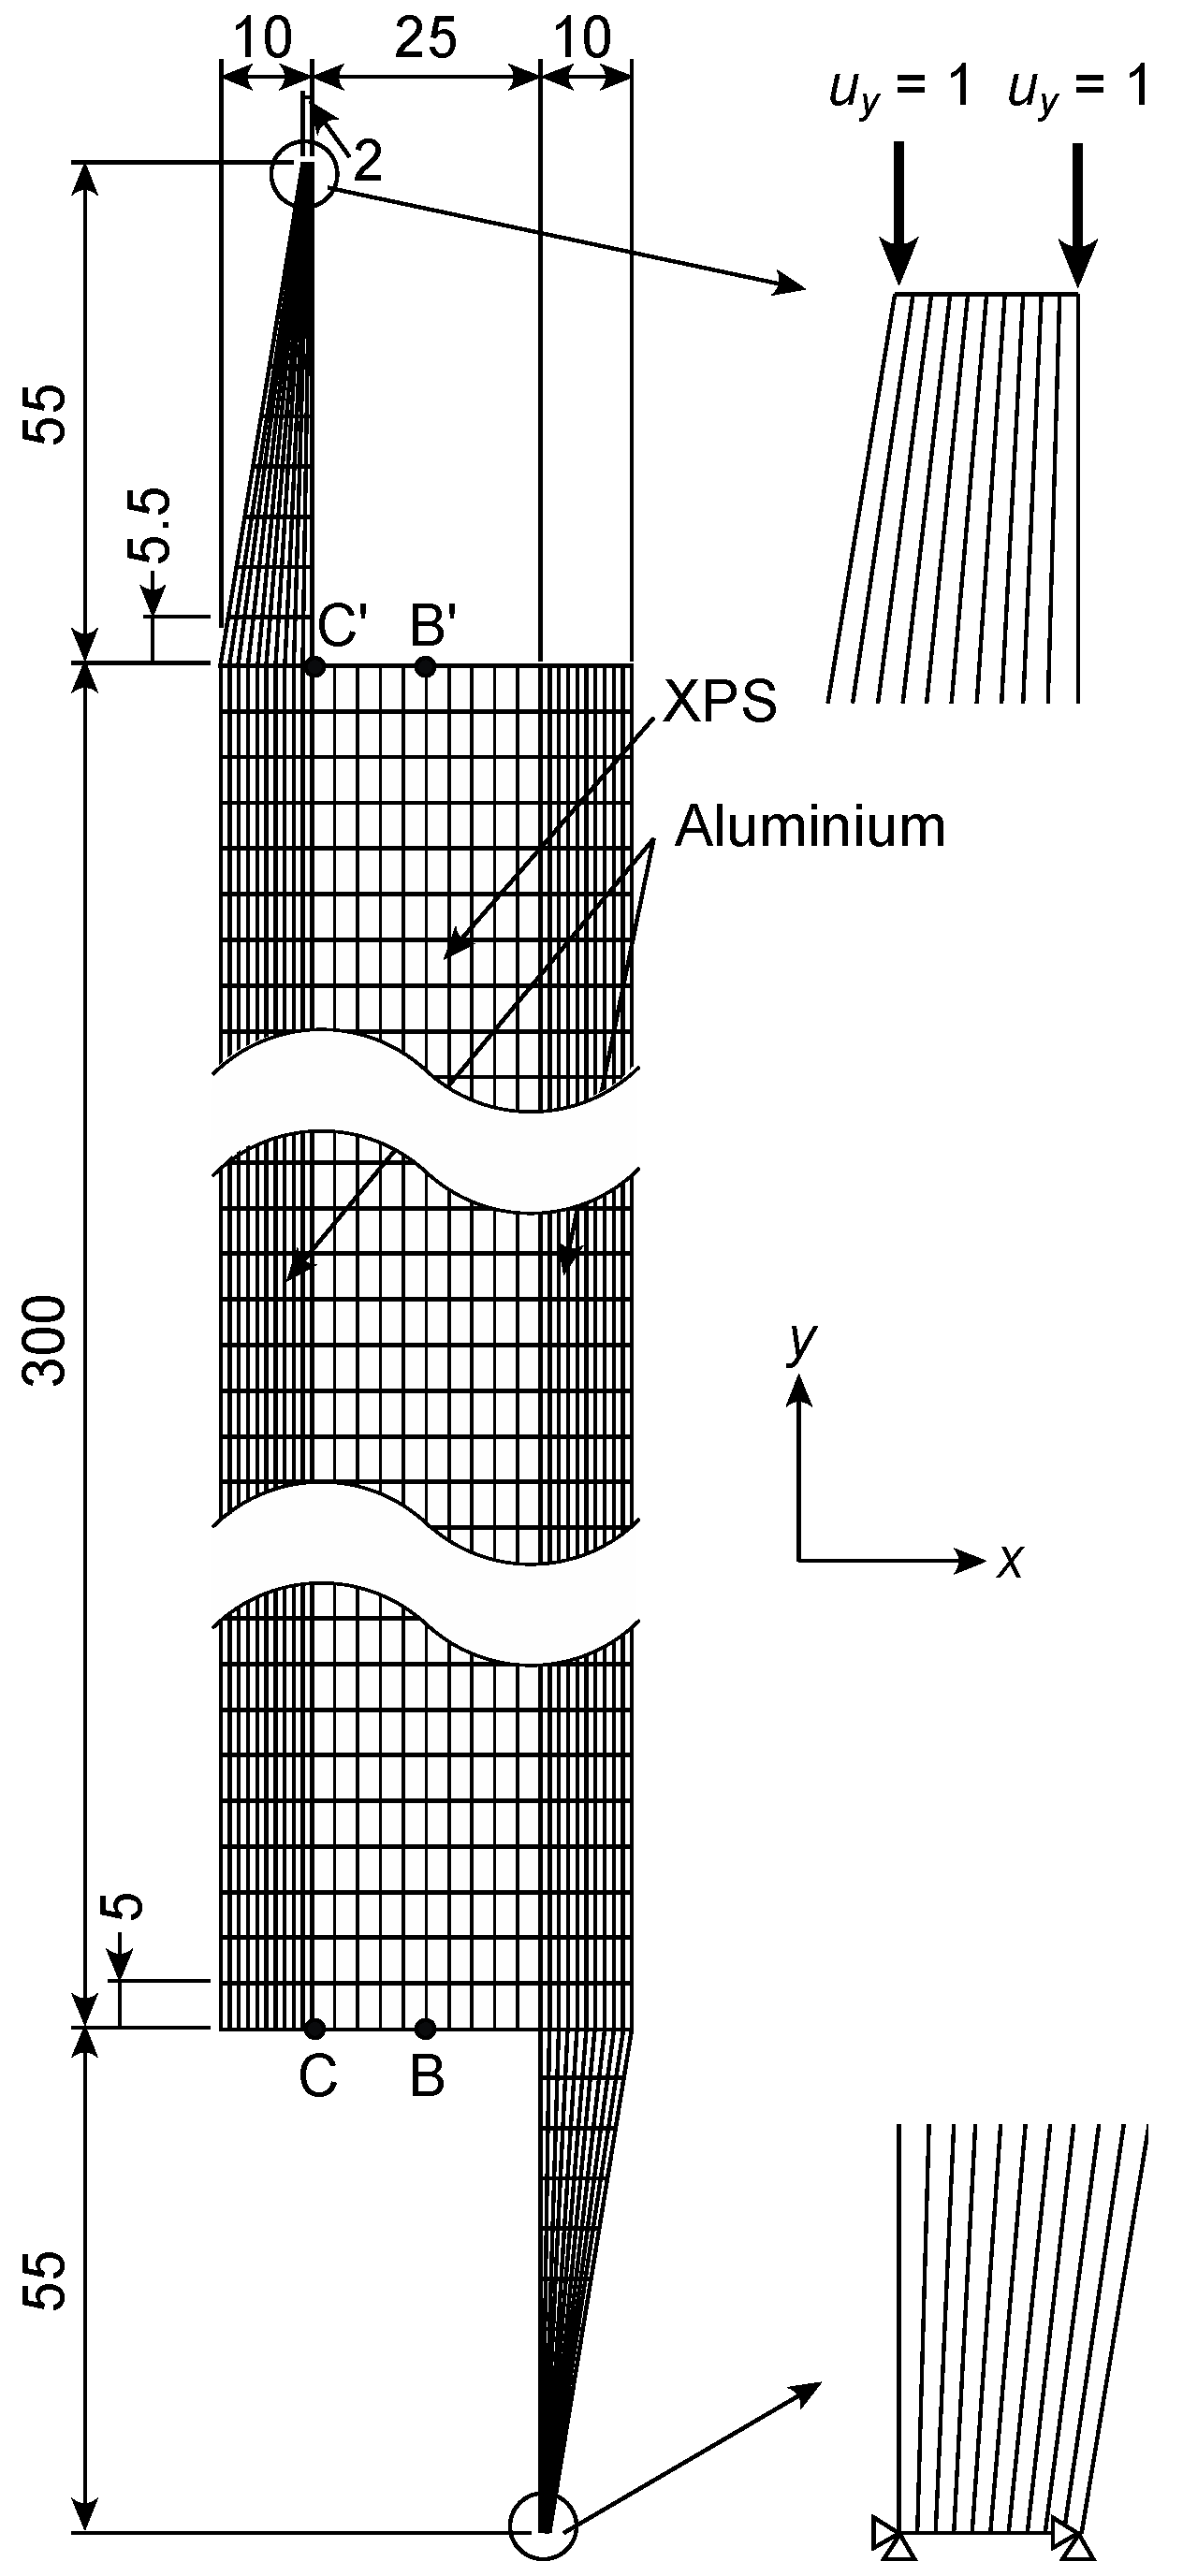
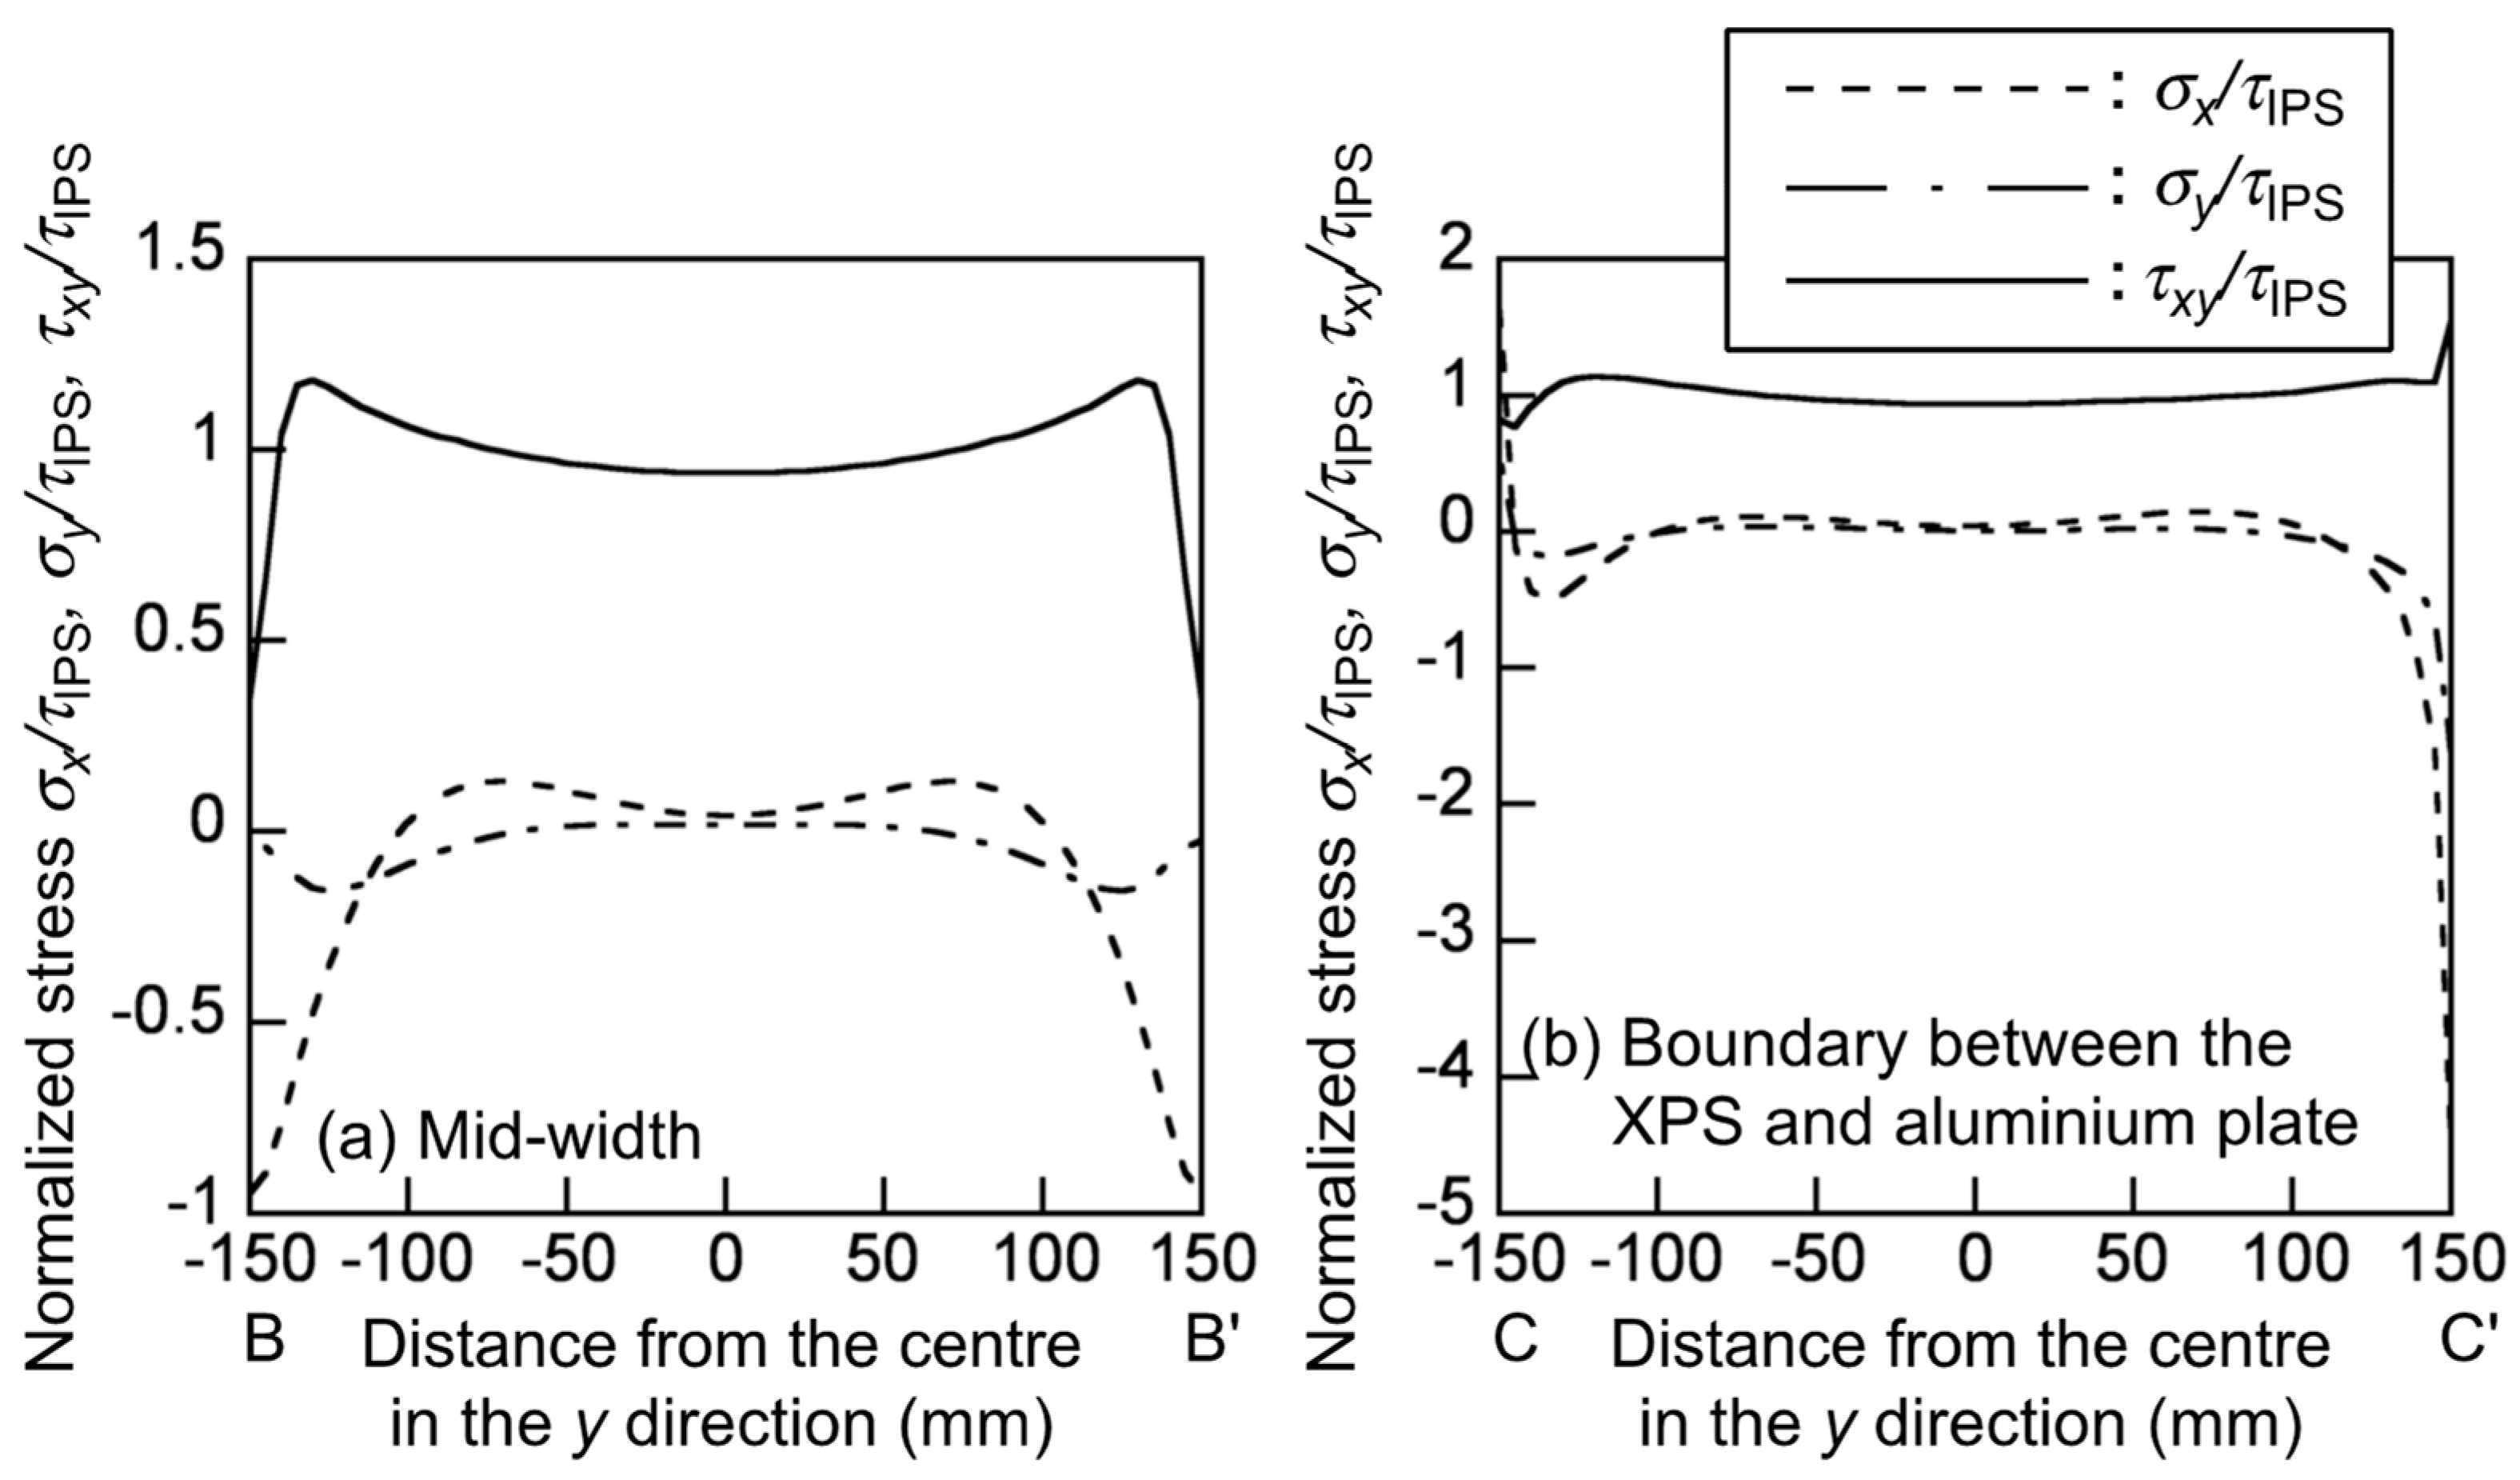
Figure 6 shows the distribution of the normalised stresses
σx/
τIPS,
σy/
τIPS and
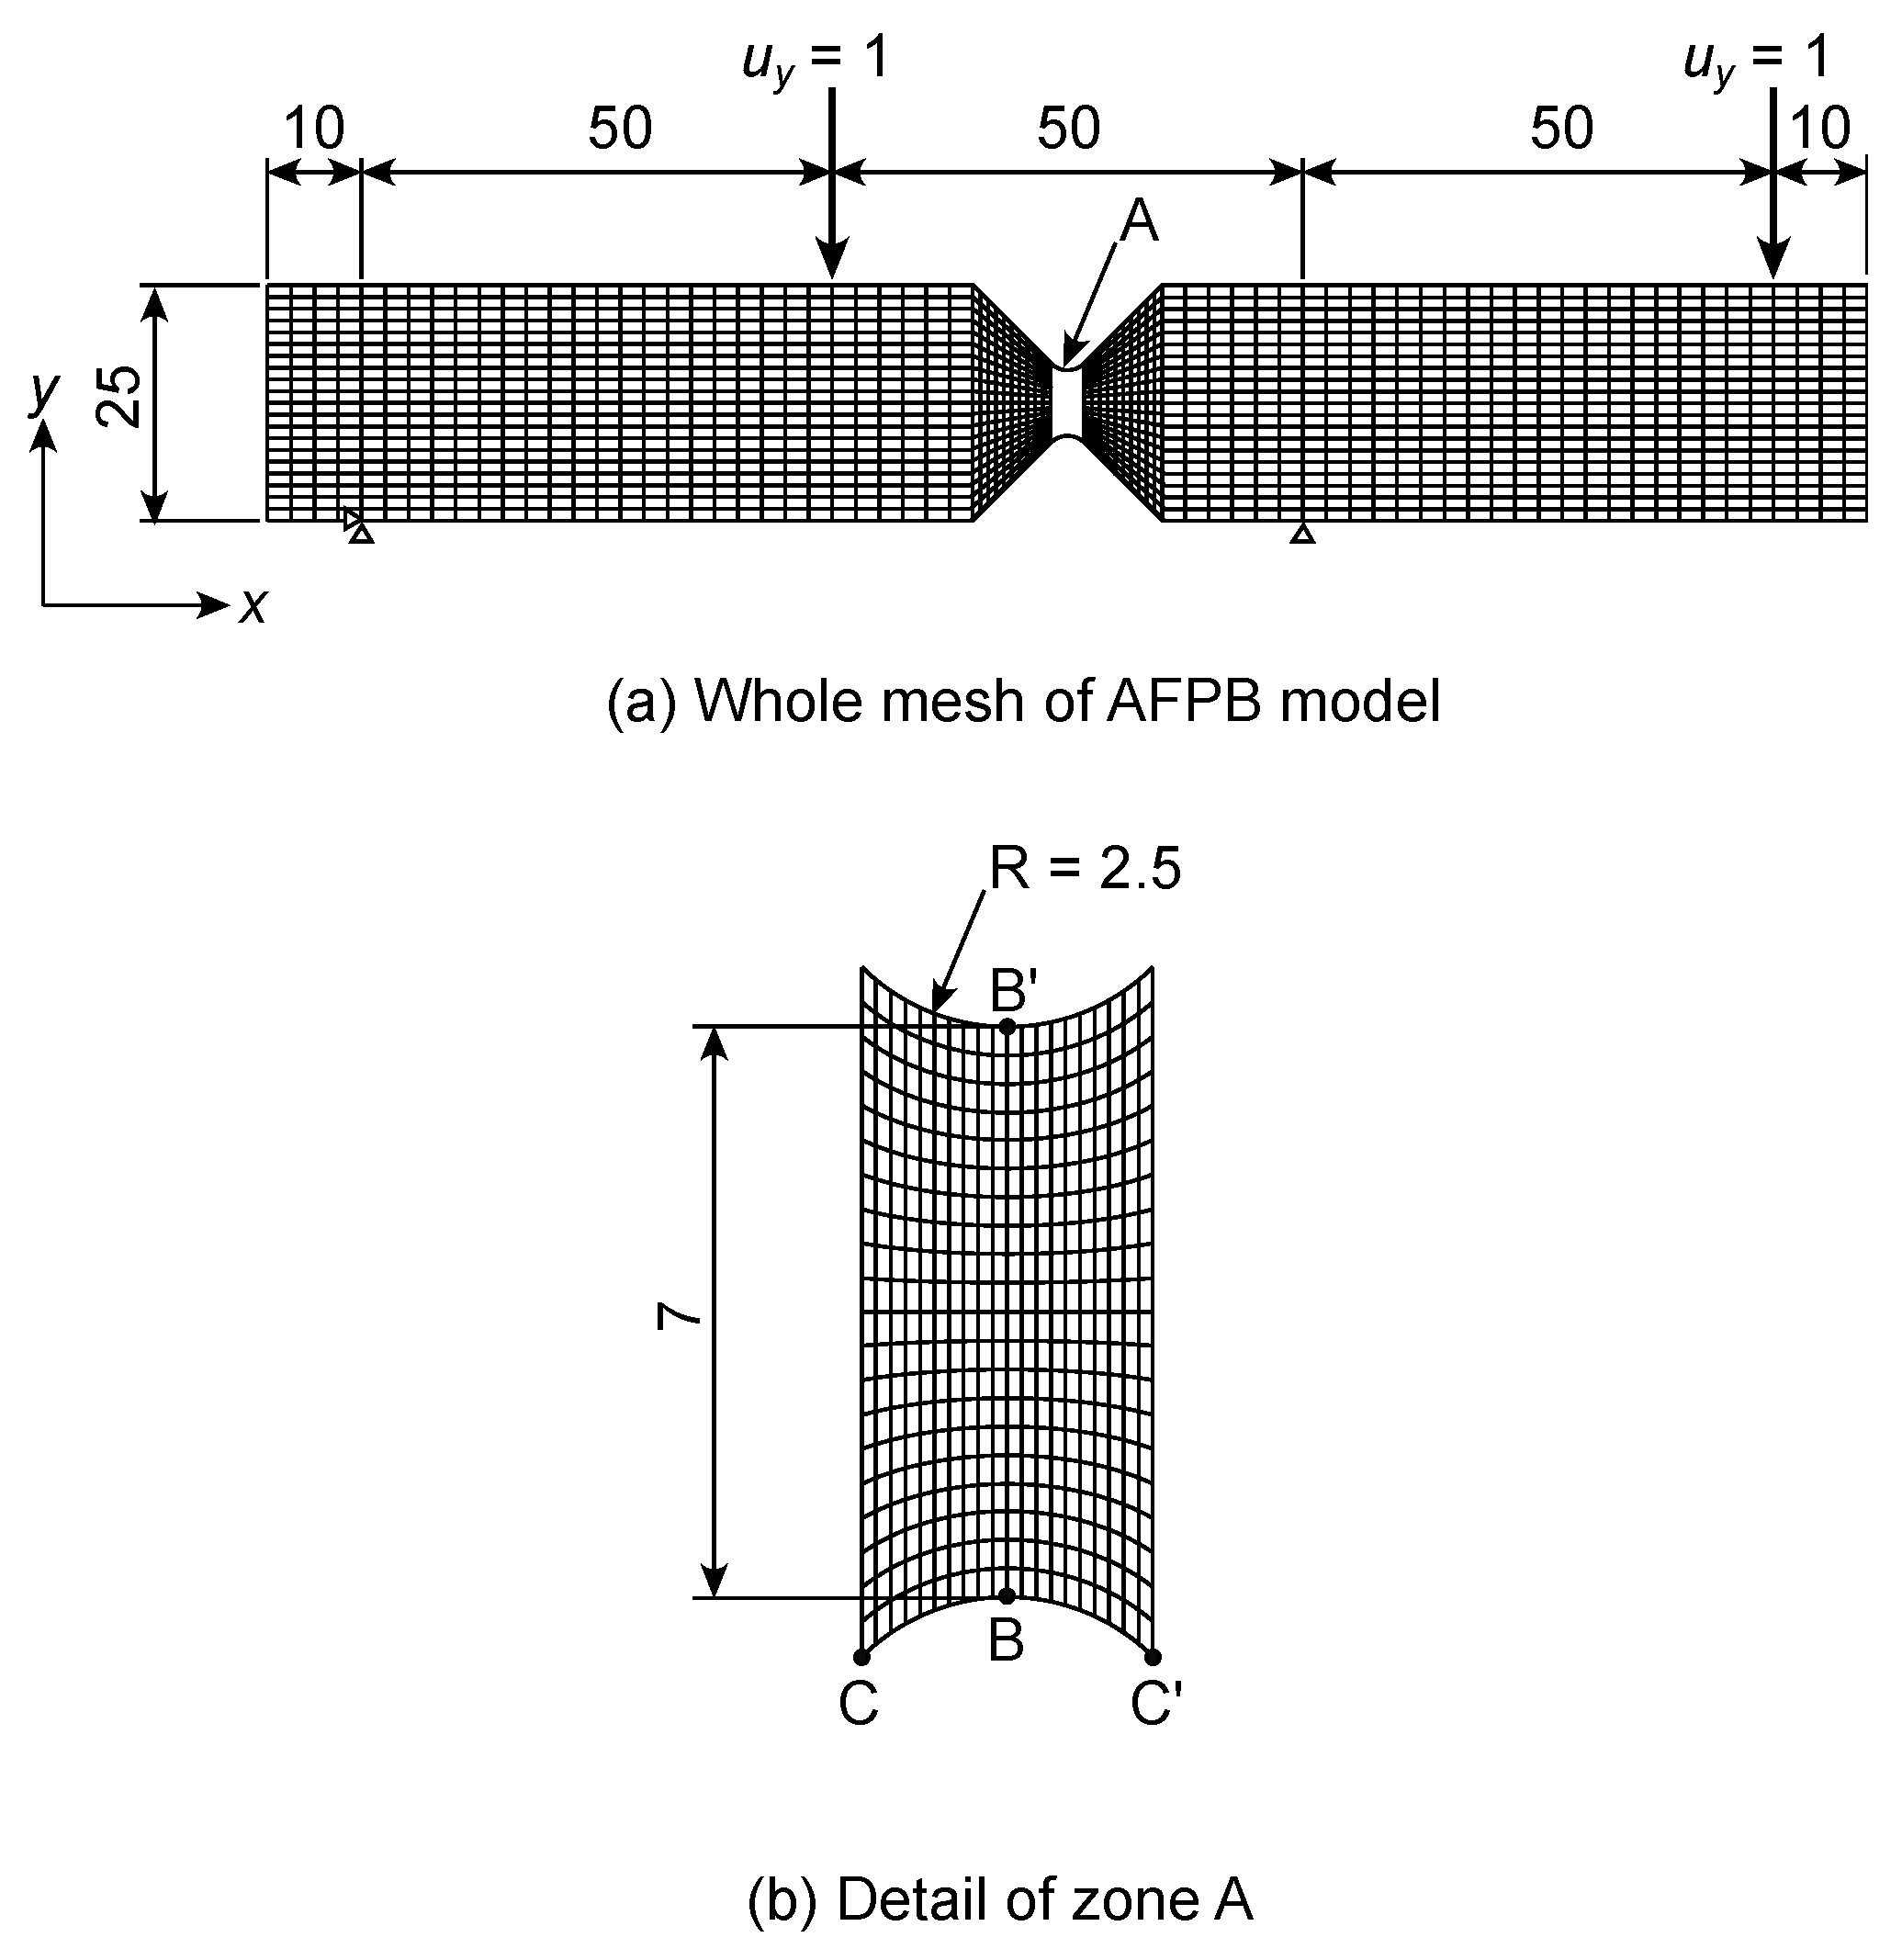
τxy/τIPS at the mid-width and boundary between the XPS and aluminium plate, which correspond to BB’ and CC’ in
Figure 4, respectively. At the mid-width, the shear stress component is more significant than the normal stresses, and its distribution is relatively uniform. However, at the boundary between the XPS and the aluminium plate, the compressive stresses in the
x and
y directions are markedly enhanced at point C’ (
σx/
τIPS = −4.47 and
σy/
τIPS = −1.64), because of the rectangular edge between the XPS and aluminium plate. When the shear modulus is measured using an LVDT as determined in the ASTM C273/C273M-11, these stress concentrations and combined stress condition enhance the displacement measured by the LVDT, and the shear modulus value is estimated as low. Additionally, the stress concentrations also enhance the failure. Therefore, there is a concern that the shear strength value is also estimated as low.
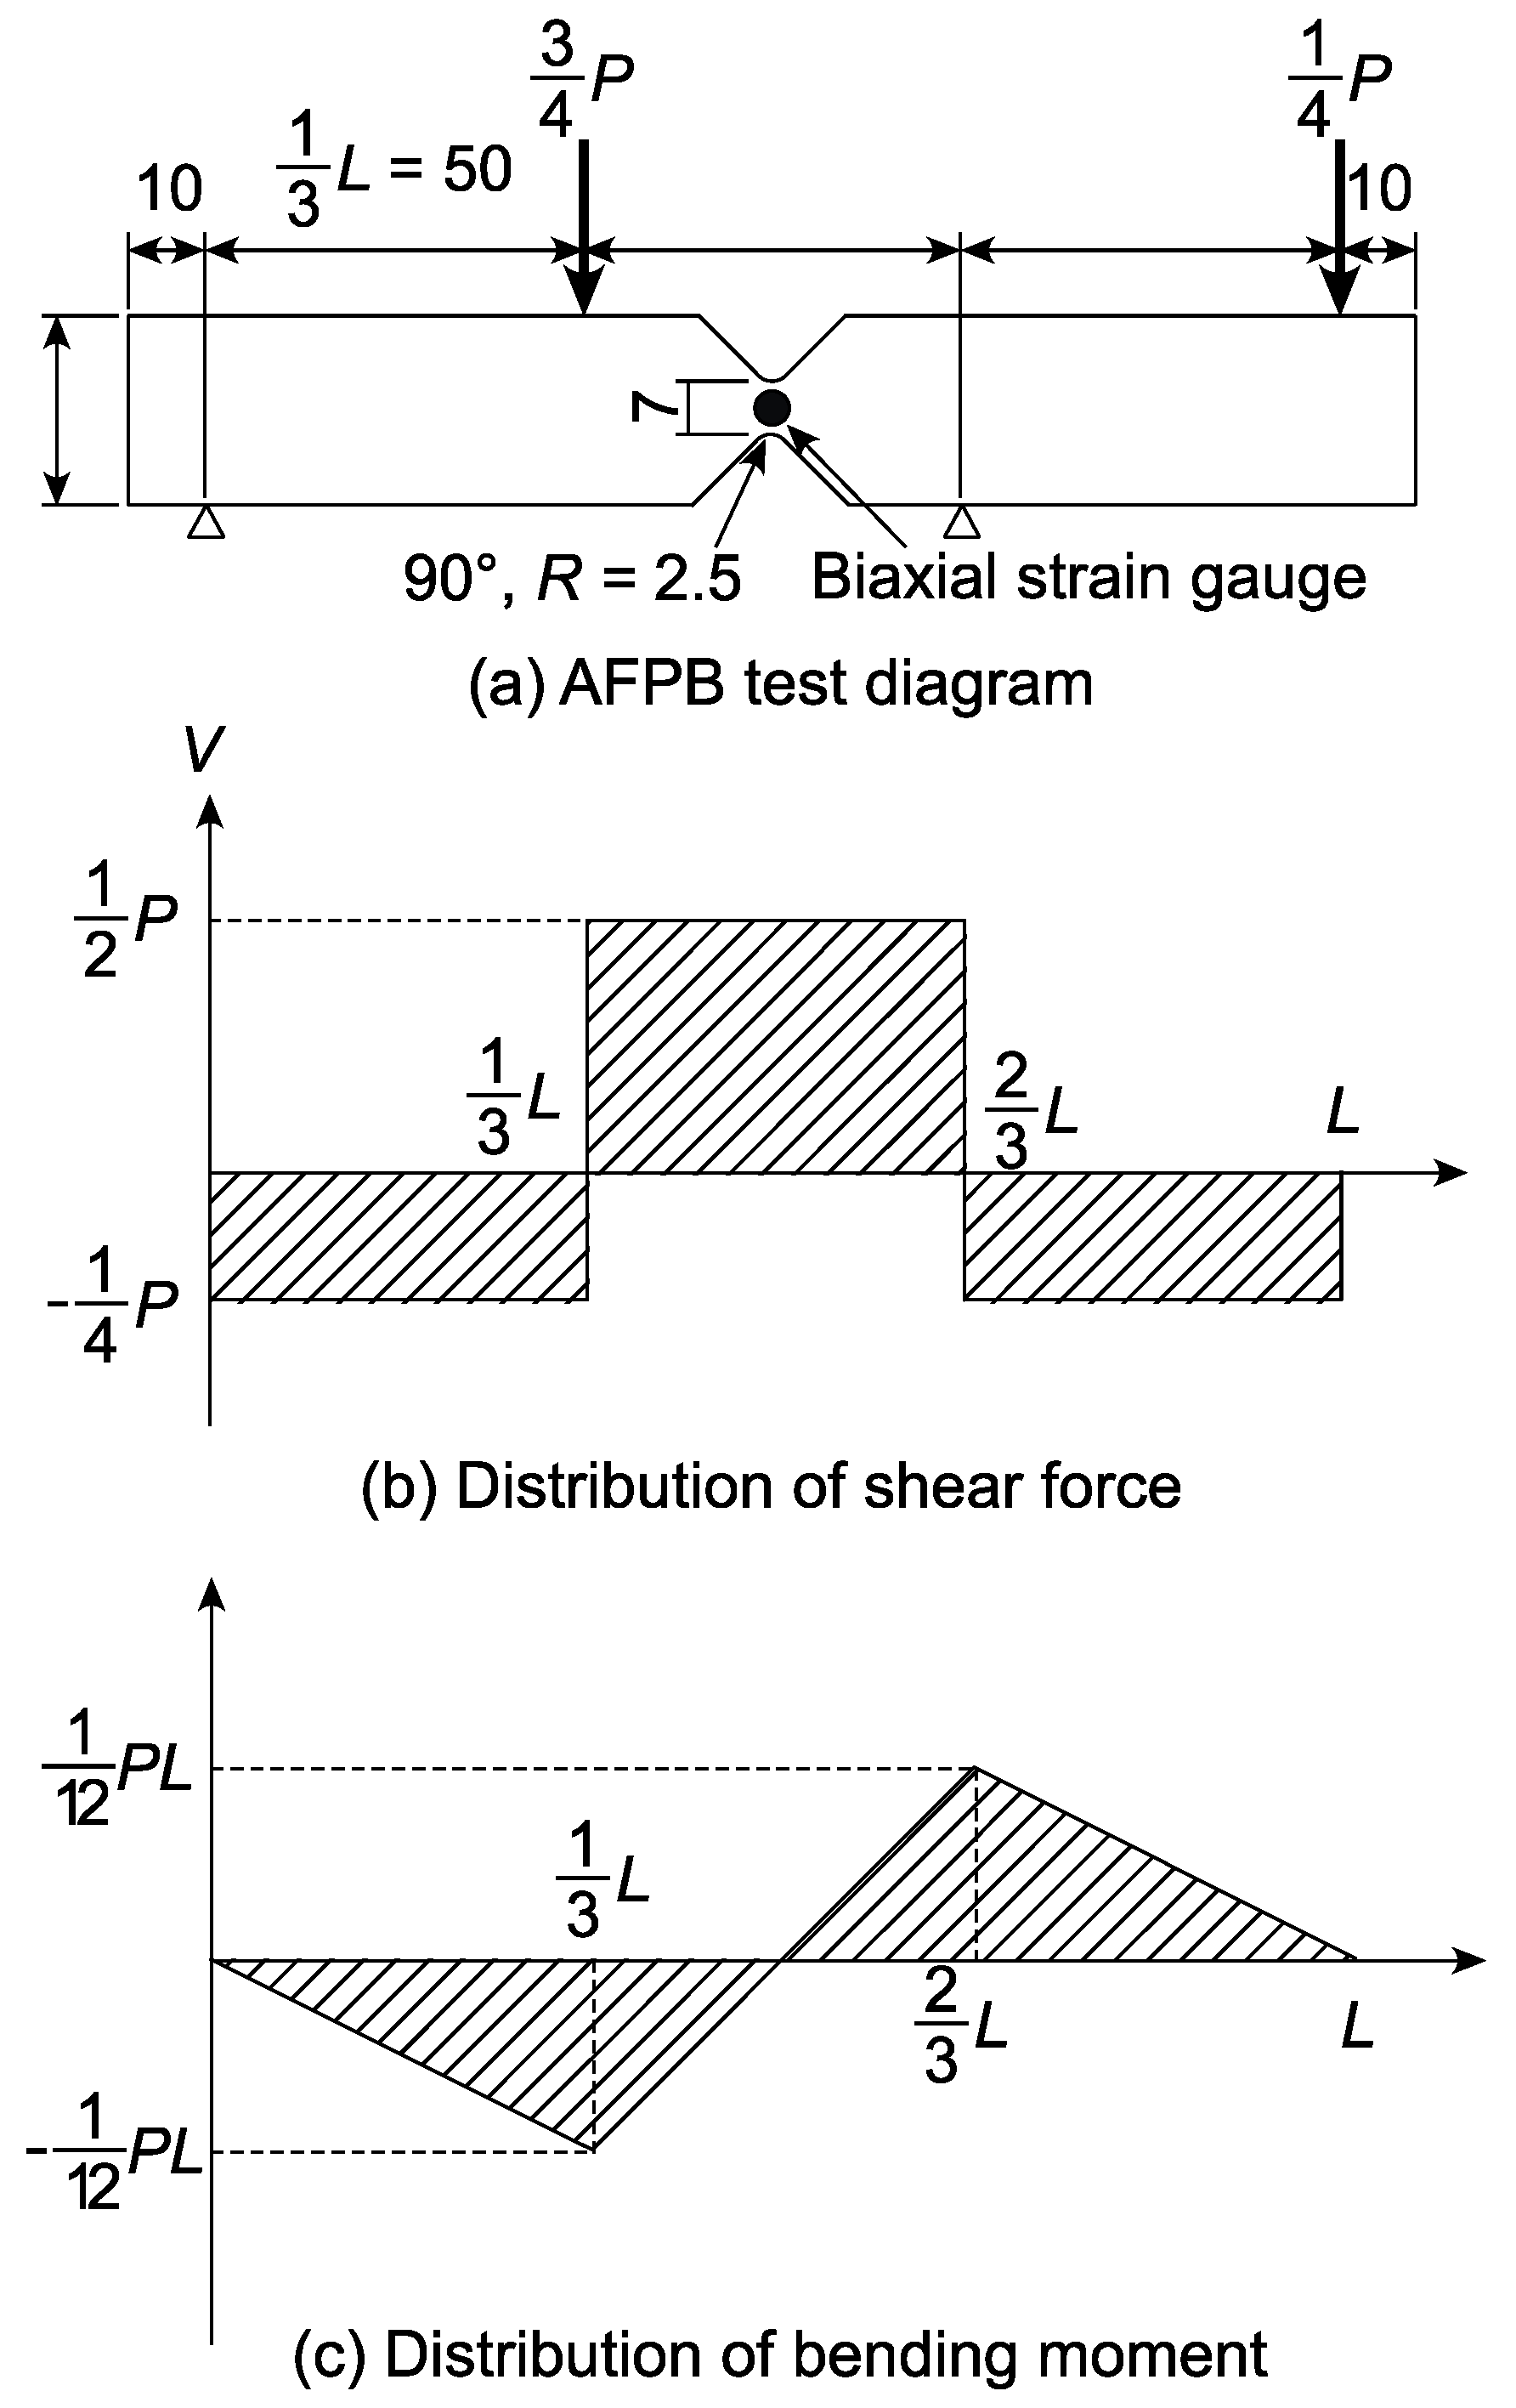
In the AFPB test simulation, the
σx,
σy, and
τxy values were normalised by the nominal shear stress
τAFPB calculated from Equation (3).
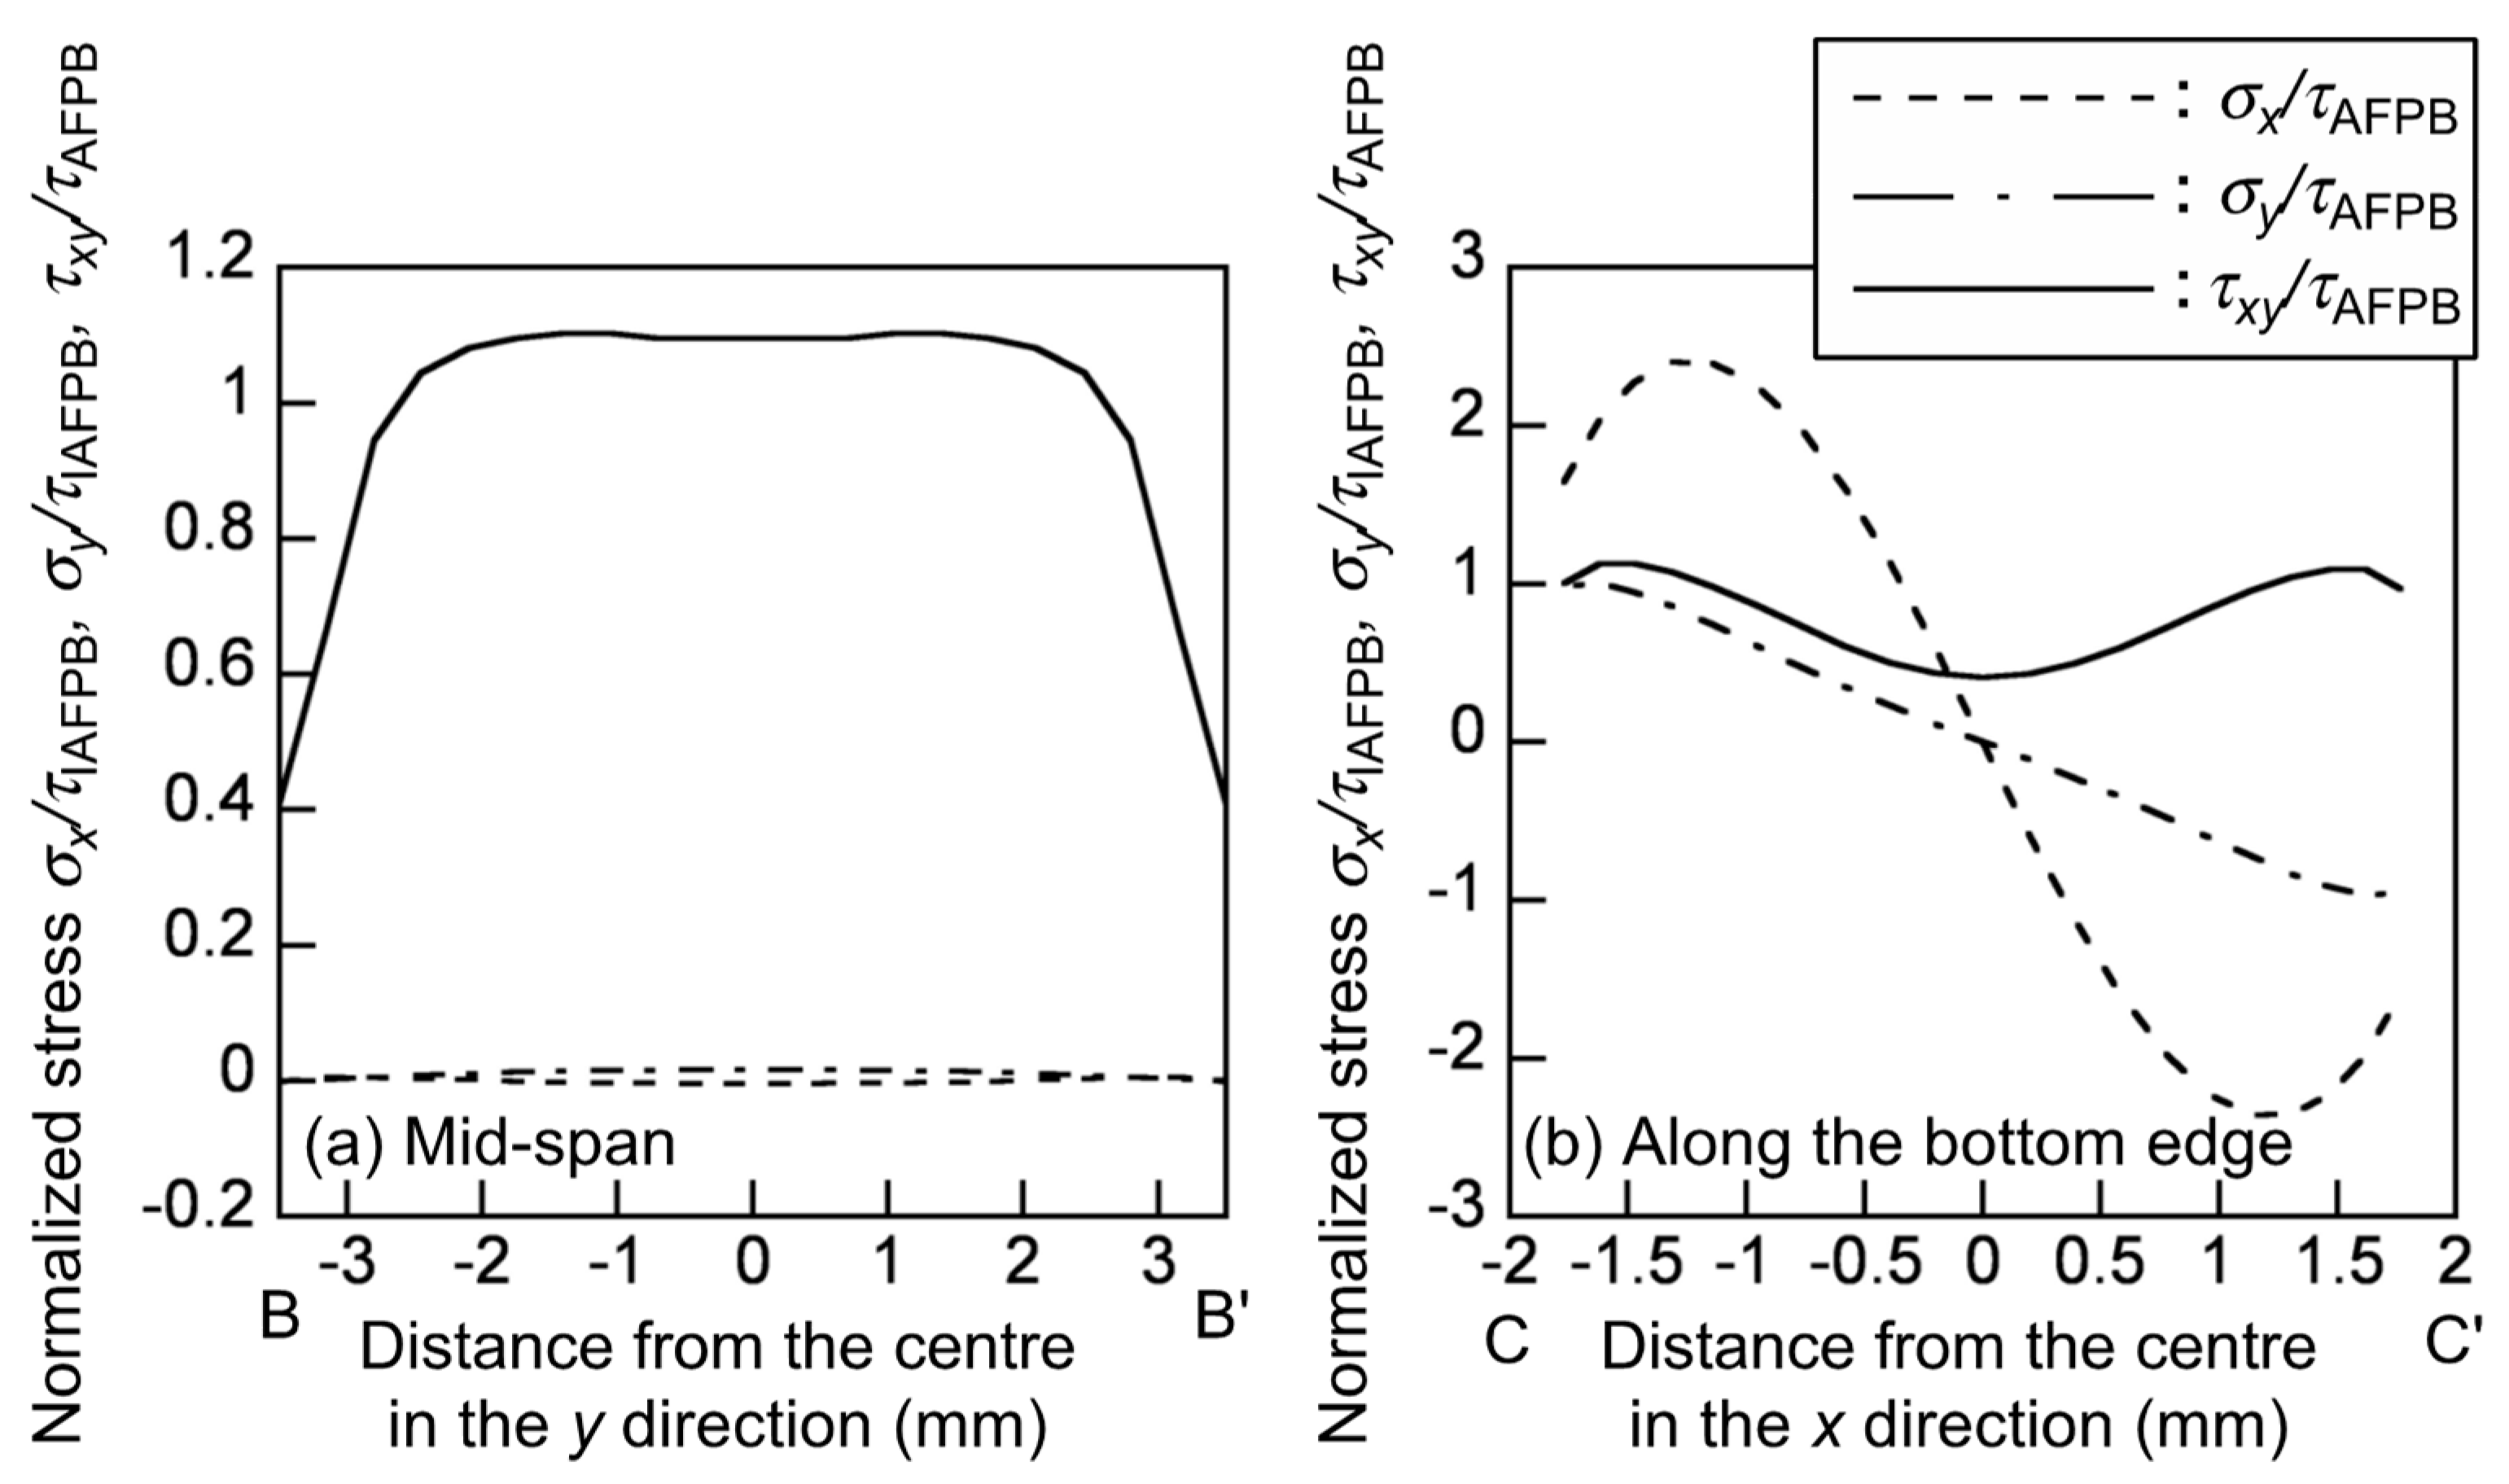
Figure 7 shows the distribution of the normalised stresses
σx/
τAFPB,
σy/
τAFPB and
τxy/τAFPB at the mid-span and along the bottom notch edge, which correspond to BB’ and CC’ in
Figure 5, respectively. The shear stress component is more significant than the normal stresses, but it distributes more uniformly than that in the IPS test. Therefore, when the shear strain is measured at the mid-span, it is expected that the shear modulus value obtained from the actual AFPB test is more precise than that obtained from the actual IPS test. At the notch edge, however, the tensile and compressive stresses in the
x direction are markedly enhanced as
σx/
τAFPB = −2.40 and 2.36 at the points of
x = −1.31 and 1.31 mm, respectively. These values are smaller than that at the rectangular edge in the IPS test. However, there is also a concern that the shear strength value is estimated as low because of the combined stress condition. Further research should be conducted on the specimen configuration to measure the shear strength value with reducing the effect of the stress concentration and combined stress condition.
Table 3 shows the shear modulus values obtained from the IPS and AFPB test simulations. Because of the stress concentration described above, the shear modulus values obtained from the IPS test simulations are significantly smaller than those input into the FEM program. In contrast, the shear modulus values obtained from the AFPB simulations are closer to the input values than those obtained from the IPS test simulations. The concentration of the normal stress components is also found in the AFPB test simulation at the notch edge. However, as described above, the stress concentration in the AFPB test is less significant than that in the IPS test. Because the IPS test is standardised as the ASTM C273/C273M-11 [
19], it is conducted more frequently than the AFPB test. However, based on the FEA results, it is preferable to measure the shear modulus and shear strength values of XPS from the AFPB test rather than the IPS test.
4.2. IPS and AFPB Tests
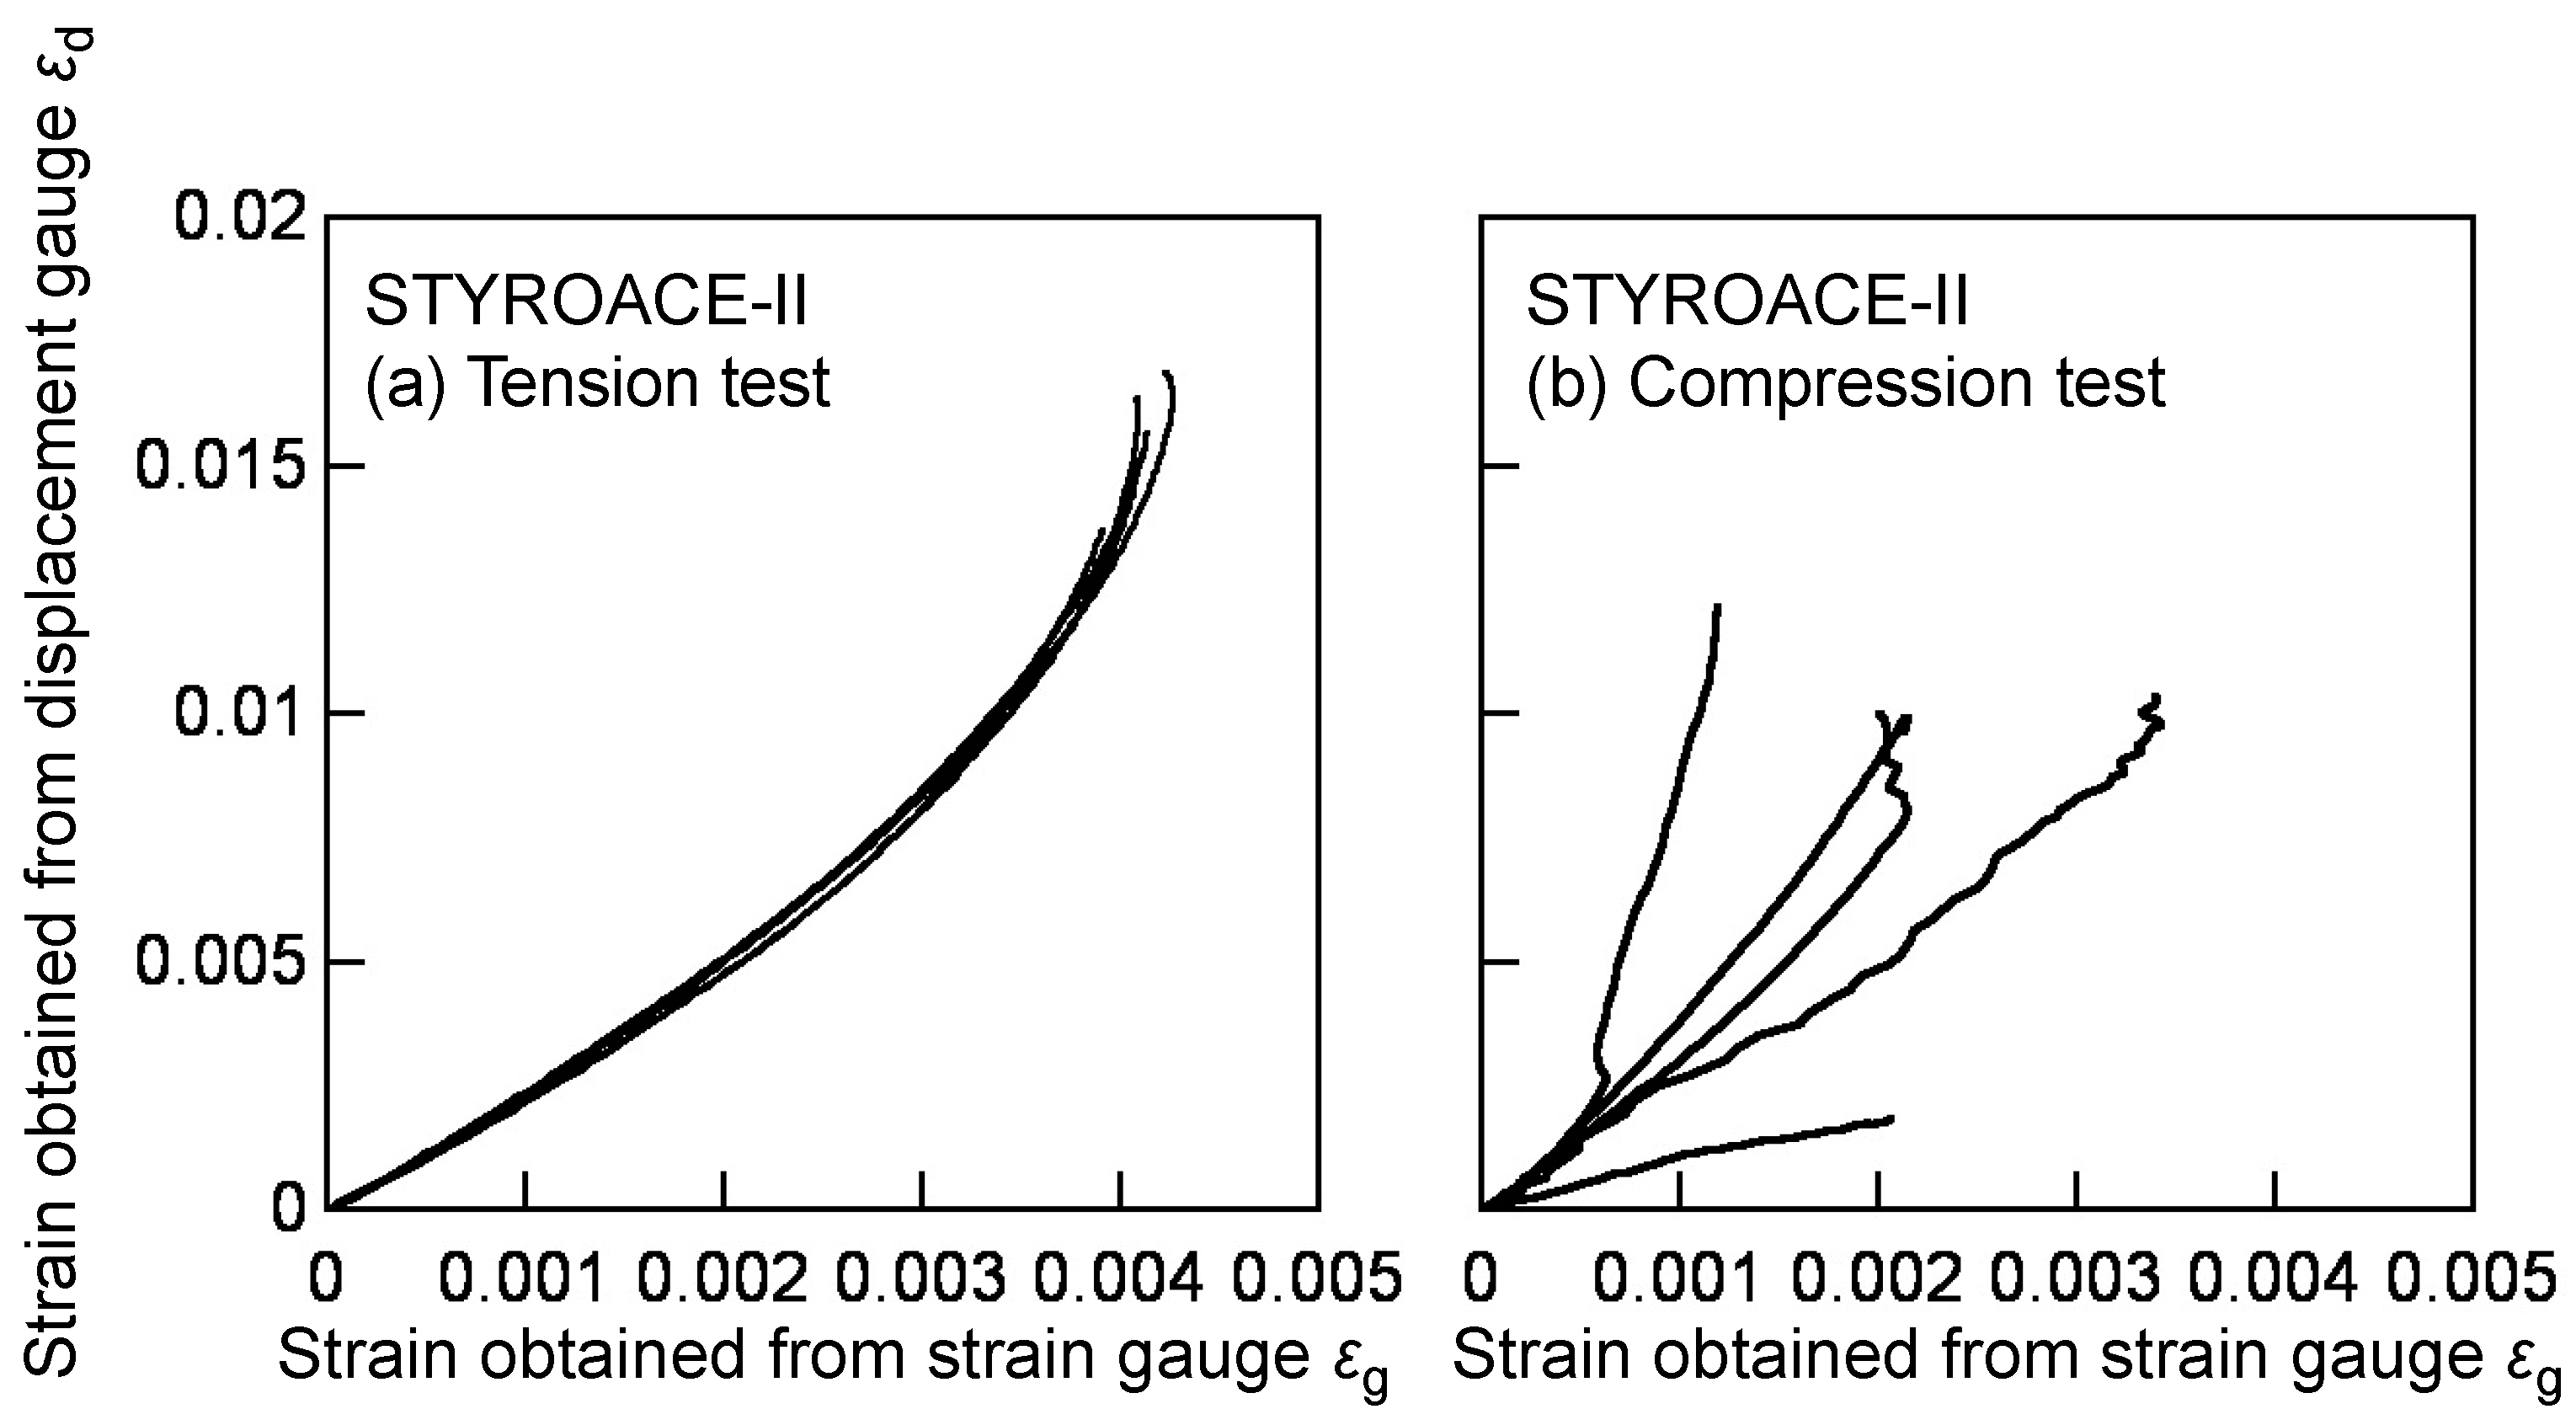
Figure 8 shows the typical examples of the relationships between the strain measured from the displacement gauge
εd and that measured using the strain gauge
εg in the tension and compression tests for strain calibration. As shown in this figure, the
εd–
εg relationships obtained from the specimens cut from the same panel coincide well with each other in the tension tests. In contrast, the relationships obtained from the compression tests vary. In the compression test, the load was applied directly to the end surface of the specimen. Therefore, there was a concern that the load was often applied eccentrically to the specimen due to the distortion of the end surface. Because of the variation, it is often difficult to calibrate the strain using the results obtained from the compression tests. In contrast, the load was applied via the grips in the tension tests and the condition of the end surface did not influence the
εd–
εg relationship. Therefore, the
εd–
εg relationship was obtained stably in the tension test. Based on these testing results, the
εd–
εg relationships obtained from the tension tests were used for the calibration in this study.
Because of the insensitivity of the strain gauge,
εg is much smaller than
εd, as shown in
Figure 7a. The
εd–
εg relationship is initially linear and gradually becomes concave, and these tendencies were commonly found in every XPS material. Considering these tendencies, the
εd–
εg relationship was formulated using a power function as follows:
where
α,
β, and
c are the parameters obtained by the method of least squares. The
a,
b, and
c values corresponding to each XPS were obtained from the following procedure:
The εd–εg relationship corresponding to each specimen was regressed into Equation (6) by the method of least squares.
The εg values were virtually determined in the range from 0 to 0.005 at intervals of 0.0001, and the εd values were obtained by substituting the εg values into the regressed equation.
The εd values obtained from the same εg value were averaged among the same XPS material. The averaged εd–εg relationship was regressed into Equation (6) again, and the a, b, and c values were determined.
The
α,
β, and
c values obtained from this procedure are listed in
Table 4. The calibrated shear strain
γc was calculated from the shear strain
γg, which was calculated from the strain gauge output using Equation (6), as follows:
Figure 9 shows the typical examples of the shear stress–shear strain relationships obtained from the IPS test
τIPS–
γIPS, and AFPB test
τAFPB–
γg, and
τAFPB–
γc. In the AFPB test, the shear strain obtained from the strain gauge
γg is much smaller than that in the IPS test
γIPS because of the insensitivity of the strain gauge. Additionally, the nonlinearity in the
τAFPB–
γg relationship is not often significant, such that the stress–strain relationship is extremely discrepant from that obtained from the IPS test. When conducting the strain calibration using Equation (6), however, the linear region is significant in the linear portion of the
τAFPB–
γc relationship, and the nonlinear strain region is more pronounced.
Table 5 lists the shear modulus values obtained from the IPS and AFPB tests. Similar to the results of the FEAs, the shear modulus values obtained from the IPS tests are significantly lower than those obtained from the AFPB tests. In the IPS test, the stress concentration at the rectangular edge between the XPS and aluminium plate induces a large shear deformation; therefore, the shear modulus value is measured as lower in the IPS test. In contrast, the stress concentration at the notch edge in the AFPB test is not more significant than that at the rectangular edge between the XPS and aluminium plate in the IPS test.
Table 5 also lists the values of the in-plane shear modulus
GLT (
GTL) obtained from the static SPT tests in a previous study [
14] and the unpaired
t-tests of the differences of the
GLT and
GTL values obtained from these tests were conducted. The SPT tests were conducted using the specimens cut from XPS panels similar to those used in this study. The
GLT and
GTL values obtained from the IPS tests are significantly lower than those obtained from the SPT tests in the significance level of 0.01. In contrast, the difference between the
GLT and
GTL values obtained from the AFPB and SPT tests are not significant in the significance level of 0.05. Therefore, the AFPB test is promising in obtaining the shear modulus, in a similar way to the SPT test. However, the measurement of the shear strain is indirect, despite the effectiveness in using the strain gauge. To improve the accuracy in measuring the shear modulus, the aforementioned alternative techniques, such as the digital image correlation (DIC) and virtual field method (VFM), should be adopted for the AFPB test in place of the strain gauge [
15,
16,
17,
18,
20]. Further research should be performed on this topic.
Table 6 lists the shear strength values obtained from the IPS and AFPB tests. The shear strength values obtained from the AFPB tests are significantly higher than those obtained from the IPS tests. Because the effect of the stress concentration is less significant in the AFPB test than in the IPS test, the AFPB test is preferable to the IPS test for measuring the shear strength value.
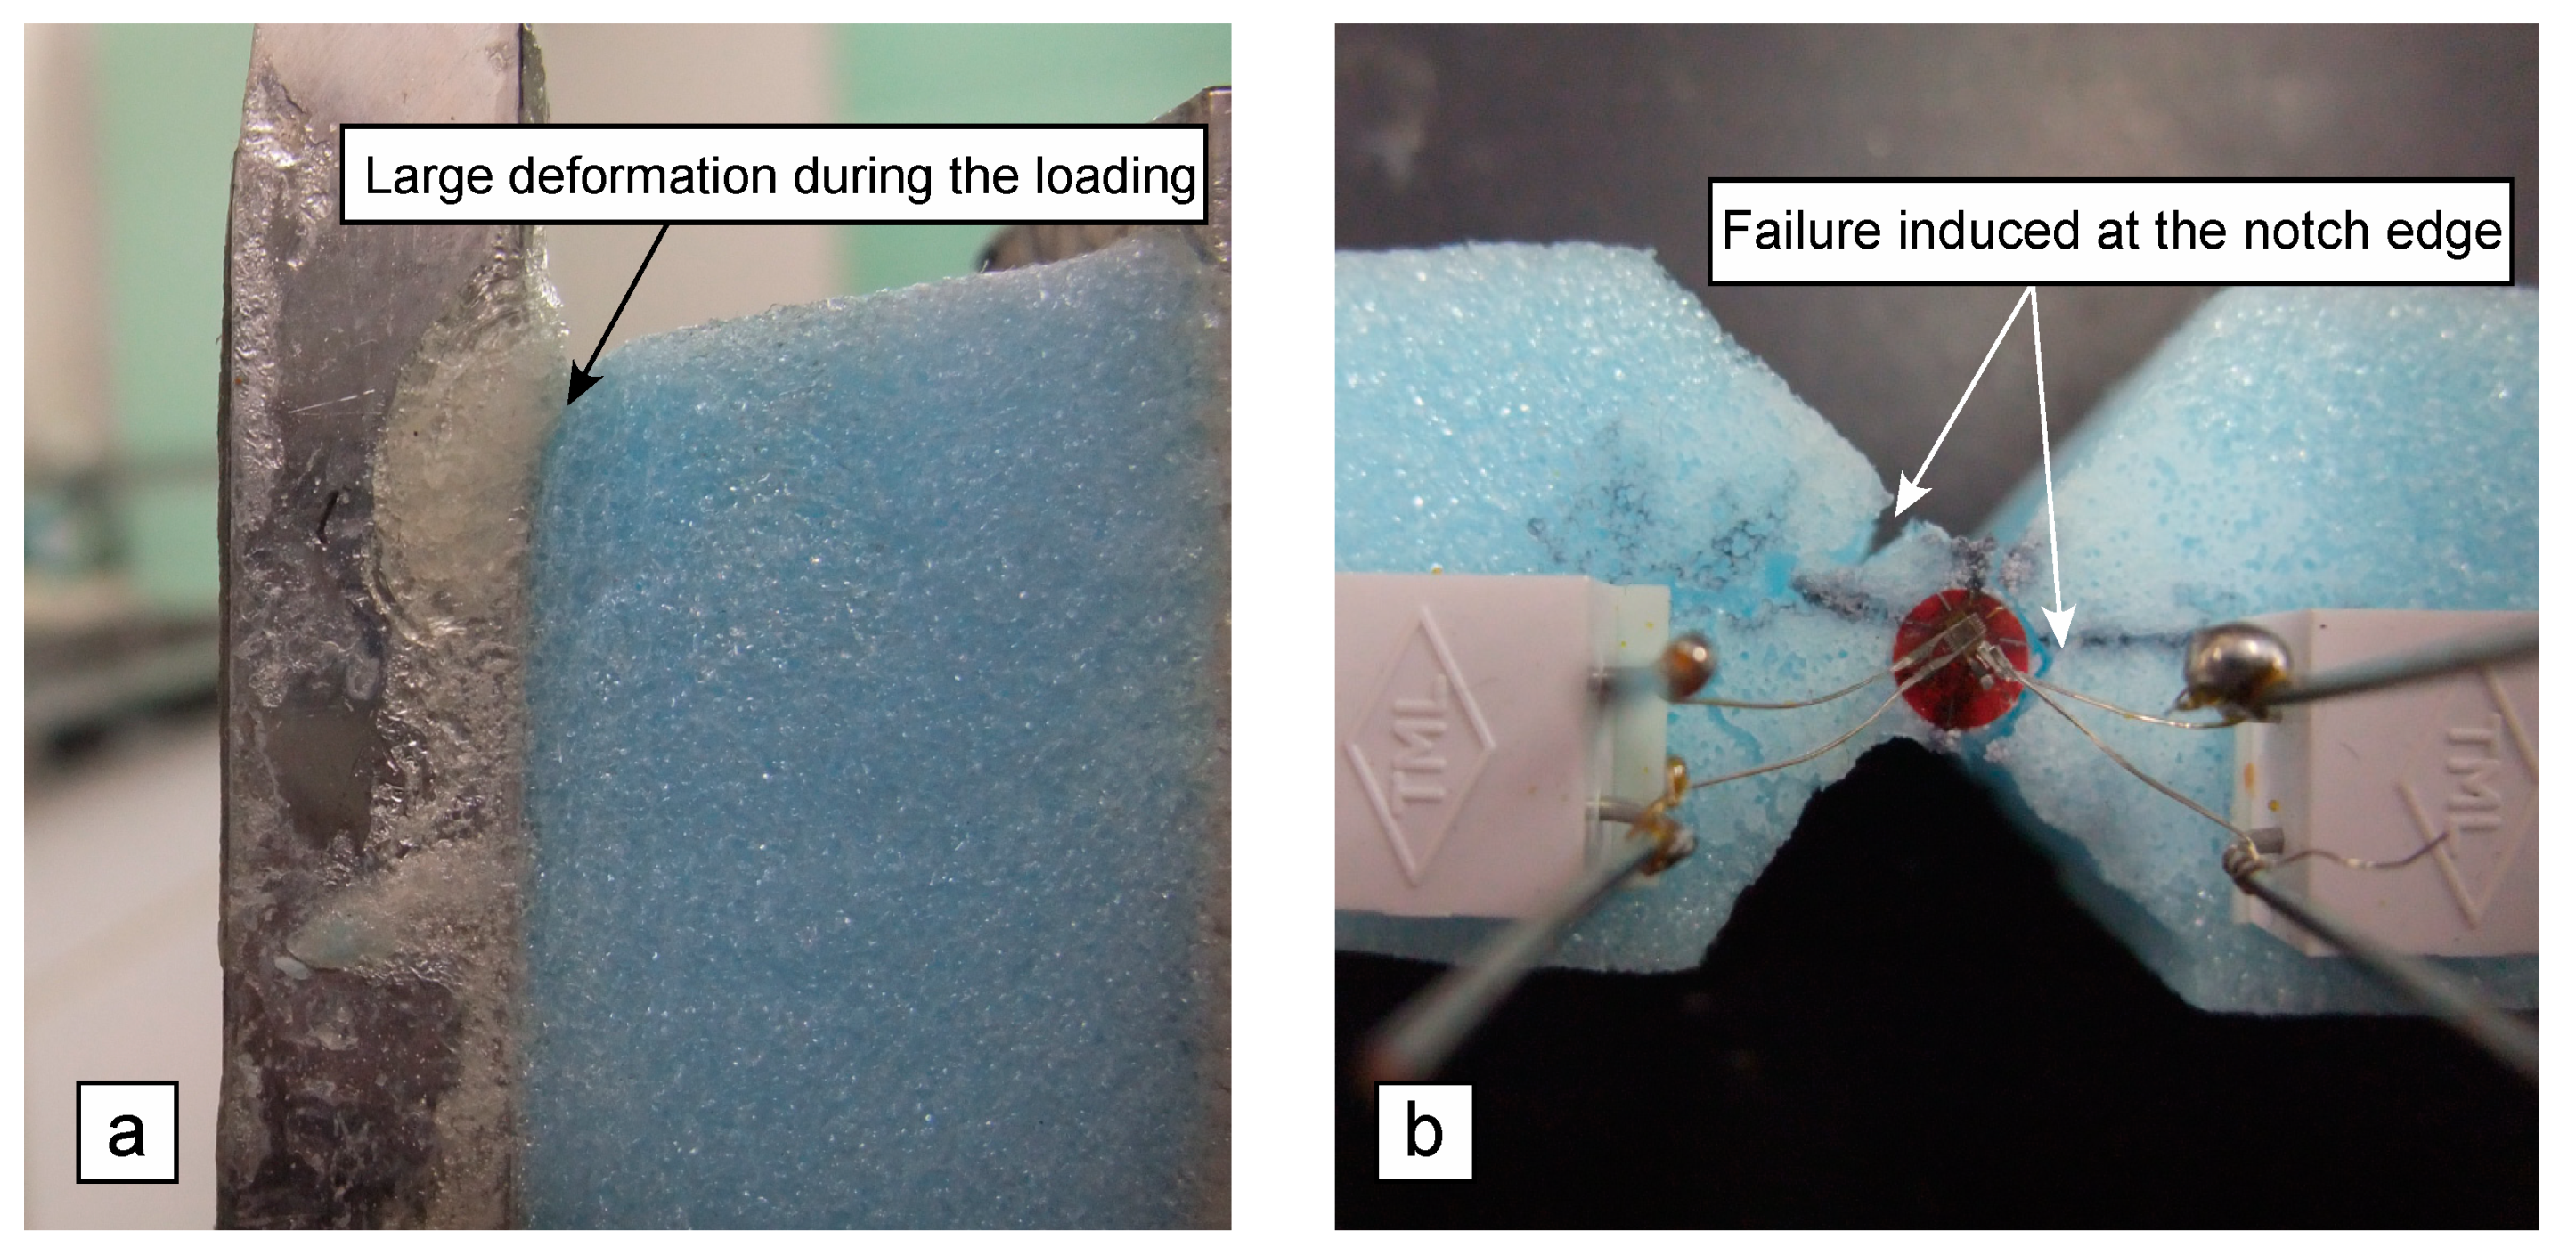
Figure 10a shows the large deformation at the rectangular edge between the XPS and aluminium plate during the loading. The failure was initiated and propagated from the rectangular edge. The large deformation is induced due to the stress concentration, and, as described above, there is a concern that the shear modulus and shear strength are estimated as low because of the stress concentration at this point.
Figure 10b shows the failures induced in the AFPB test. The failure is induced at the top and/or bottom notch edges, and it propagates obliquely in the specimen. It is desirable that the failure is exactly induced at the mid-length, which corresponds to the region between B and B’ in
Figure 5b, because the failure at this region is induced due to the pure shear stress, as shown in
Figure 7. However,
Figure 10b indicates that the catastrophic failure was often induced at a point deviating from the mid-length at the top and/or bottom notch edges. Therefore, there is a concern that failure due to the combined stress condition is induced, as predicted from the FE calculation (
Figure 7b). In strongly orthotropic materials like solid wood, even if a failure was initiated at a point deviating from the mid-length, the failure due to the shear stress was also induced at the mid-length when the load was applied continuously [
22]. Further research is required on the specimen configuration to reduce the effect of stress concentration thoroughly, although the shear strengths obtained from the AFPB tests are higher than those obtained from the IPS tests as listed in
Table 6.


