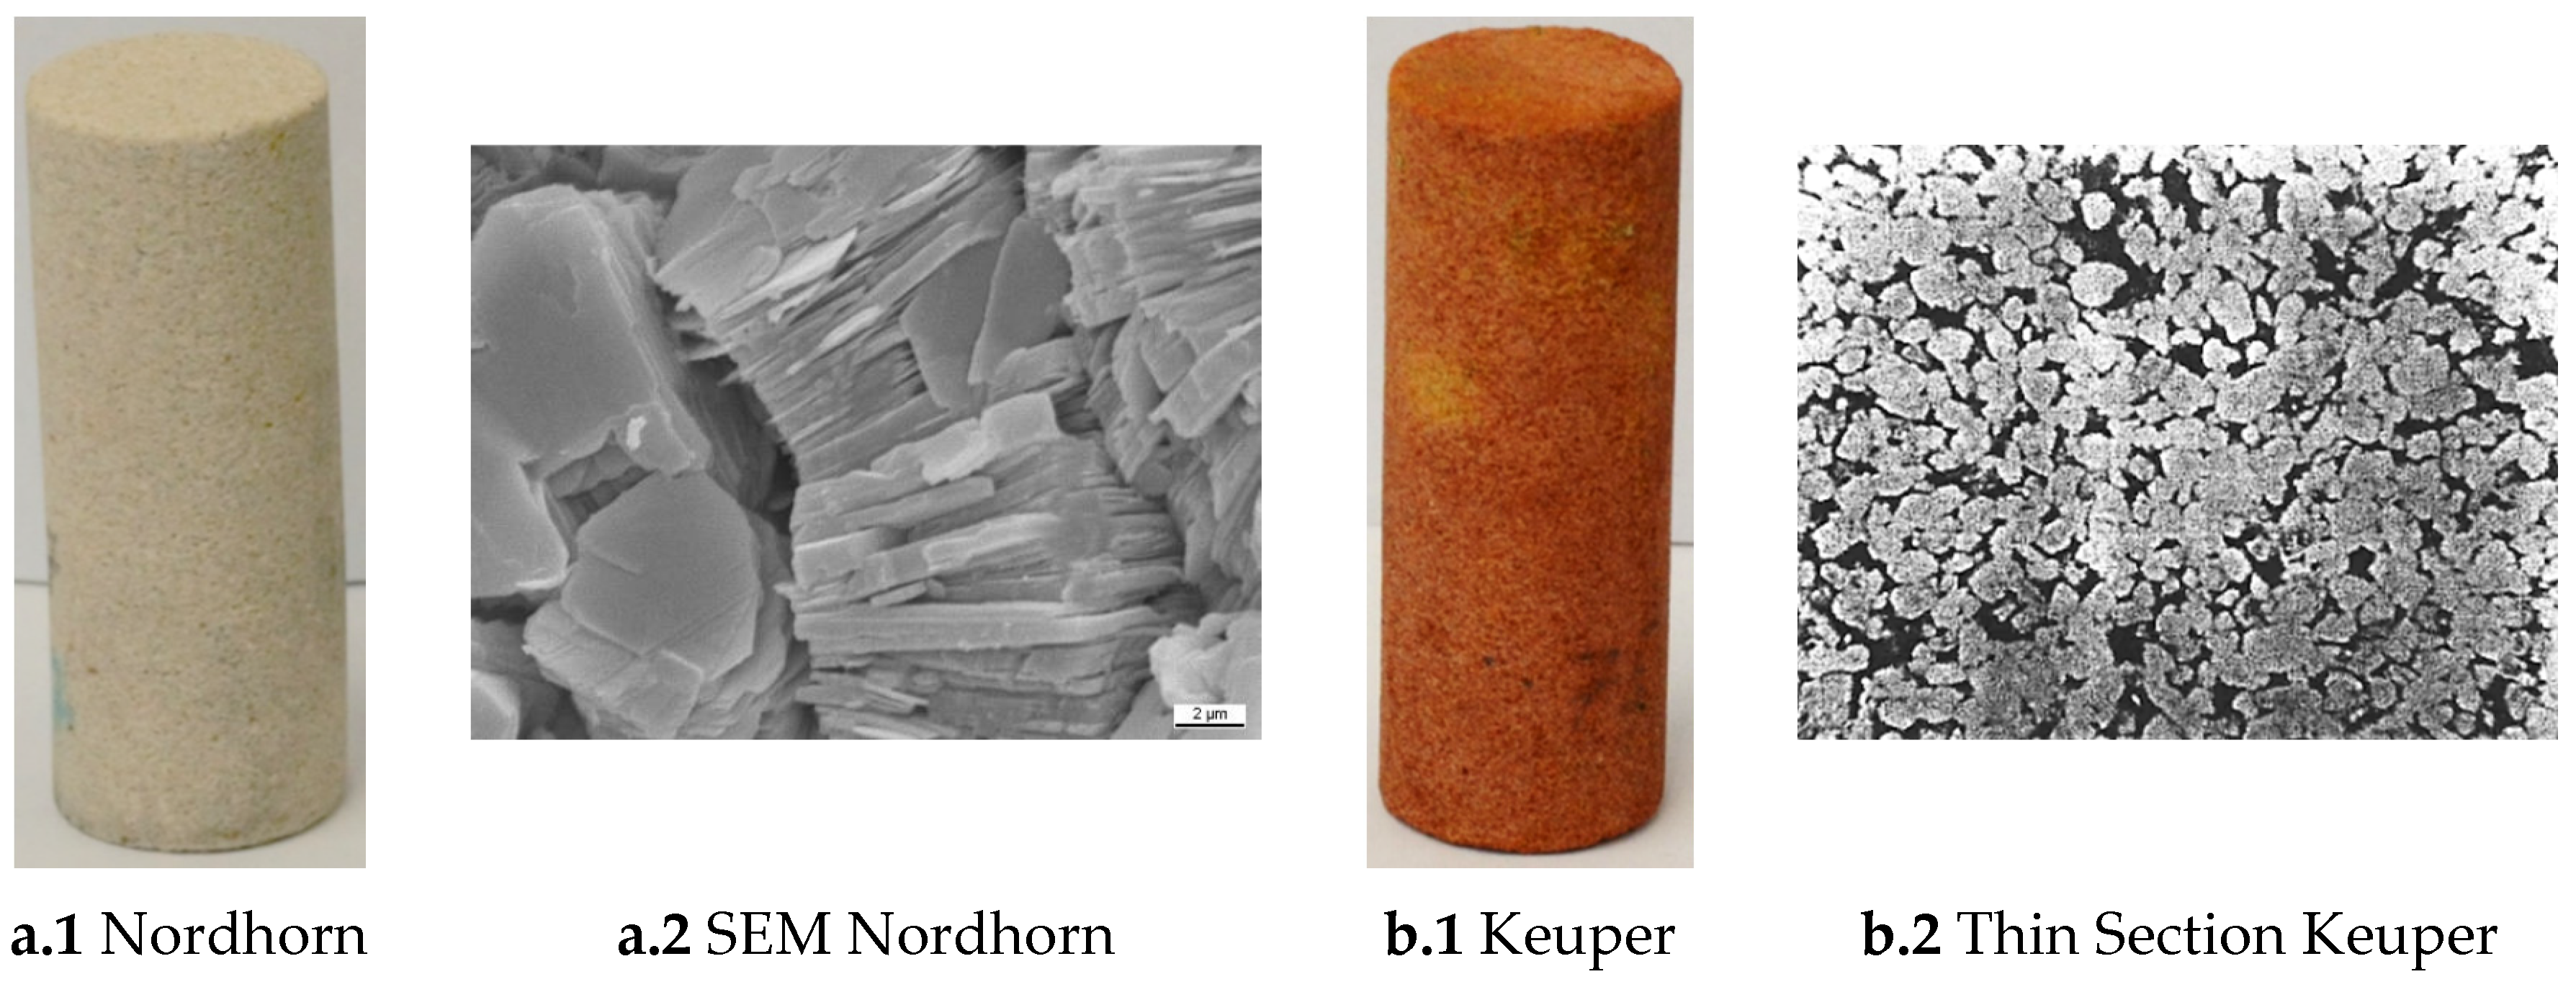
Figure 1.
Images of the outcrop core used in this work: Nordhorn (a.1 and a.2) and Keuper (b.1 and b.2). SEM refers to scanning electron microscope.
Figure 1.
Images of the outcrop core used in this work: Nordhorn (a.1 and a.2) and Keuper (b.1 and b.2). SEM refers to scanning electron microscope.
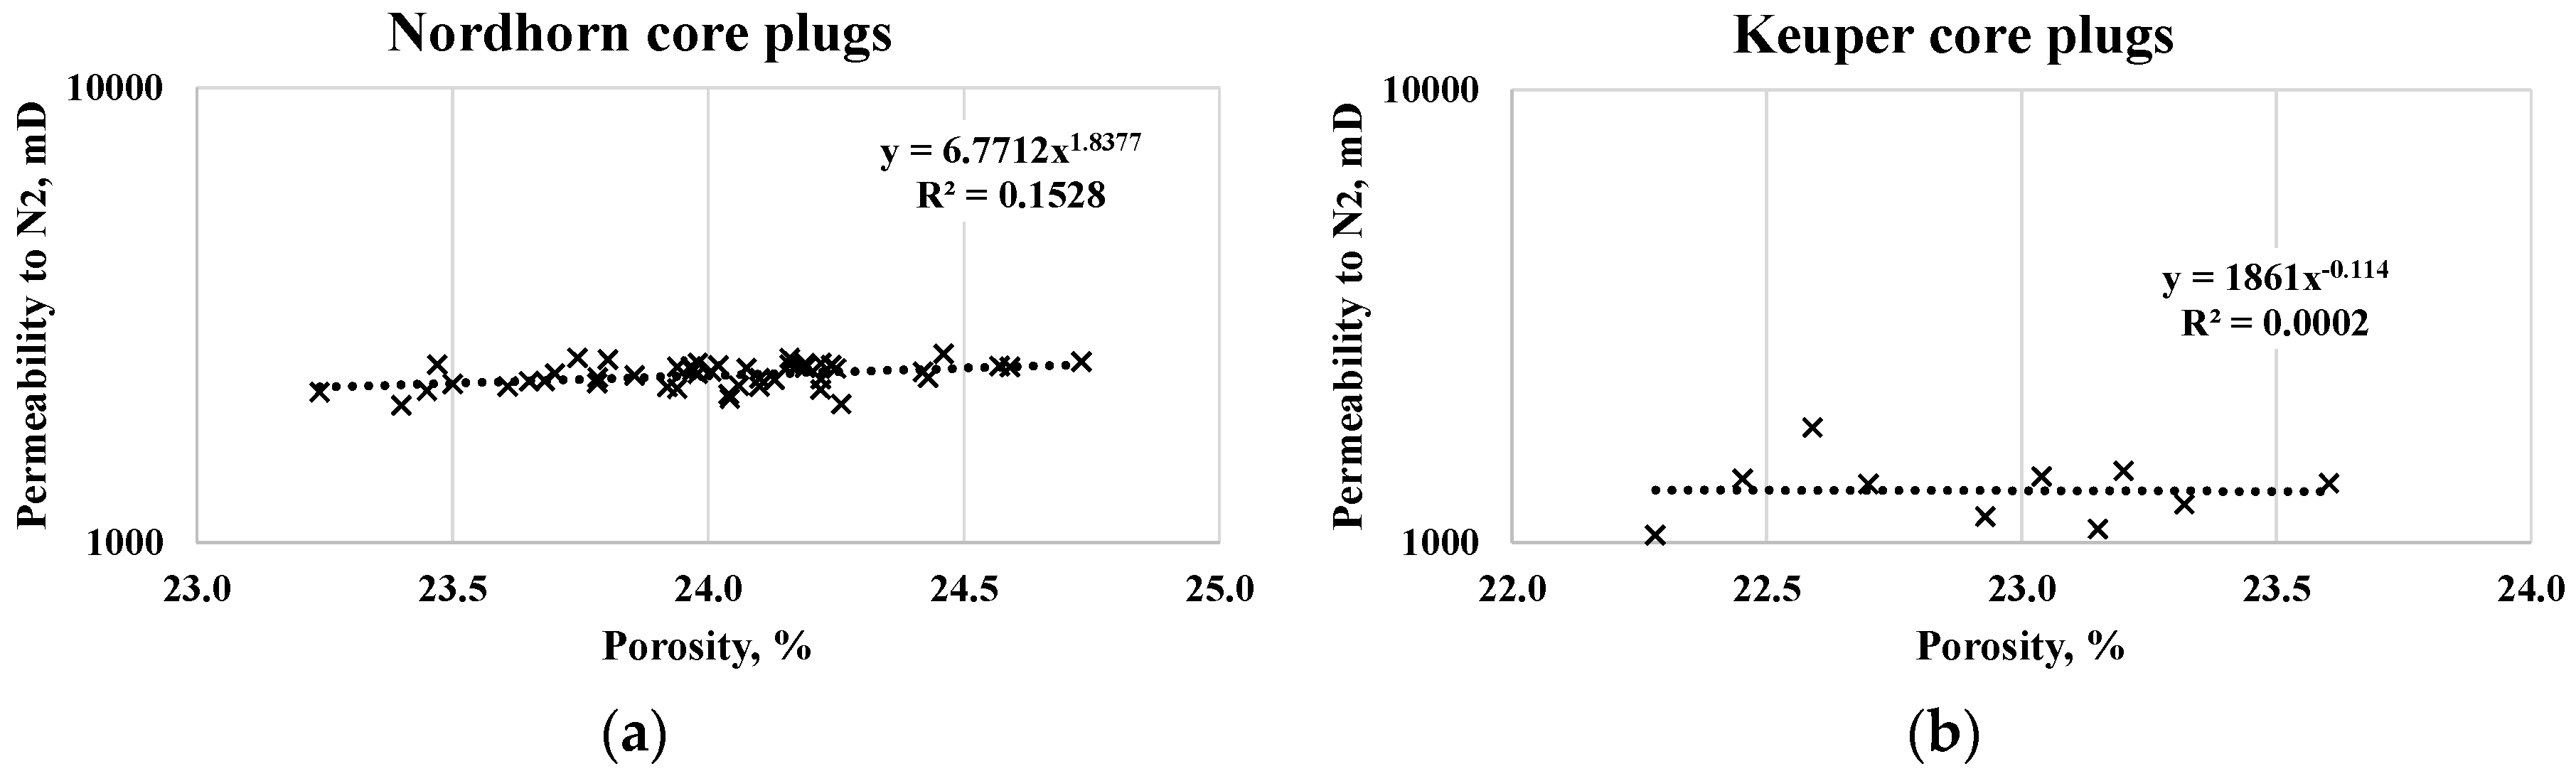
Figure 2.
Porosity-N2 permeability cross-plot for the Nordhorn (a) and Keuper core plugs (b).
Figure 2.
Porosity-N2 permeability cross-plot for the Nordhorn (a) and Keuper core plugs (b).
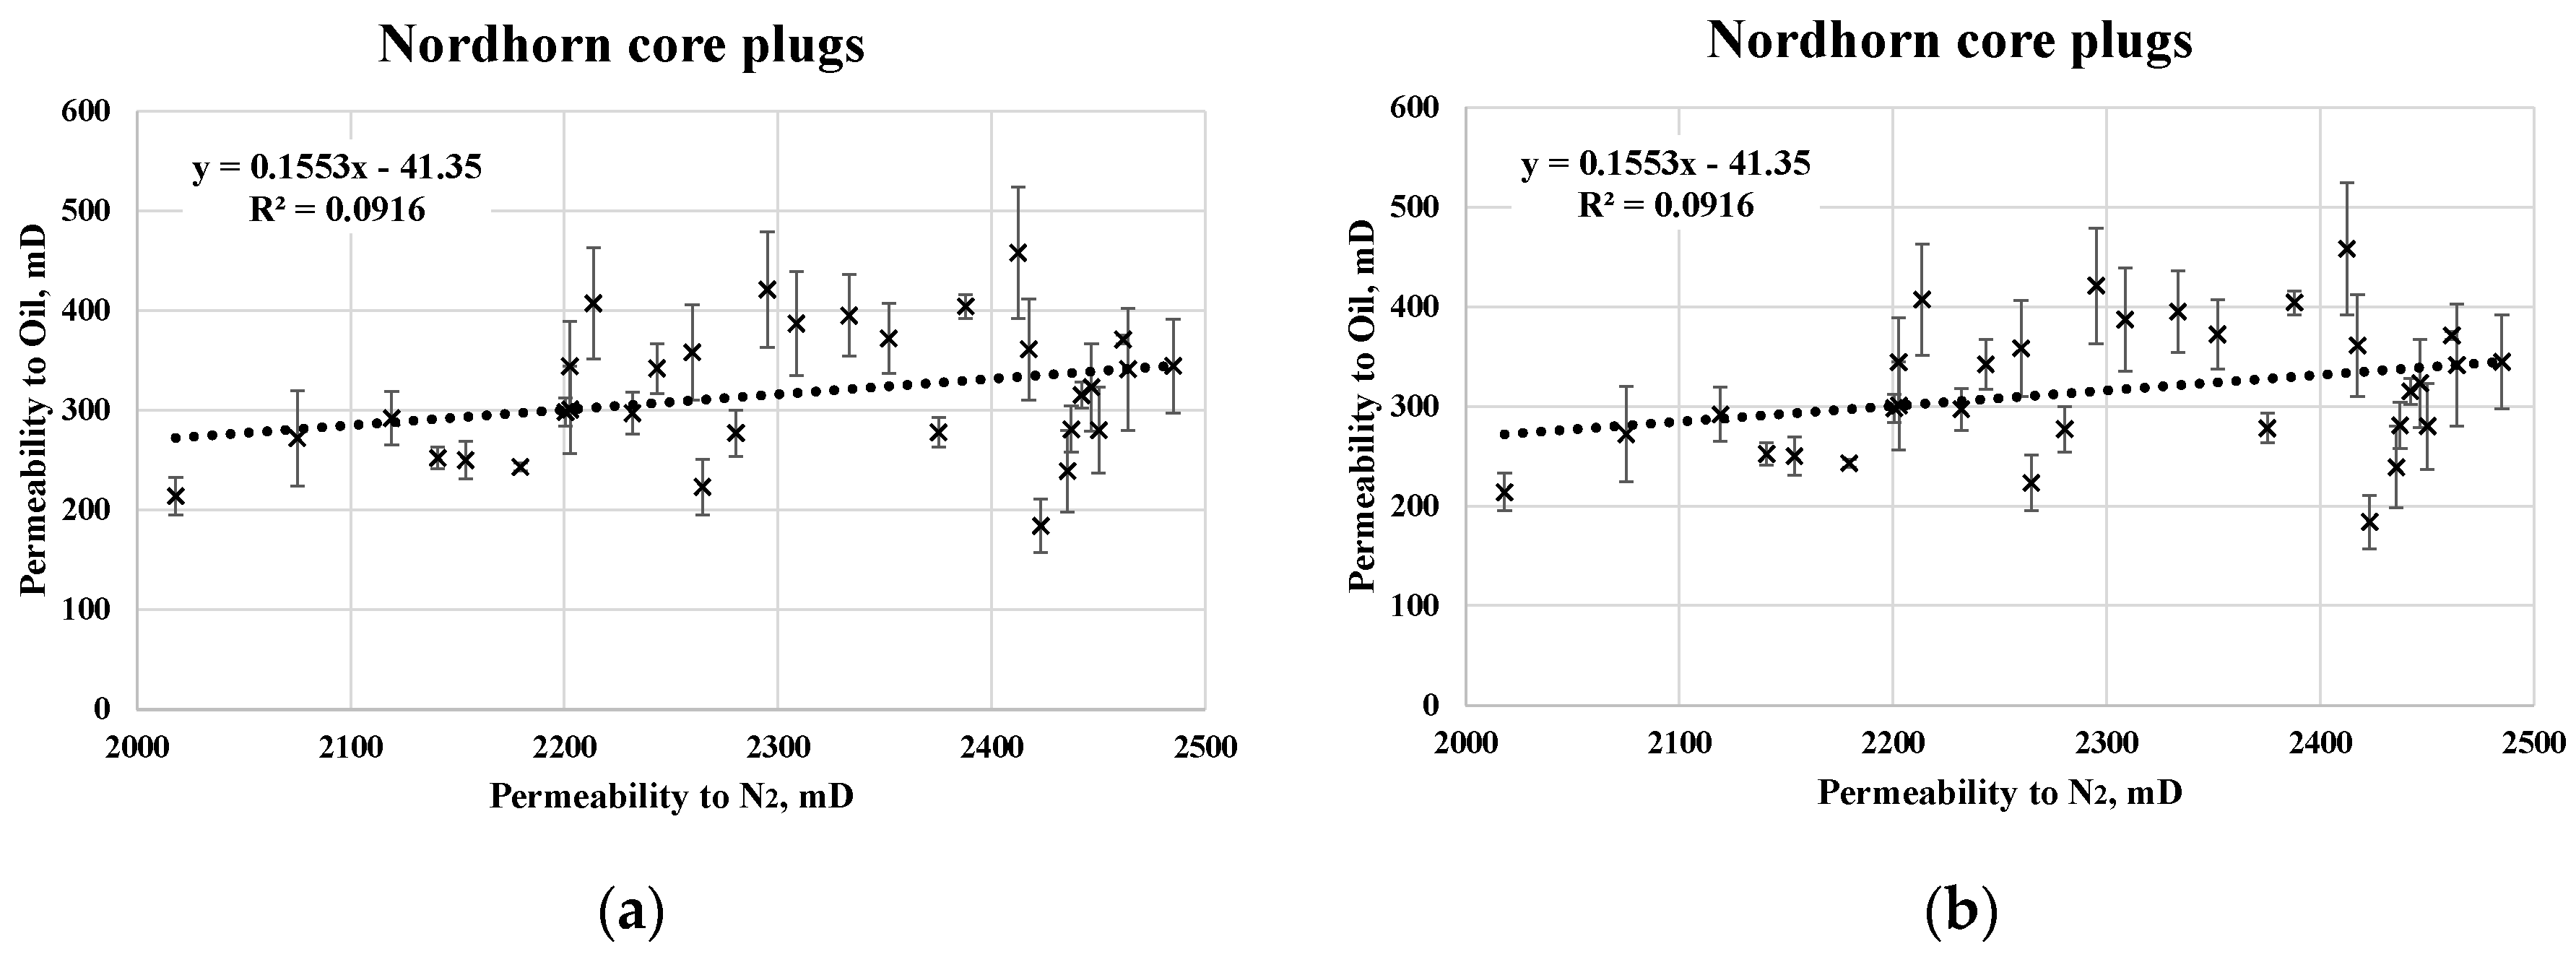
Figure 3.
Cross-plot of permeability to gas and oil without outliers for the Nordhorn (a) and Keuper samples (b).
Figure 3.
Cross-plot of permeability to gas and oil without outliers for the Nordhorn (a) and Keuper samples (b).
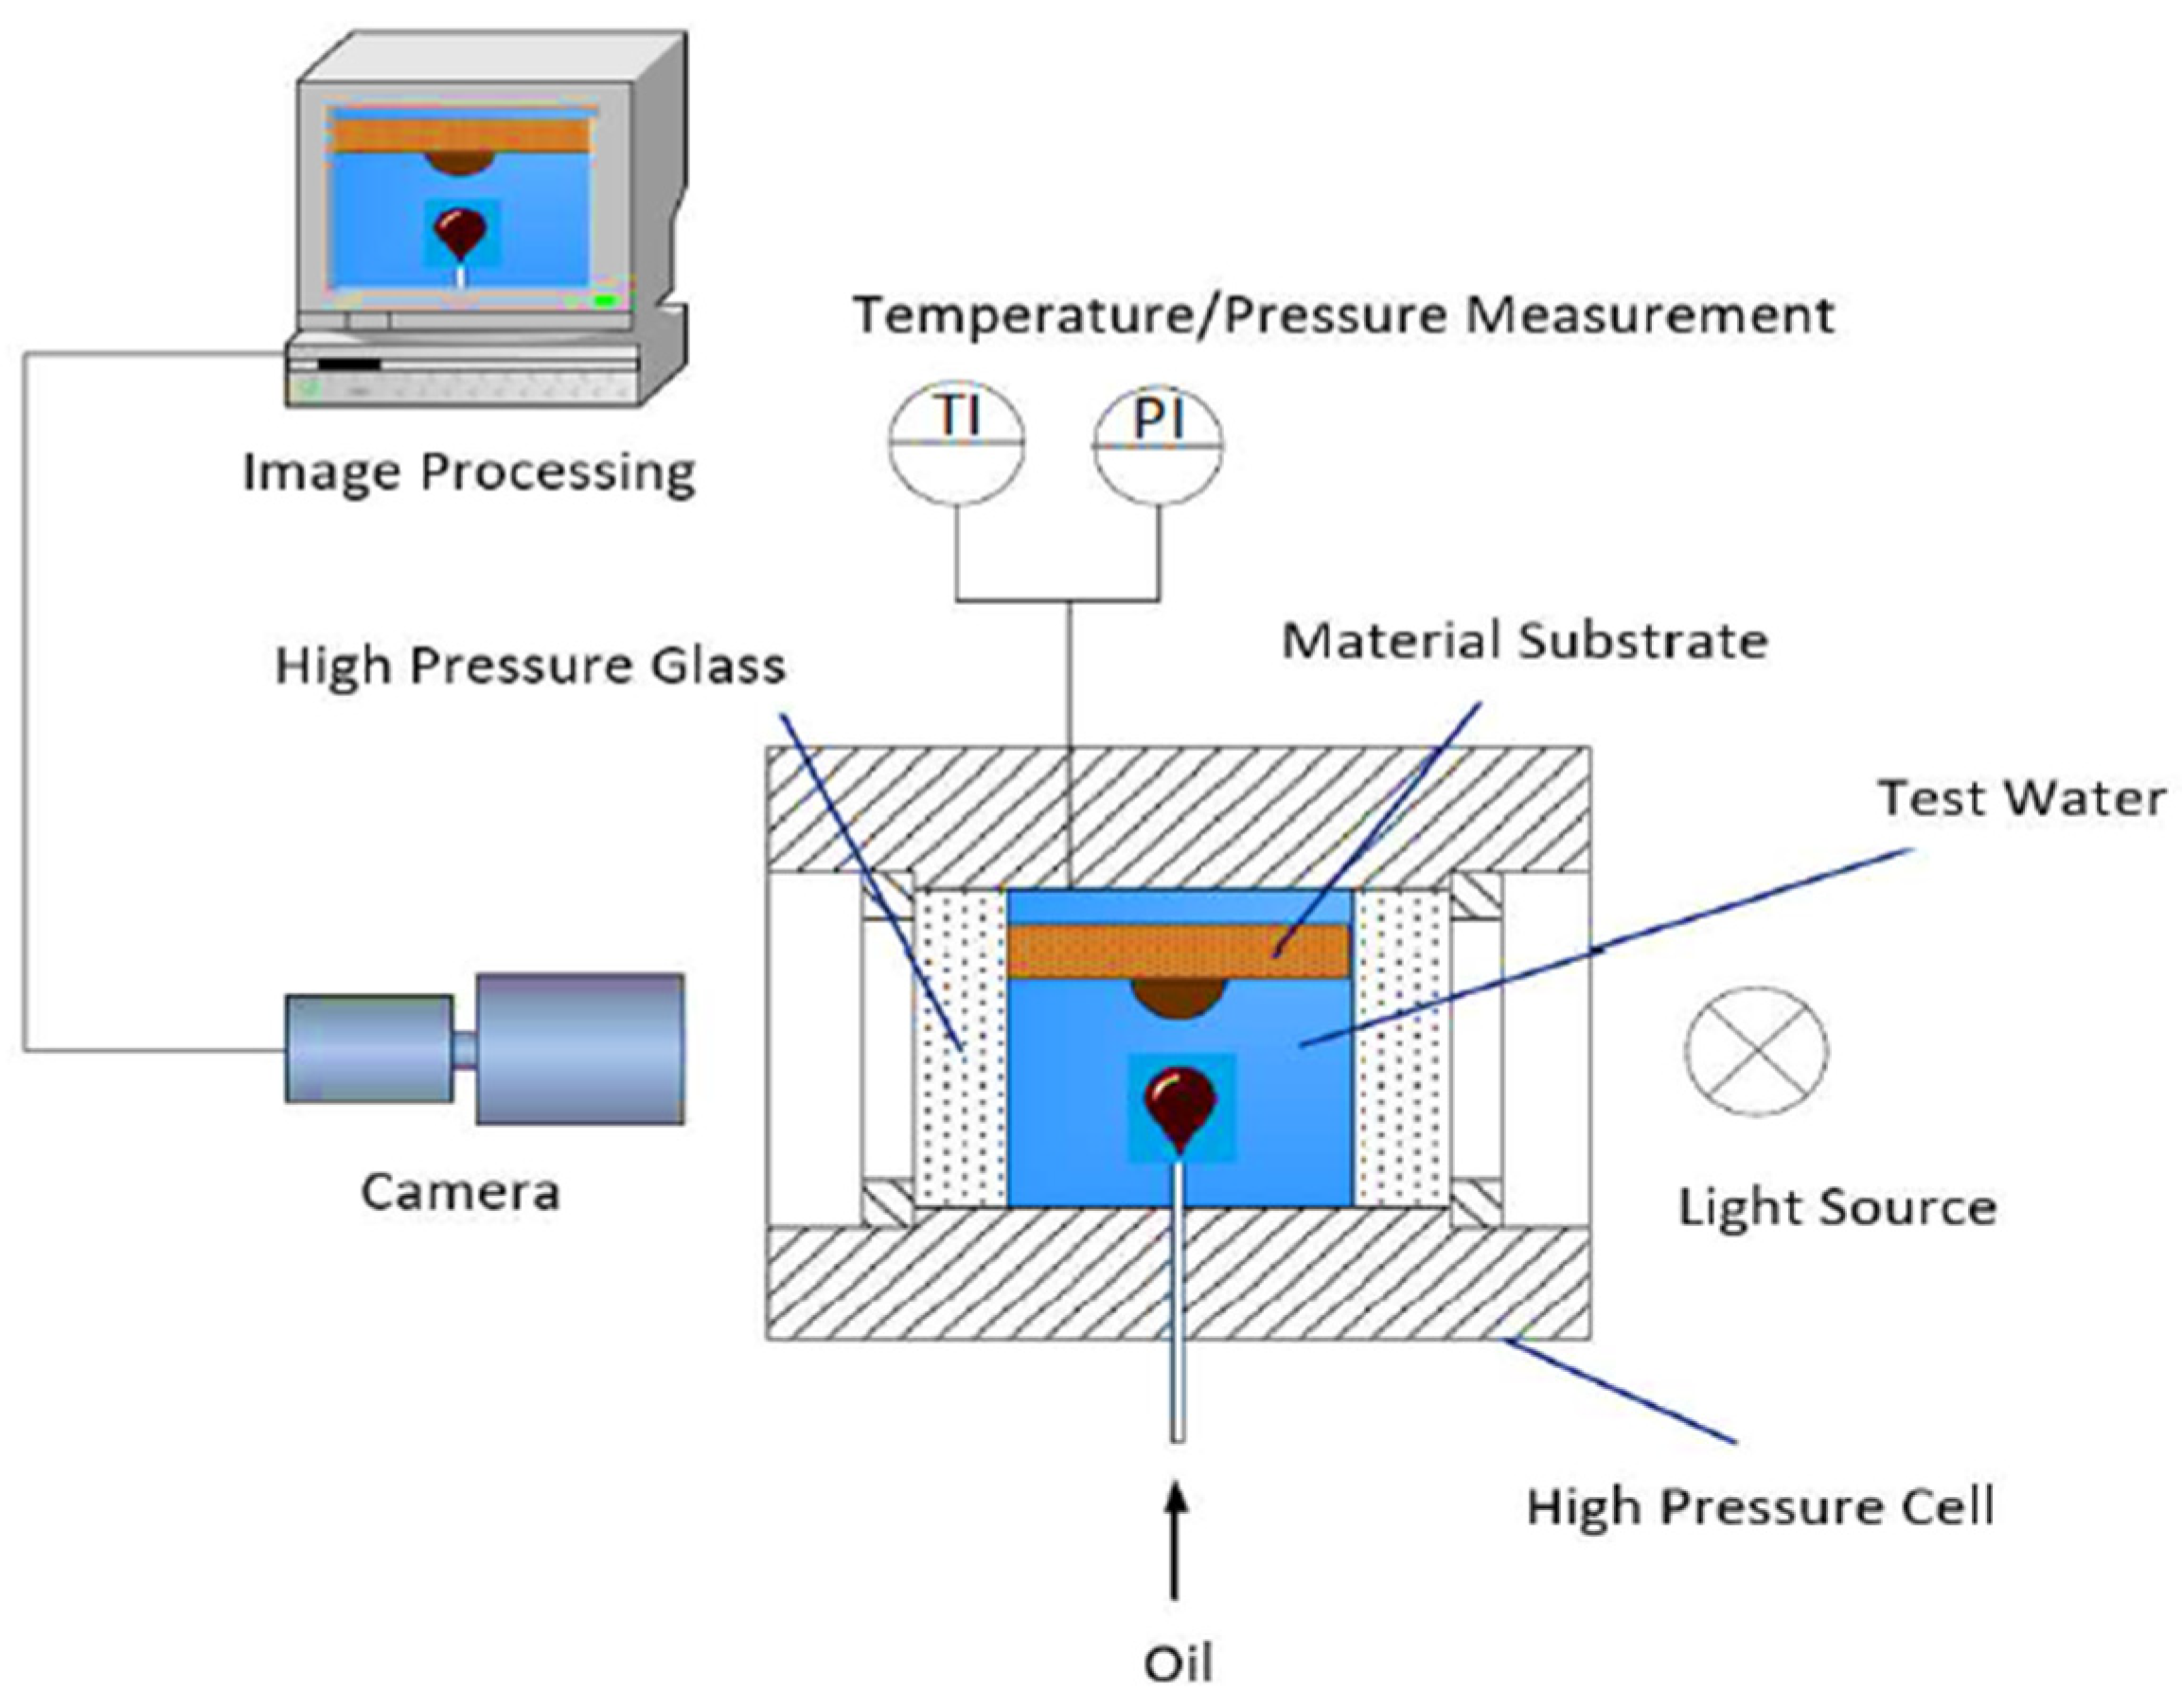
Figure 4.
A high pressure and temperature KRUSS spinning drop tensiometer high pressure view cell (HPVC) 40-MD for contact angle measurements.
Figure 4.
A high pressure and temperature KRUSS spinning drop tensiometer high pressure view cell (HPVC) 40-MD for contact angle measurements.
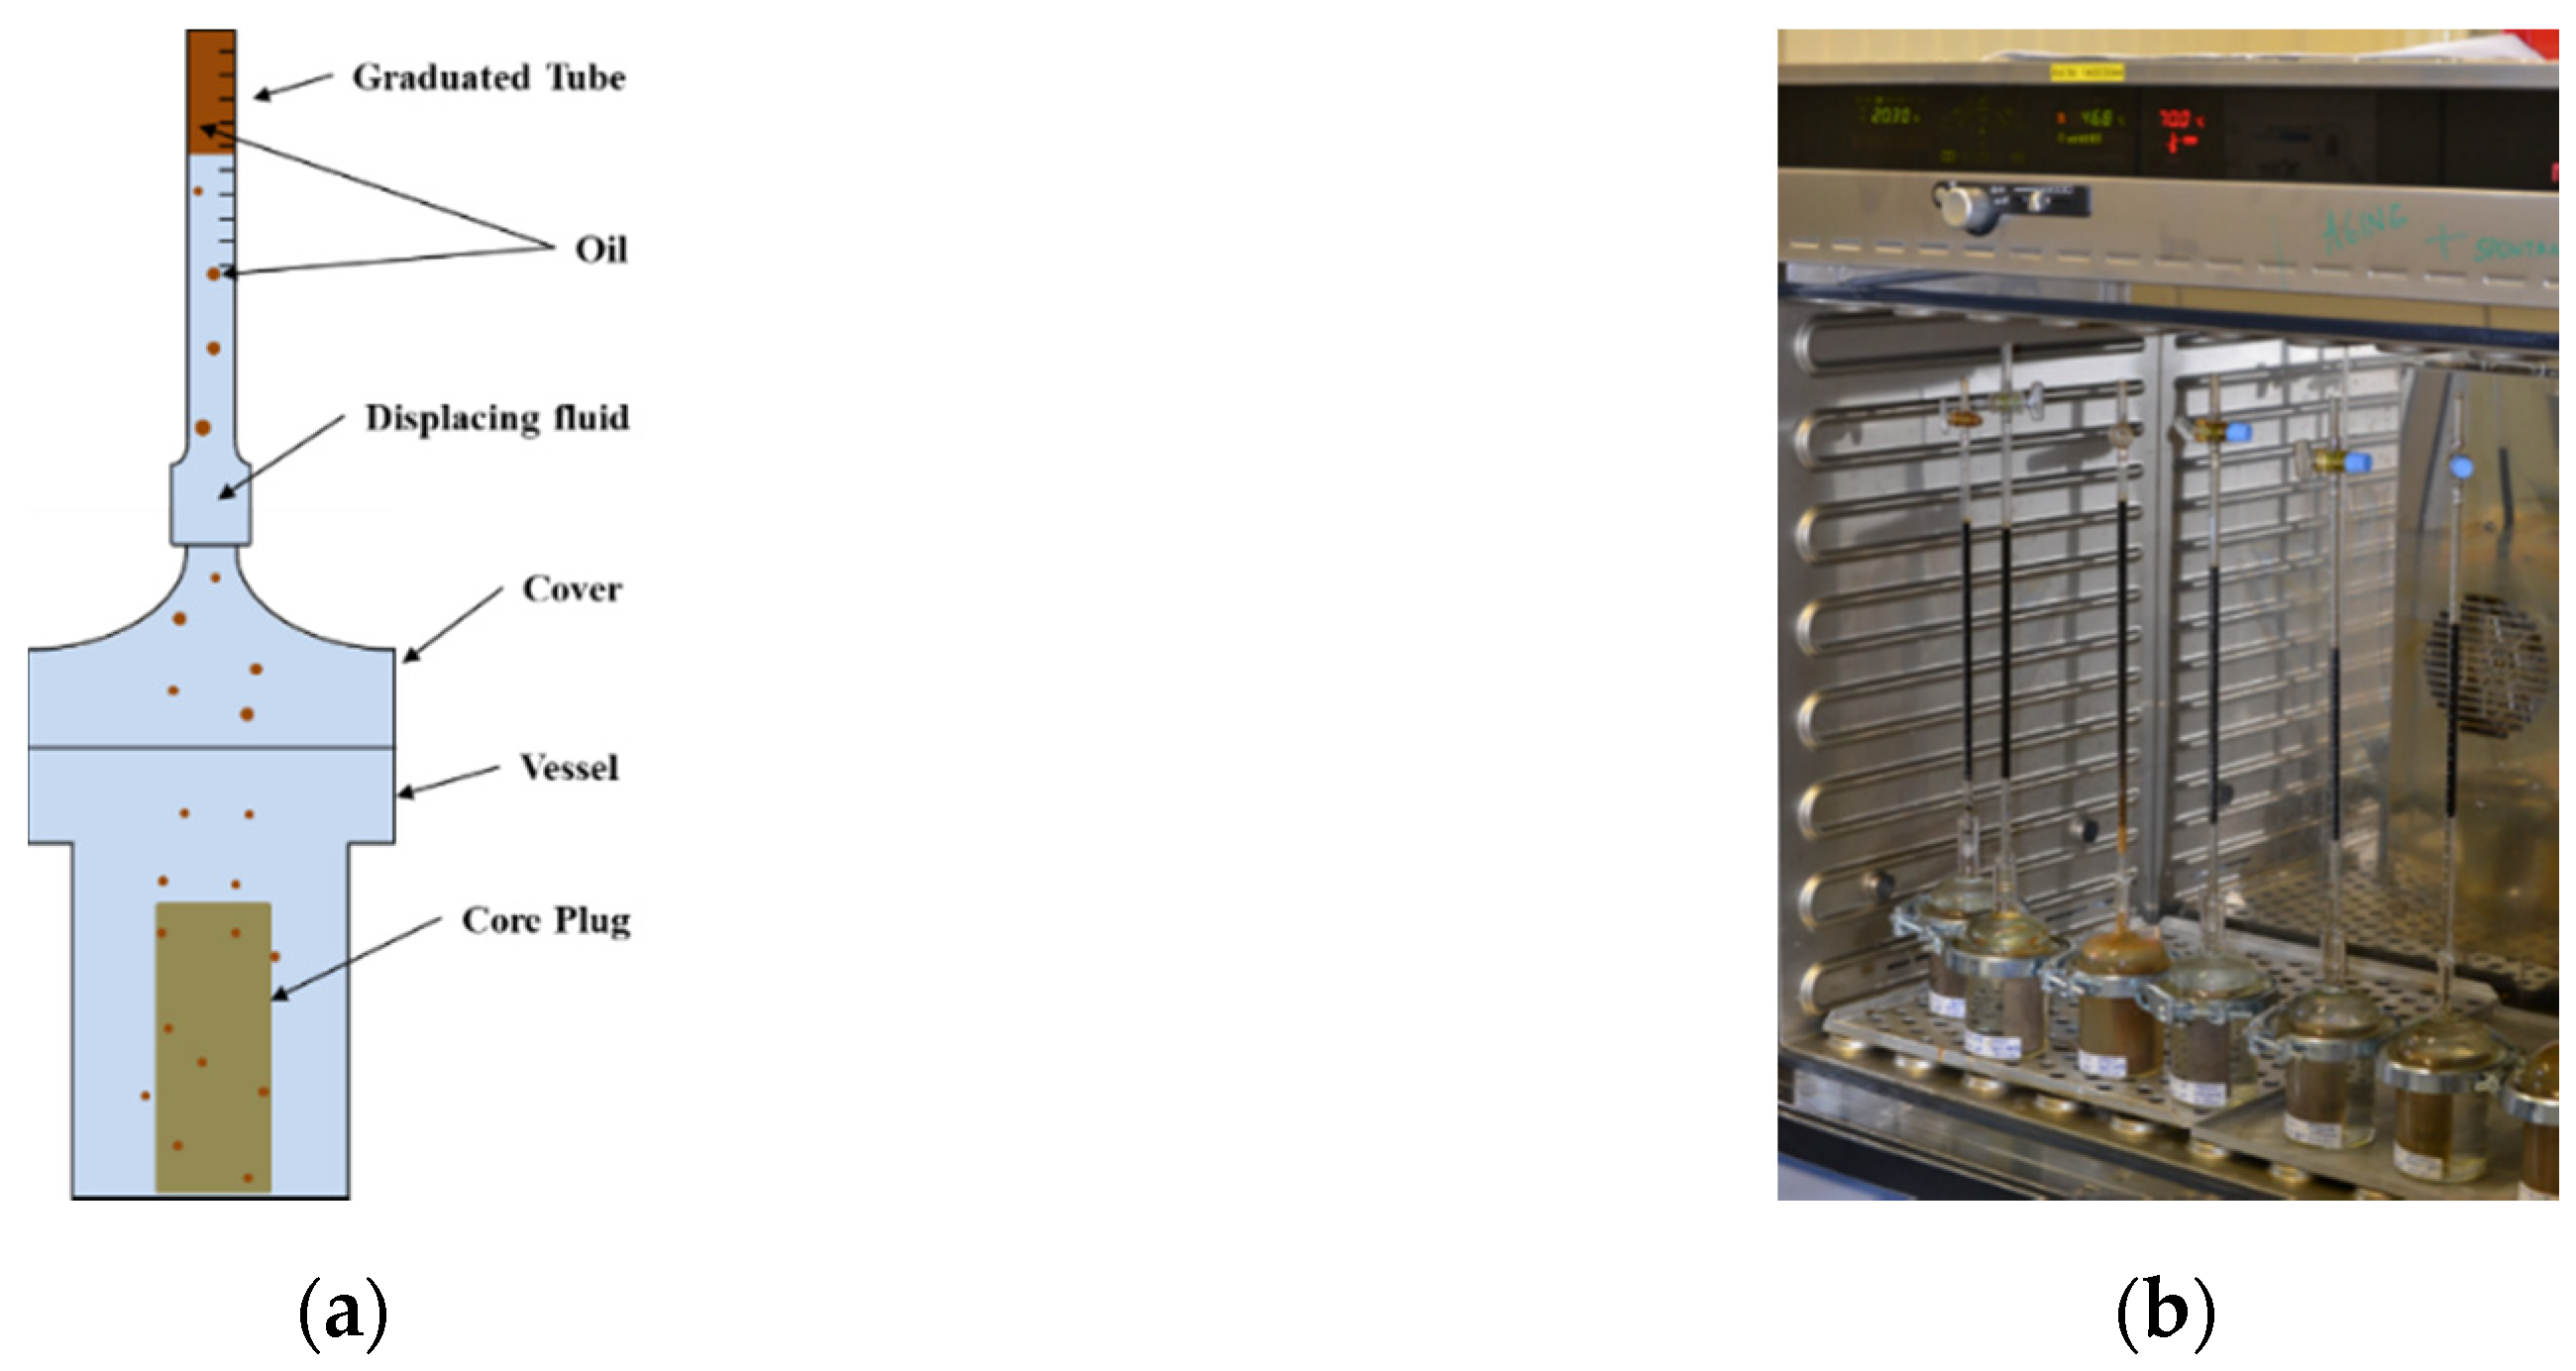
Figure 5.
Schematic representation of the Amott imbibition cell (a) and the set experiments placed in the oven (b).
Figure 5.
Schematic representation of the Amott imbibition cell (a) and the set experiments placed in the oven (b).
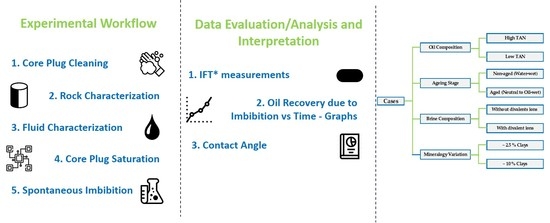
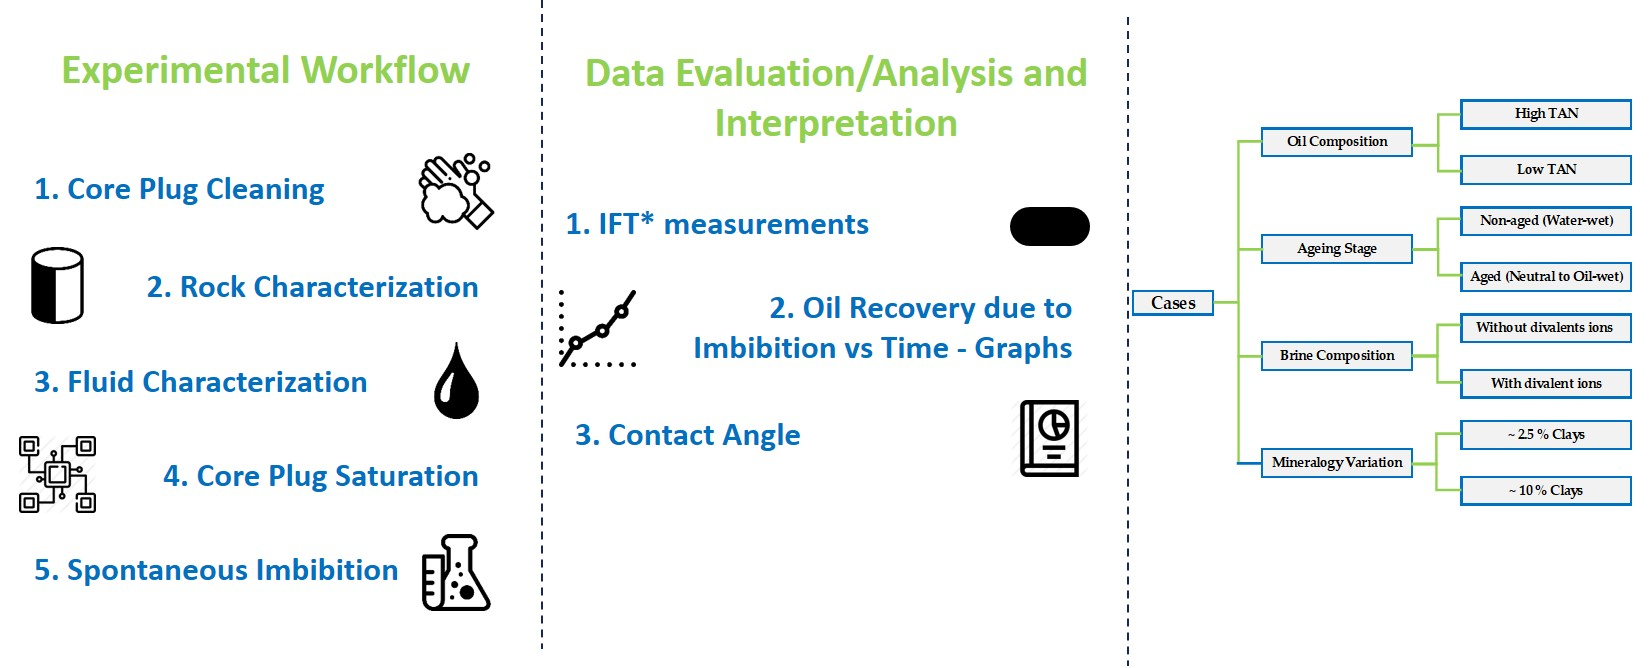
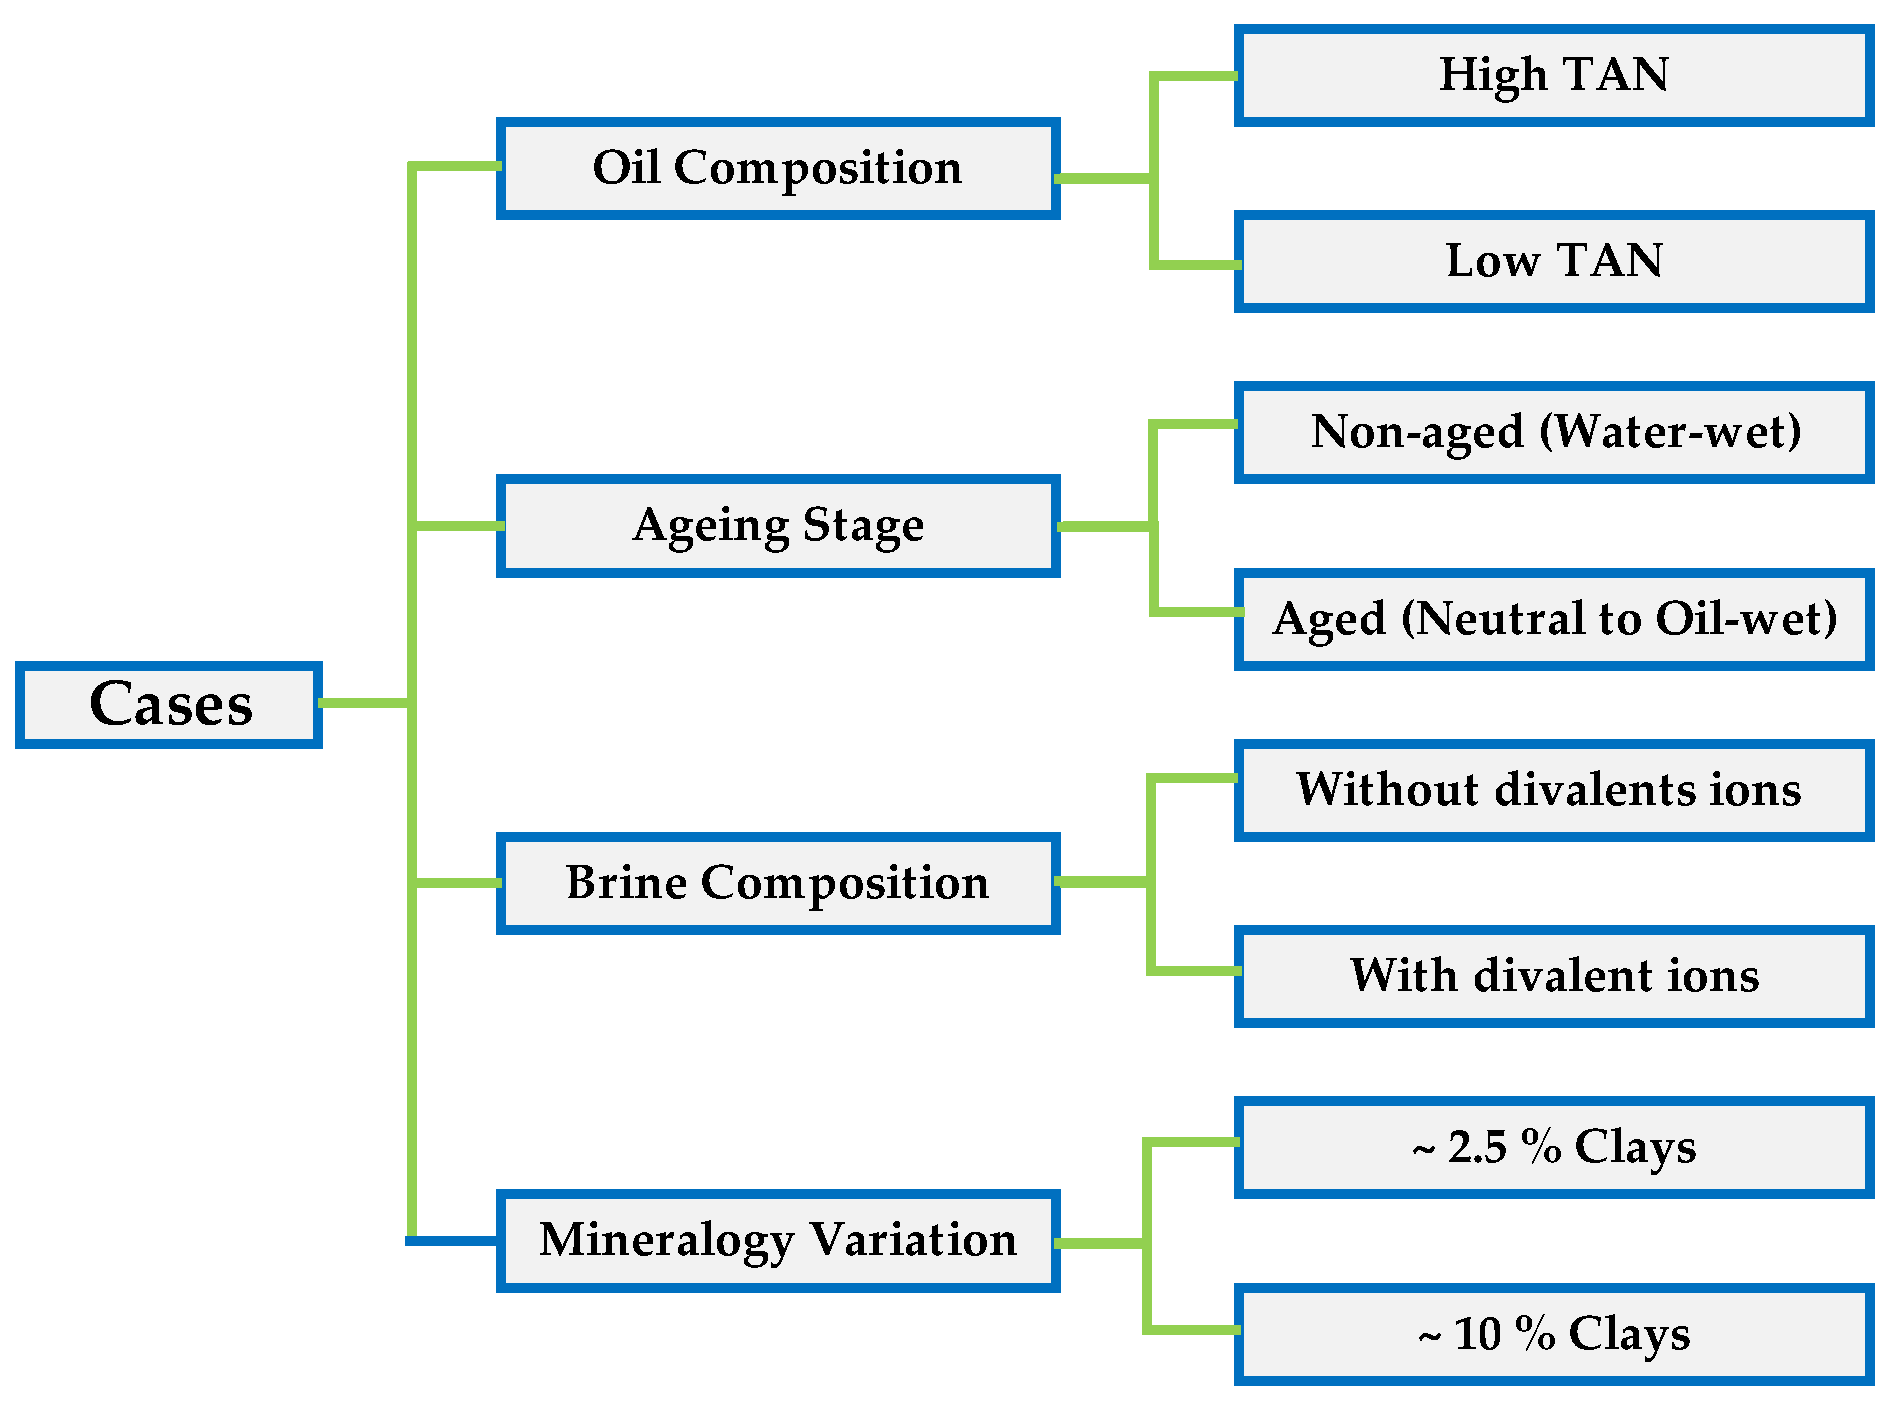
Figure 6.
Cases/scenarios and parameters used to understand the data gathered from the Amott spontaneous imbibition tests.
Figure 6.
Cases/scenarios and parameters used to understand the data gathered from the Amott spontaneous imbibition tests.
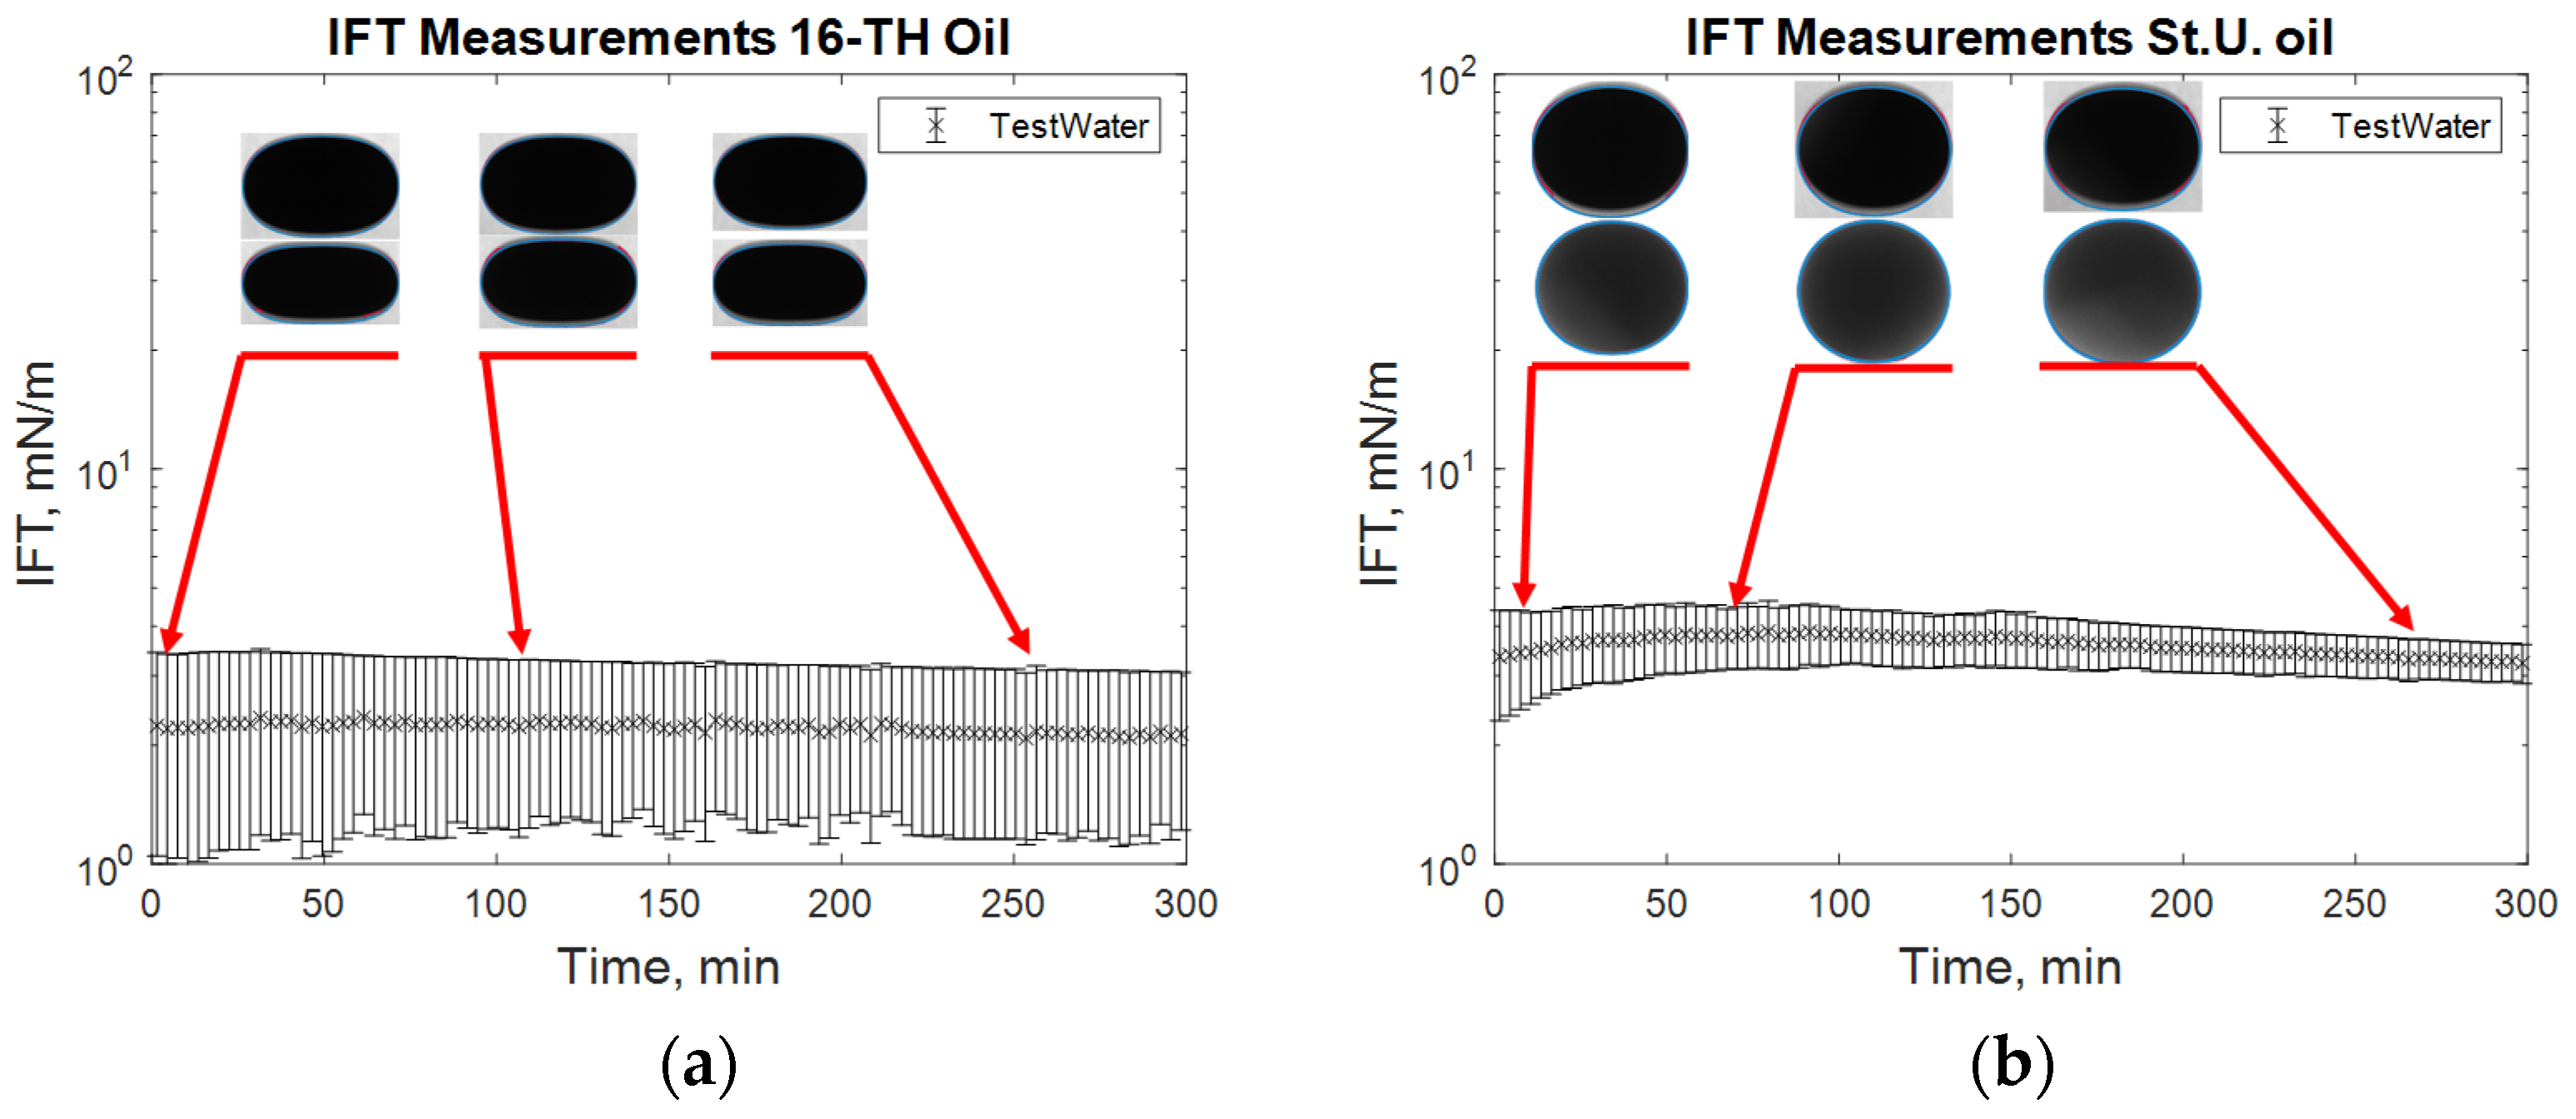
Figure 7.
Interfacial tension (IFT) measurements for high total acid number (TAN) (a) and low TAN oil (b) with test water at 60 °C.
Figure 7.
Interfacial tension (IFT) measurements for high total acid number (TAN) (a) and low TAN oil (b) with test water at 60 °C.
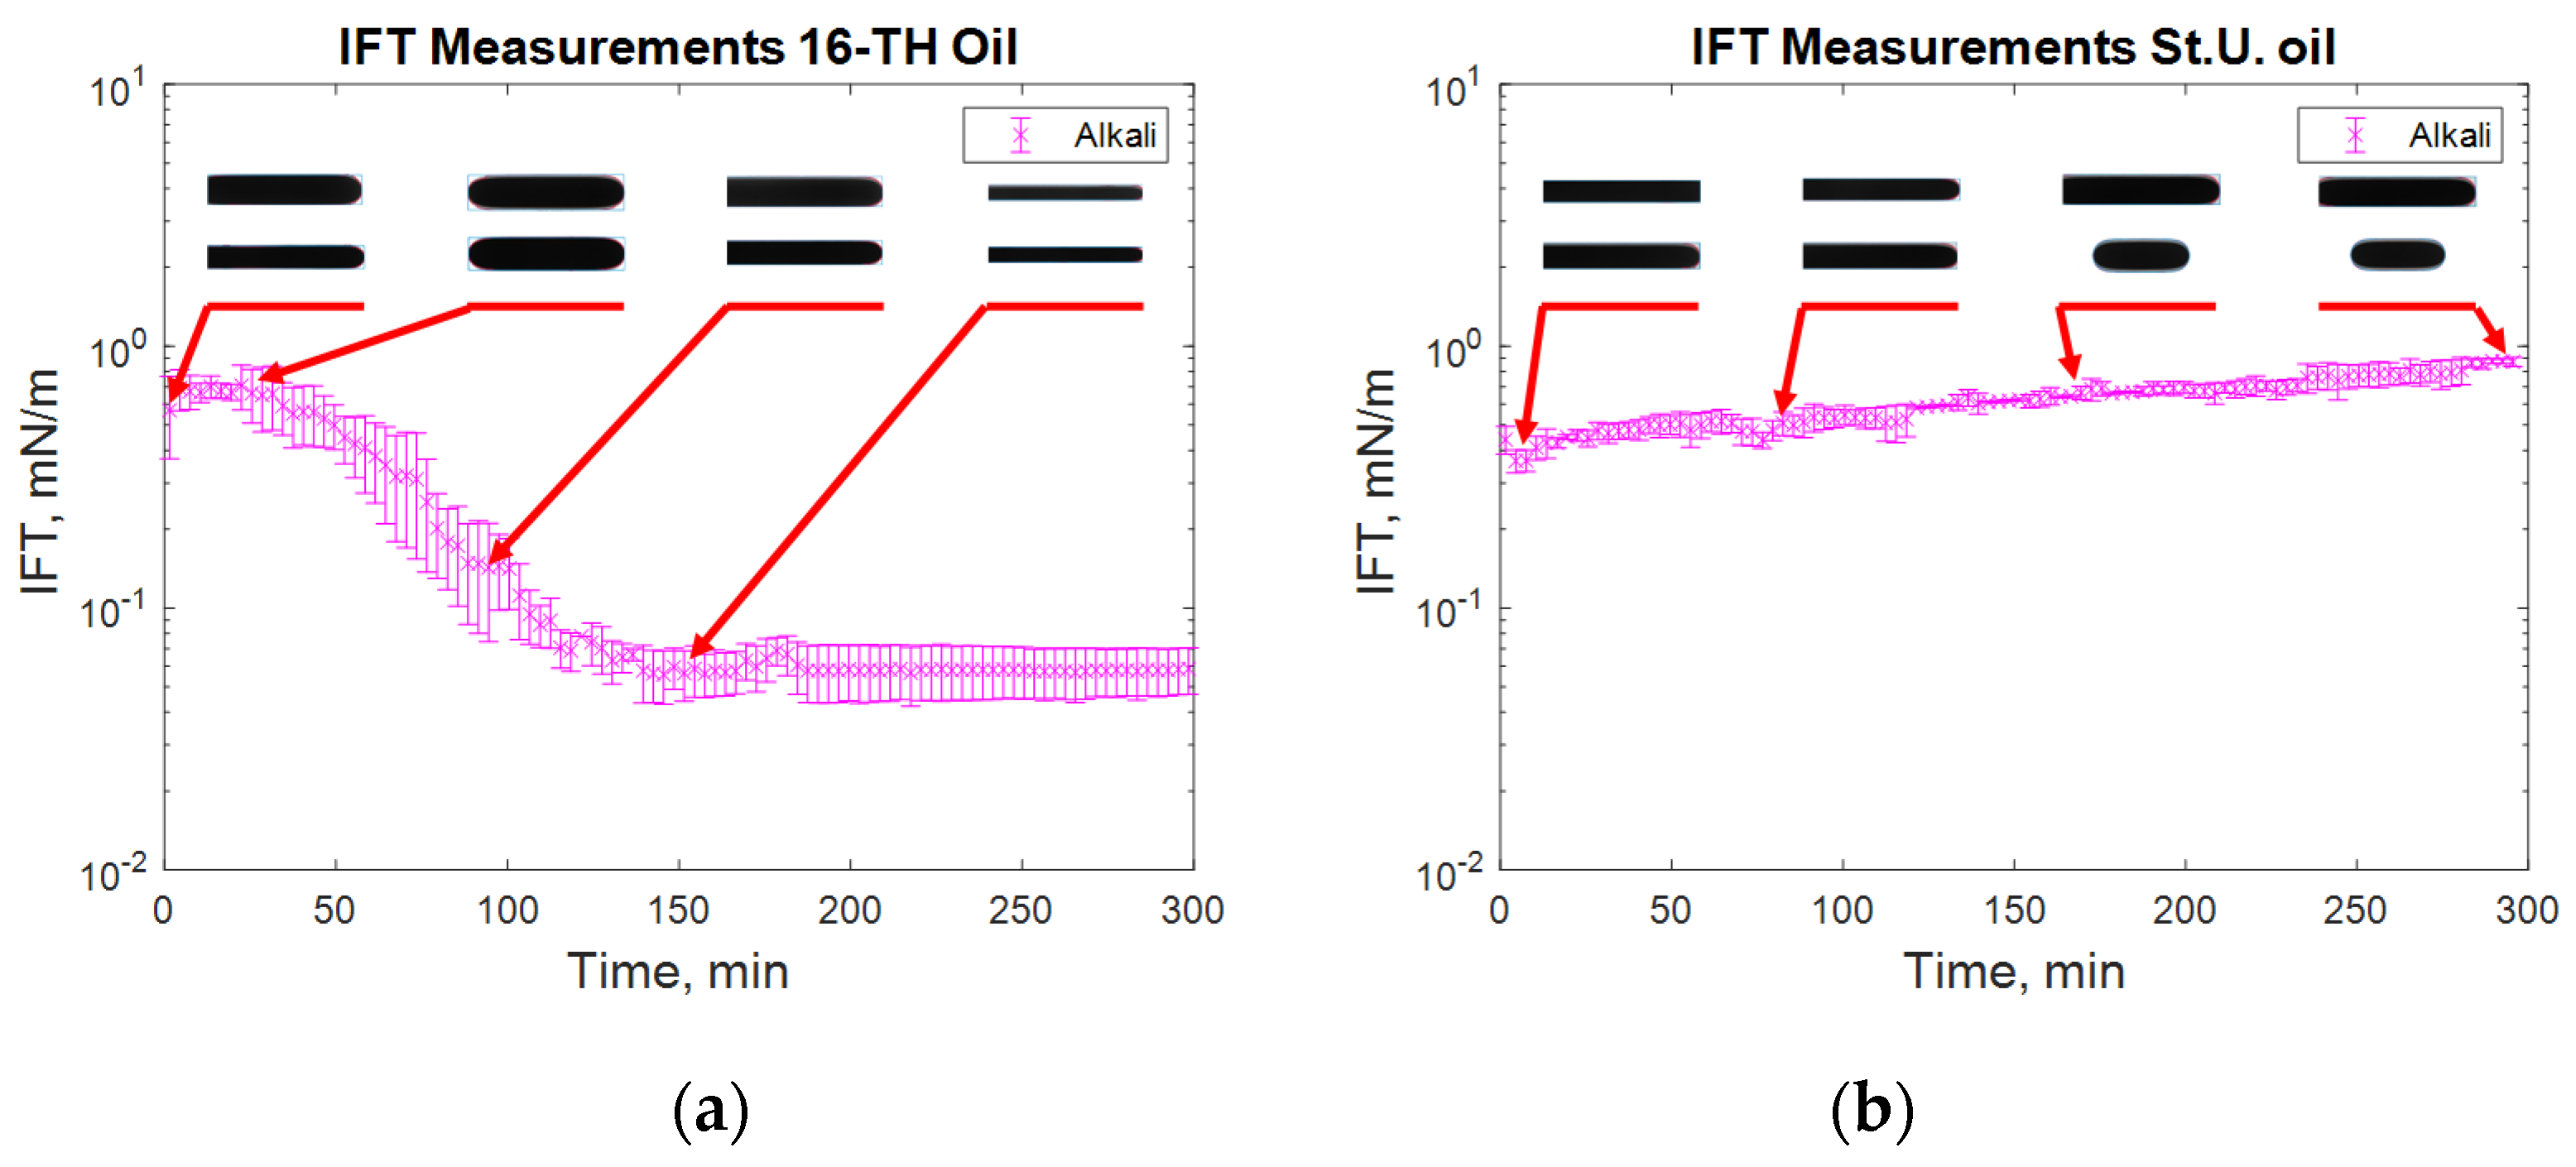
Figure 8.
IFT measurement for high TAN (a) and low TAN oil (b) with the alkali solution at 60 °C (alkali: 7 g/L Na2CO3).
Figure 8.
IFT measurement for high TAN (a) and low TAN oil (b) with the alkali solution at 60 °C (alkali: 7 g/L Na2CO3).
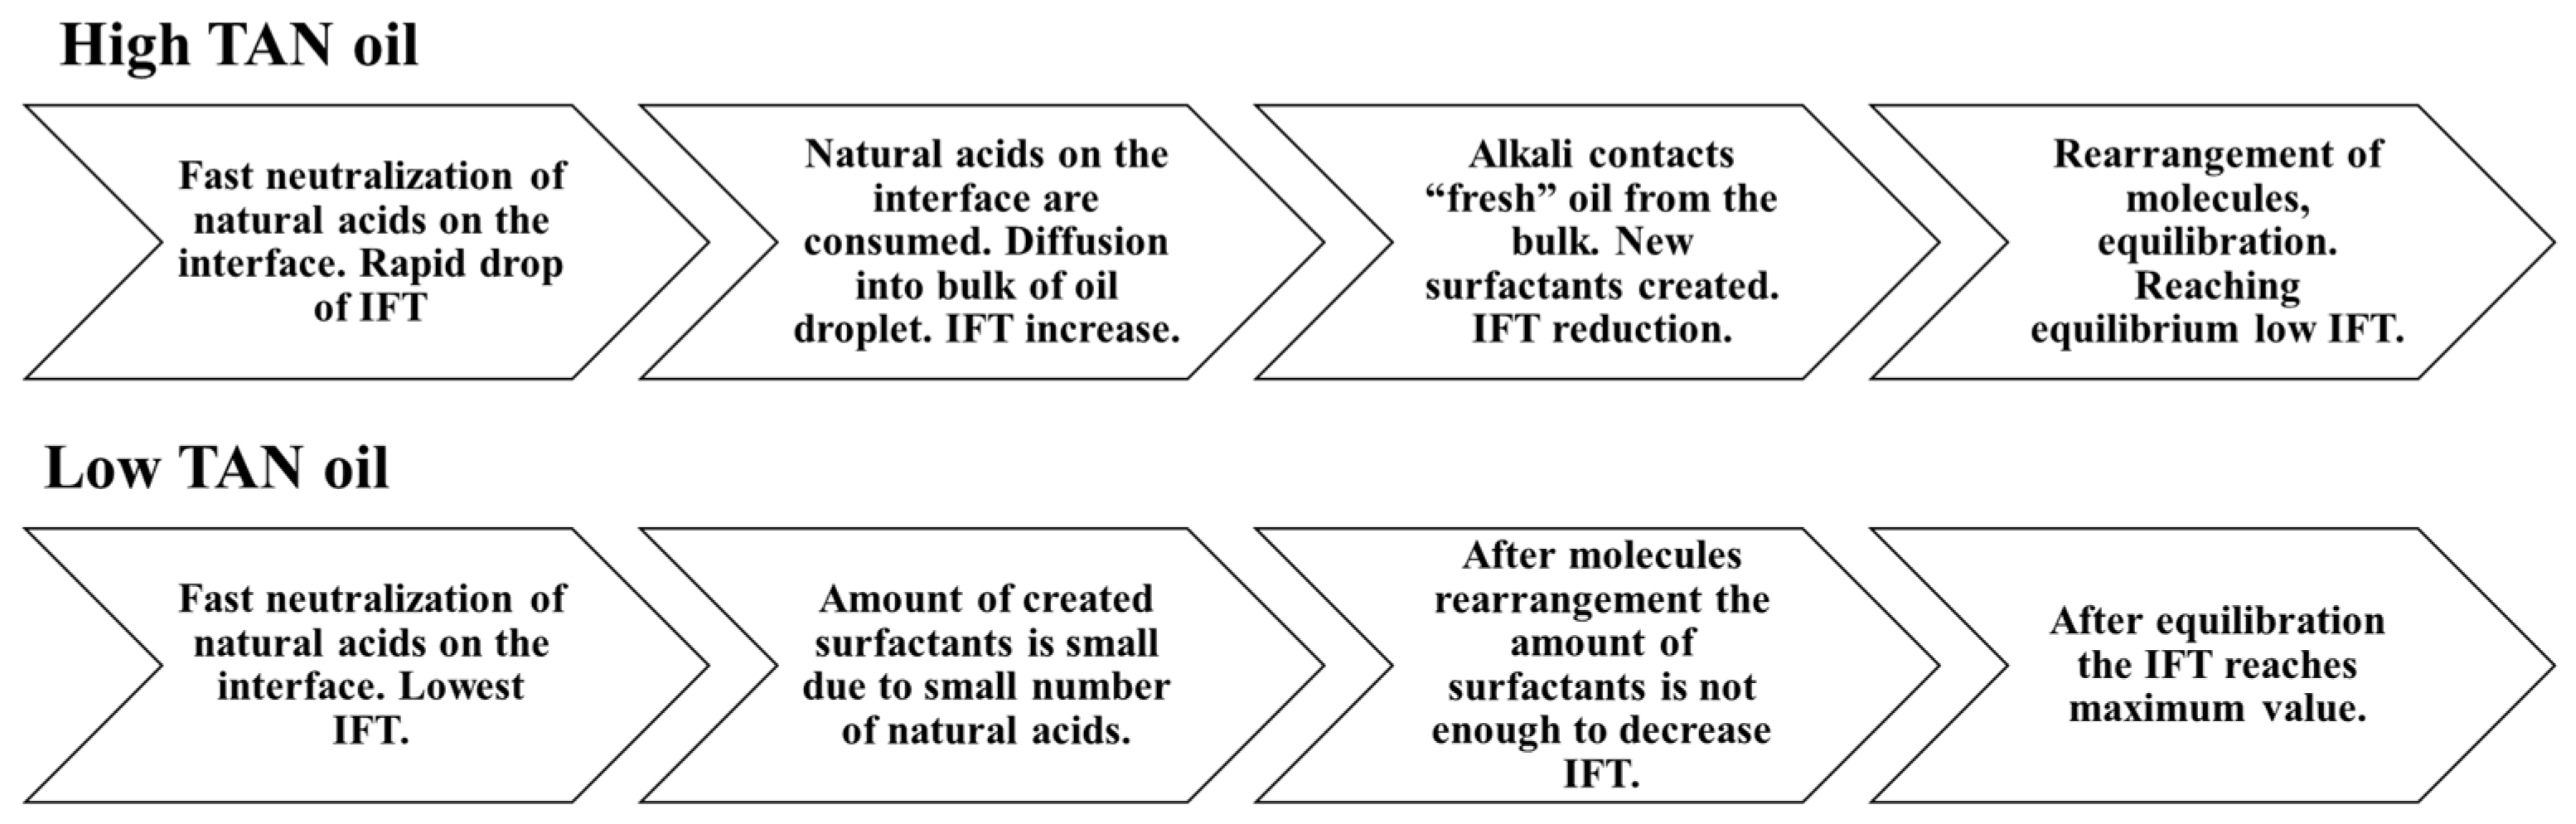
Figure 9.
Schematics explaining the process of IFT change for high and low TAN oils.
Figure 9.
Schematics explaining the process of IFT change for high and low TAN oils.
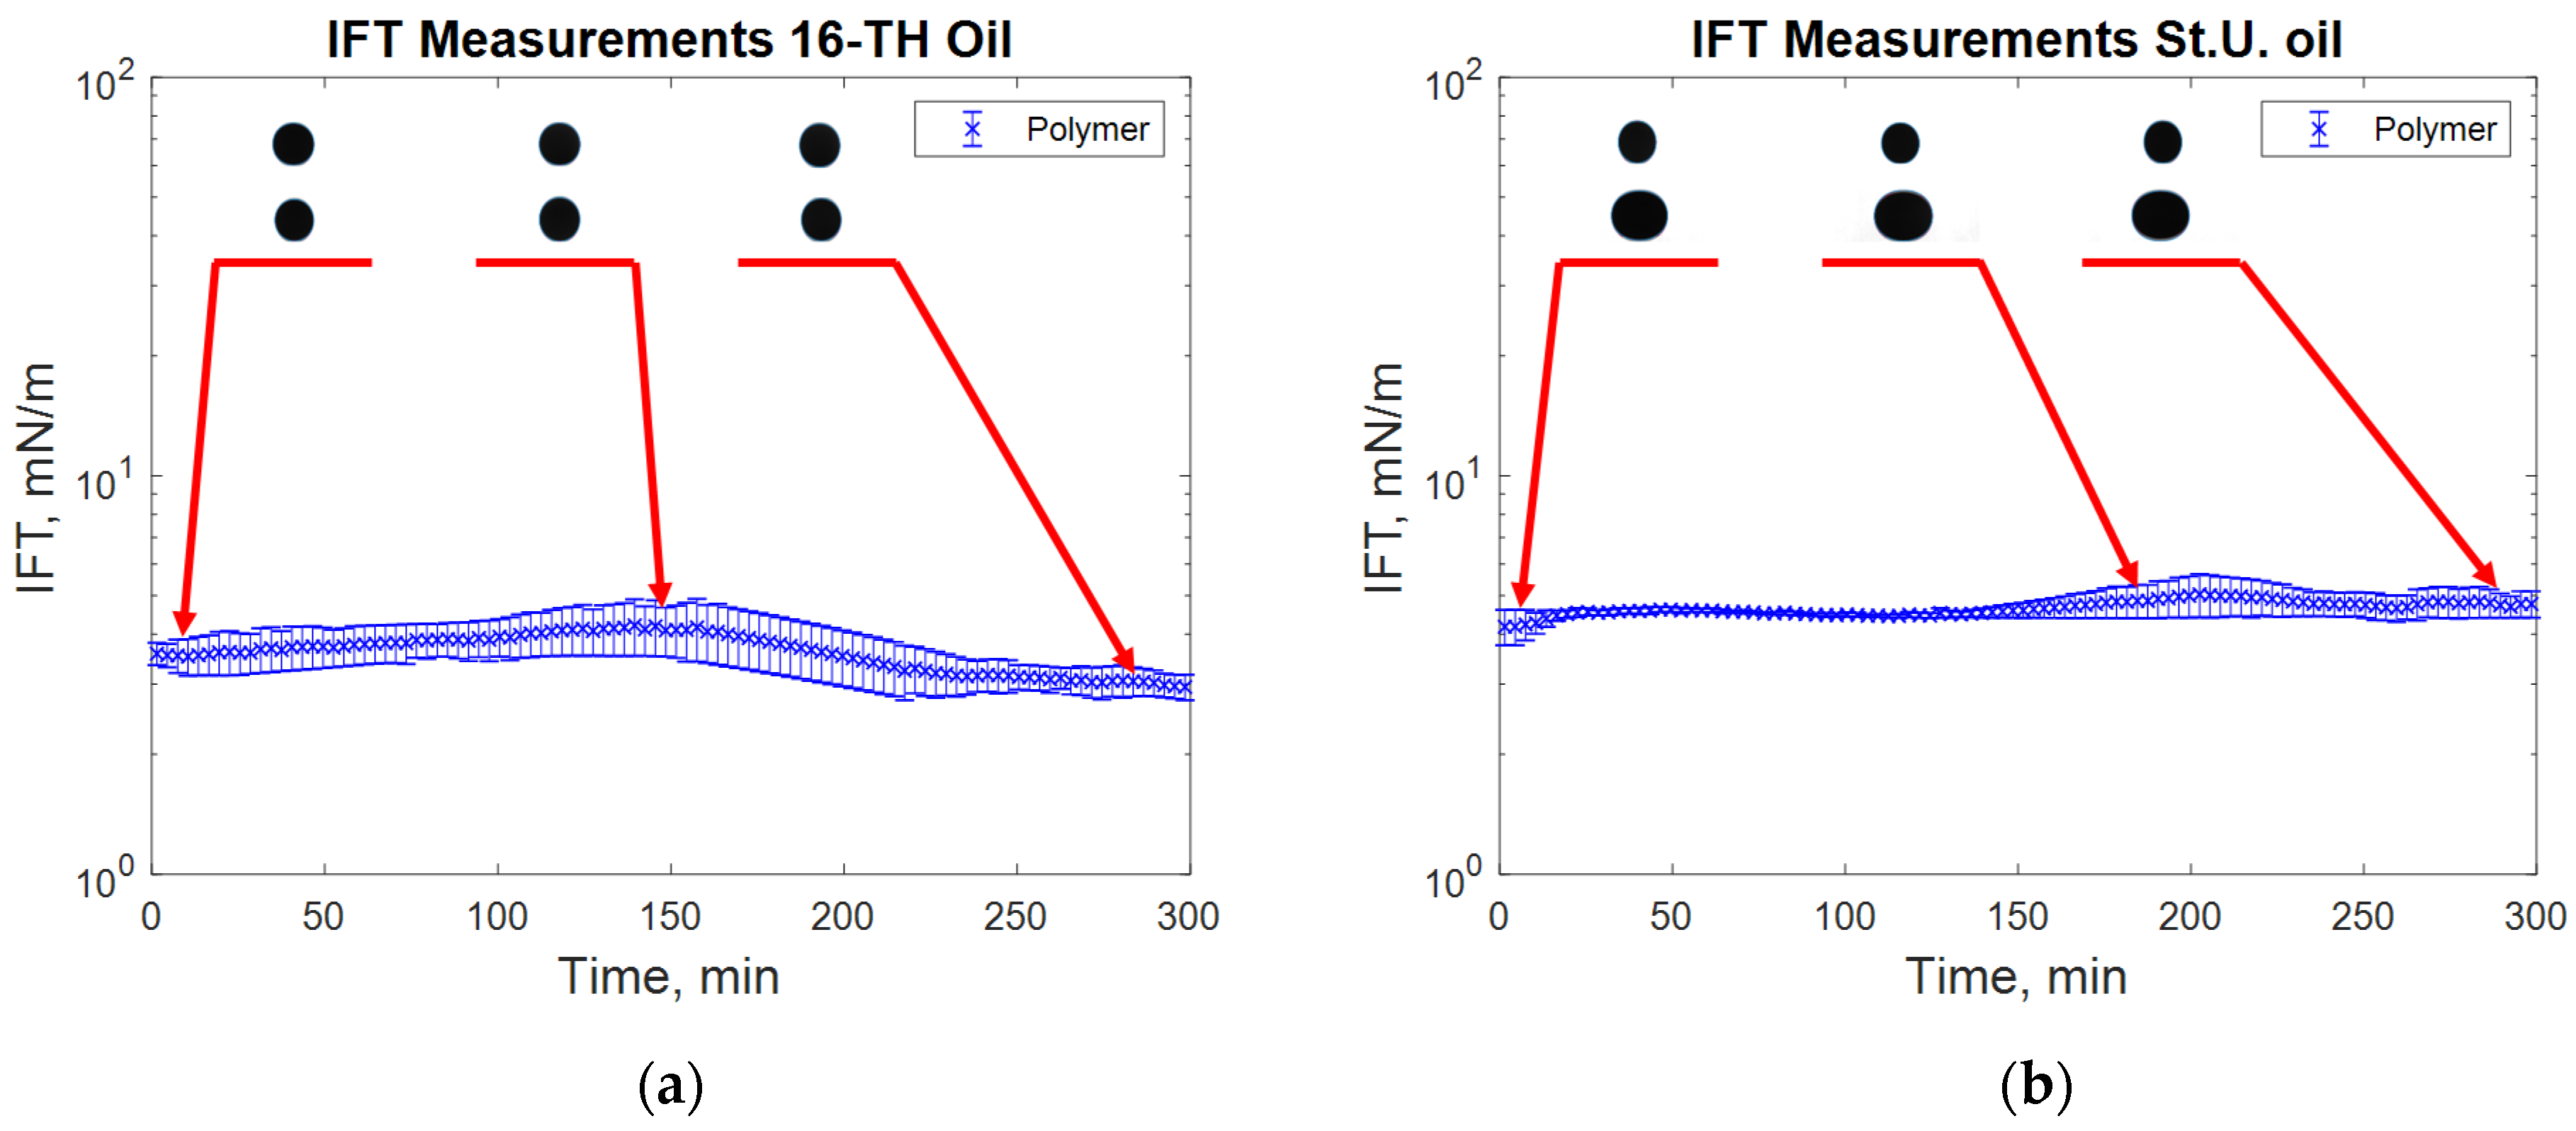
Figure 10.
IFT measurement for high TAN (a) and low TAN oil (b) with the polymer (P) at 60 °C (polymer: 2000 ppm FLOPAAM 3630S).
Figure 10.
IFT measurement for high TAN (a) and low TAN oil (b) with the polymer (P) at 60 °C (polymer: 2000 ppm FLOPAAM 3630S).
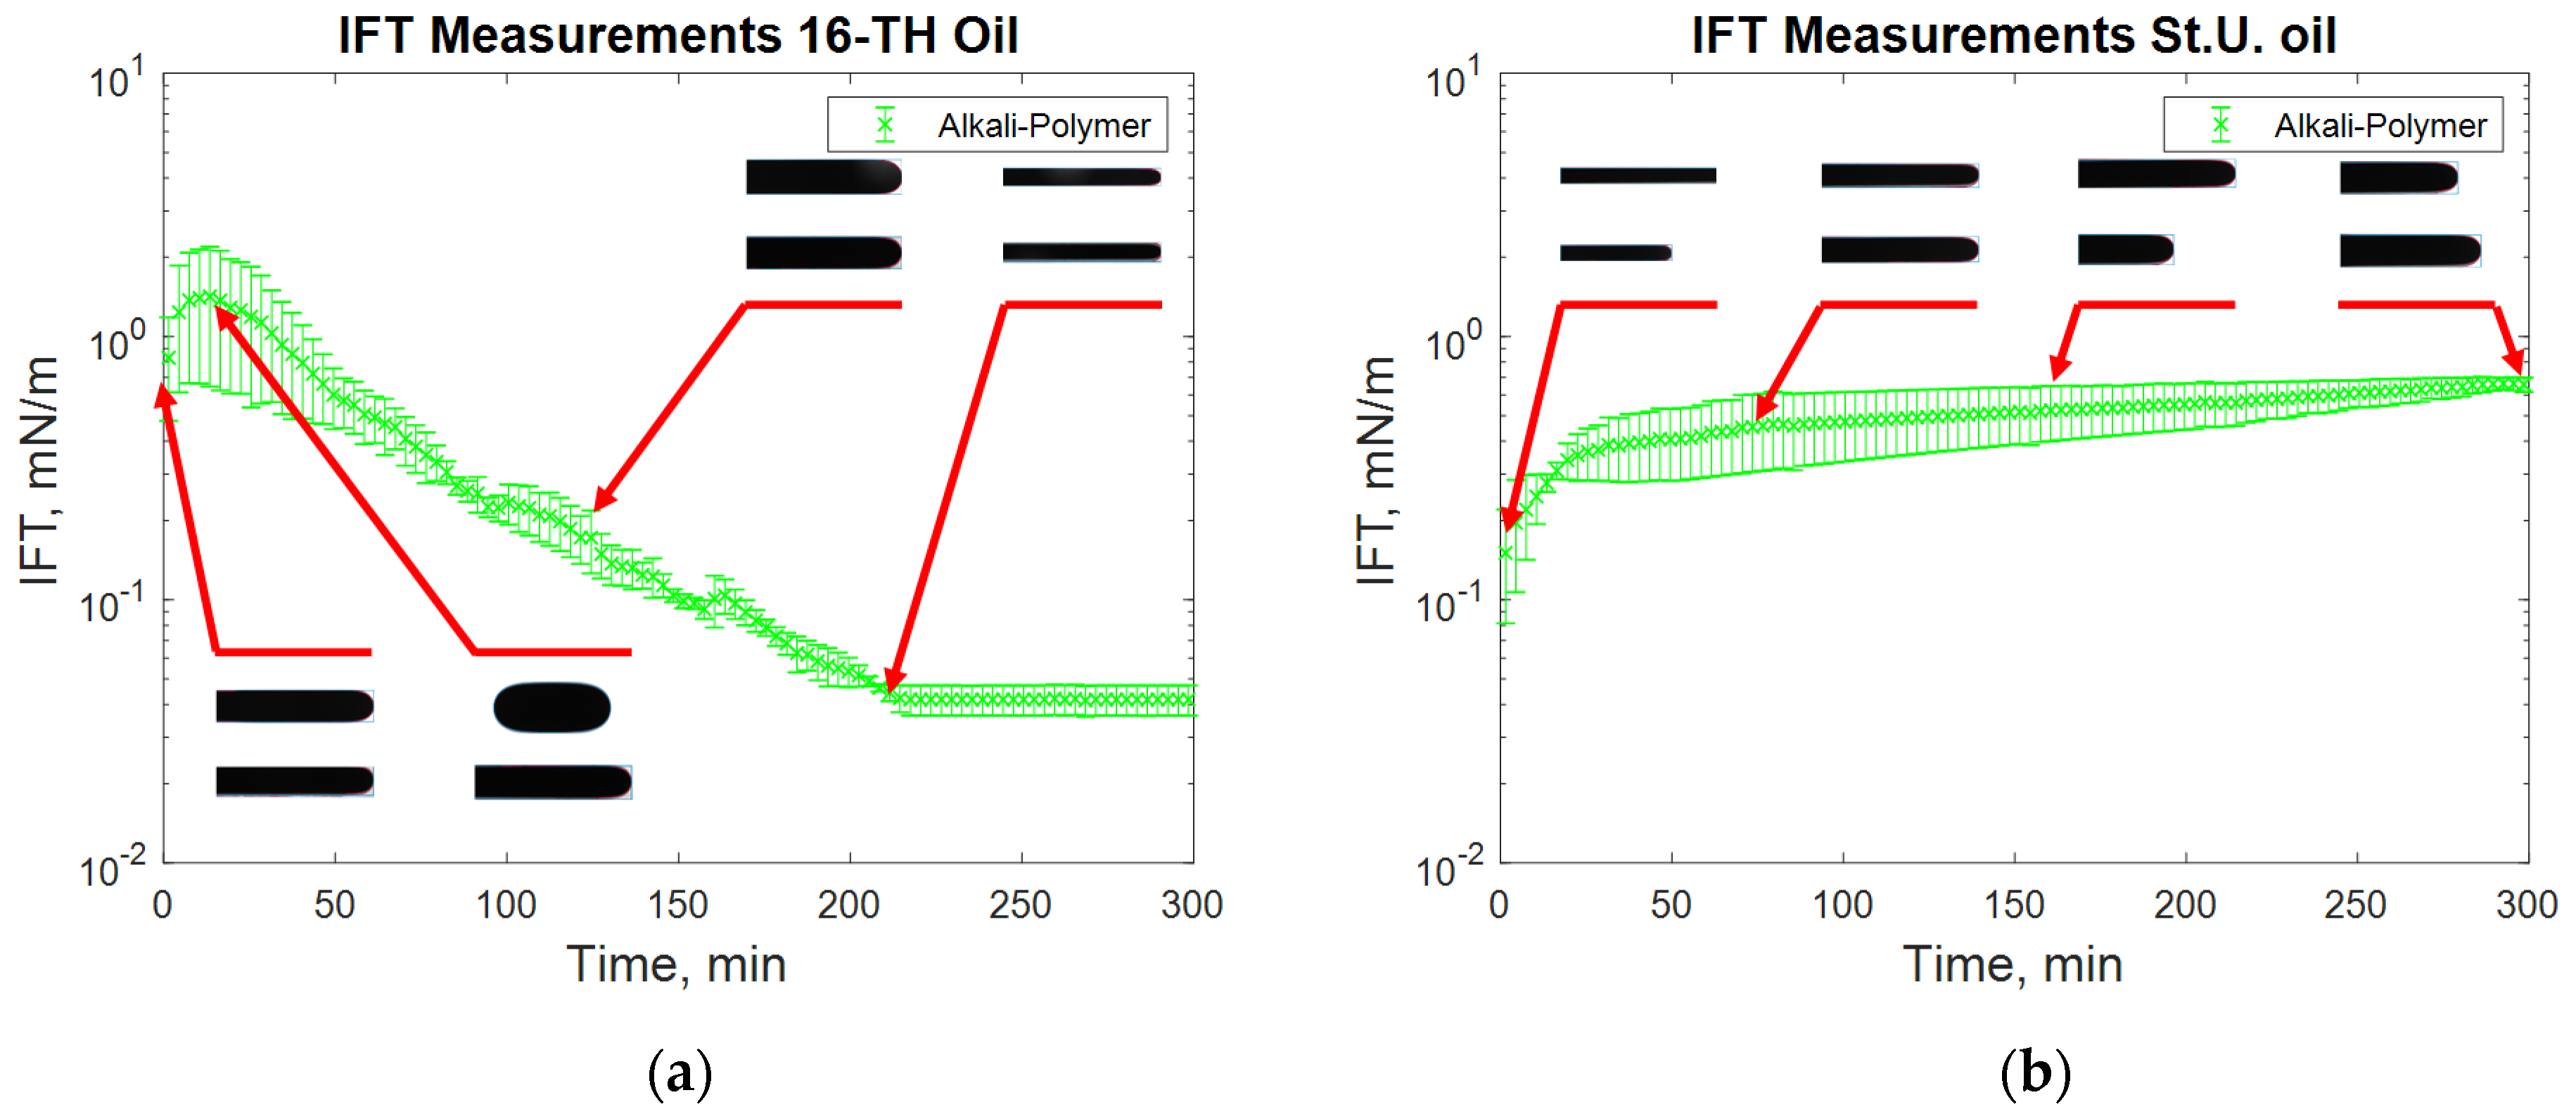
Figure 11.
IFT measurement for high TAN (a) and low TAN oil (b) with the alkali–polymer at 60 °C (alkali: 7 g/L Na2CO3; polymer: 2000 ppm FLOPAAM 3630S).
Figure 11.
IFT measurement for high TAN (a) and low TAN oil (b) with the alkali–polymer at 60 °C (alkali: 7 g/L Na2CO3; polymer: 2000 ppm FLOPAAM 3630S).
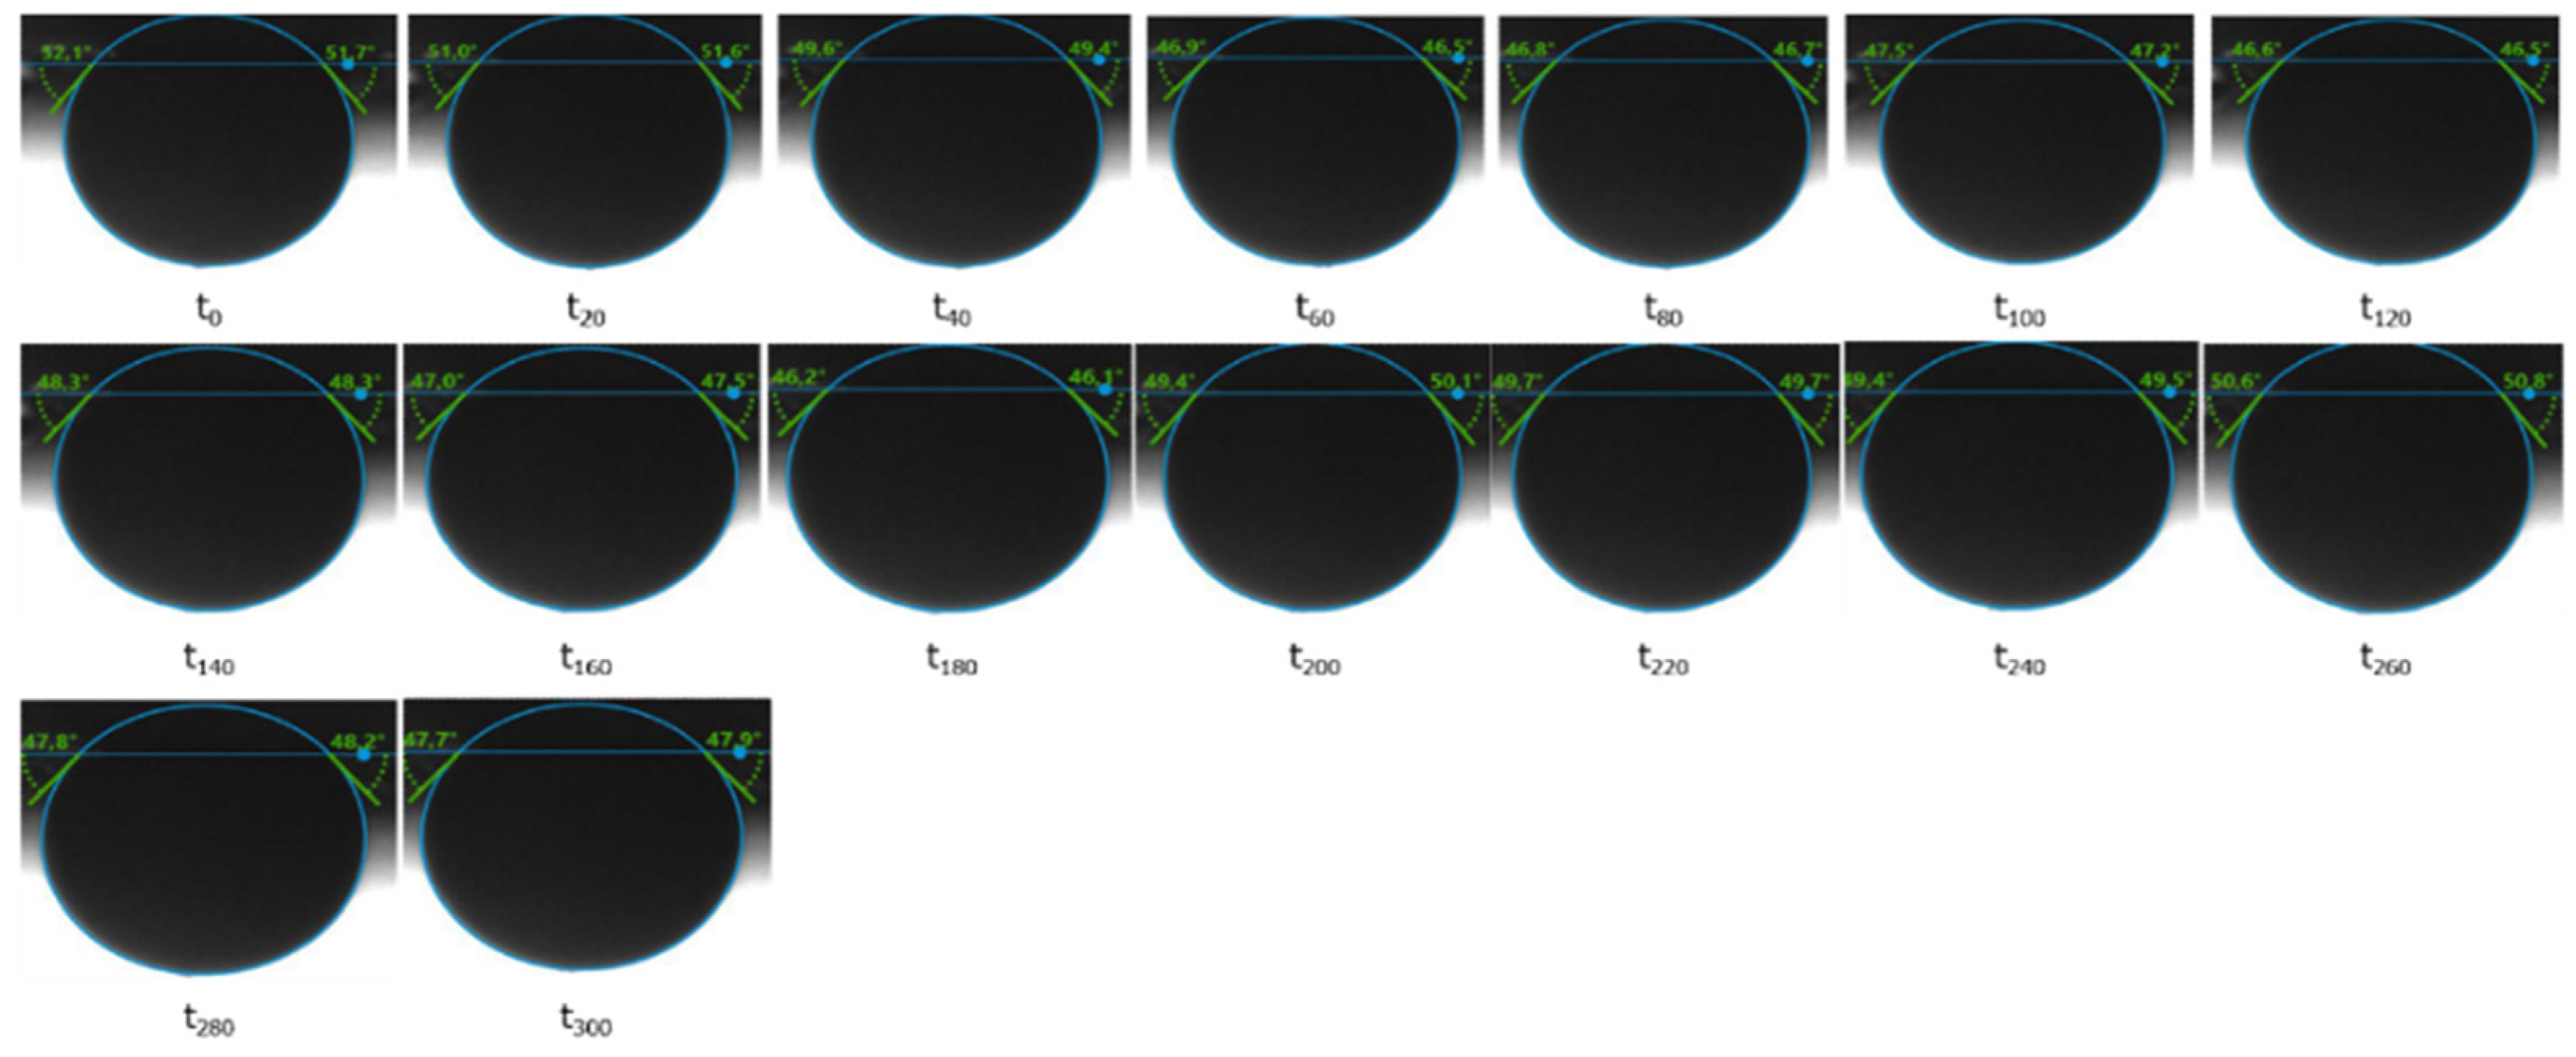
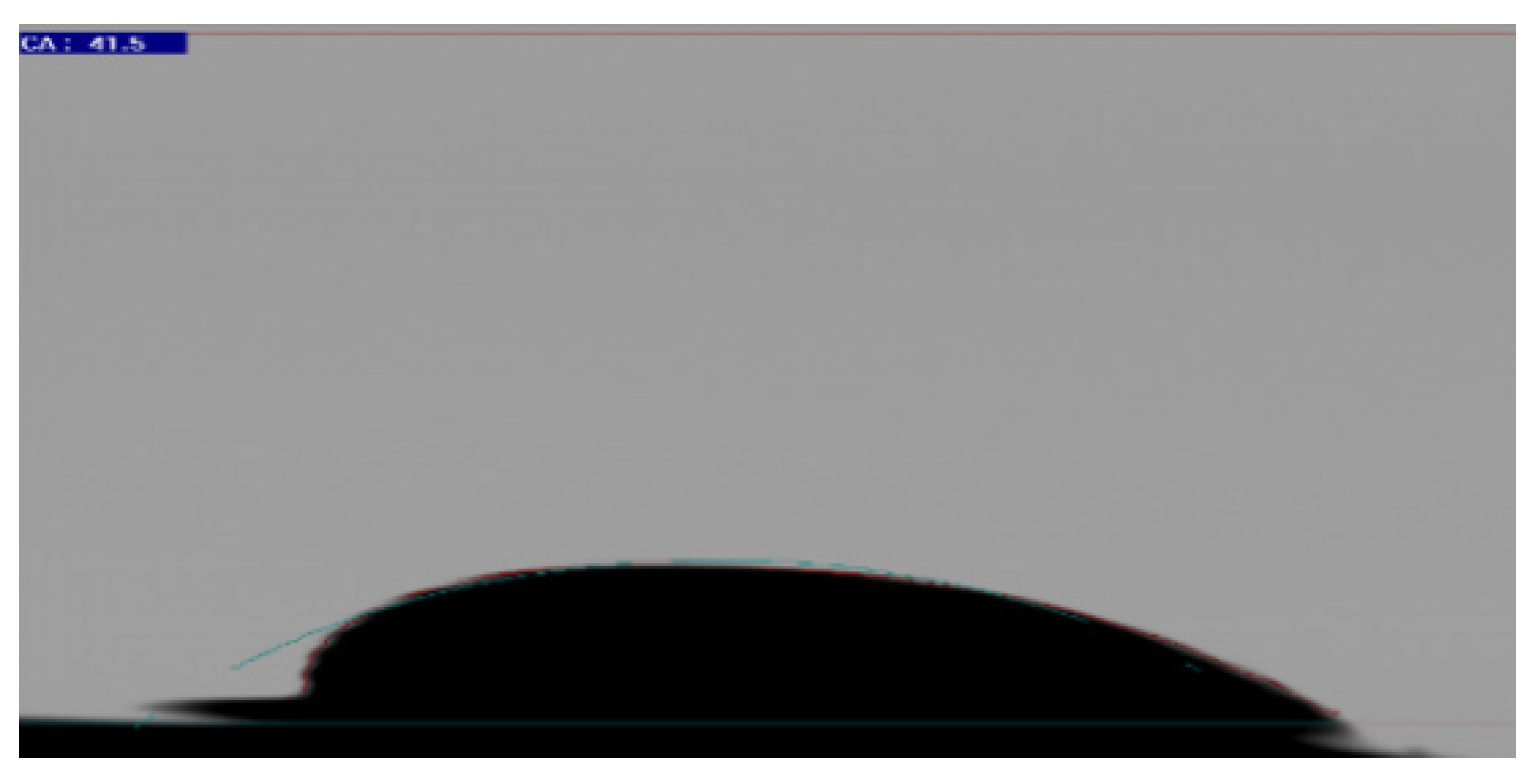
Figure 12.
Contact angle measurements performed for the Keuper core plug in contact with the St. Ulrich oil. The alkali solution is the aqueous phase.
Figure 12.
Contact angle measurements performed for the Keuper core plug in contact with the St. Ulrich oil. The alkali solution is the aqueous phase.
Figure 13.
Contact angle confirming the wettability alteration to oil-wet after the aging process [
34].
Figure 13.
Contact angle confirming the wettability alteration to oil-wet after the aging process [
34].
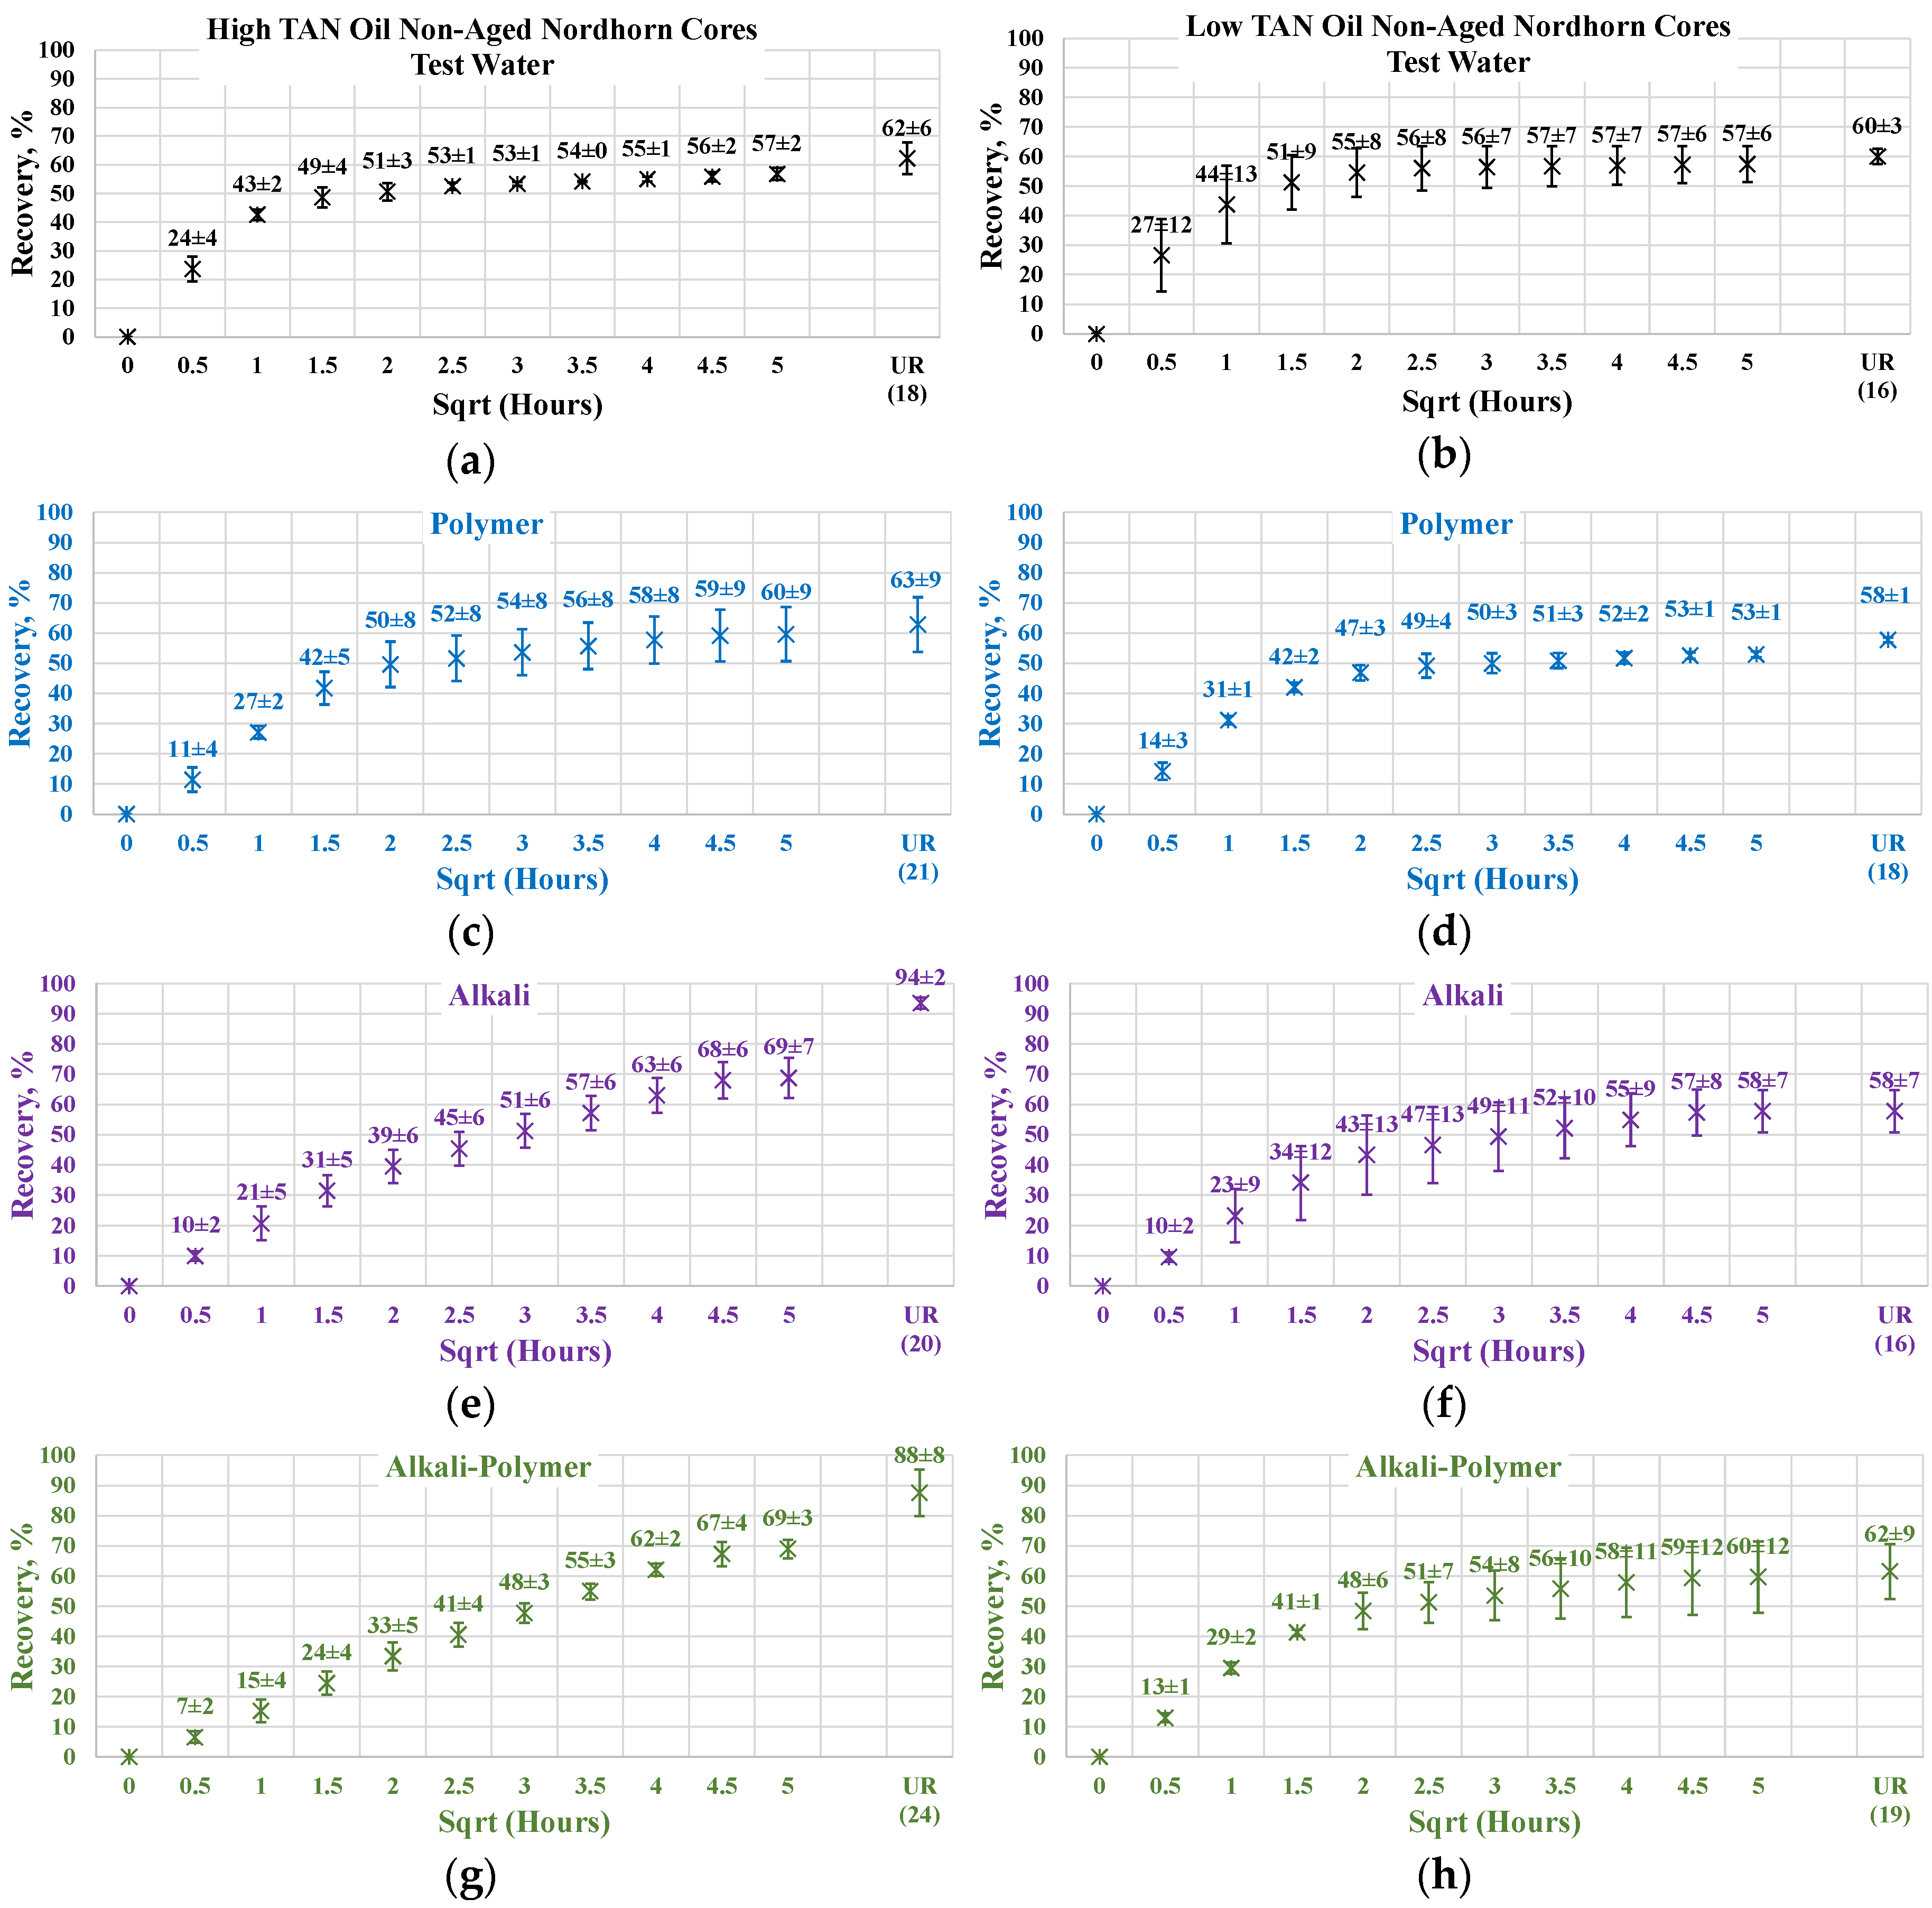
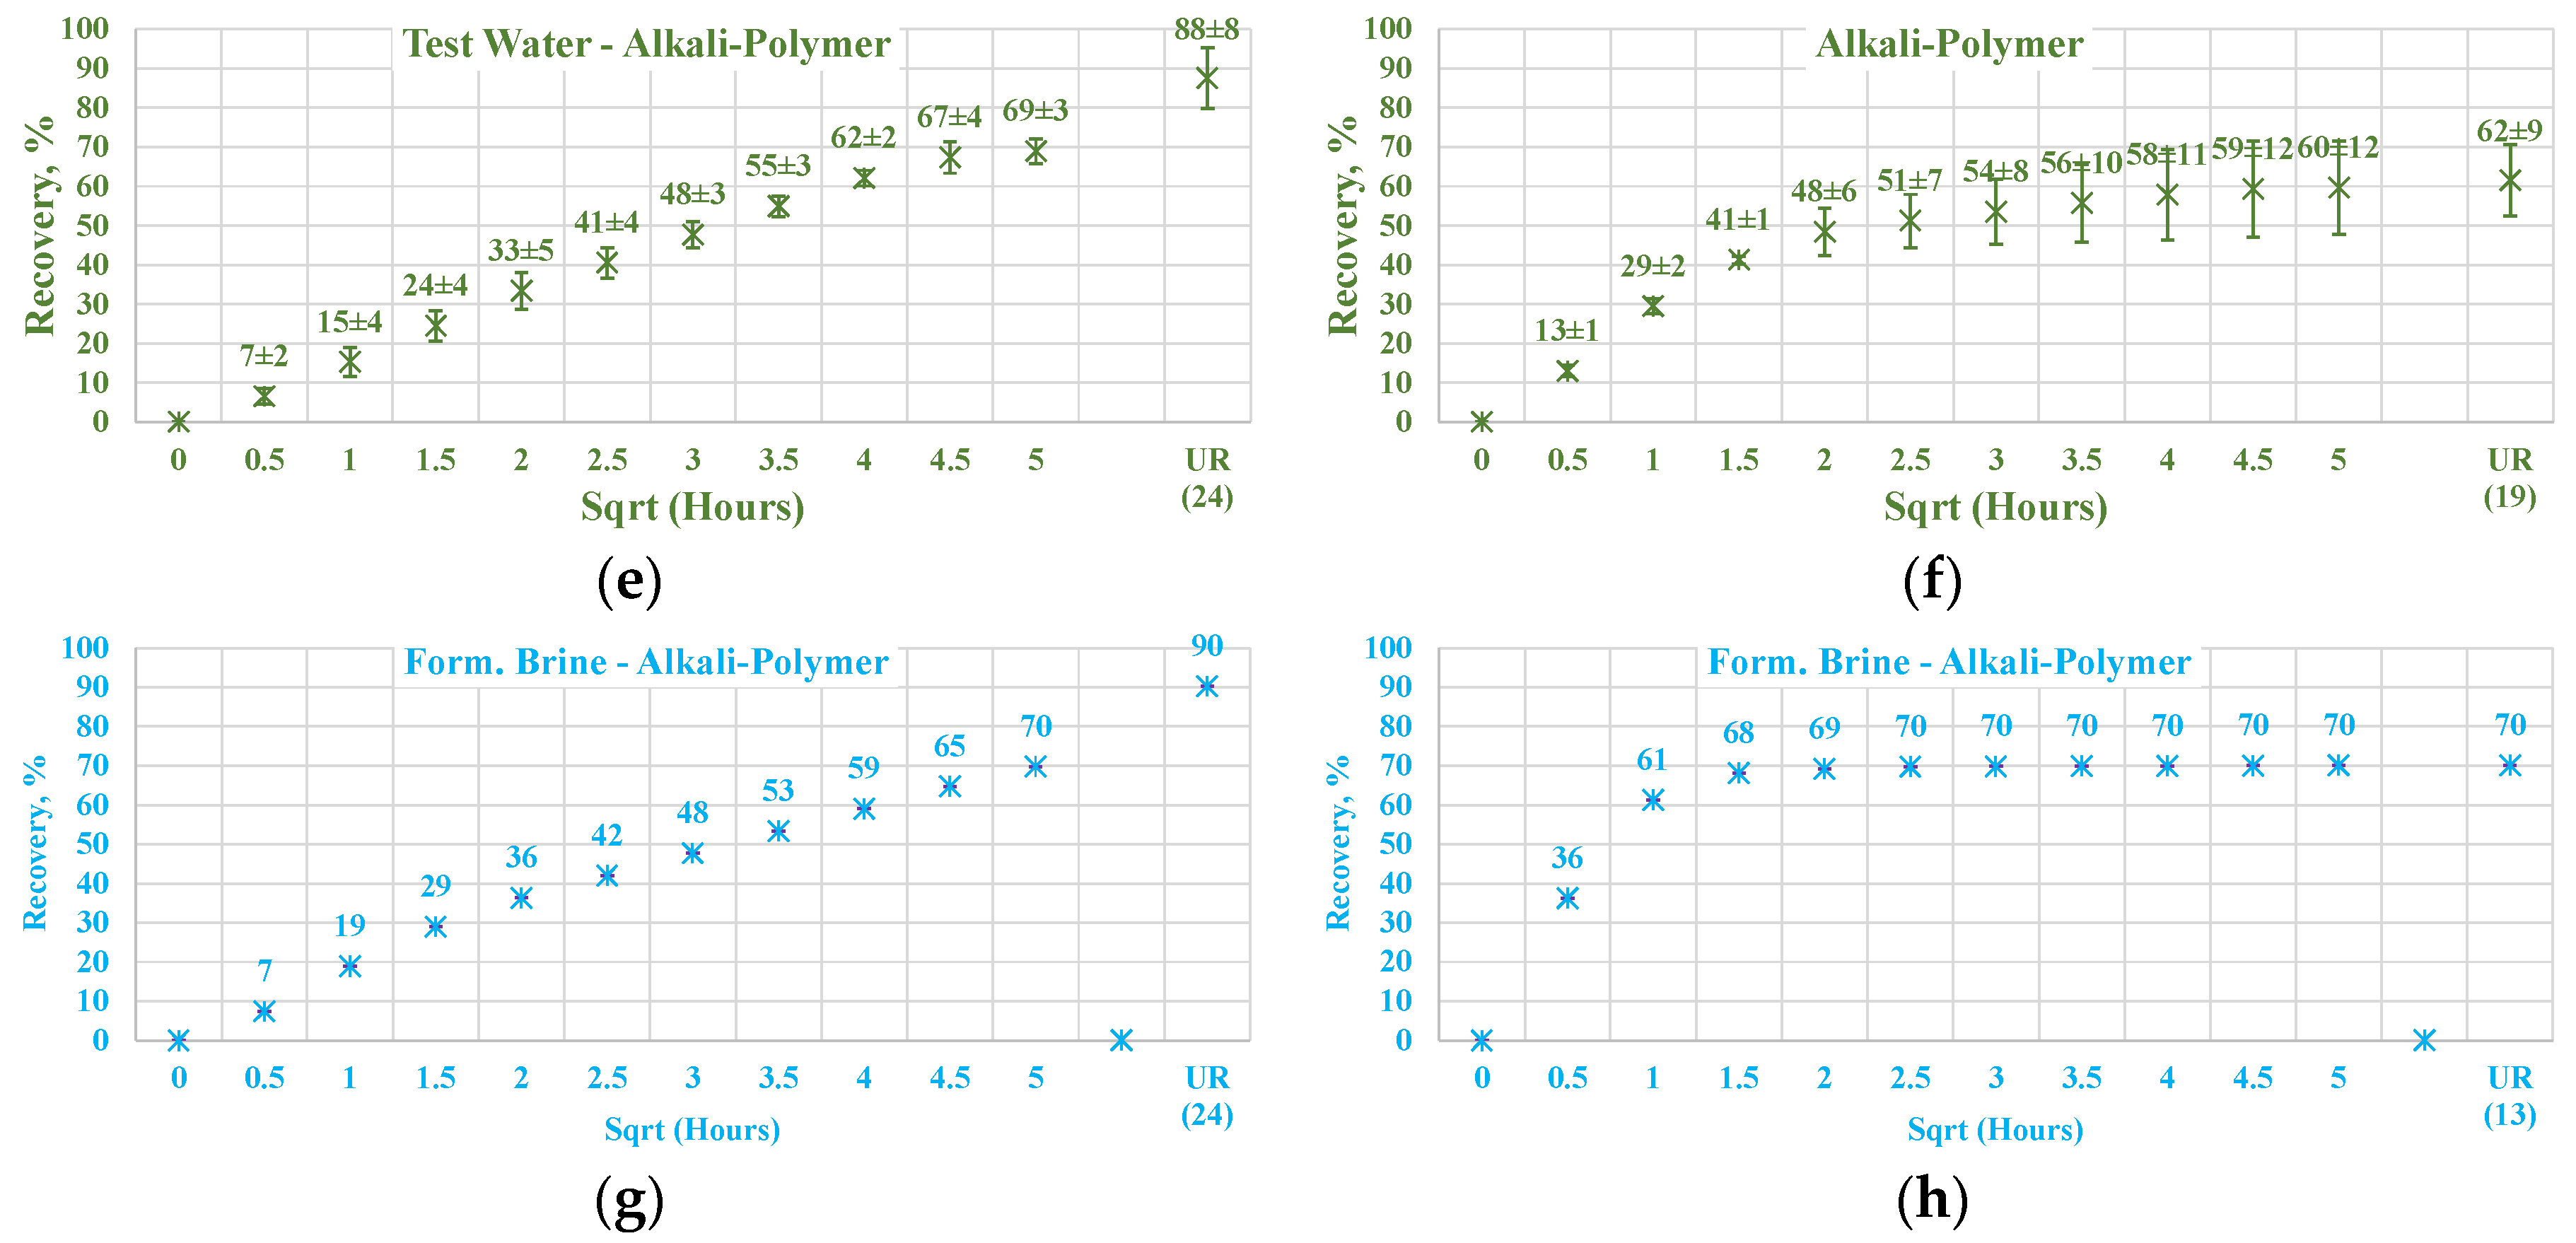
Figure 14.
Percent of production versus the square root of the time plot for the Nordhorn non-aged core plugs using high TAN oil and low TAN oil at 60 °C (alkali: 7 g/L Na2CO3; polymer: 2000 ppm FLOPAAM 3630S). High TAN oil data (a,c,e,g) are presented on the left side whereas low TAN oil data (b,d,f,h) on the right side. Black-colored data refer to Test water, Blue-colored data refer to polymer, purple-colored data refer to alkali, and green-colored data refer to alkali-polymer. Ultimate recovery (UR) refers to recovered oil divided bv Soi.
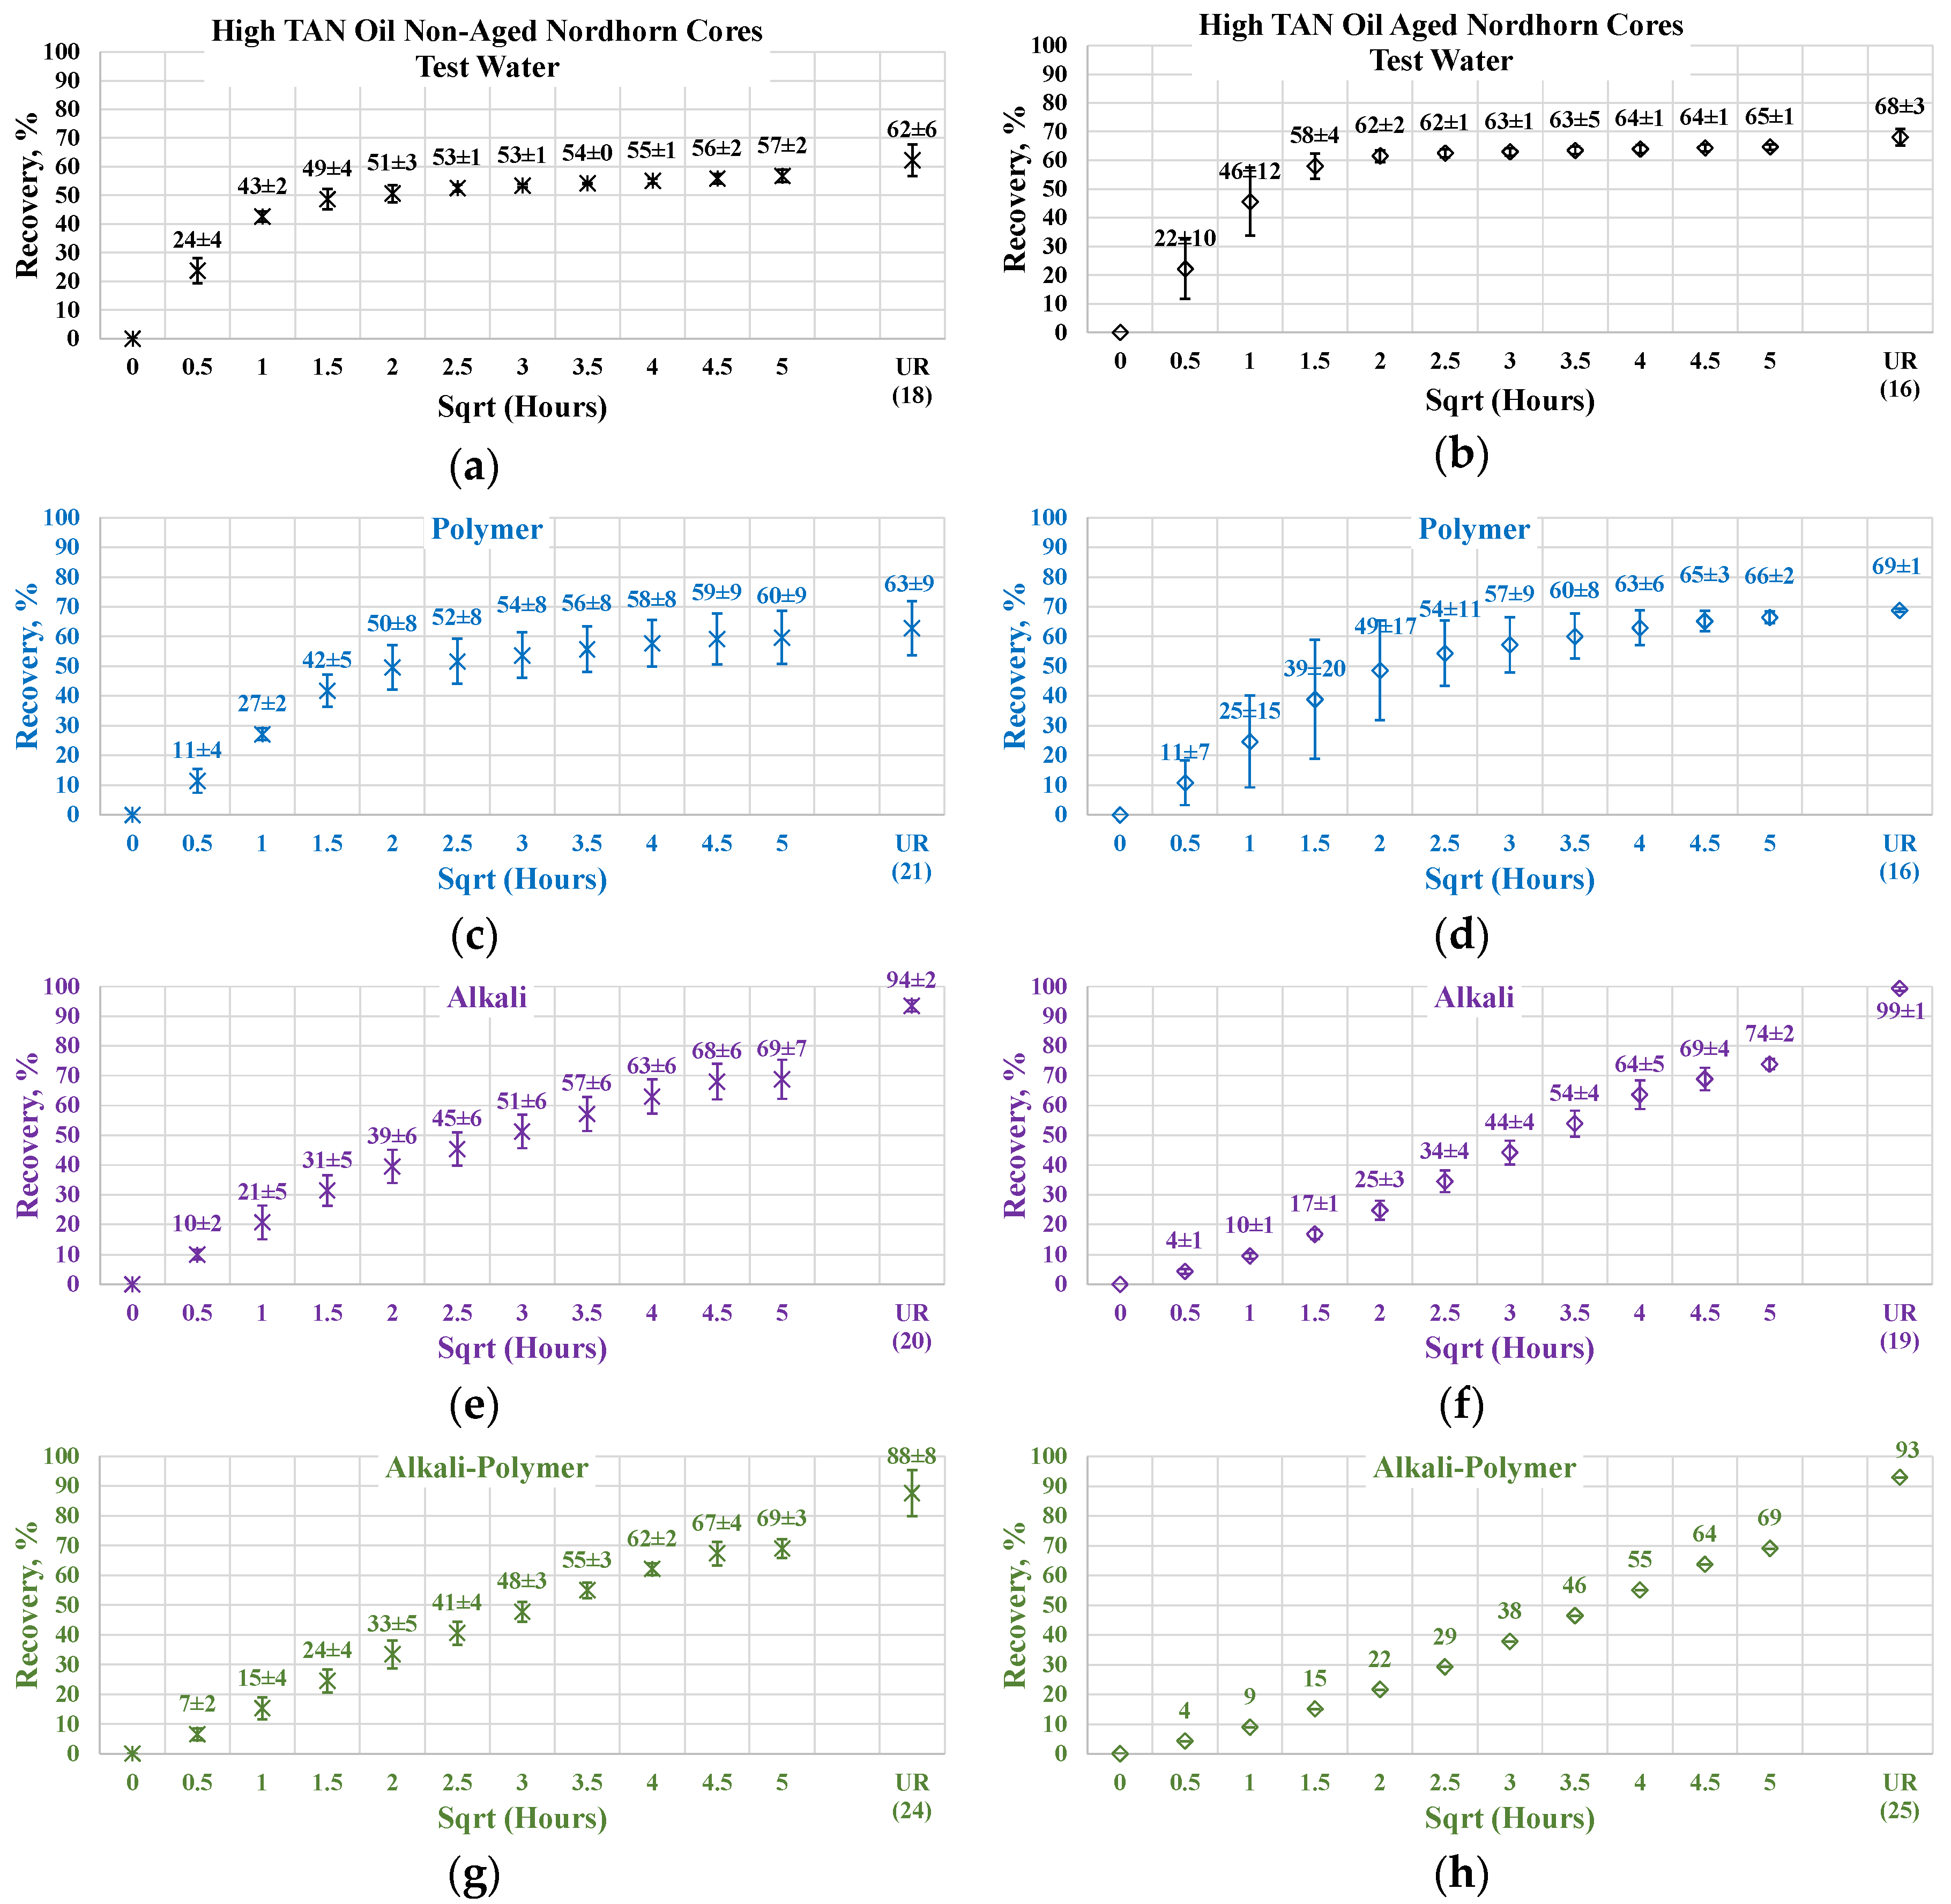
Figure 15.
Percent of production versus the square root of the time plot for the Nordhorn non-aged and aged core plugs saturated with high TAN oil at 60 °C (alkali: 7 g/L Na2CO3; polymer: 2000 ppm FLOPAAM 3630S). Non-aged core data (a,c,e,g) are presented on the left side whereas aged core data (b,d,f,h) on the right side. Black-colored data refer to Test water, Blue-colored data refer to polymer, purple-colored data refer to alkali, and green-colored data refer to alkali-polymer. Ultimate recovery (UR) refers to recovered oil divided bv Soi.
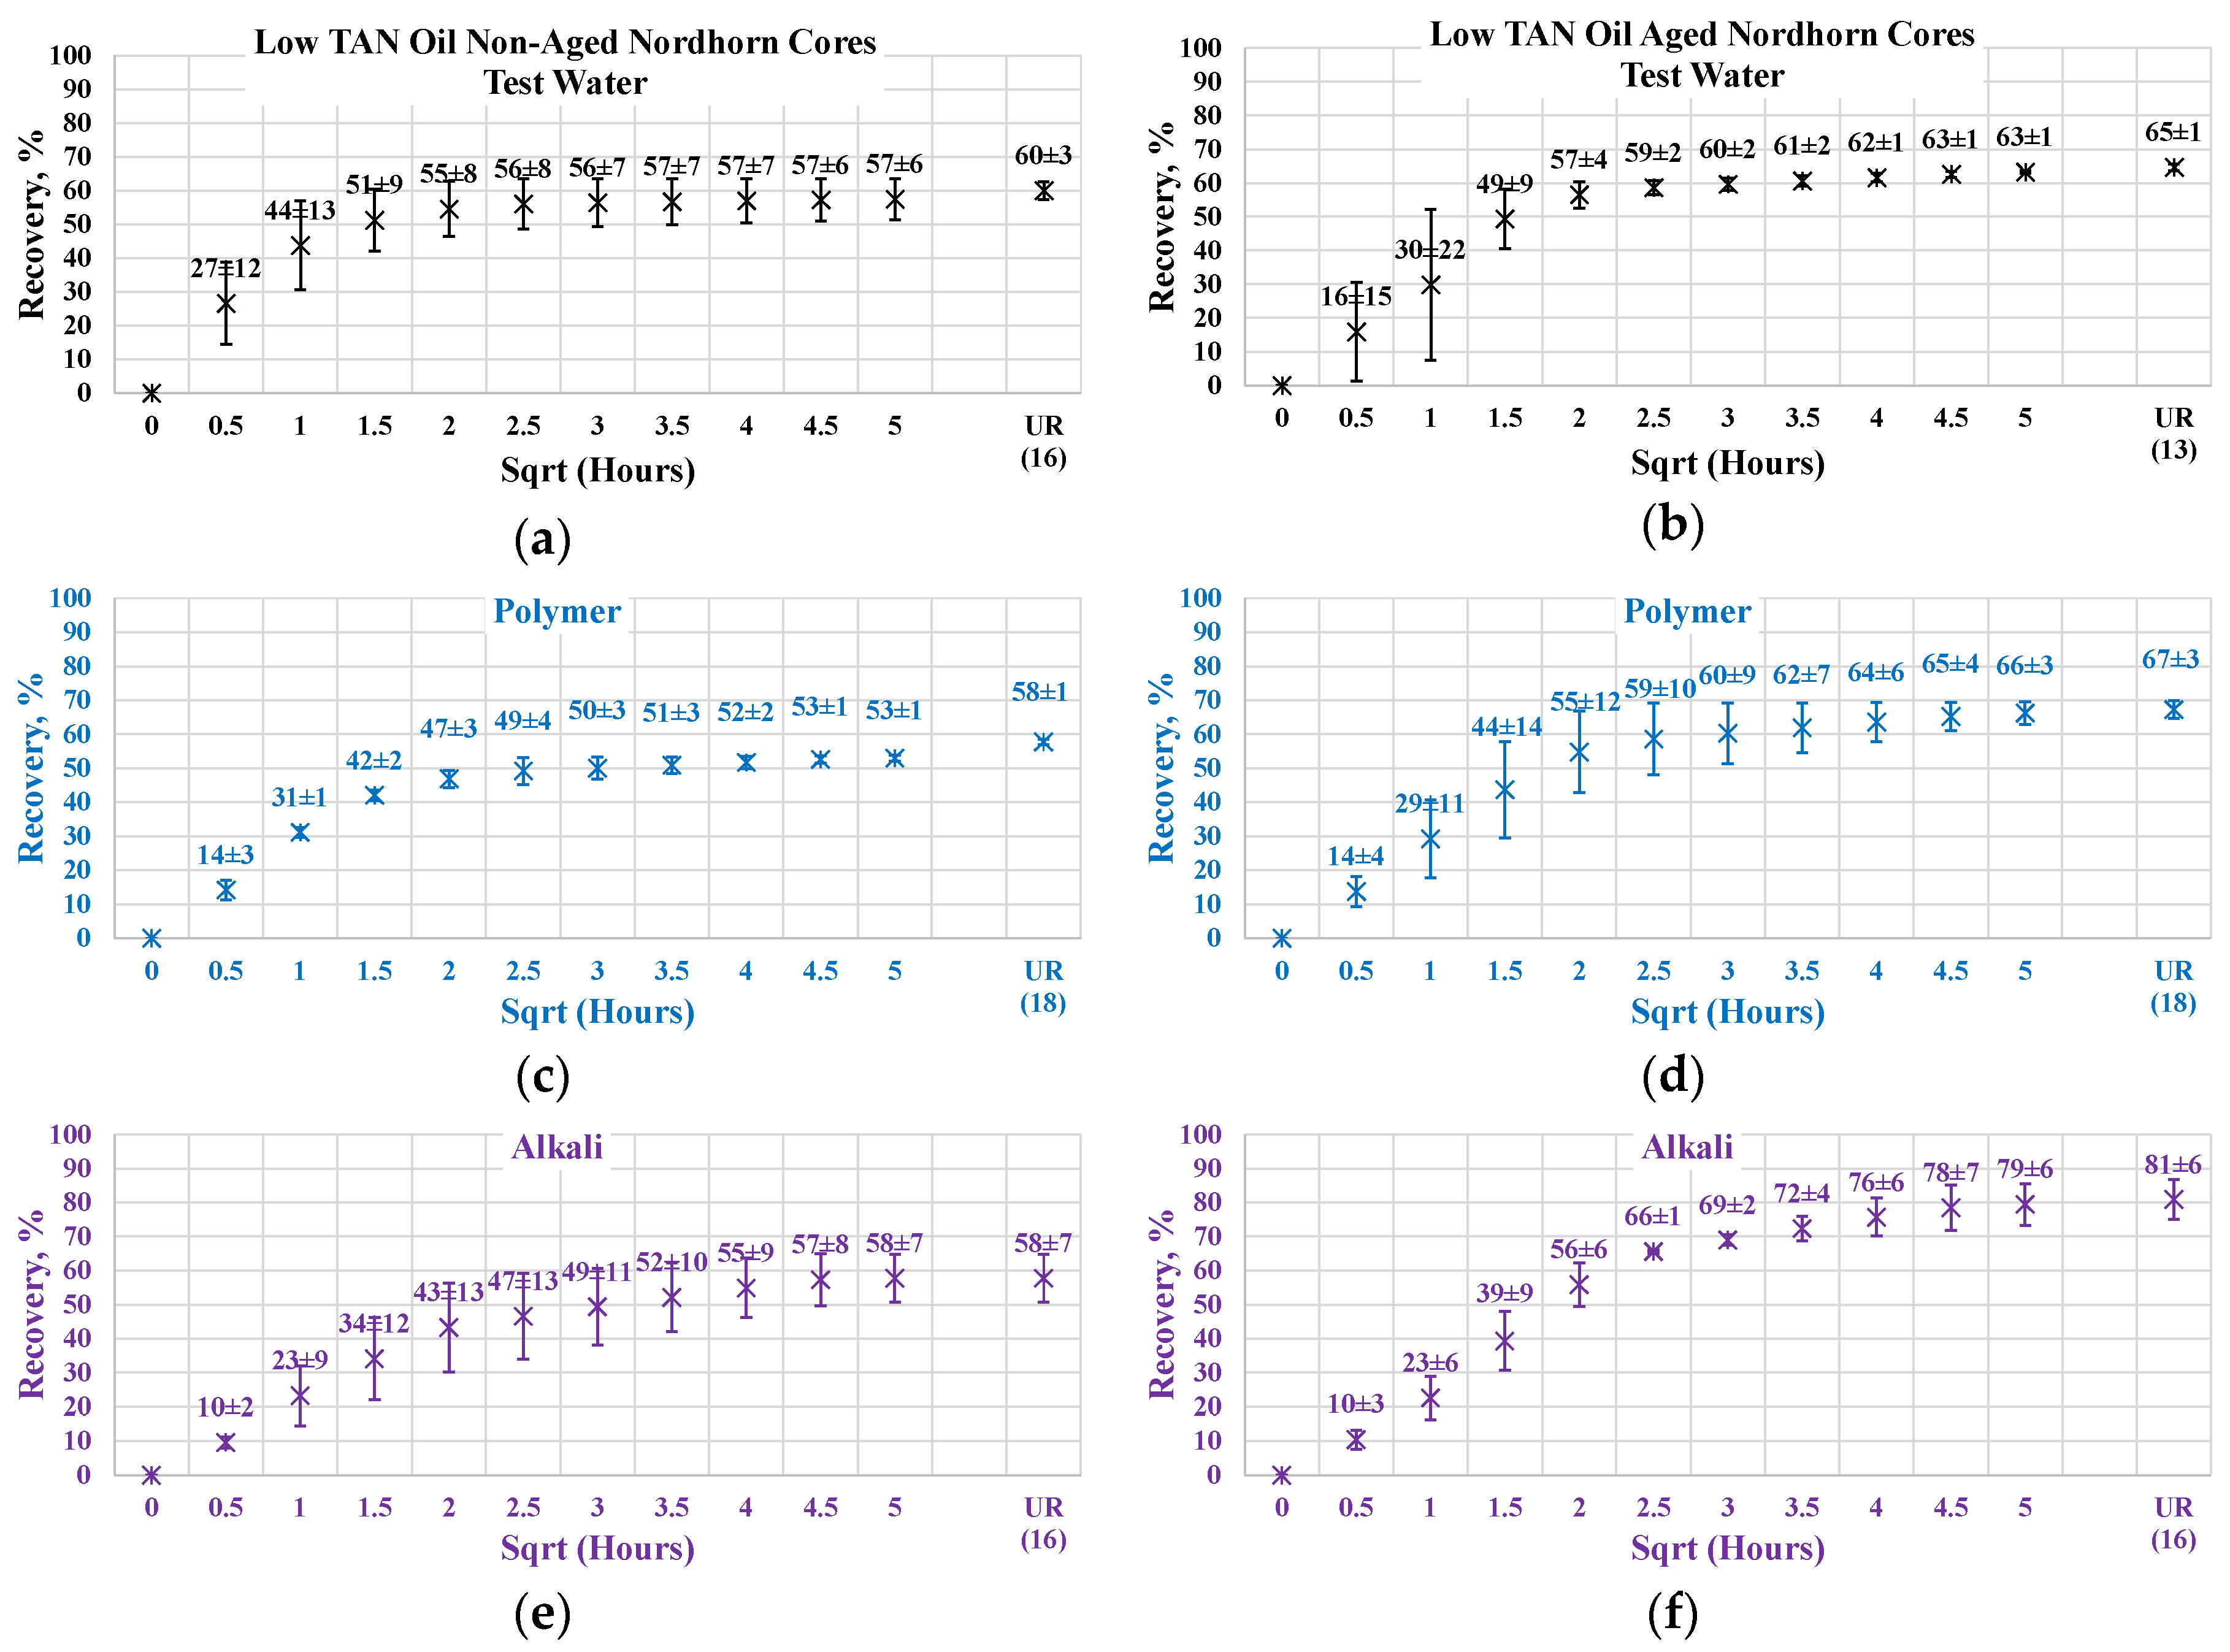
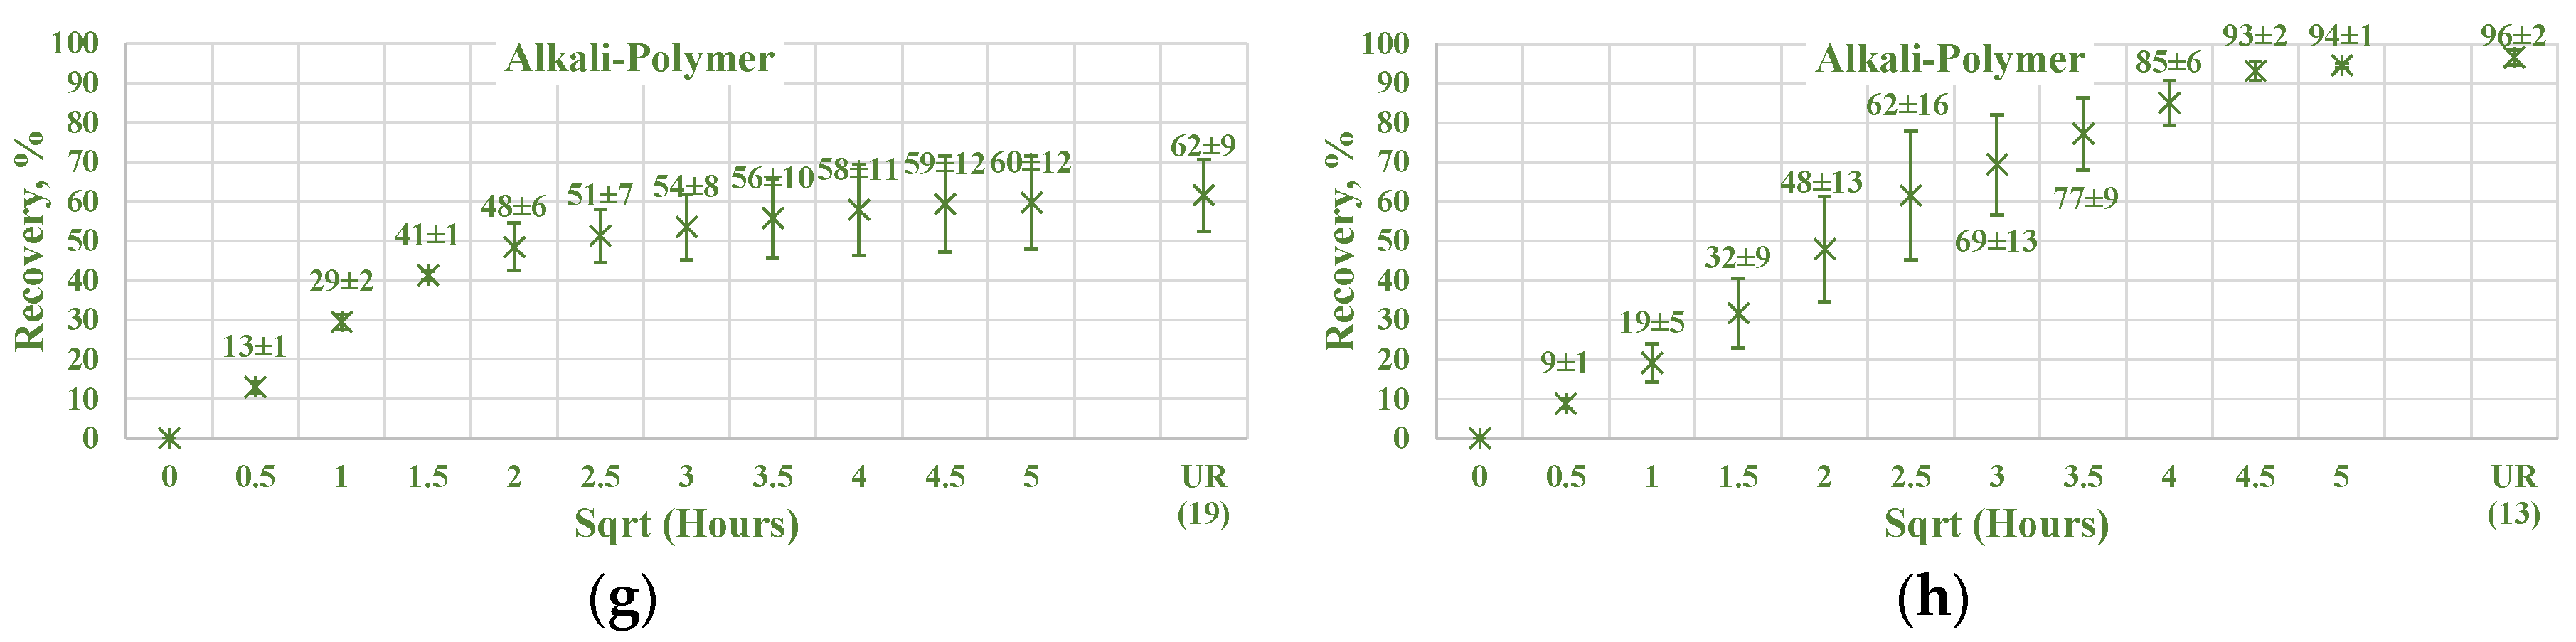
Figure 16.
Percent of production versus the square root of the time plot for the Nordhorn non-aged and aged core plugs saturated with low TAN oil at 60 °C (alkali: 7 g/L Na2CO3; polymer: 2000 ppm FLOPAAM 3630S). Non-aged core data (a,c,e,g) are presented on the left side whereas aged core data (b,d,f,h) on the right side. Black-colored data refer to Test water, Blue-colored data refer to polymer, purple-colored data refer to alkali, and green-colored data refer to alkali-polymer. Ultimate recovery (UR) refers to recovered oil divided bv Soi.
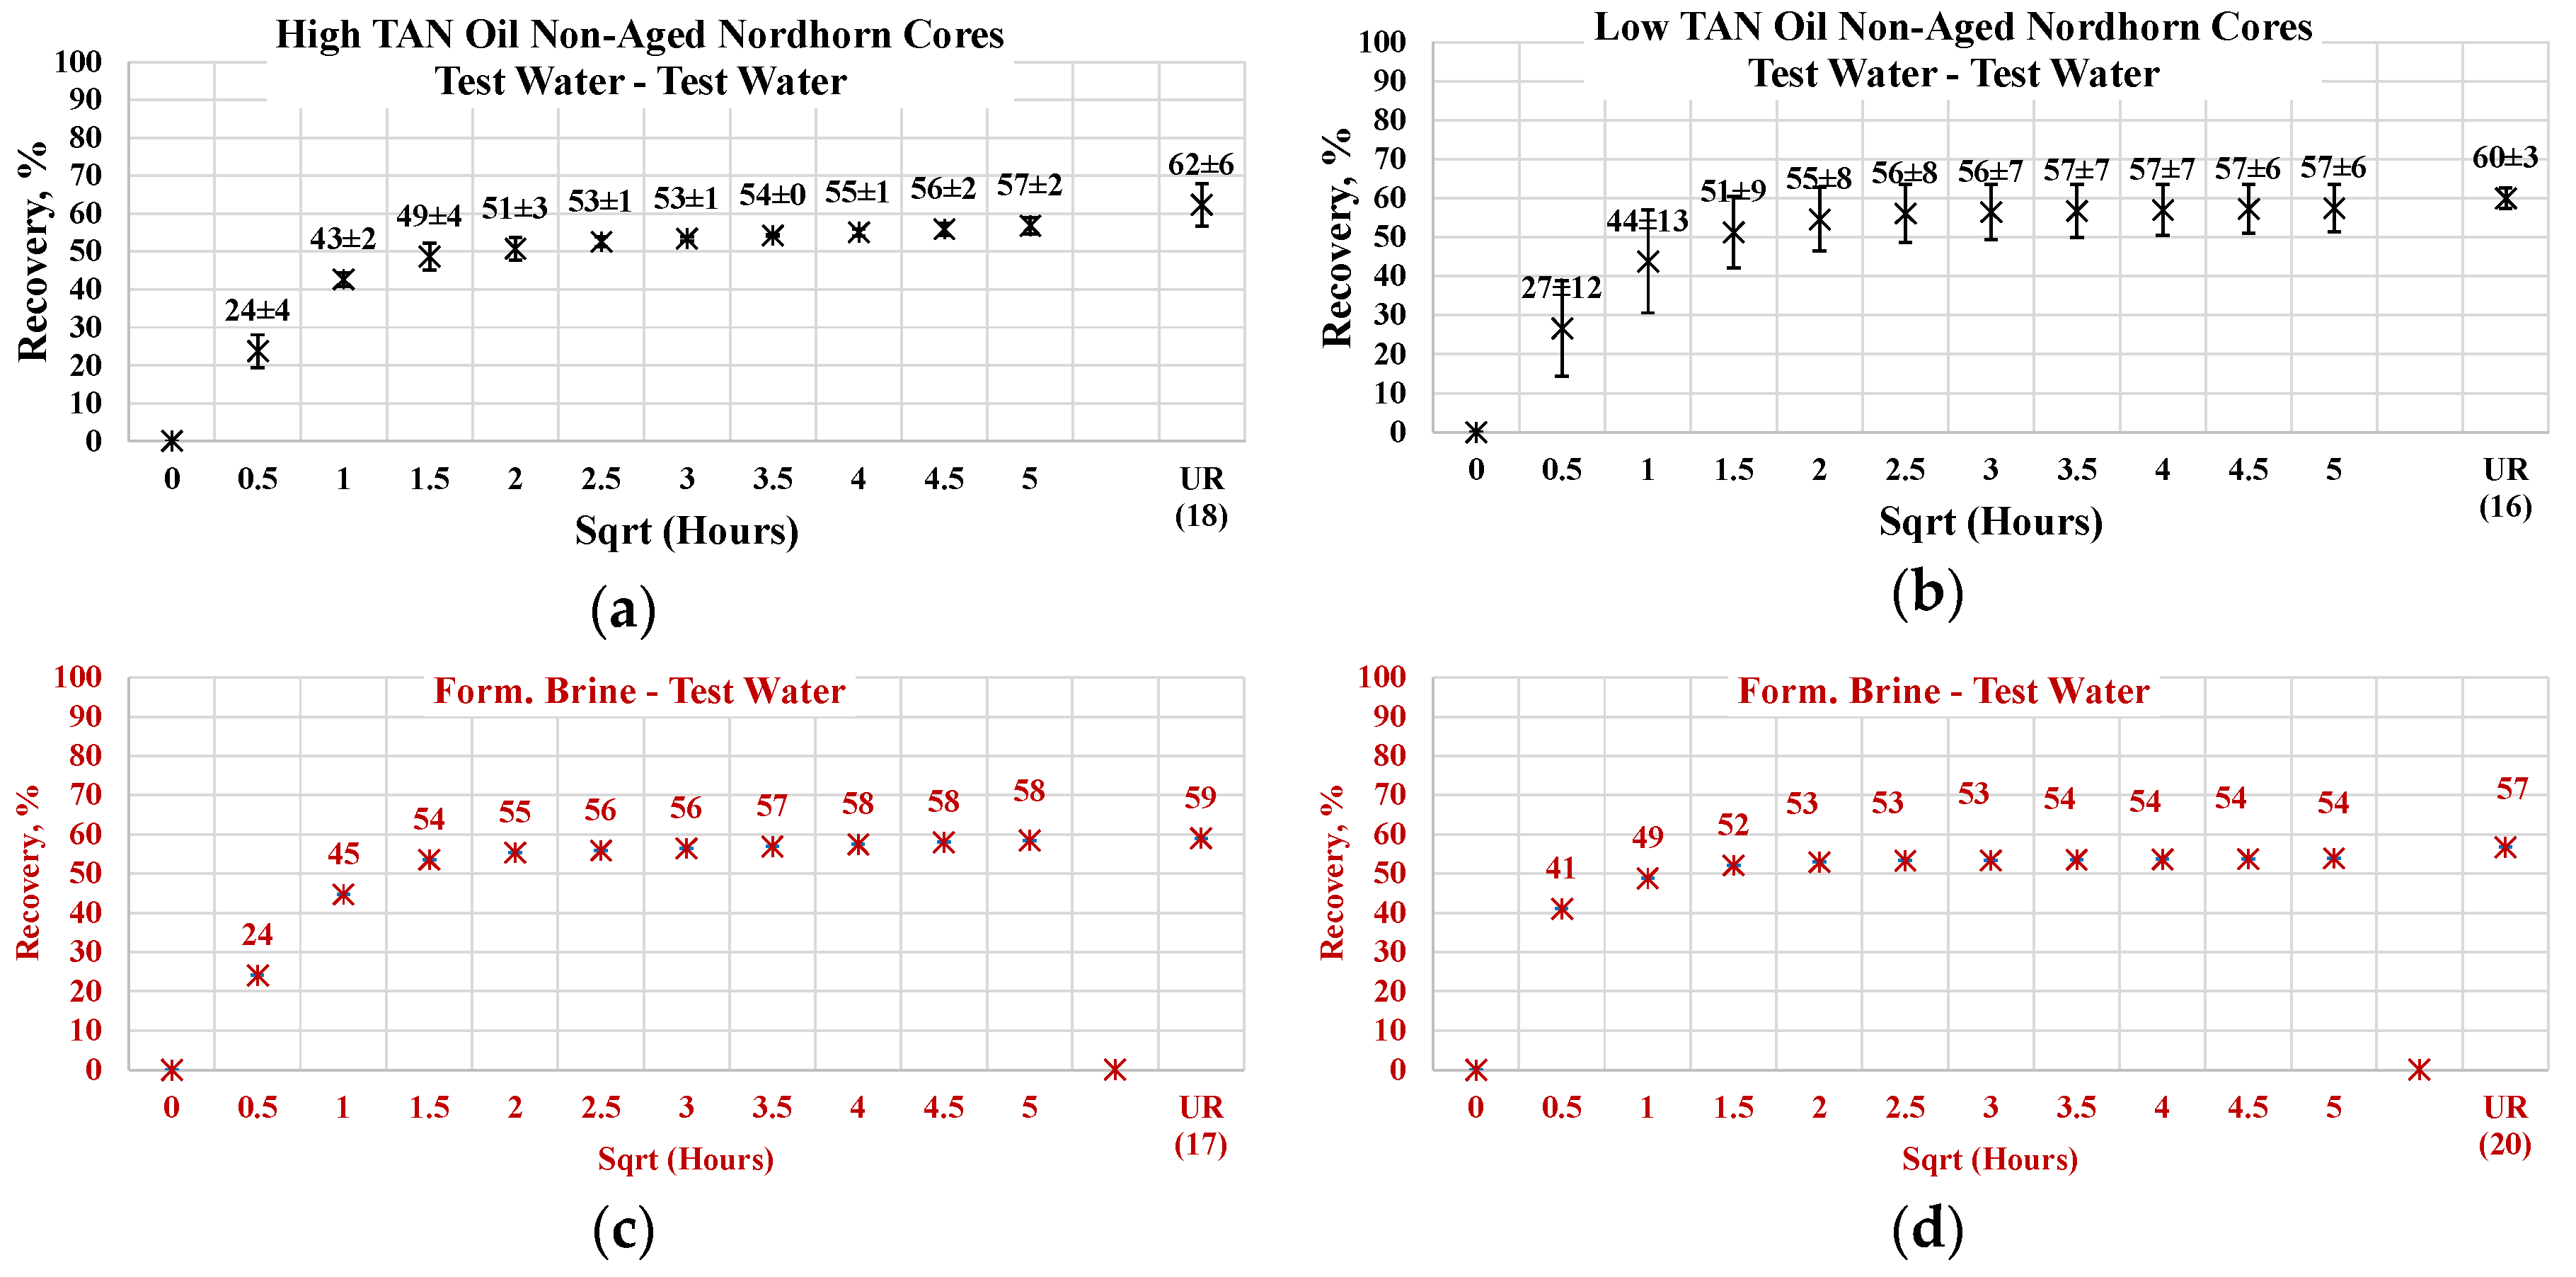
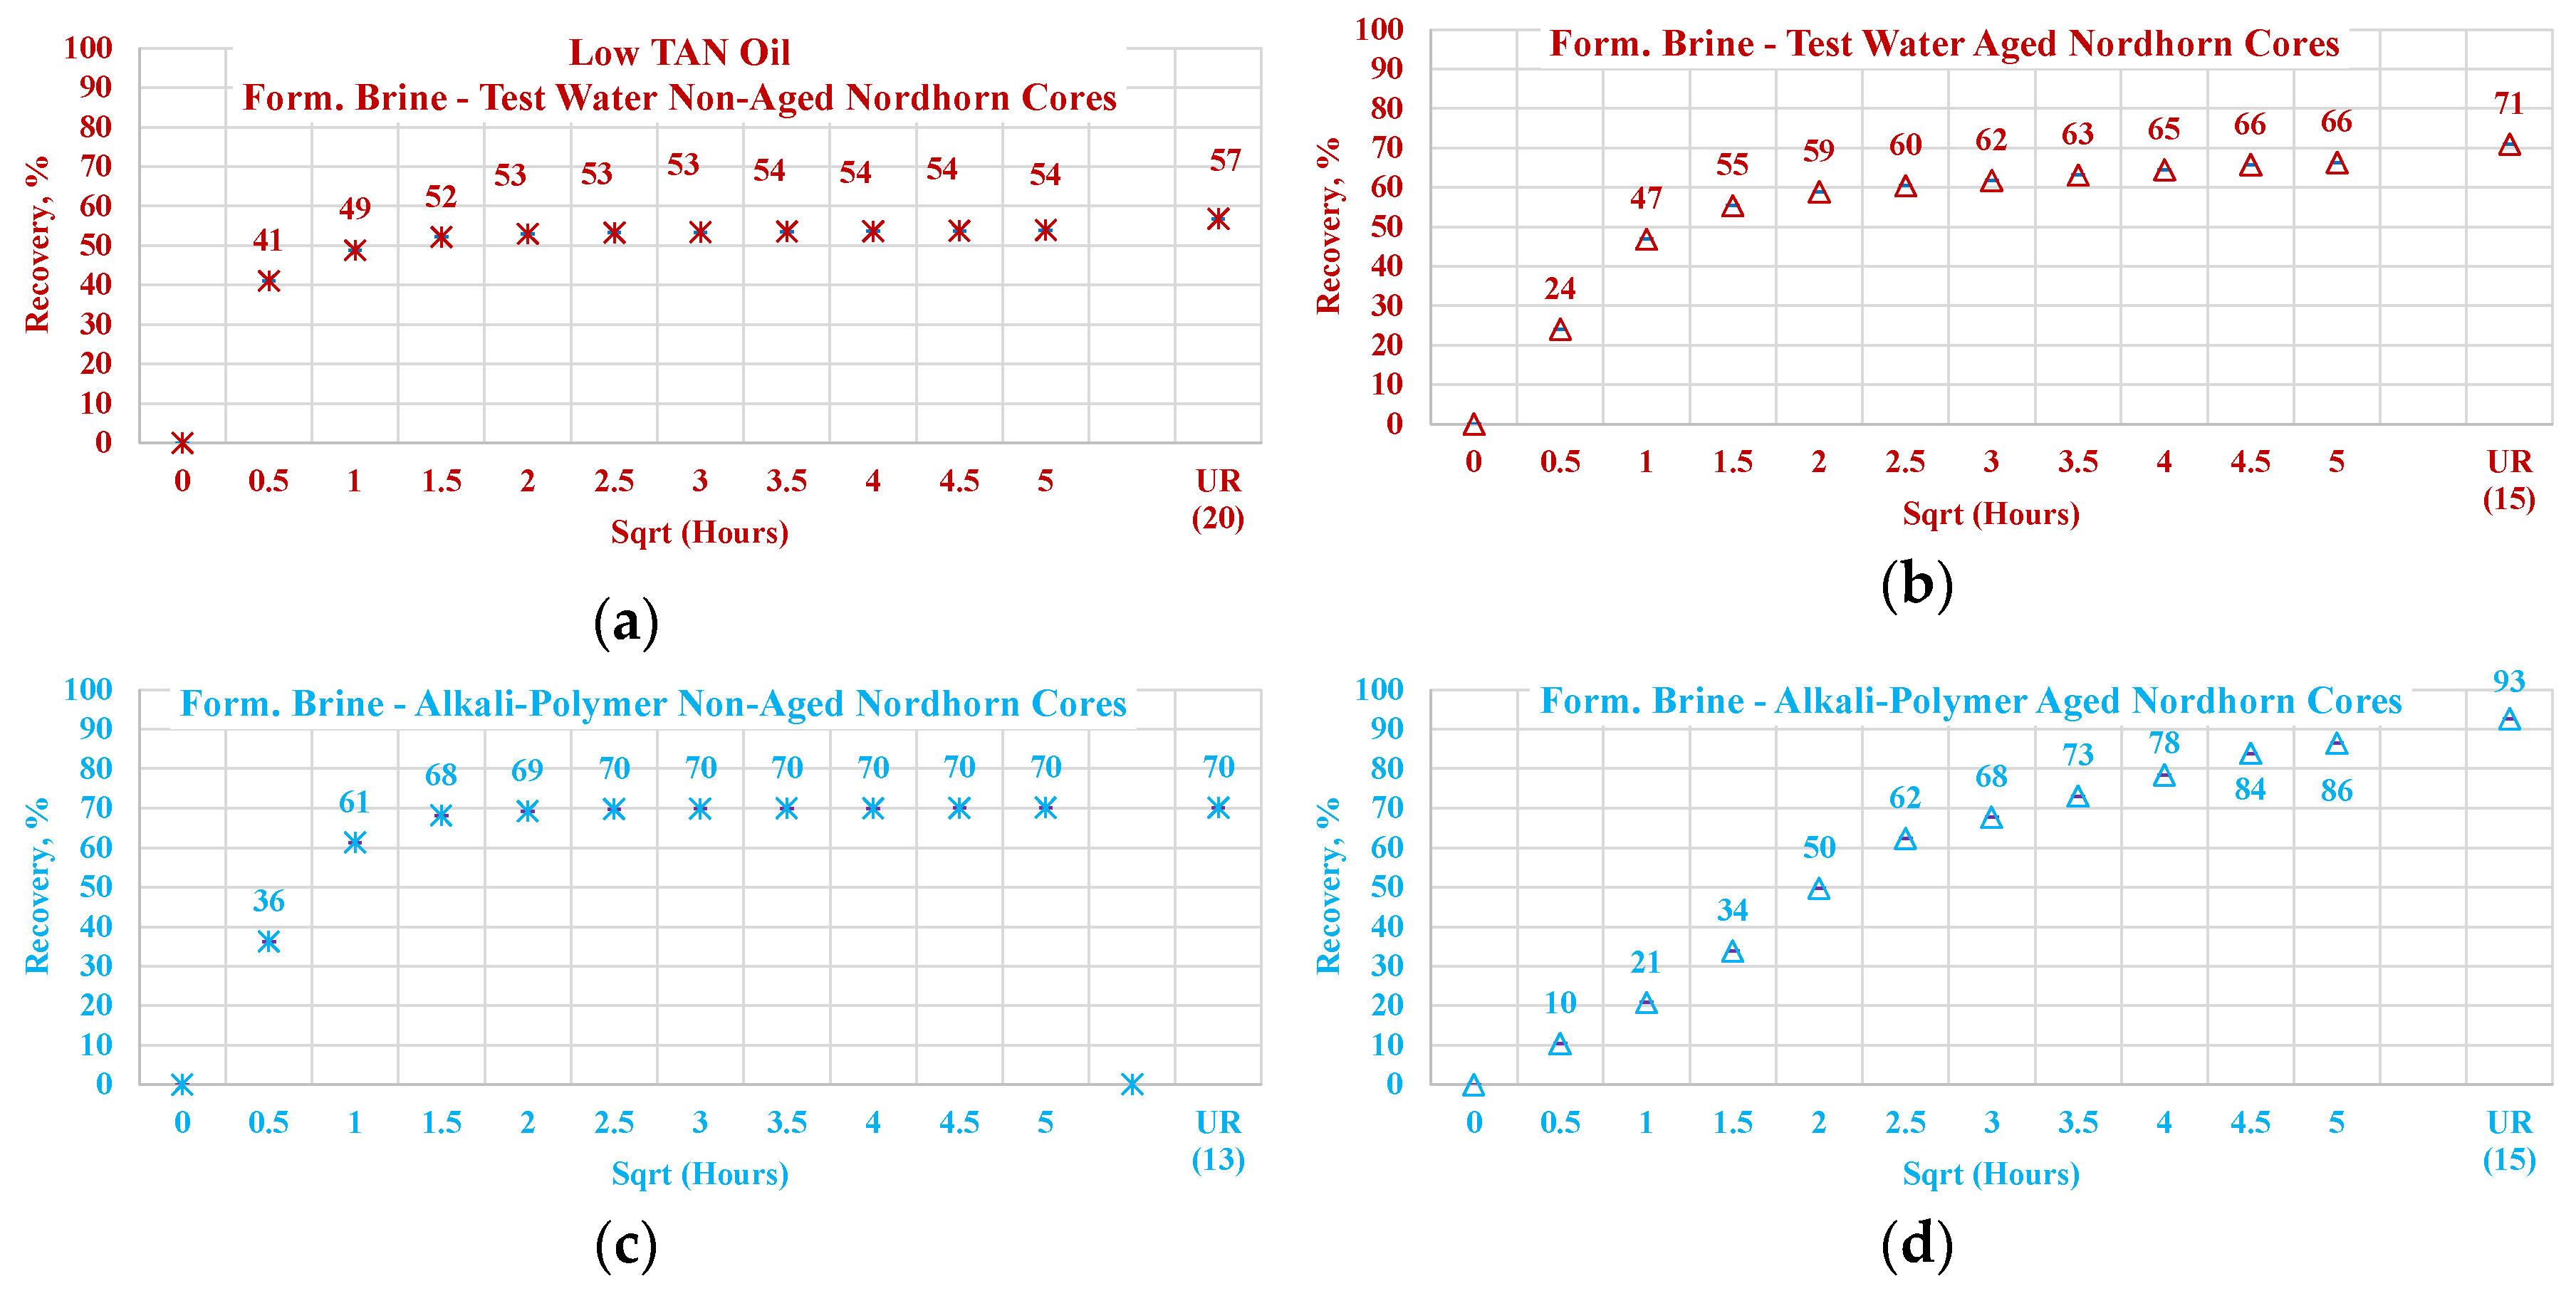
Figure 17.
Percentage of production versus the square root of the time plot for non-aged Nordhorn core plugs (water composition comparison) for high TAN oil (a) and low TAN oil (b) at 60 °C (alkali: 7 g/L Na2CO3; polymer: 2000 ppm FLOPAAM 3630S). High TAN oil data (a,c,e,g) are presented on the left side whereas low TAN oil data (b,d,f,h) on the right side. Black-colored data refer to Test water (saturated core) imbibed by test water, red-colored data refer to formation brine (saturated core) imbibed by test water, green-colored data refer to test water (saturated core) imbibed by alkali-polymer, and blue-colored data refer to formation brine (saturated core) imbibed by alkali-polymer. Ultimate recovery (UR) refers to recovered oil divided bv Soi.
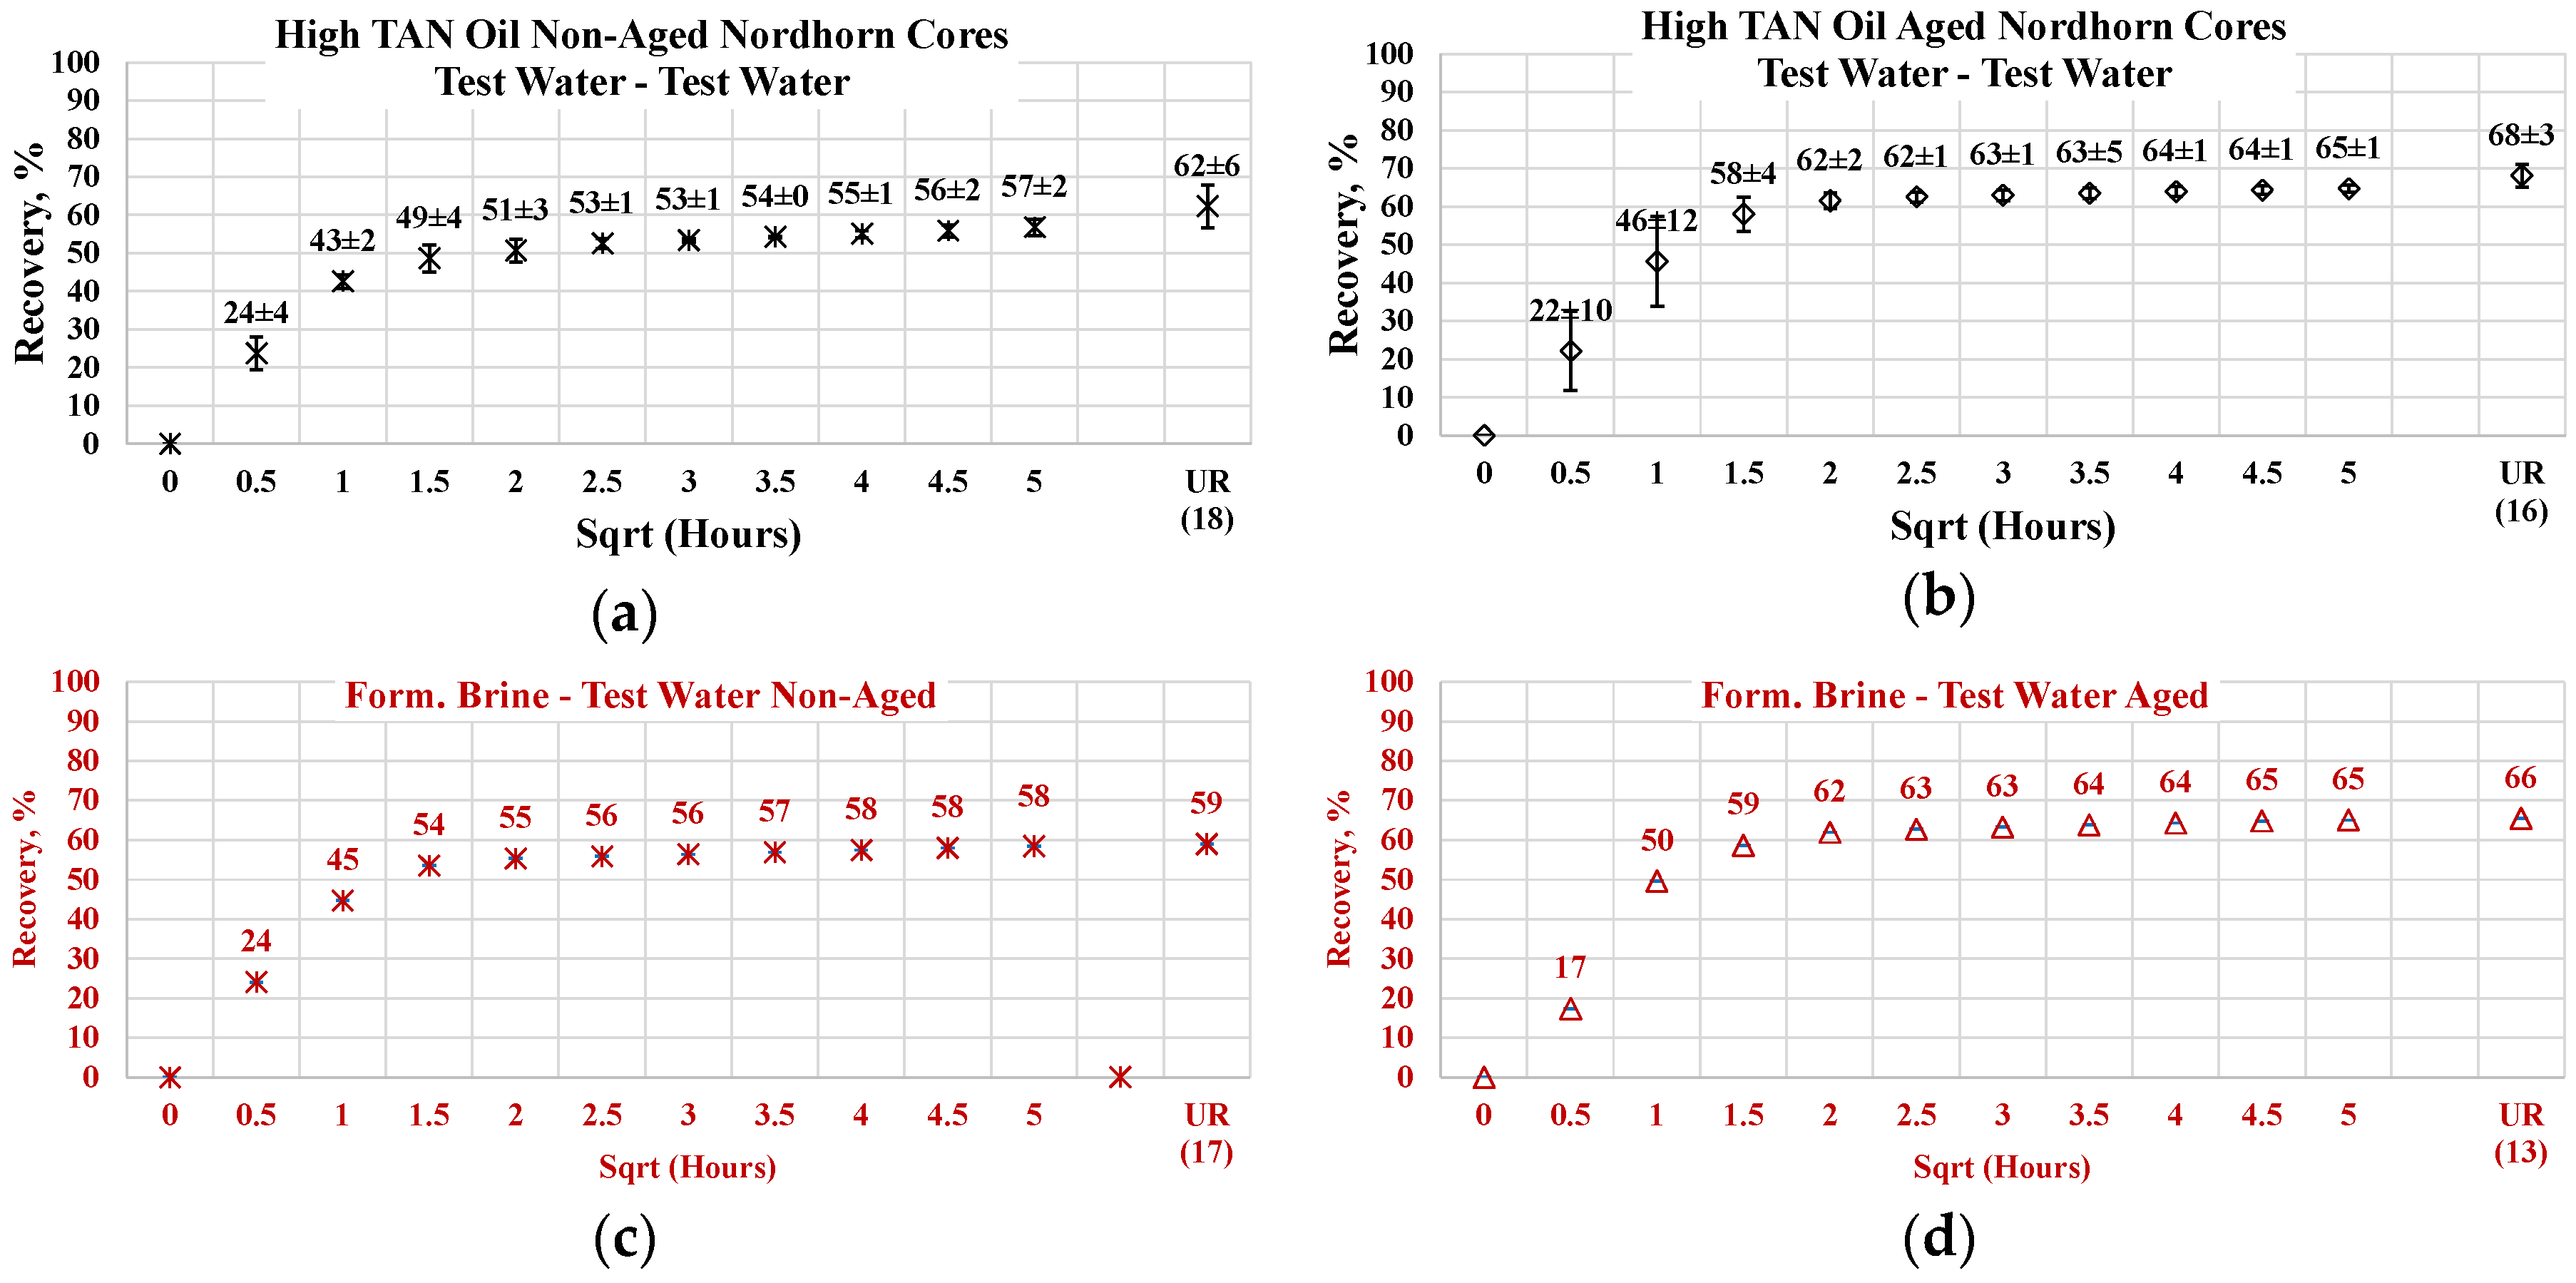
Figure 18.
Percentage of production versus the square root of the time plot for non-aged and aged Nordhorn core plugs saturated with high TAN oil (water composition comparison) at 60 °C (alkali: 7 g/L Na2CO3; polymer: 2000 ppm FLOPAAM 3630S). Data of non-aged cores (a,c,e,g) are presented on the left side whereas aged core data (b,d,f,h) on the right side. Black-colored data refer to test water (saturated core) imbibed by test water, red-colored data refer to formation brine (saturated core) imbibed by test water, green-colored data refer to test water (saturated core) imbibed by alkali-polymer, and blue-colored data refer to formation brine (saturated core) imbibed by alkali-polymer. Ultimate recovery (UR) refers to recovered oil divided bv Soi.
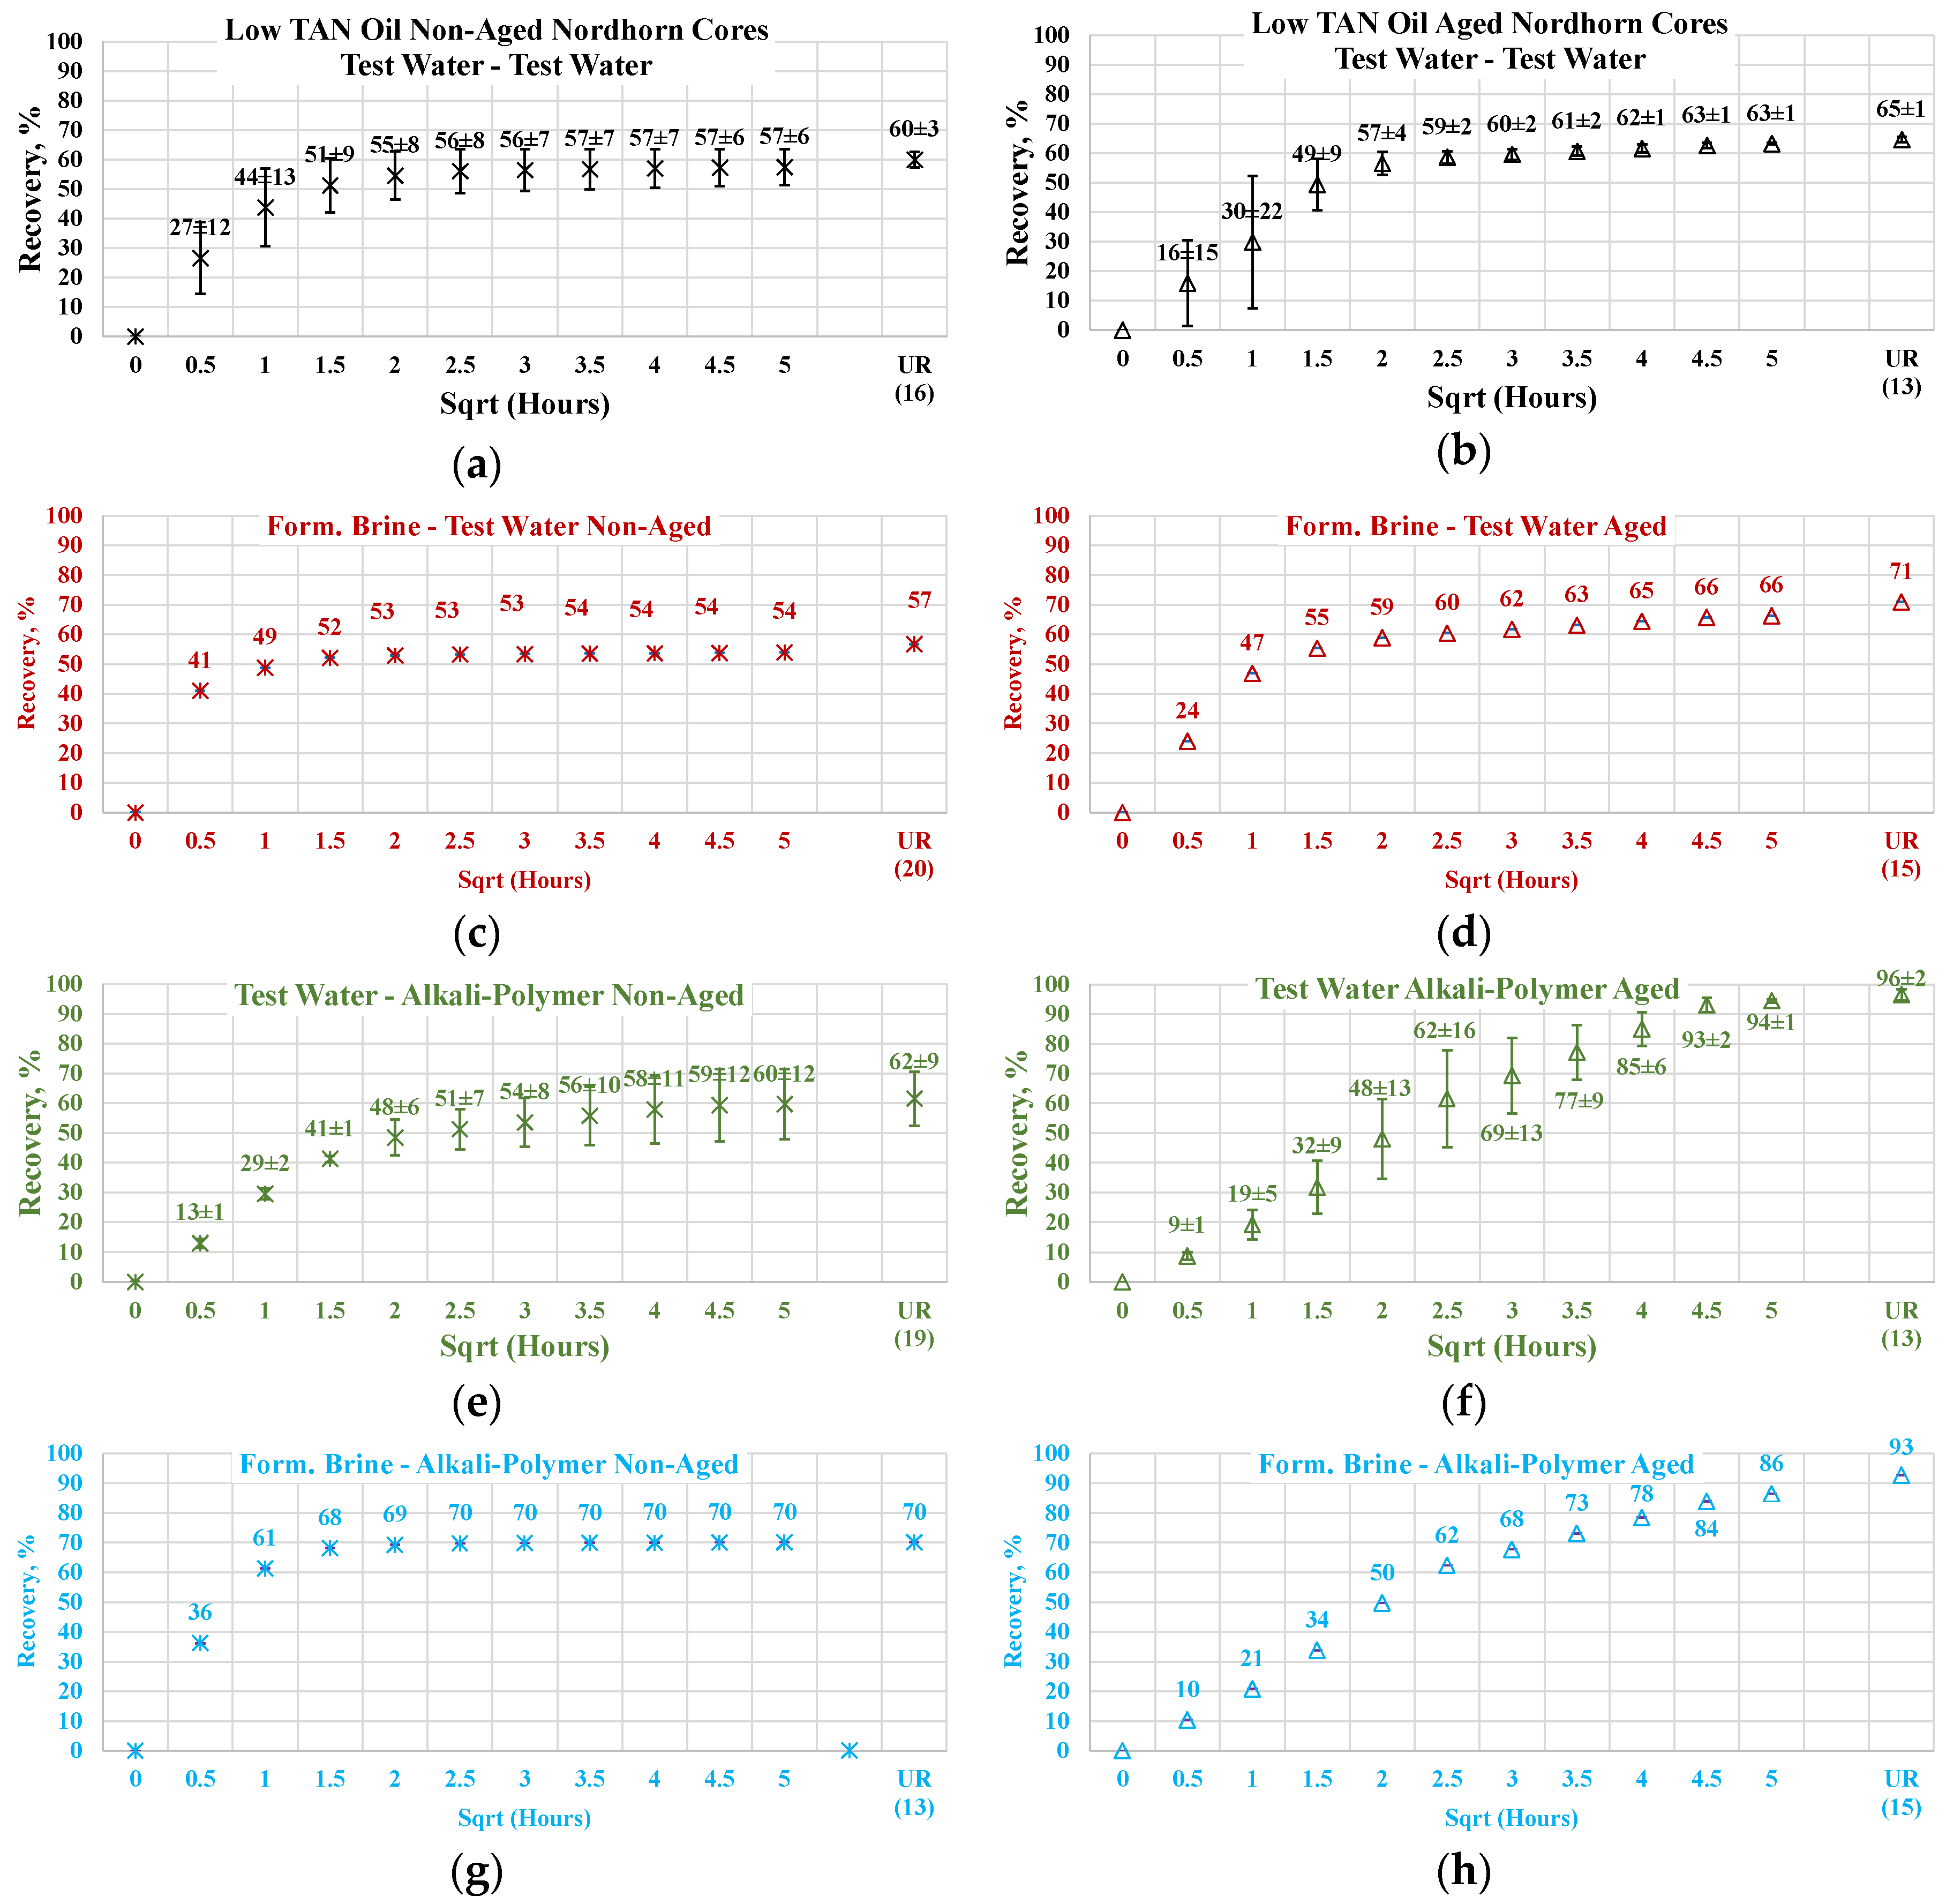
Figure 19.
Percentage of production versus the square root of the time plot for non-aged and aged Nordhorn core plugs saturated with low TAN oil (water composition comparison) at 60 °C (alkali: 7 g/L Na2CO3; polymer: 2000 ppm FLOPAAM 3630S). Data of non-aged cores (a,c,e,g) are presented on the left side whereas aged core data (b,d,f,h) on the right side. Black-colored data refer to test water (saturated core) imbibed by test water; red-colored data refer to formation brine (saturated core) imbibed by test water; green-colored data refer to test water (saturated core) imbibed by alkali-polymer, and blue-colored data refer to formation brine (saturated core) imbibed by alkali-polymer. Ultimate recovery (UR) refers to recovered oil divided bv Soi.
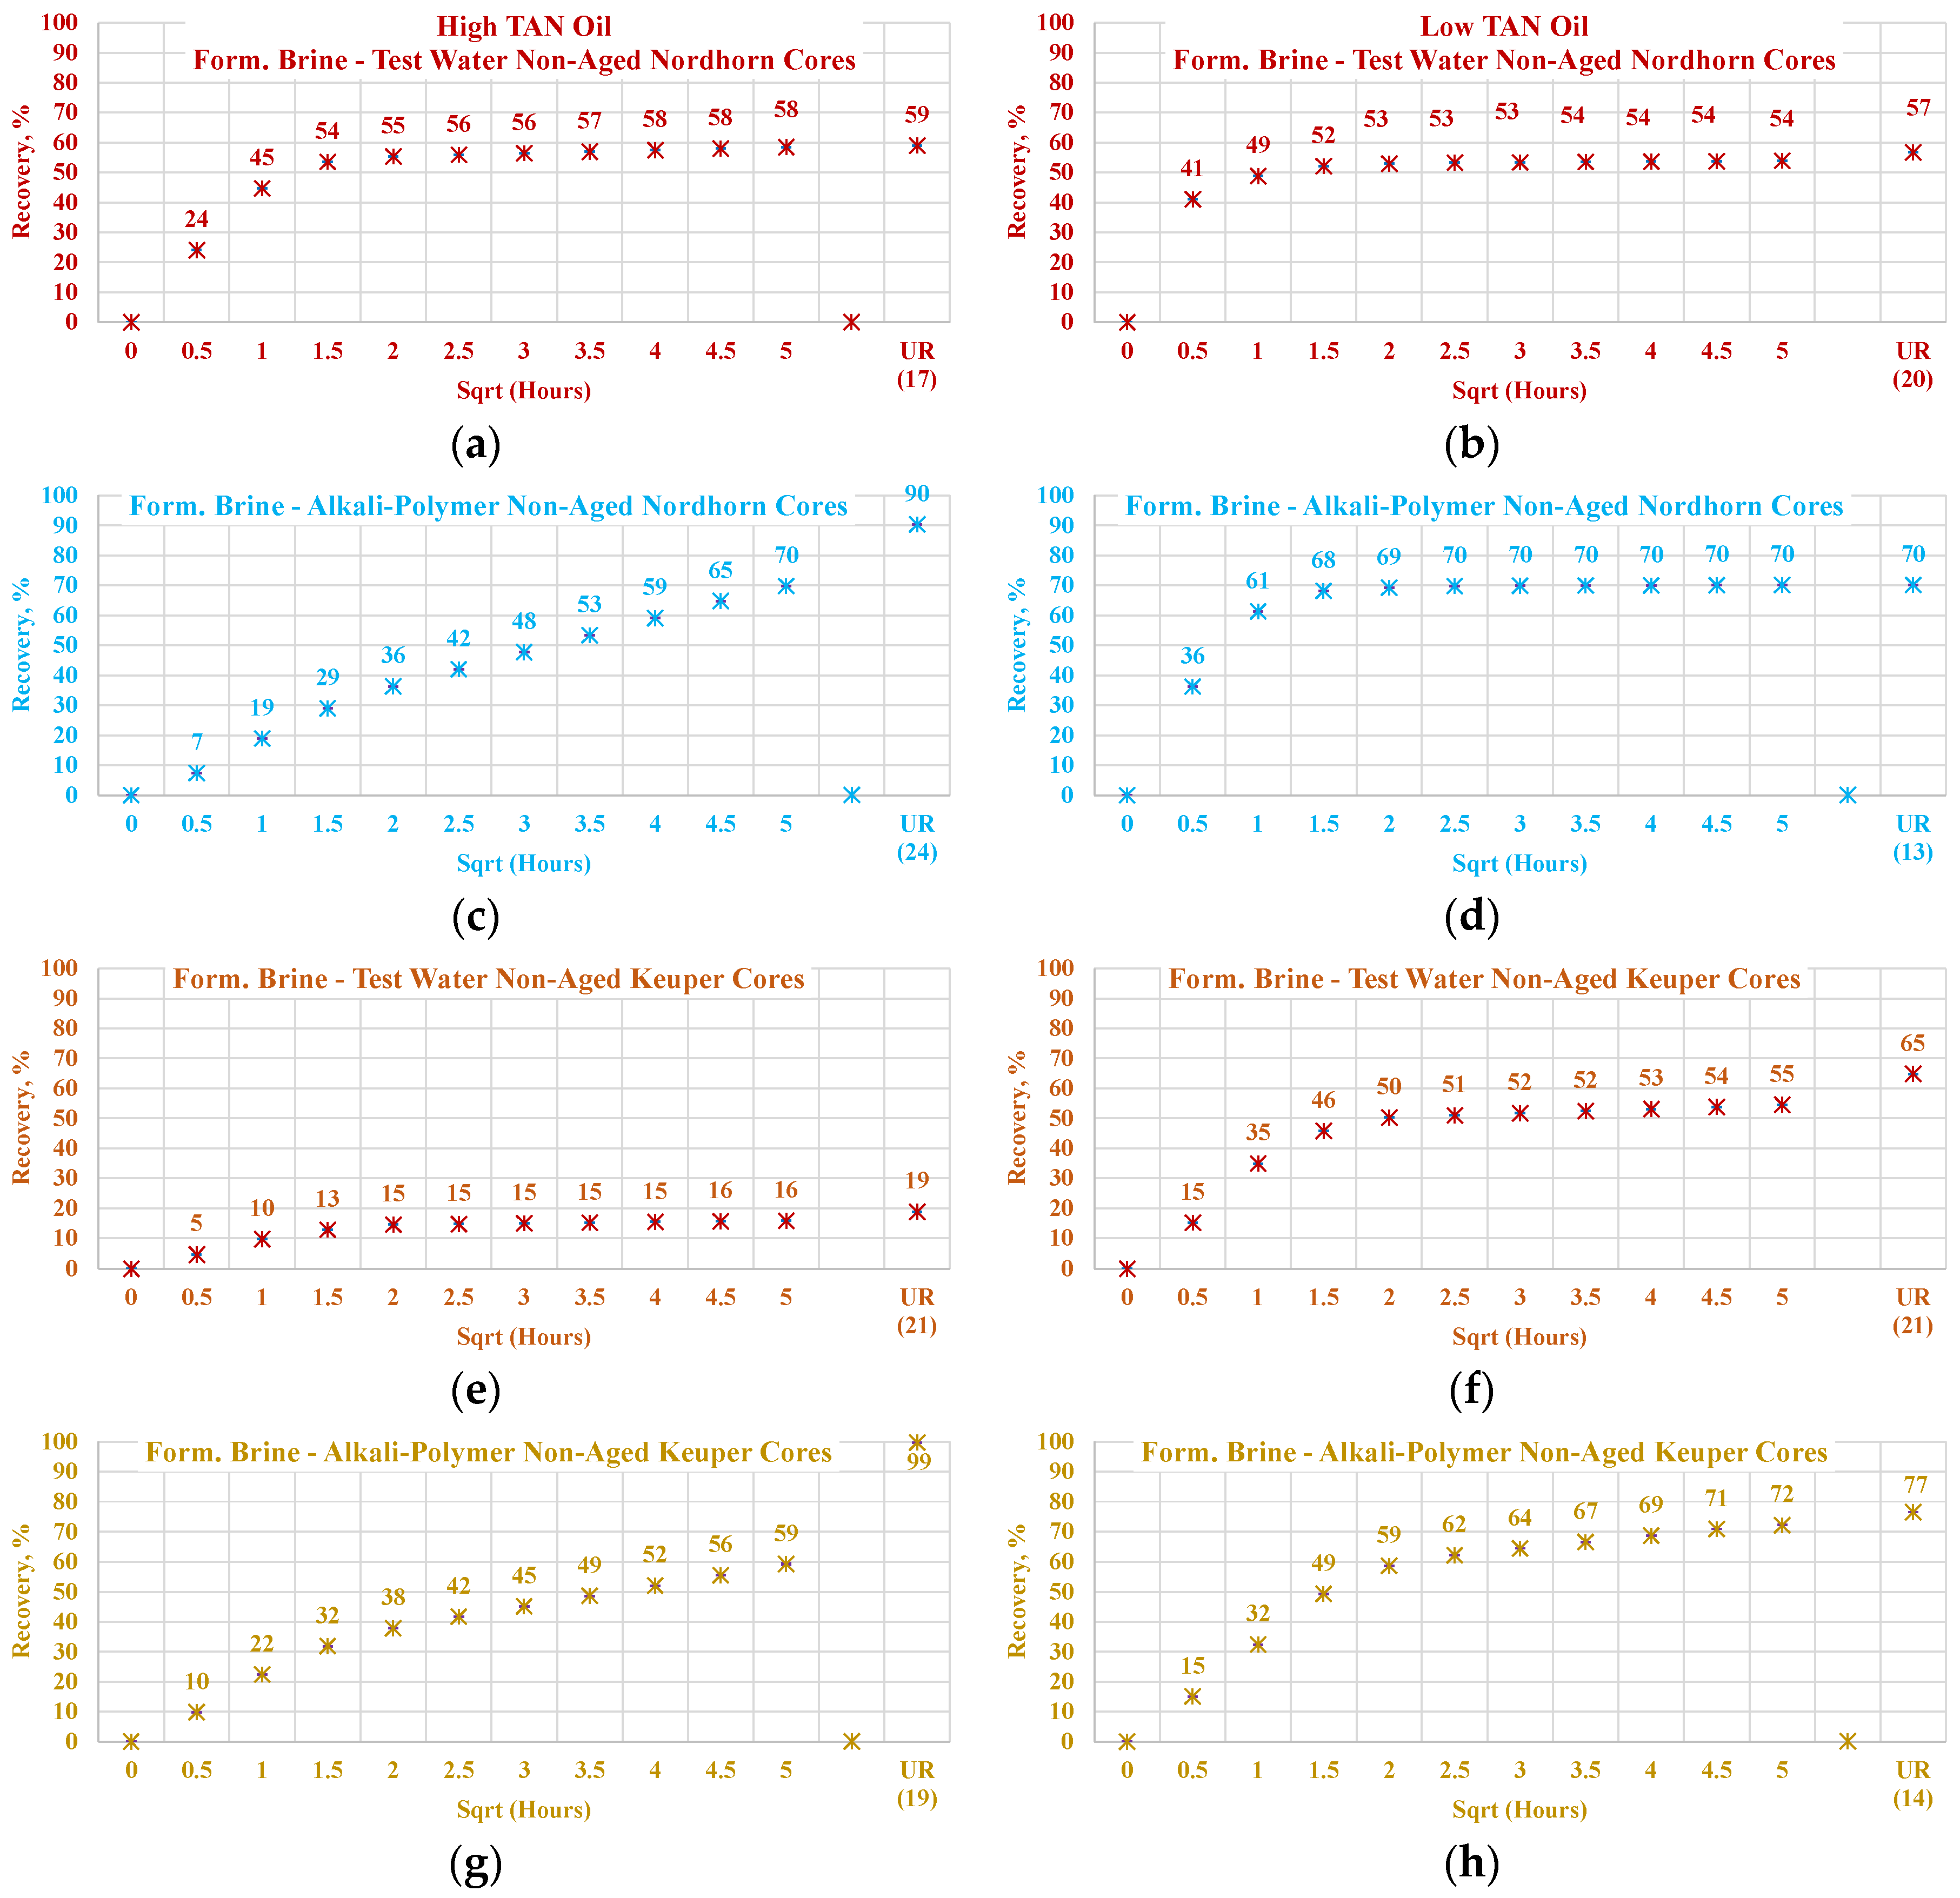
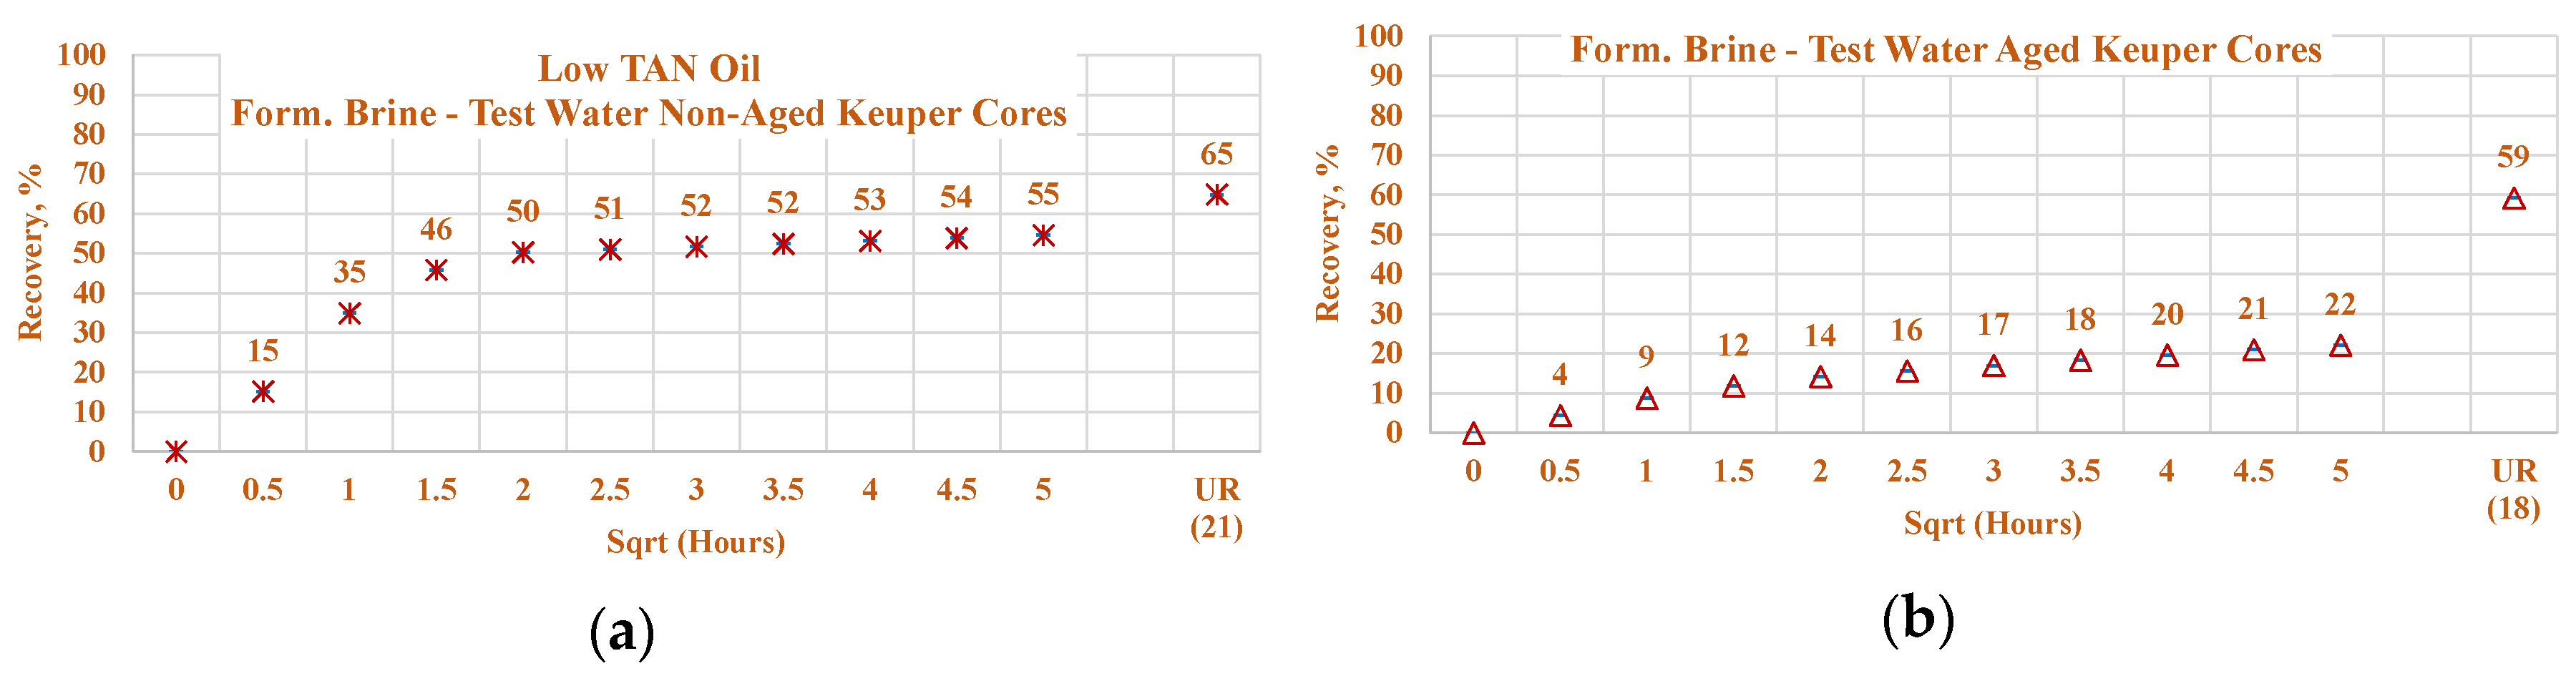
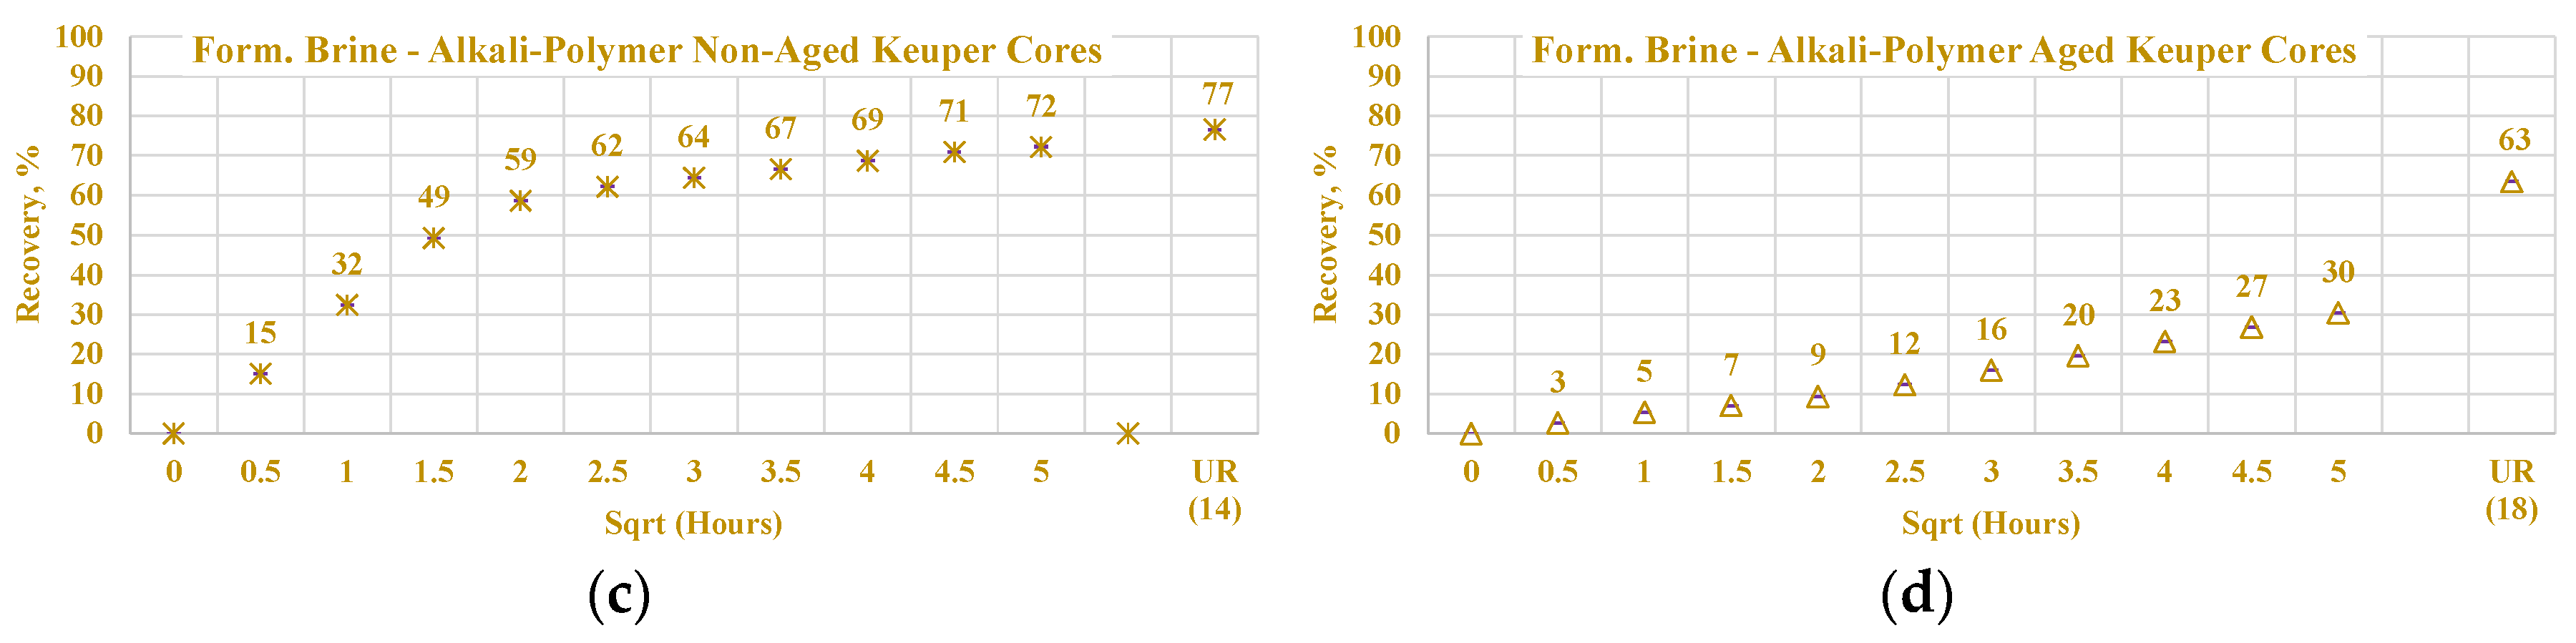
Figure 20.
Percent of production versus square root of time plot for non-aged Nordhorn and Keuper core plugs for high TAN oil (a) and low TAN oil (b) at 60 °C (alkali: 7 g/L Na2CO3; polymer: 2000 ppm FLOPAAM 3630S). High TAN oil data (a,c,e,g) are presented on the left side whereas low TAN oil data (b,d,f,h) on the right side. Nordhorn cases are presented from (a) to (d), whereas Keuper cases are presented from (e) to (h). Red-colored data refer to formation brine (saturated core) imbibed by test water; blue-colored data refer to formation brine (saturated core) imbibed by alkali-polymer; orange-colored data refer to formation brine (saturated core) imbibed by test water, and mustard-colored data refer to formation brine (saturated core) imbibed by alkali–polymer. Ultimate recovery (UR) refers to recovered oil divided bv Soi.
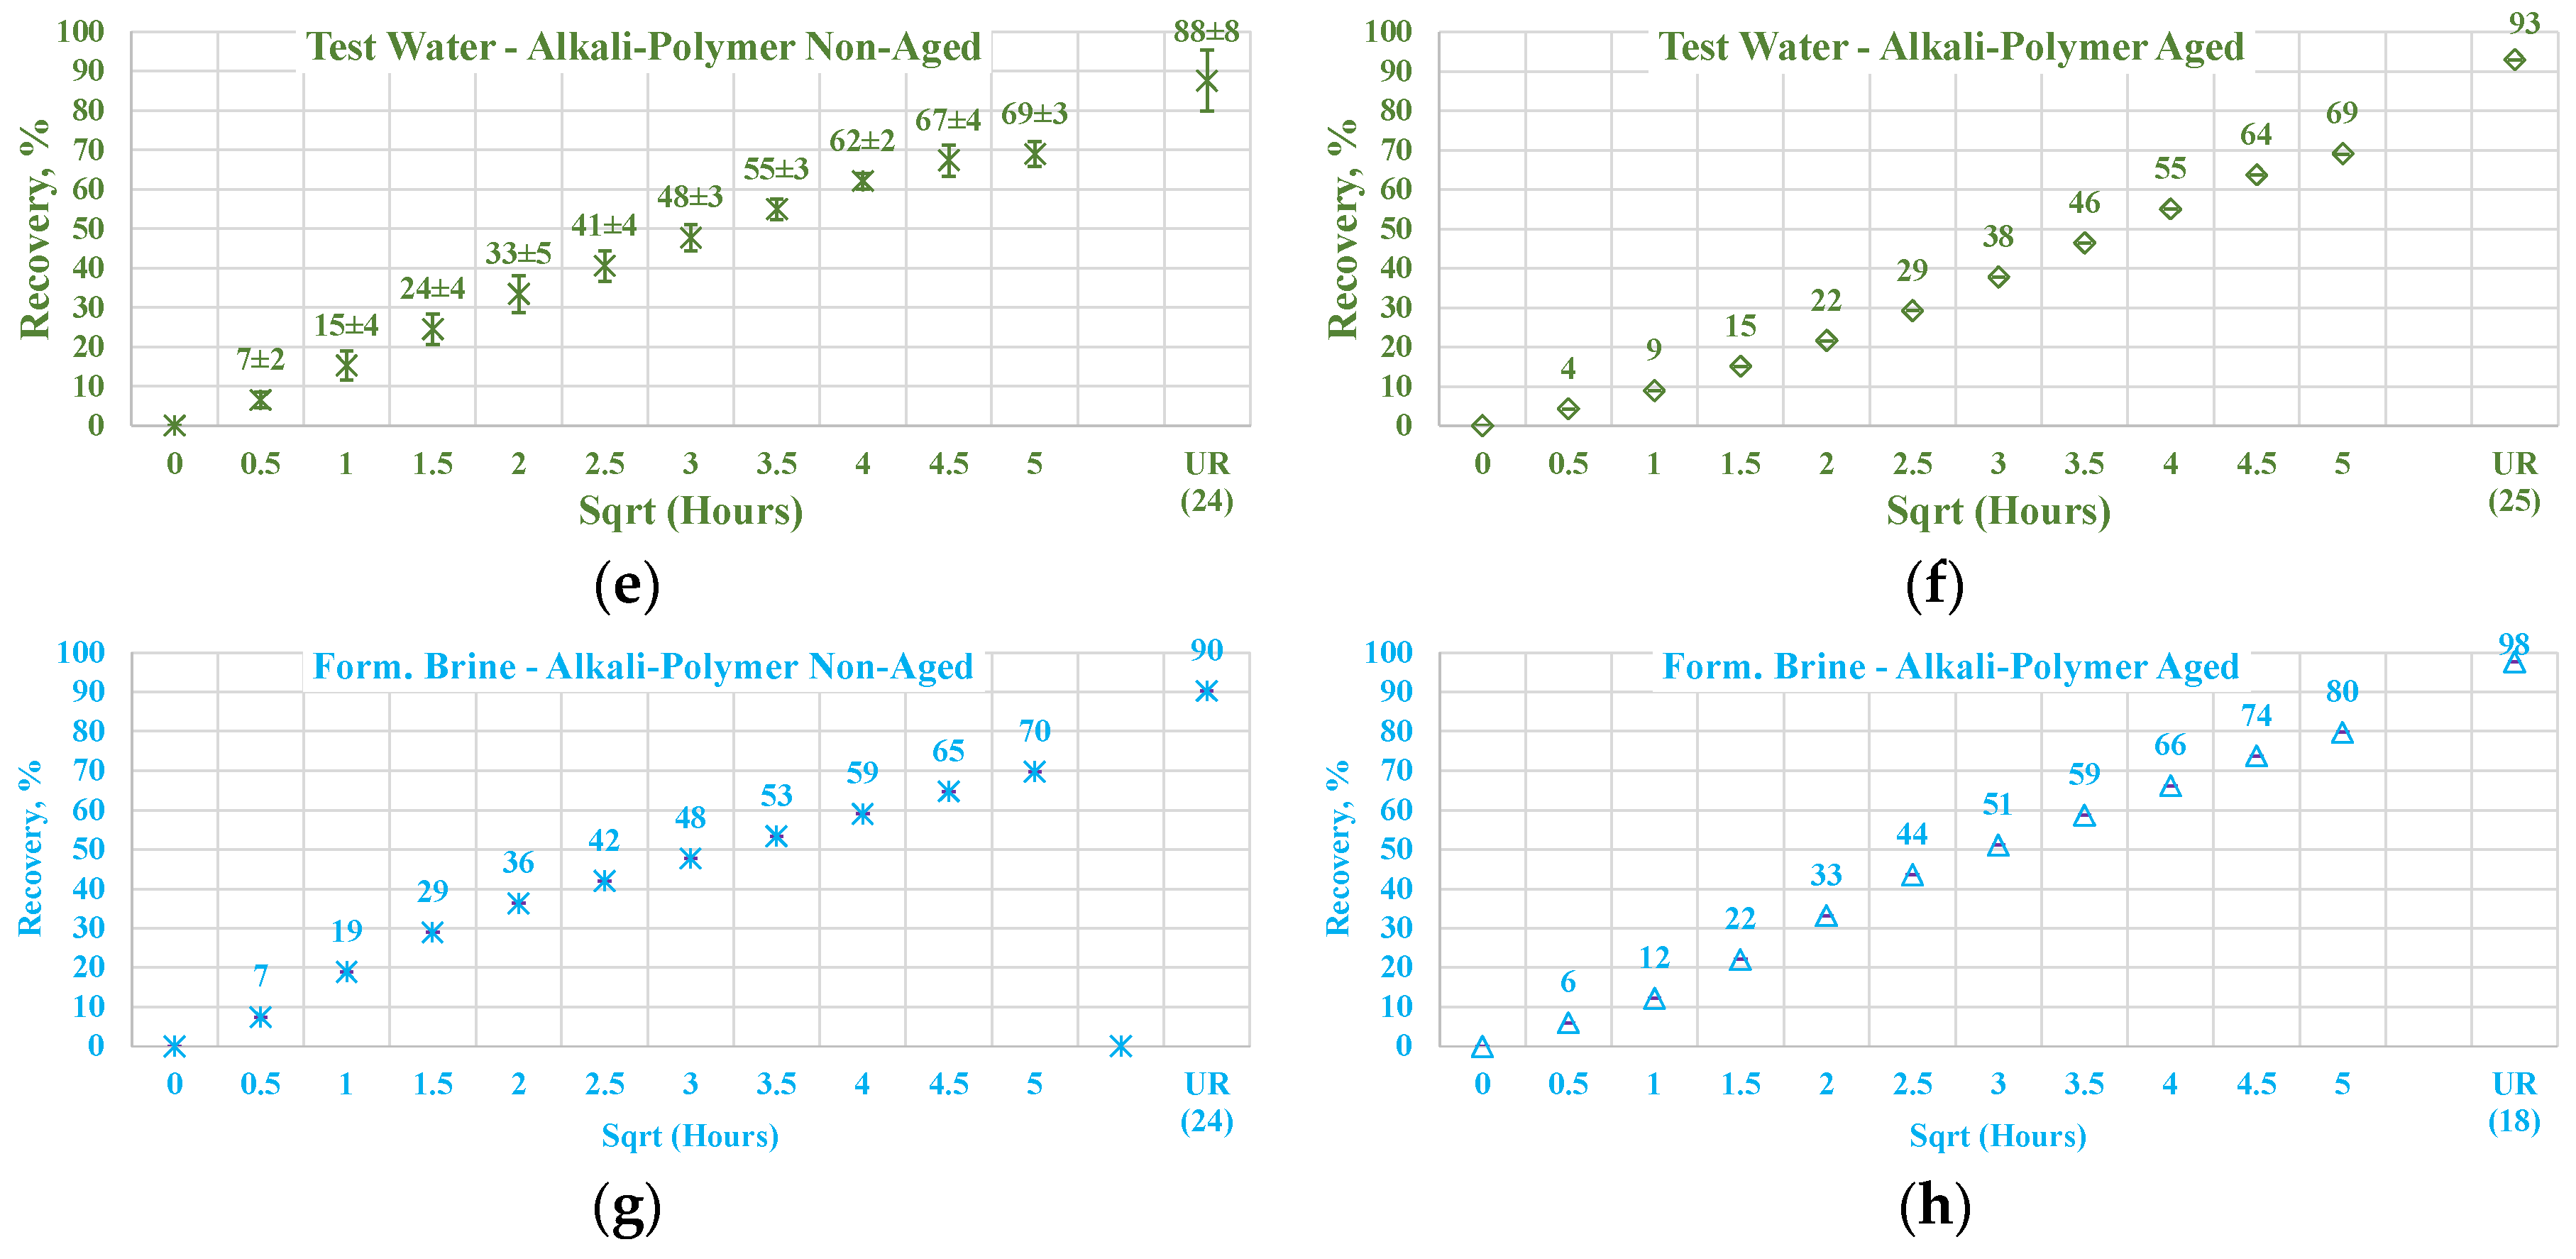
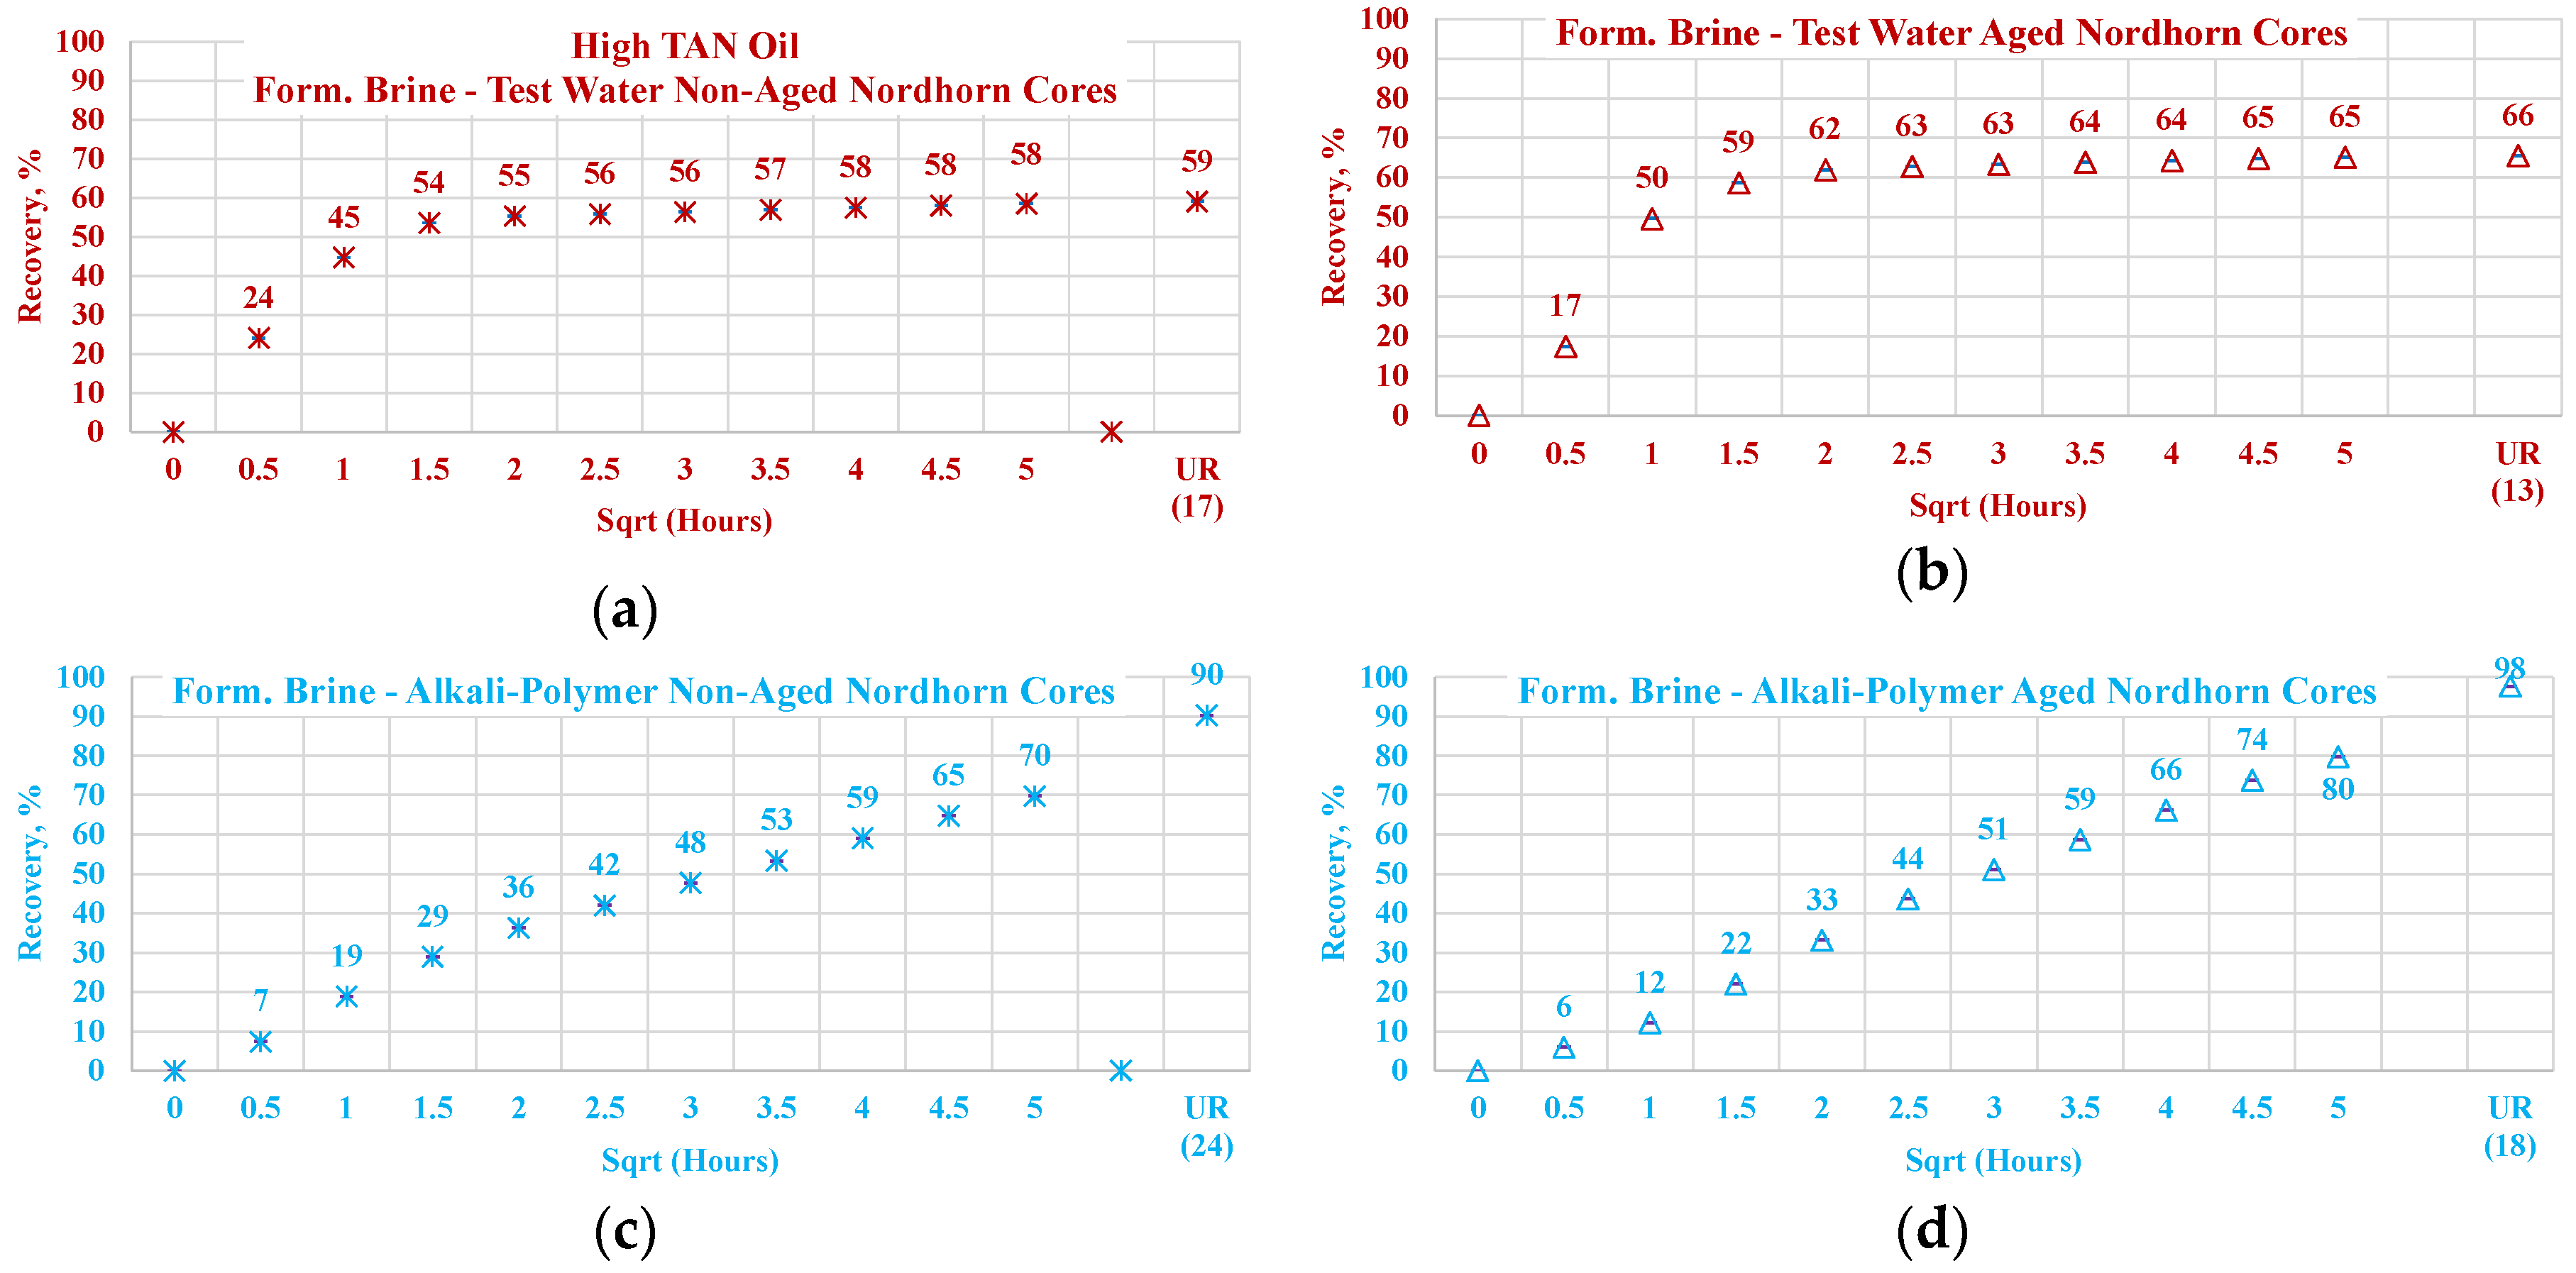
Figure 21.
Percentage of production versus the square root of the time plot for Nordhorn core plugs (non-aged and aged), saturated with high TAN oil at 60 °C. Alkali: 7 g/L Na2CO3, Polymer: 2000 ppm FLOPAAM 3630Ss. Data of non-aged cores data (a and c) are presented on the left side, whereas aged cores data (b and d) on the right side. Red-colored data refer to formation brine (saturated core) imbibed by test water; blue-colored data refer to formation brine (saturated core) imbibed by alkali–polymer. Ultimate recovery (UR) refers to recovered oil divided bv Soi.
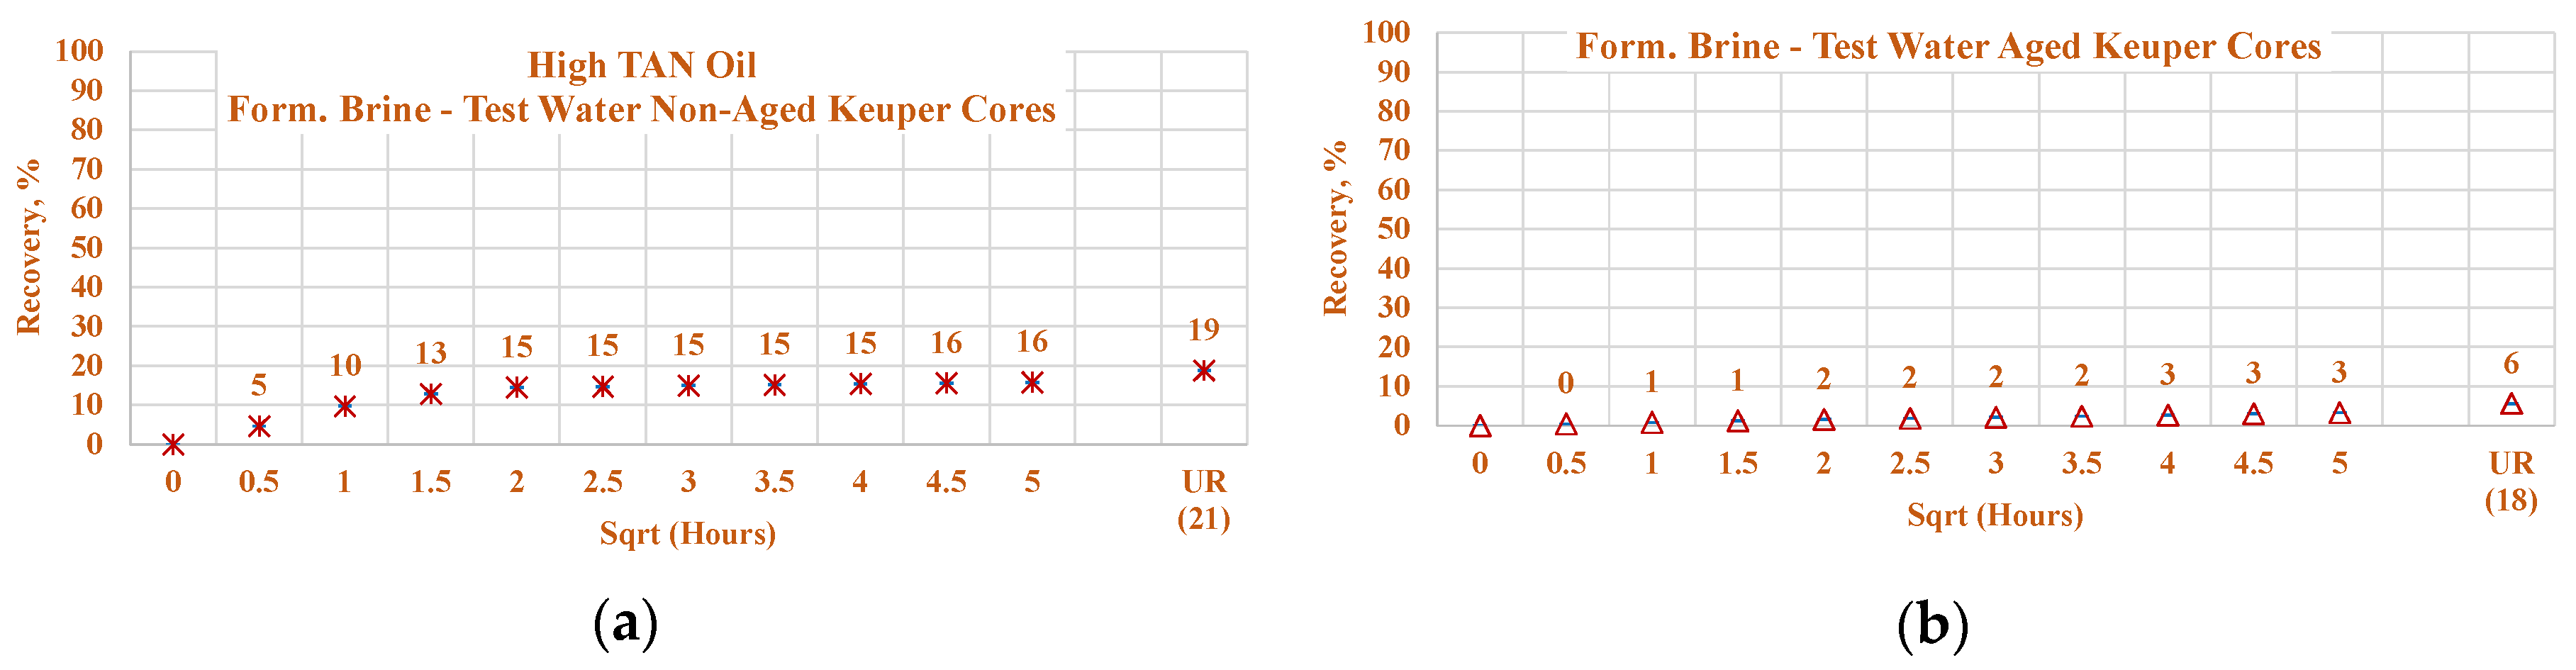
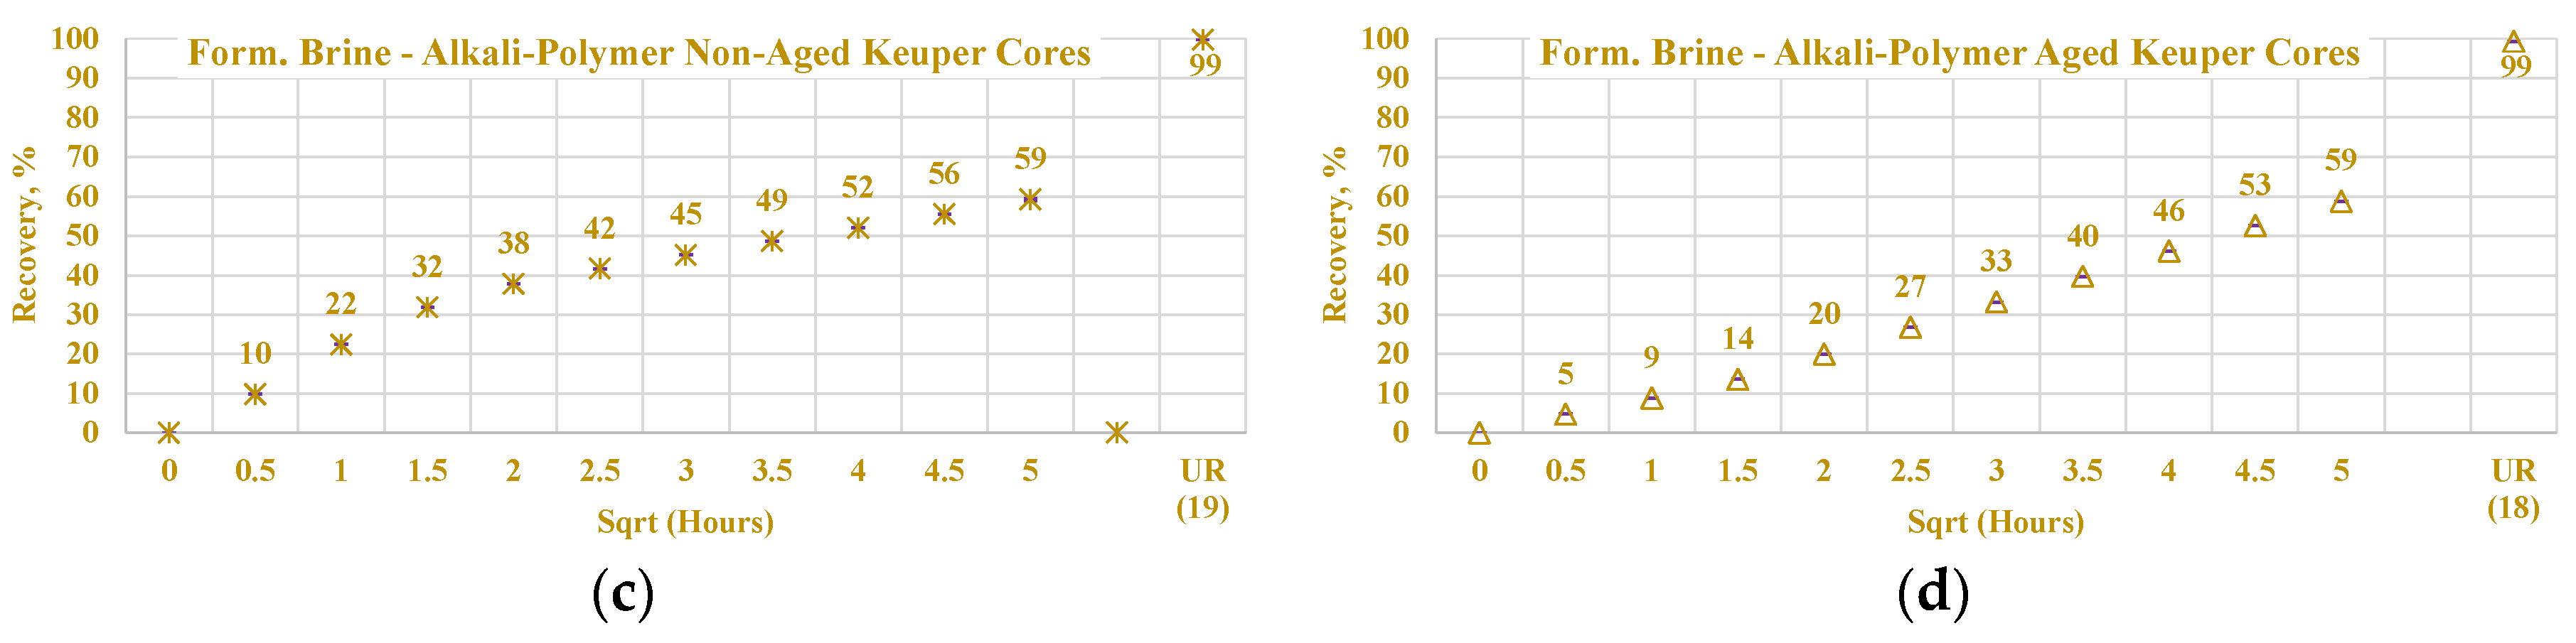
Figure 22.
Percentage of production versus the square root of the time plot for Keuper core plugs (non-aged and aged), saturated with high TAN oil at 60 °C. Alkali: 7 g/L Na2CO3, Polymer: 2000 ppm FLOPAAM 3630Ss. Data of non-aged cores data (a and c) are presented on the left side, whereas aged cores data (b and d) on the right side. The orange-colored data refer to formation brine (saturated core) imbibed by test water and the mustard-colored data refer to formation brine (saturated core) imbibed by alkali–polymer. Ultimate recovery (UR) refers to recovered oil divided bv Soi.
Figure 23.
Percentage of production versus the square root of the time plot for Nordhorn core plugs (non-aged and aged), saturated with low TAN oil at 60 °C. Alkali: 7 g/L Na2CO3, Polymer: 2000 ppm FLOPAAM 3630Ss. Data of non-aged cores data (a and c) are presented on the left side, whereas aged cores data (b and d) on the right side. Red-colored data refer to formation brine (saturated core) imbibed by test water; blue-colored data refer to formation brine (saturated core) imbibed by alkali–polymer. Ultimate recovery (UR) refers to recovered oil divided bv Soi.
Figure 24.
Percentage of production versus the square root of the time plot for Keuper core plugs (non-aged and aged), saturated with low TAN oil at 60 °C. Alkali: 7 g/L Na2CO3, Polymer: 2000 ppm FLOPAAM 3630Ss. Data of non-aged cores data (a and c) are presented on the left side, whereas aged cores data (b and d) on the right side. The orange-colored data refer to formation brine (saturated core) imbibed by test water and the mustard-colored data refer to formation brine (saturated core) imbibed by alkali-polymer. Ultimate recovery (UR) refers to recovered oil divided bv Soi.
Table 1.
Overview of selected AP flooding evaluations reported in the literature.
Table 1.
Overview of selected AP flooding evaluations reported in the literature.
| No. | Chemicals | Experimental Approach | Recovery Mechanisms | Insightful Outcome | Reference |
|---|
| 1 | A/P/AP | Channeled sandpack flooding | Improved mobility ratio | Plugging and diverted flow | Wu et al. [8] |
| 2 | A/AP/ASP | Microfluidics chip | Viscosity of displacing fluid + pore-scale morphology | At same capillary number + mobility number | Alzahir et al. [9] |
| 3 | ASP | Daqing oilfield tests | Ultra-low interfacial tension (IFT) under oil-wet state | Weak alkali in ASP worked better than strong alkali in ASP | Sun et al. [10] |
| 4 | AP | Book chapter with field applications | Improved sweep efficiency + in situ soap generation | Low adsorption + better injectivity | Sheng.J. [11] |
| 5 | AP | Field projects + laboratory + simulation Summary | Polymer mobility control + soap improved displacement efficiency | Mixed outcomes from field tests | Sheng, J. [12] |
| 6 | AP | IFT study for Fang oilfield test | Lower IFT + improved mobility ratio | Effect of pressure, temperature, and salinity on IFT | Maneeintr et al. [13] |
| 7 | ACP | Sandpack slap flooding + simulation | Slug viscosity + ultra-low IFT | Optimum initiation time in heavy oil | Aitkulov et al. [14] |
| 8 | AP + Nanoparticles | Unsteady state displacement experiments | In situ soap generation, pressure increment | Higher oil relative permeability values | Mortazavi et al. [15] |
| 9 | ACP/AP | Micromodels, core flood | Improved sweep efficiency + in situ soap generation | Low adsorption, better sweep efficiency and cost efficiency | Schumi et al. [16] |
Table 2.
Brine properties and composition used for the evaluations included in this work. Note that test water is the same formation of brine but softened to only NaCl, including a buffer for pH control of NaHCO3.
Table 2.
Brine properties and composition used for the evaluations included in this work. Note that test water is the same formation of brine but softened to only NaCl, including a buffer for pH control of NaHCO3.
| Parameter | Units | Test Water | Formation Brine |
|---|
| Mean | SD * | Mean | SD * |
|---|
| Density, 25 °C | Kg/m3 | 1011.700 | 0.000 | 1012.000 | 0.000 |
| Density, 60 °C | 997.100 | 0.100 | 1012.000 | 0.000 |
| Shear Viscosity, 25 °C | mPa∙s | 0.964 | 0.032 | 0.954 | 0.030 |
| Shear Viscosity, 60 °C | 0.571 | 0.023 | 0.592 | 0.054 |
| Components | Units | Formation Brine | Test Water |
| NaCl | g/L | 19.750 | 18.960 |
| NaHCO3 | g/L | - | 1.850 |
| CaCl2·2H2O | g/L | 0.400 | - |
| MgCl2·6H2O | g/L | 0.660 | - |
| NH4Cl | g/L | 0.170 | - |
| SrCl2·6H2O | g/L | 0.060 | - |
| BaCl2·2H2O | g/L | 0.030 | - |
Table 3.
Properties of the oils used in this work.
Table 3.
Properties of the oils used in this work.
| Parameter | Units | 16 TH | St. Ulrich |
|---|
| Mean | SD * | Mean | SD * |
|---|
| Density, 25 °C | Kg/m3 | 907.30 | 0.10 | 866.60 | 0.20 |
| Density, 60 °C | 884.30 | 0.20 | 842.60 | 0.60 |
| Shear Viscosity, 60 °C | mPa∙s | 11.90 | 0.10 | 6.00 | 0.10 |
| TAN (total acid number) | mg KOH/g | 1.61 | 0.18 | 0.17 | 0.08 |
Table 4.
Properties of the chemical solutions used in this work.
Table 4.
Properties of the chemical solutions used in this work.
| Parameter | Units | Alkali | Polymer | AP Solution |
|---|
| Mean | SD * | Mean | SD * | Mean | SD * |
|---|
| Density, 25 °C | Kg/cm3 | 1020.00 | 0.000 | 1013.00 | 0.00 | 1018.70 | 0.100 |
| Density, 60 °C | 1005.20 | 0.10 | 998.50 | 0.00 | 1004.20 | 0.000 |
| Viscosity @7,94 s−1, 25 °C | mPa∙s | 0.99 | 0.02 | 27.78 | 0.002 | 25.910 | 0.001 |
| Viscosity @7,94 s−1, 60 °C | 0.55 | 0.02 | 19.54 | 0.002 | 18.050 | 0.002 |
| deviation | | | | | | | |
Table 5.
Overall core and saturation data for the outcrop samples used in this work.
Table 5.
Overall core and saturation data for the outcrop samples used in this work.
| Parameter | Units | Nordhorn | Keuper |
|---|
| Mean | SD | Mean | SD |
|---|
| Length | cm | 8.010 | 0.110 | 8.120 | 0.090 |
| Diameter | 2.960 | 0.010 | 2.980 | 0.010 |
| Bulk volume | cm3 | 54.420 | 0.870 | 55.760 | 0.730 |
| Pore volume | 13.070 | 0.260 | 12.750 | 0.220 |
| Grain volume | kg/m3 | 41.360 | 0.700 | 42.980 | 0.670 |
| Porosity | % | 23.960 | 0.350 | 22.790 | 0.340 |
| N2 permeability | mD | 2313.000 | 162.000 | 1327.000 | 186.000 |
| Water (test water) permeability | 1500.000 | 190.000 | 902.000 | 198.000 |
| Irreducible water saturation | % | 25.600 | 4.000 | 32.500 | 4.400 |
| Oil permeability | mD | 314.000 | 79.000 | 178.000 | 51.000 |
| End-point oil relative permeability | - | 0.210 | 0.060 | 0.200 | 0.070 |
| Initial oil saturation | % | 74.400 | 4.000 | 67.500 | 4.400 |
Table 6.
Contact angle results before aging the core plugs under various aqueous/oil conditions.
Table 6.
Contact angle results before aging the core plugs under various aqueous/oil conditions.
| Core | Time (Min) | Contact Angle—16 TH | Contact Angle—St. Ulrich |
|---|
| TW * | Alkali | Alkali–Polymer | TW * | Alkali | Alkali–Polymer |
|---|
| Nordhorn | 0 | 60.0 | 57.8 | 43.7 | 62.7 | 38.1 | 61.8 |
| 300 | 58.7 | 57.2 | 57.8 | 60.7 | 42.7 | 59.8 |
| Keuper | 0 | 49.1 | 53.3 | 60.7 | 45.2 | 51.9 | 34.6 |
| 300 | 50.4 | 54.2 | 56.1 | 50.0 | 47.8 | 55.9 |


