3.1. Phase Morphologies
The microscopic characterization shows the raster of the 3D-printed structures. Through an analysis of
Figure 3 and
Figure 4, the direction of the filament and the quality of the structures were verified, respectively.
The build direction was essential for both the edge (
Figure 3a) and flat (
Figure 3b) printing direction because the lateral walls of the specimens were composed of horizontal parallel fused beads, which are perpendicular to the compression force. For the upright-printing-direction specimens (
Figure 3c), the lateral walls had vertical parallel fused beads that are parallel to the applied force. Therefore, the printed part exhibited anisotropy, and its mechanical properties depended on the orientation of the filament, which accorded with the application of the layers one onto another in the Z axis. When the layers are parallel to the compression force, the sample exhibits high flexural strength; however, the sample showed weakness in the walls for layers that were perpendicular to the applied force. In the case of the upright printing direction, the horizontal walls were formed by crossed lines (
Figure 4).
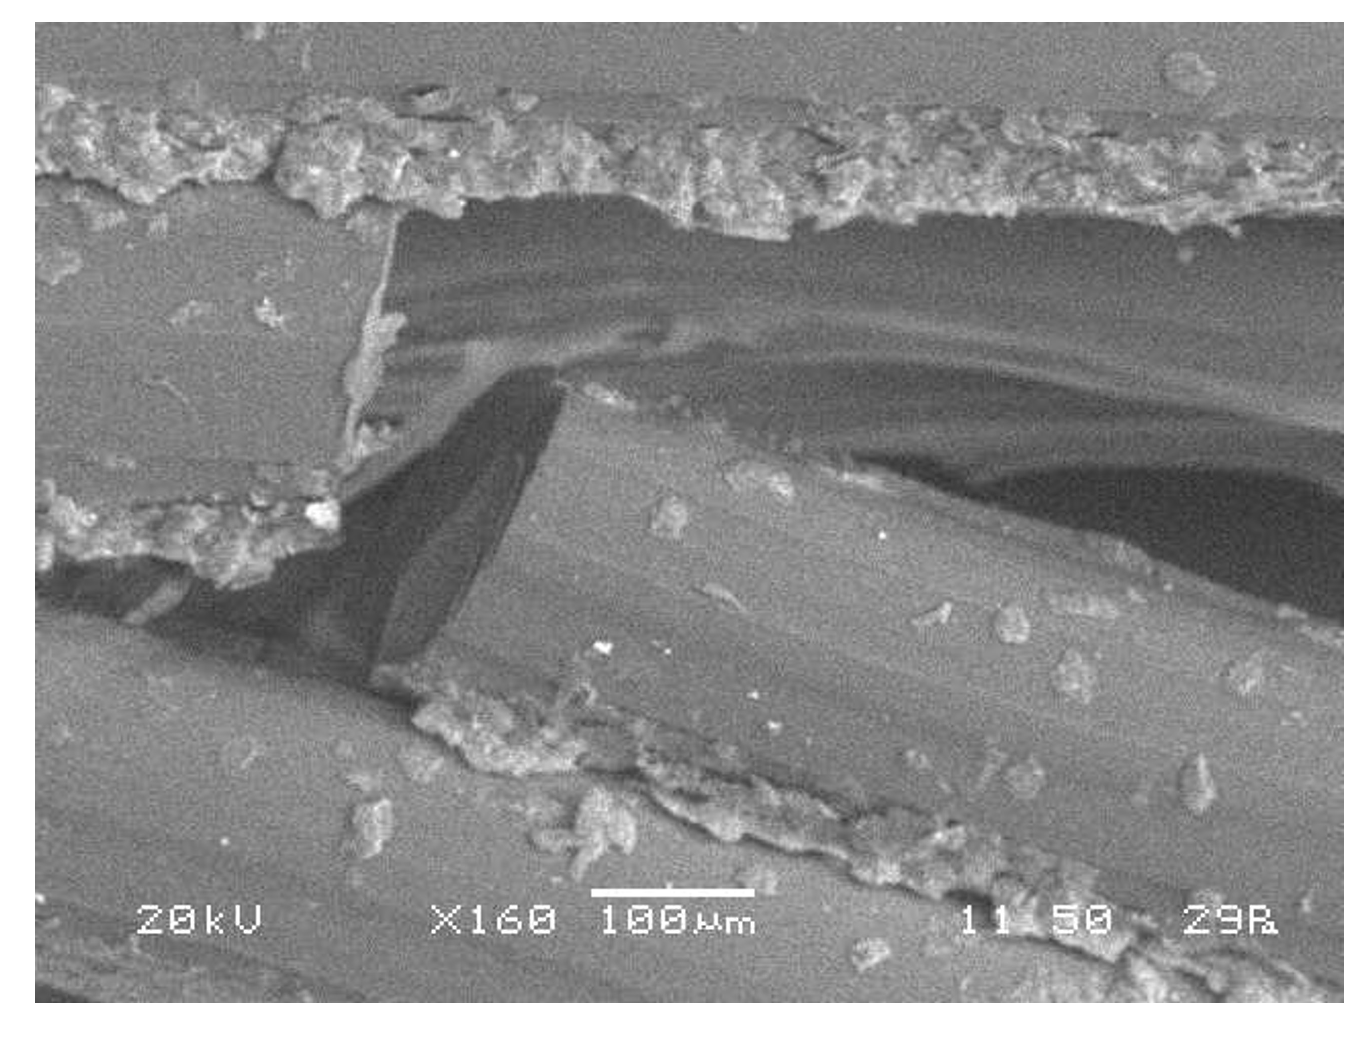
The smaller the infill density of the structure, the smaller the relative density and the smaller the amount of material used to manufacture it. Moreover, the welding of the filament is affected by air gaps. An air gap is defined as the space between the road of the filaments; the air gap is zero if the filaments are in perfect contact; it is positive if the pathways of the filaments do not touch each other (
Figure 4a,d,g); a negative air gap means the filaments are overlapping (
Figure 4c,f,i) [
37].
Figure 4 shows that the value of the air gaps depended on the infill density of the sample. With an increase in the infill density, the air gap became negative, and there was better welding between adjacent filaments; i.e., specimens with 100% infill density had negative air gaps, which decreased the possibility of brittle fracture or delamination.
3.2. Axial Crushing Behavior
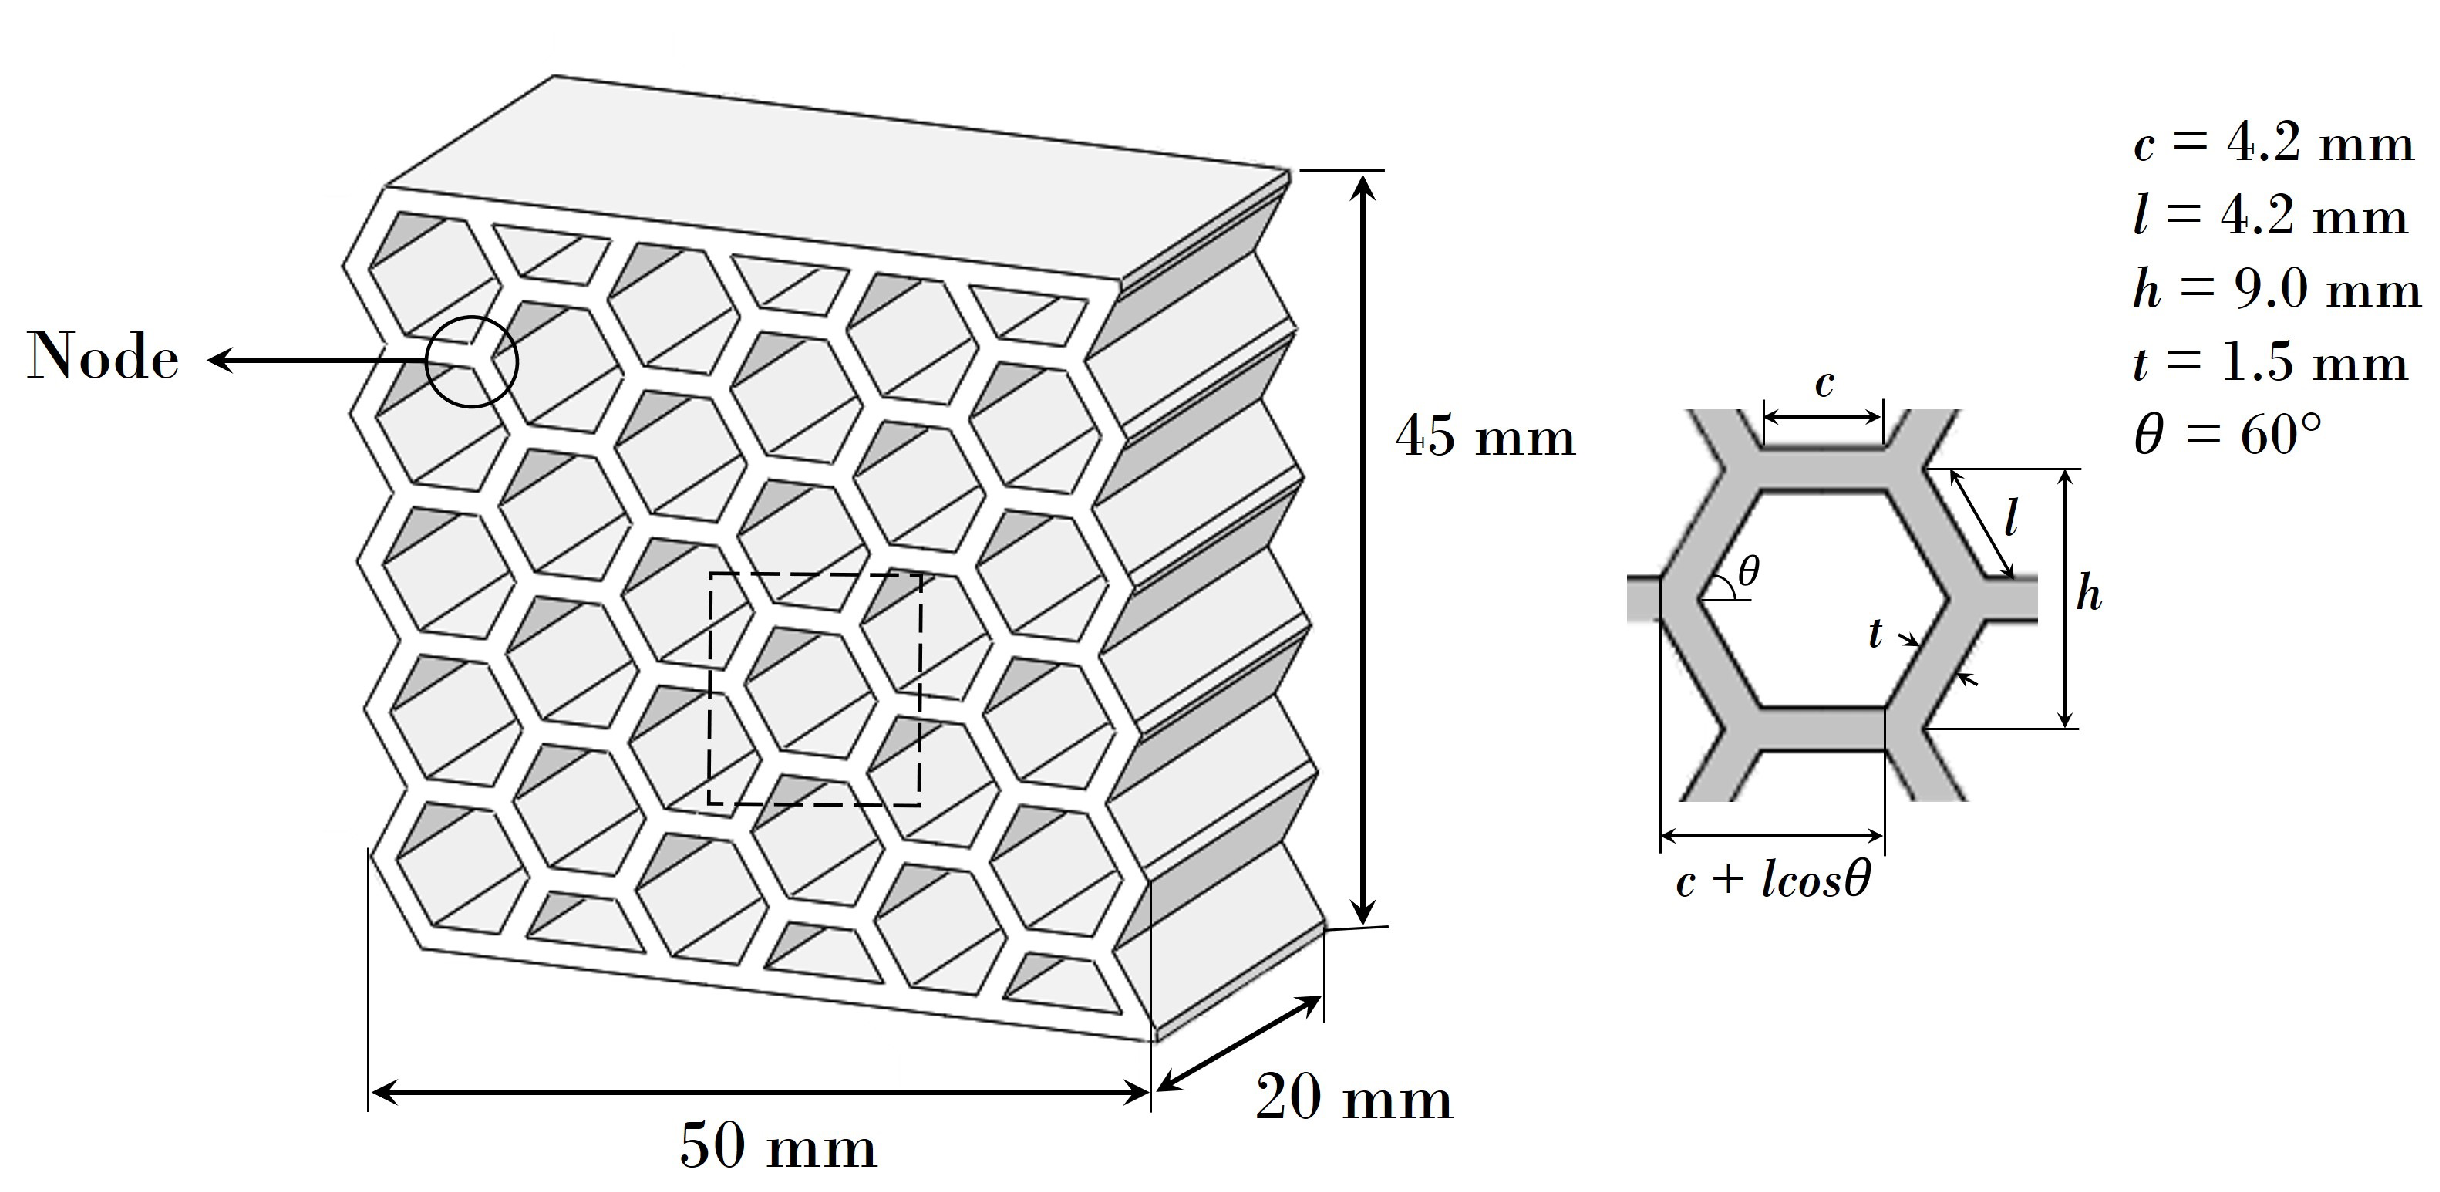
The response of the hexagonal honeycomb was analyzed quasi-statically via compression essays along the transverse direction from the XY plane to determine the effects of the selected mechanical properties on the performance of the structure.
The following figures (
Figure 5,
Figure 6,
Figure 7 and
Figure 8) show the behavior of the PET-G honeycomb structures during the compression tests. The figures depict the sequence of deformed configuration and the recorded load–displacement response from the three samples of each specimen. The tests ended automatically by the machine after detecting a break with a high rate of load fall or ended by the user after the densification region was reached. Previous studies show two types of fractures: ductile and brittle. The main characterization of ductile fracture is the presence of large plastic deformations that occur before and/or during the fracture process; in brittle fracture, there is a small amount of inelastic deformation [
42]. In engineering applications, ductile fracture is less damaging because it occurs over a period of time, whereas brittle fracture is fast, unpredictable, and often catastrophic.
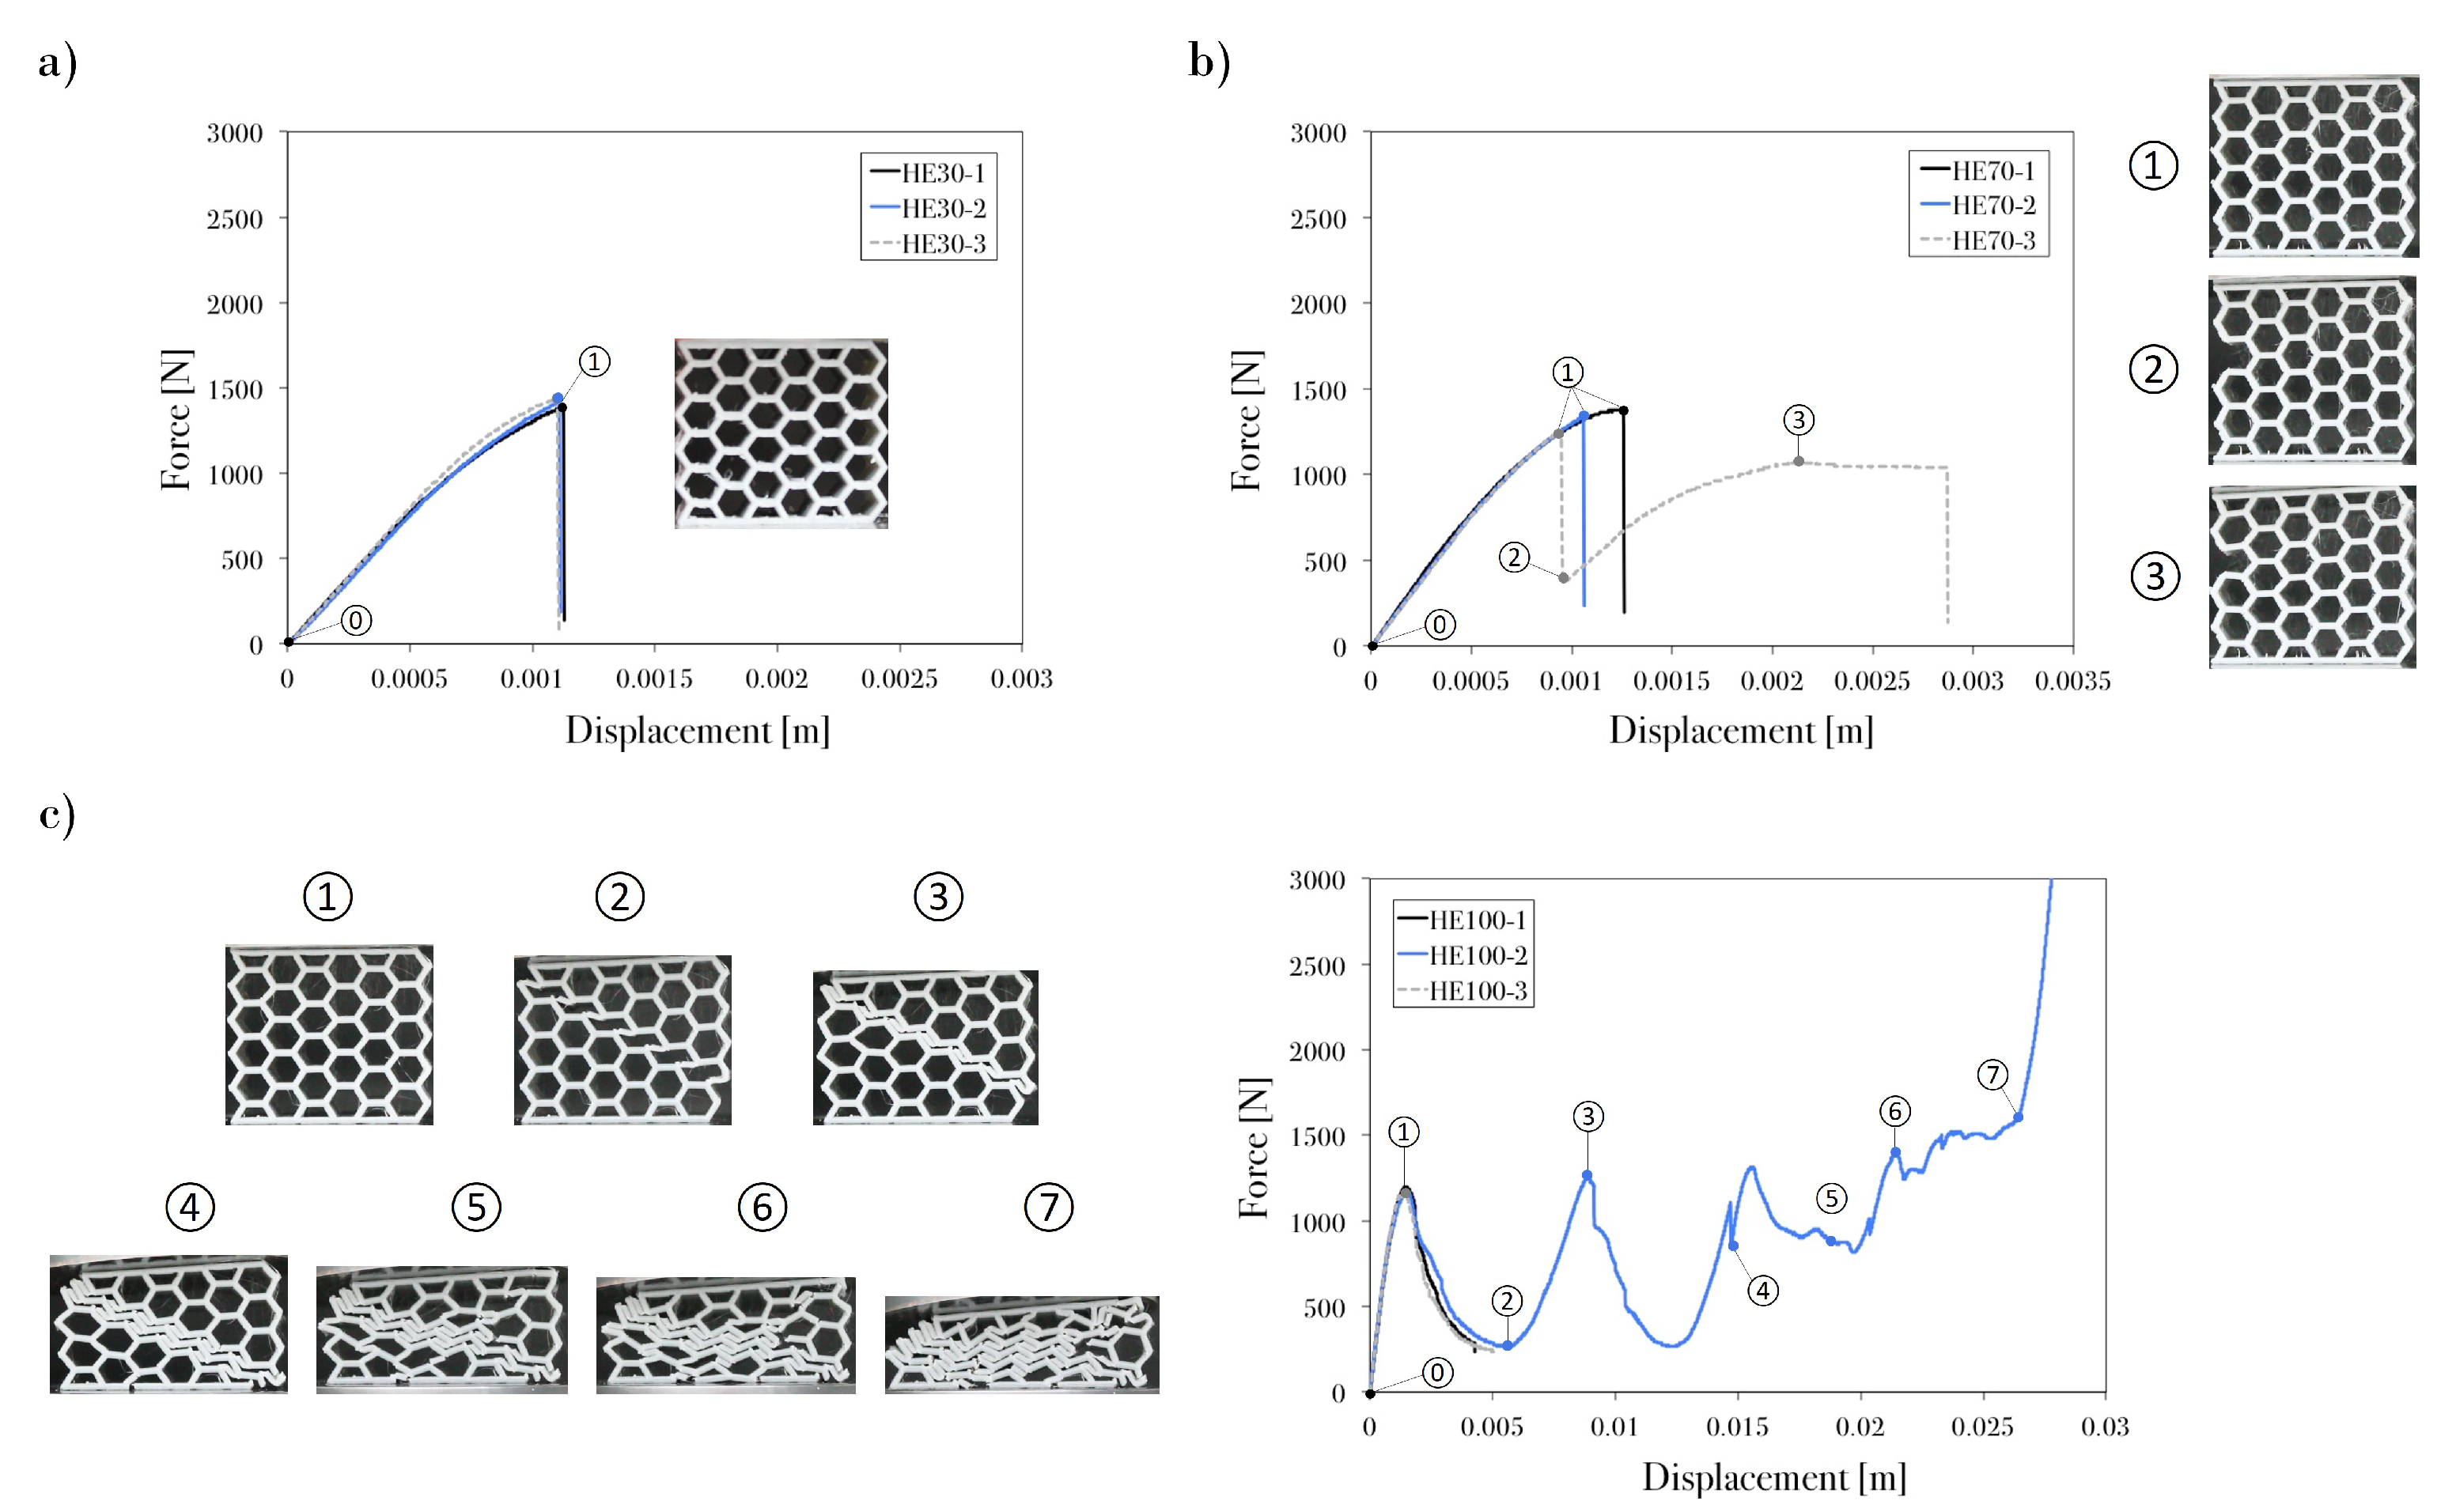
The specimens printed with the edge printing direction and infill density of 100% (
Figure 5c) exhibited a staircase effect. Brittle fractures were found between the layers, which were caused by the low resistance of the filaments. The reason for the low resistance was that the orientation was normal to the applied force and the layers rearranged with each microfracture of the structure. Even though brittle fractures weakened the structure, the improved welding and separation of layers (
Figure 6) provided an extension to the plateau region. The peaks and valleys in this section of the curve correspond to the fracture of individual cell walls. Progressive, folding, and hinging deformations were observed. Two of the three tests with HE100 configuration (
Figure 5c), were automatically finished by the compression machine after detecting a high fall load following the initial peak load (Point 1) from an unexpected brittle fracture on the structure. Nevertheless, it can be observed that the specimen’s performances at the first peak (Point 1) and valley (Point 2) are consistent. Therefore, a progressive folding deformation could be expected with the HE100 configuration.
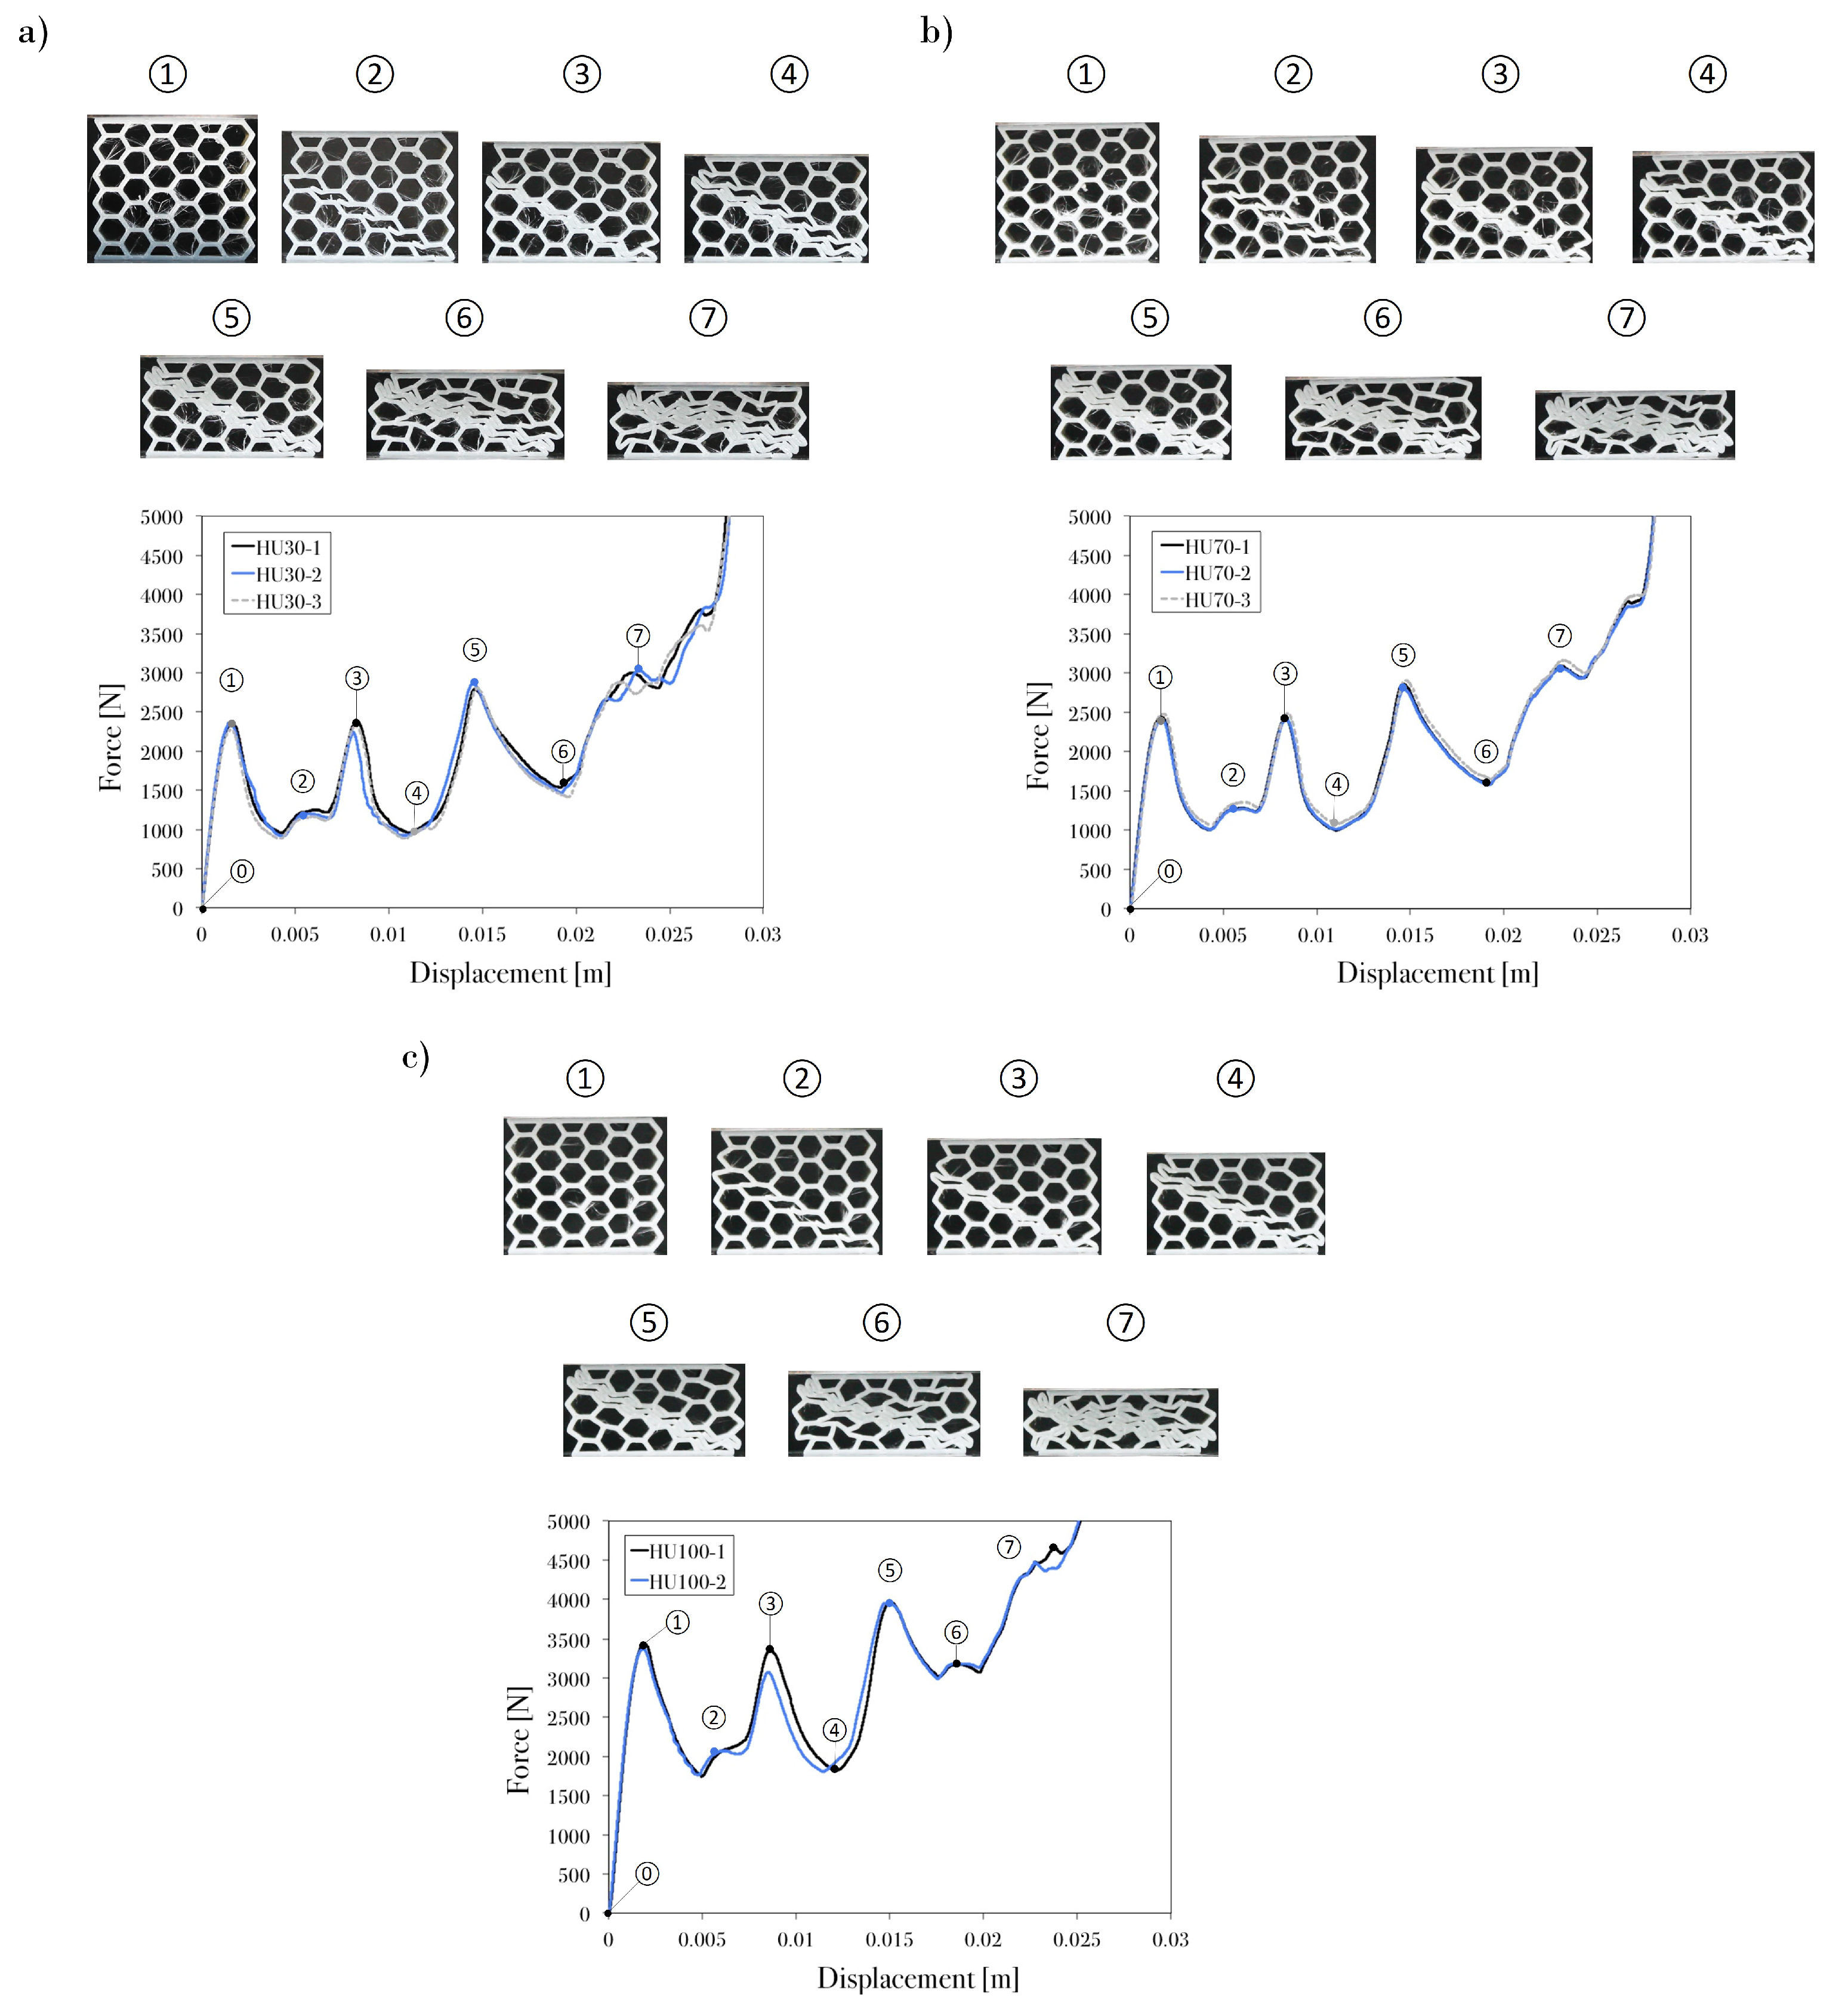
For the specimens in the upright printing direction, cracking could be explained as the delamination of the infill raster (
Figure 7). Previous studies [
9,
10,
43] suggest that, in FDM-3D-printed structures, the delamination of layers affects the material behavior. Force–displacement curves are highly similar for this printing orientation regardless of the infill density. Nevertheless, in this study, the infill density of 100% (
Figure 7c) had a better response due to the higher welding quality. Delamination and ductile microfractures occurred in this printing direction because of the layer orientation and infill density (air gaps) of the filaments (
Figure 4), which partly explained the low welding quality in the low-infill-density specimens (
Figure 7a,b).
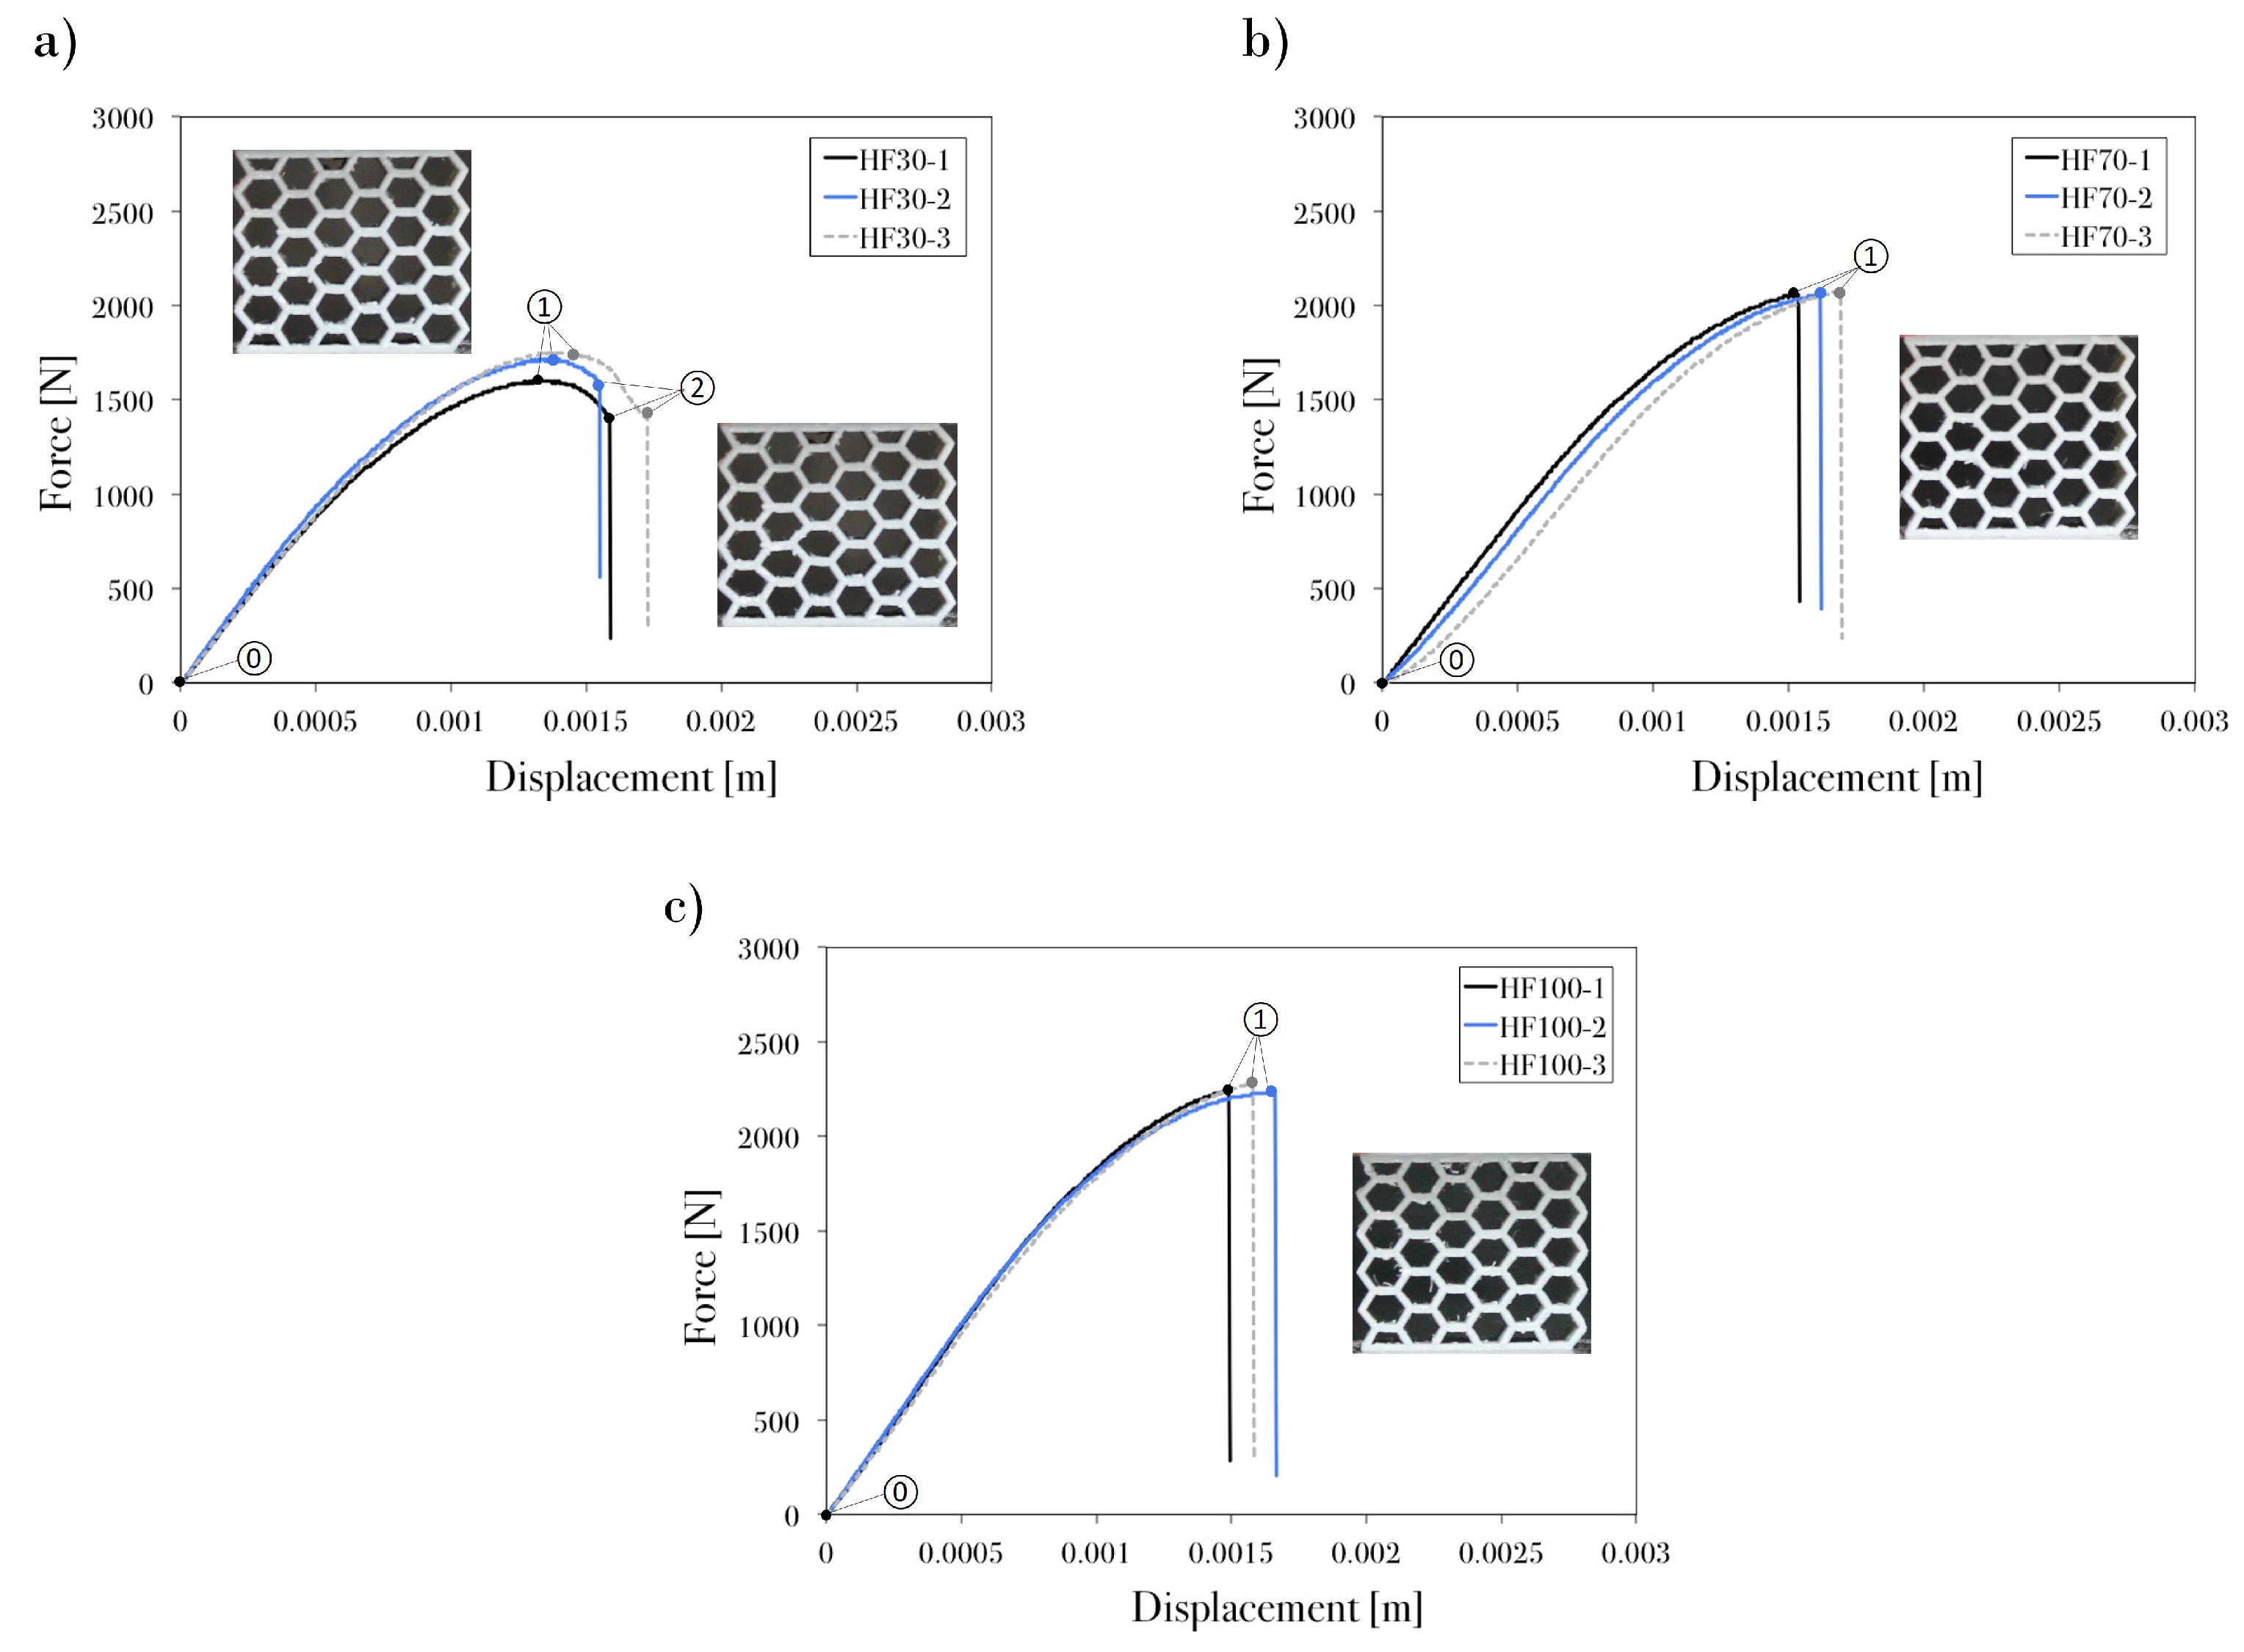
In the flat-printing-direction specimens (
Figure 8), support material was built during the printing process [
44] because of the printing orientation. Therefore, the model preserved burrs (i.e., projections of unwanted material beyond the desired manufactured features) in its cells, which changed the processing conditions from the optimal ones and resulted in a ductile–brittle transition [
45]. The specimens with infill density values of 70% and 100% presented spontaneous brittle fracture (
Figure 8b,c); this is related to the orientation of the layers and the high concentration of the filaments. Meanwhile, the axial behavior of the infill density of 30% (
Figure 8a) showed ductile fracture before the complete breakage of the structure. Nevertheless, it had a smaller peak crushing force than those samples with 70% and 100% infill density.
In general, the load–displacement curves of the honeycomb groups exhibited very similar behaviors. Specimens HE30, HE70, HF30, HF70, and HF100 presented linear elastic deformations, which ended once the critical stress was reached and brittle fractures and plastic yielding were observed. HE100, HU30, HU70, and HU100 presented three phases (linear elasticity, plateau region, and densification) in their load–displacement curves; the hexagonal structures exhibited the high-repeatability collapse of the diagonal array in the plateau region, where fracture started to occur plastically at the joints that connected the cell walls. Therefore, aside from the cell failure that governs the plateau stress, the load distribution in each printed layer and the welding strength had a significant effect on the honeycomb performance.
A correlation can be observed between the fracture mode and the loads from the compression test. According to the classification of Mamalis et al. [
46] and Silva et al. [
47], the main fracture modes that were identified in this study were as follows: (I) brittle fracture with progressive crushing, folding and hinging; (II) brittle fracture with catastrophic failure; and (III) ductile fracture with progressive folding.
Table 4 shows the collapse mode observed in each specimen.
Specimens HE30, HE70, HF30, HF70, and HF100 presented fracture mode II. This mode is related to the unstable and catastrophic failure of the structure, which occurred as parts of the model broke and exhibited unpredictable kinetic dissipation that depended on the location of weak welding in the layers. Meanwhile, mode I was observed in the HE100 sample; the brittle fracture was formed at the early stage and along the plateau region of the crushing event, thus decreasing the stability of the structure. The upright-printing-direction structures showed mode III fracture; each sample exhibited a localized brittle fracture that was generally ductile, which allowed the material to fail progressively without affecting the stability of the structure. Thus, there was no unpredictable and destructive failure.
The behavior of the material is another factor to be considered. Before the heat treatment, the polymeric material used as the filament for FDM 3D printing had high plasticity; after printing, with an increase in stiffness, the maximum strain decreased [
9]. For EA applications, the most relevant properties were the plateau stress and densification strain. A desirable characteristic of cellular materials is a long plateau region in the load–displacement curve [
9], which was observed in specimen HU100 (
Figure 7c). For honeycomb structures with a low infill density and a printing orientation different from the upright direction, the plastic collapse of the walls is the mechanism that governs the plateau stress. Meanwhile, the plateau stress is governed by the zigzag deformation mechanism for specimens with the upright direction.
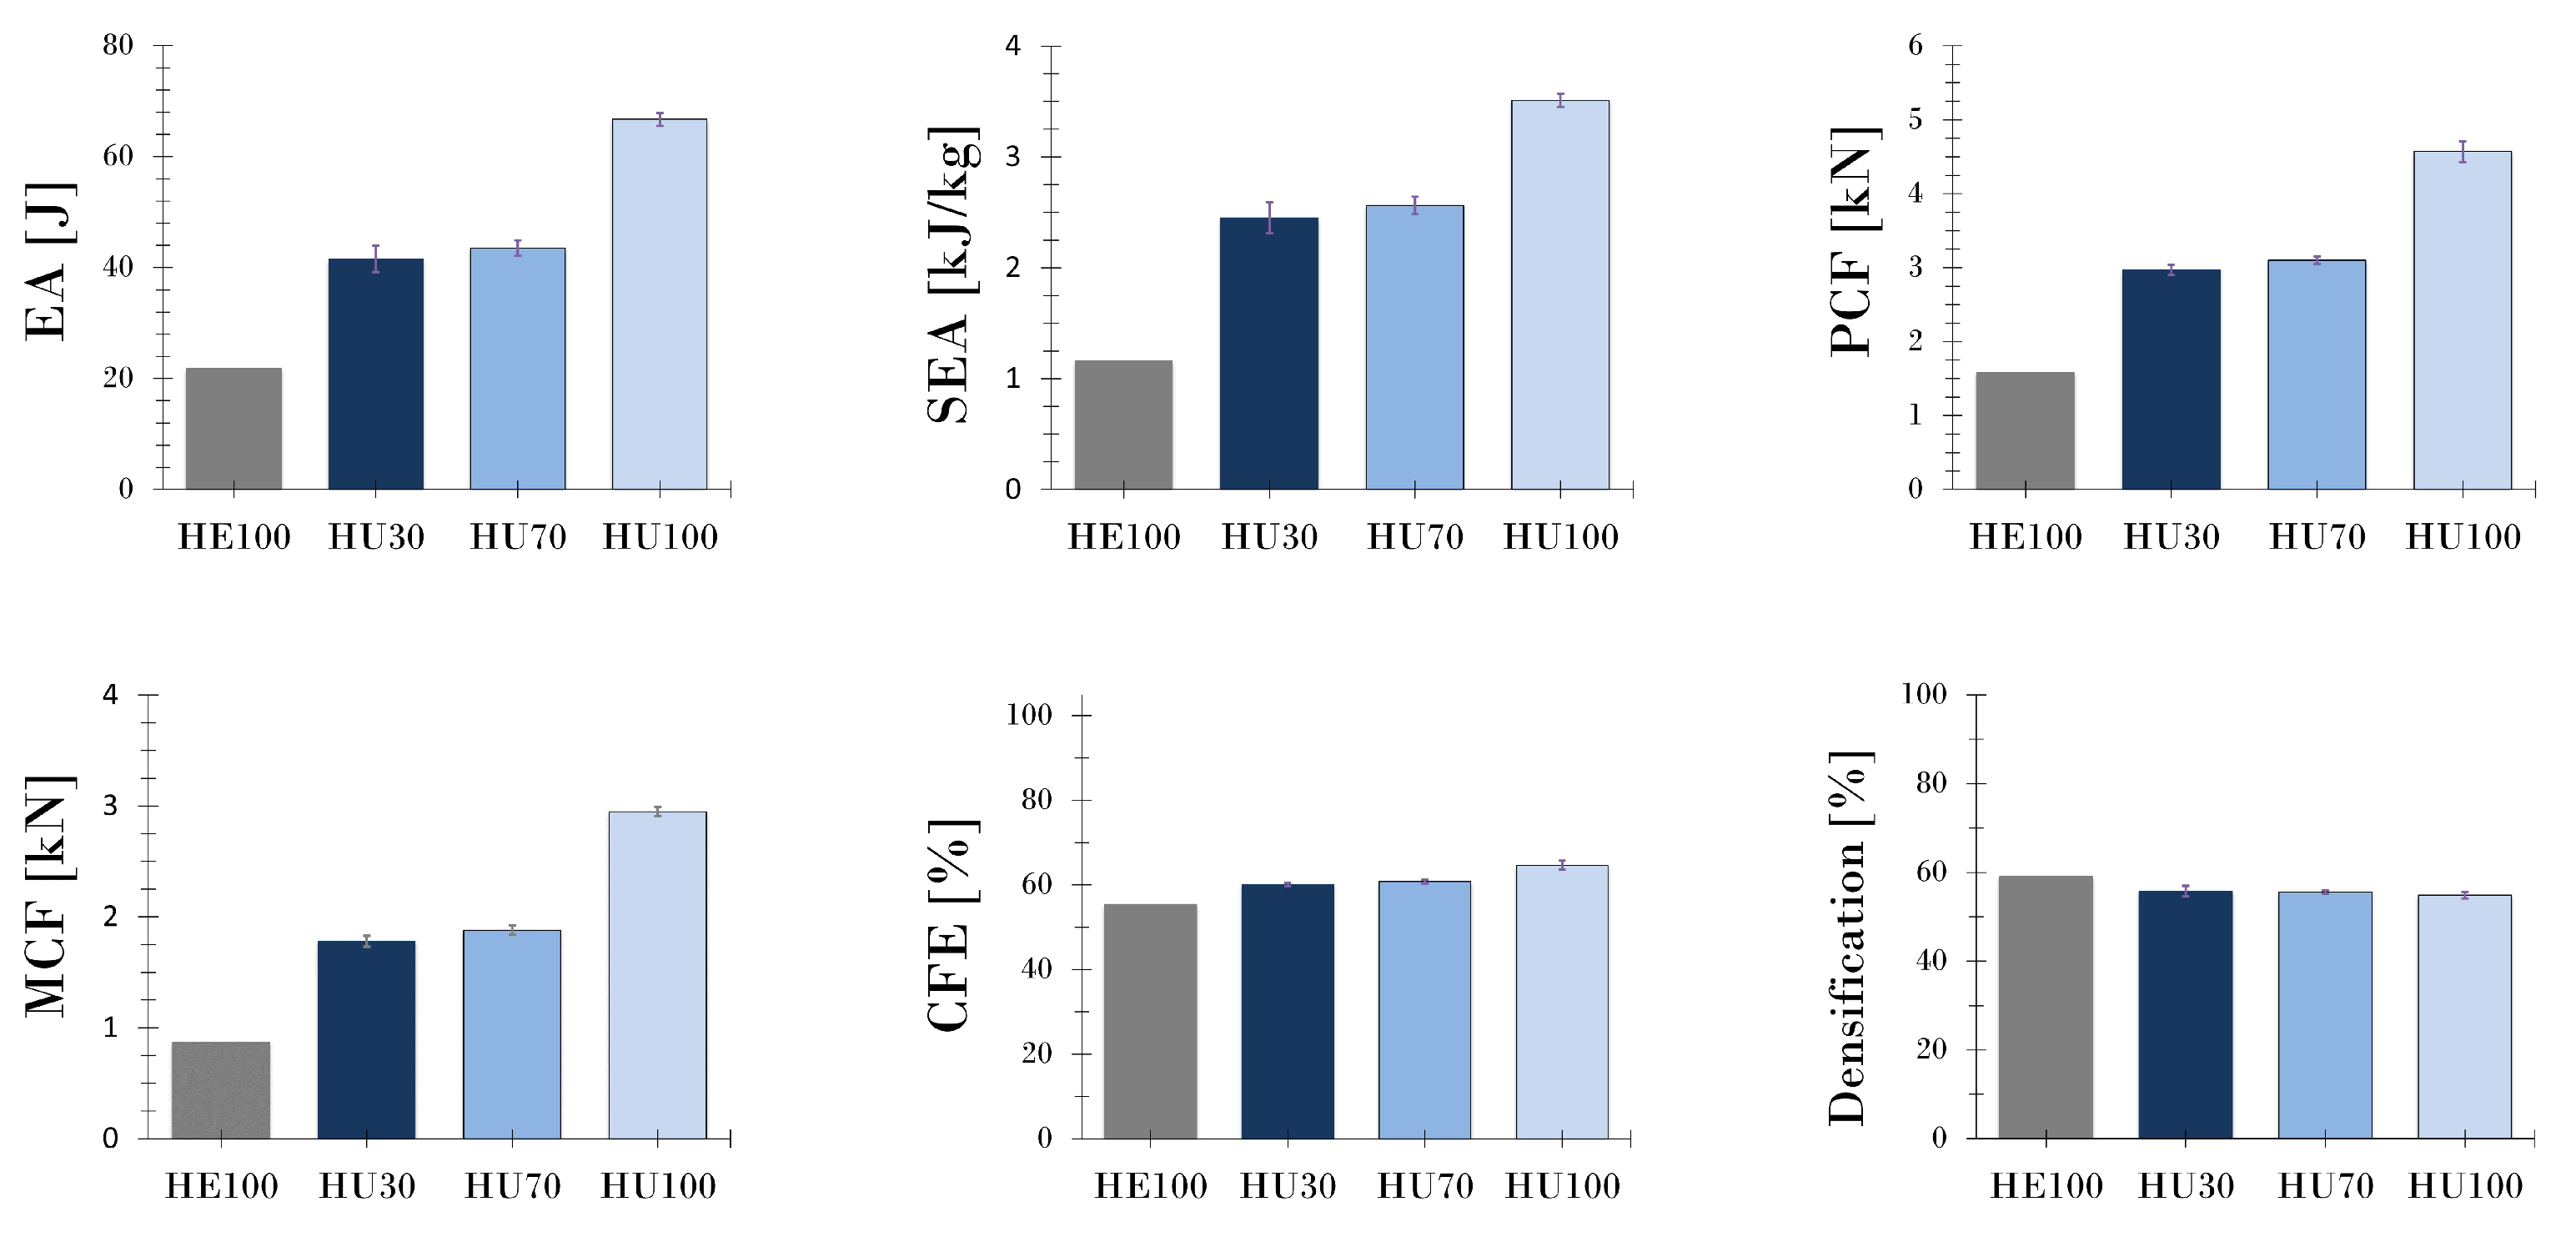
3.3. Crashworthiness Criteria
For a full understanding of the EA performance of hexagonal honeycomb structures under compressive force, multiple indicators can be adopted, such as energy absorption (EA), specific energy absorption (SEA), peak crash force (PCF), mean crash force (MCF), and crash force efficiency (CFE), which are defined by the load–displacement curve and can be obtained by calculating the area below the curve of the plateau region [
48,
49,
50,
51,
52].
The EA of structure describes its capacity to dissipate impact energy, and it directly correlates with the impact force as a function of displacement
F(x) and the effective crushing deformation
d, which is the length of the plateau stage. EA can be written mathematically as follows:
The SEA is the energy absorbed per unit mass under compression.
where
m is the mass of the structure. High SEA values are preferred because they result in higher energy absorption efficiency of structures [
49].
PCF and CFE are critical parameters from the perspective of energy absorption stability. PCF can be directly obtained from the curve. MCF represents the average force during the compressive test [
49,
50].
The MCF can be obtained by using the following expression:
The CFE is the ratio of the MCF to the PCF and can be calculated as follows:
The displacement point at which the structure starts the densification is calculated by finding the energy efficiency
f, which can be defined as [
53]:
where
is the maximum crush force in the crushing distance. Equation (
5) renders the maximum value where densification starts, and the corresponding displacement value, effective stroke
, is divided by the total length of the structure under compression to obtain the percentage of densification.
The crashworthiness indicators are obtained by identifying the area under the plateau region curve of the performed compression tests that presented a plateau region, by referring to the densification phase, and by using Equations (
1)–(
5). These indicators are summarized in
Table 5.
Regarding the EA characteristics with the failure mode and 3D printing parameters, observation showed that the upright orientation of printing provided a collapse mode in which the material progressively failed without instabilities (
Figure 9). In the HU samples, the EA, SEA, and PCF values increased with the infill density. The layer orientation of the edge- and flat-printing-orientation specimens was perpendicular to the compressive force, which caused higher stress concentrations along the filaments and produced a brittle fracture. The specimens with edge and flat printing directions and low infill density values exhibited layer separation, which caused instabilities and structural weakening. In the specimens with high infill density values, the filaments were exposed to a compressive force, which could cause a spontaneous catastrophic failure along the filaments. Therefore, even though the PCF is greater at higher infill density values, EA directly affects the compressive parameters (e.g., length of compression and MCF) and the long plateau region, which in the FDM method is also correlated to the infill density and printing orientation.
In general, the results showed that the zigzag mechanism of failure provided a longer plateau region owing to the progressive deformation of the printed structures, which, along with delamination, was caused by the layer-upon-layer method of 3D printing. Features such as irreversible energy conversion, long stroke (plateau region), stable and repeatable deformation mode, lightweight and high SEA capacity, and cost-effectiveness are part of the fundamental principles for designing EA, where the purpose is to dissipate kinetic energy in a controlled mode or at a predetermined rate [
54]. There was no significant difference between the EA and SEA, given that the mass did not have a notable effect because of the structure size. However, at a higher infill density, a structure has more mass.


 ,
, 


