
Effect of Incorporation of Graphene Nanoplatelets on Physicochemical, Thermal, Rheological, and Mechanical Properties of Biobased and Biodegradable Blends

 ,
,  ,
,  , and
, and 
Abstract
:1. Introduction
2. Materials and Methods
2.1. Materials
2.2. Preparations of Blends
2.3. Characterization
2.3.1. Thermal Properties
2.3.2. Rheological Properties
2.3.3. Fourier-Transform Infrared Spectroscopy (FTIR)
2.3.4. Mechanical Testing
2.3.5. Contact Angle Measurement
2.4. Morphological Analysis
2.5. Statistical Analyses
3. Results and Discussion
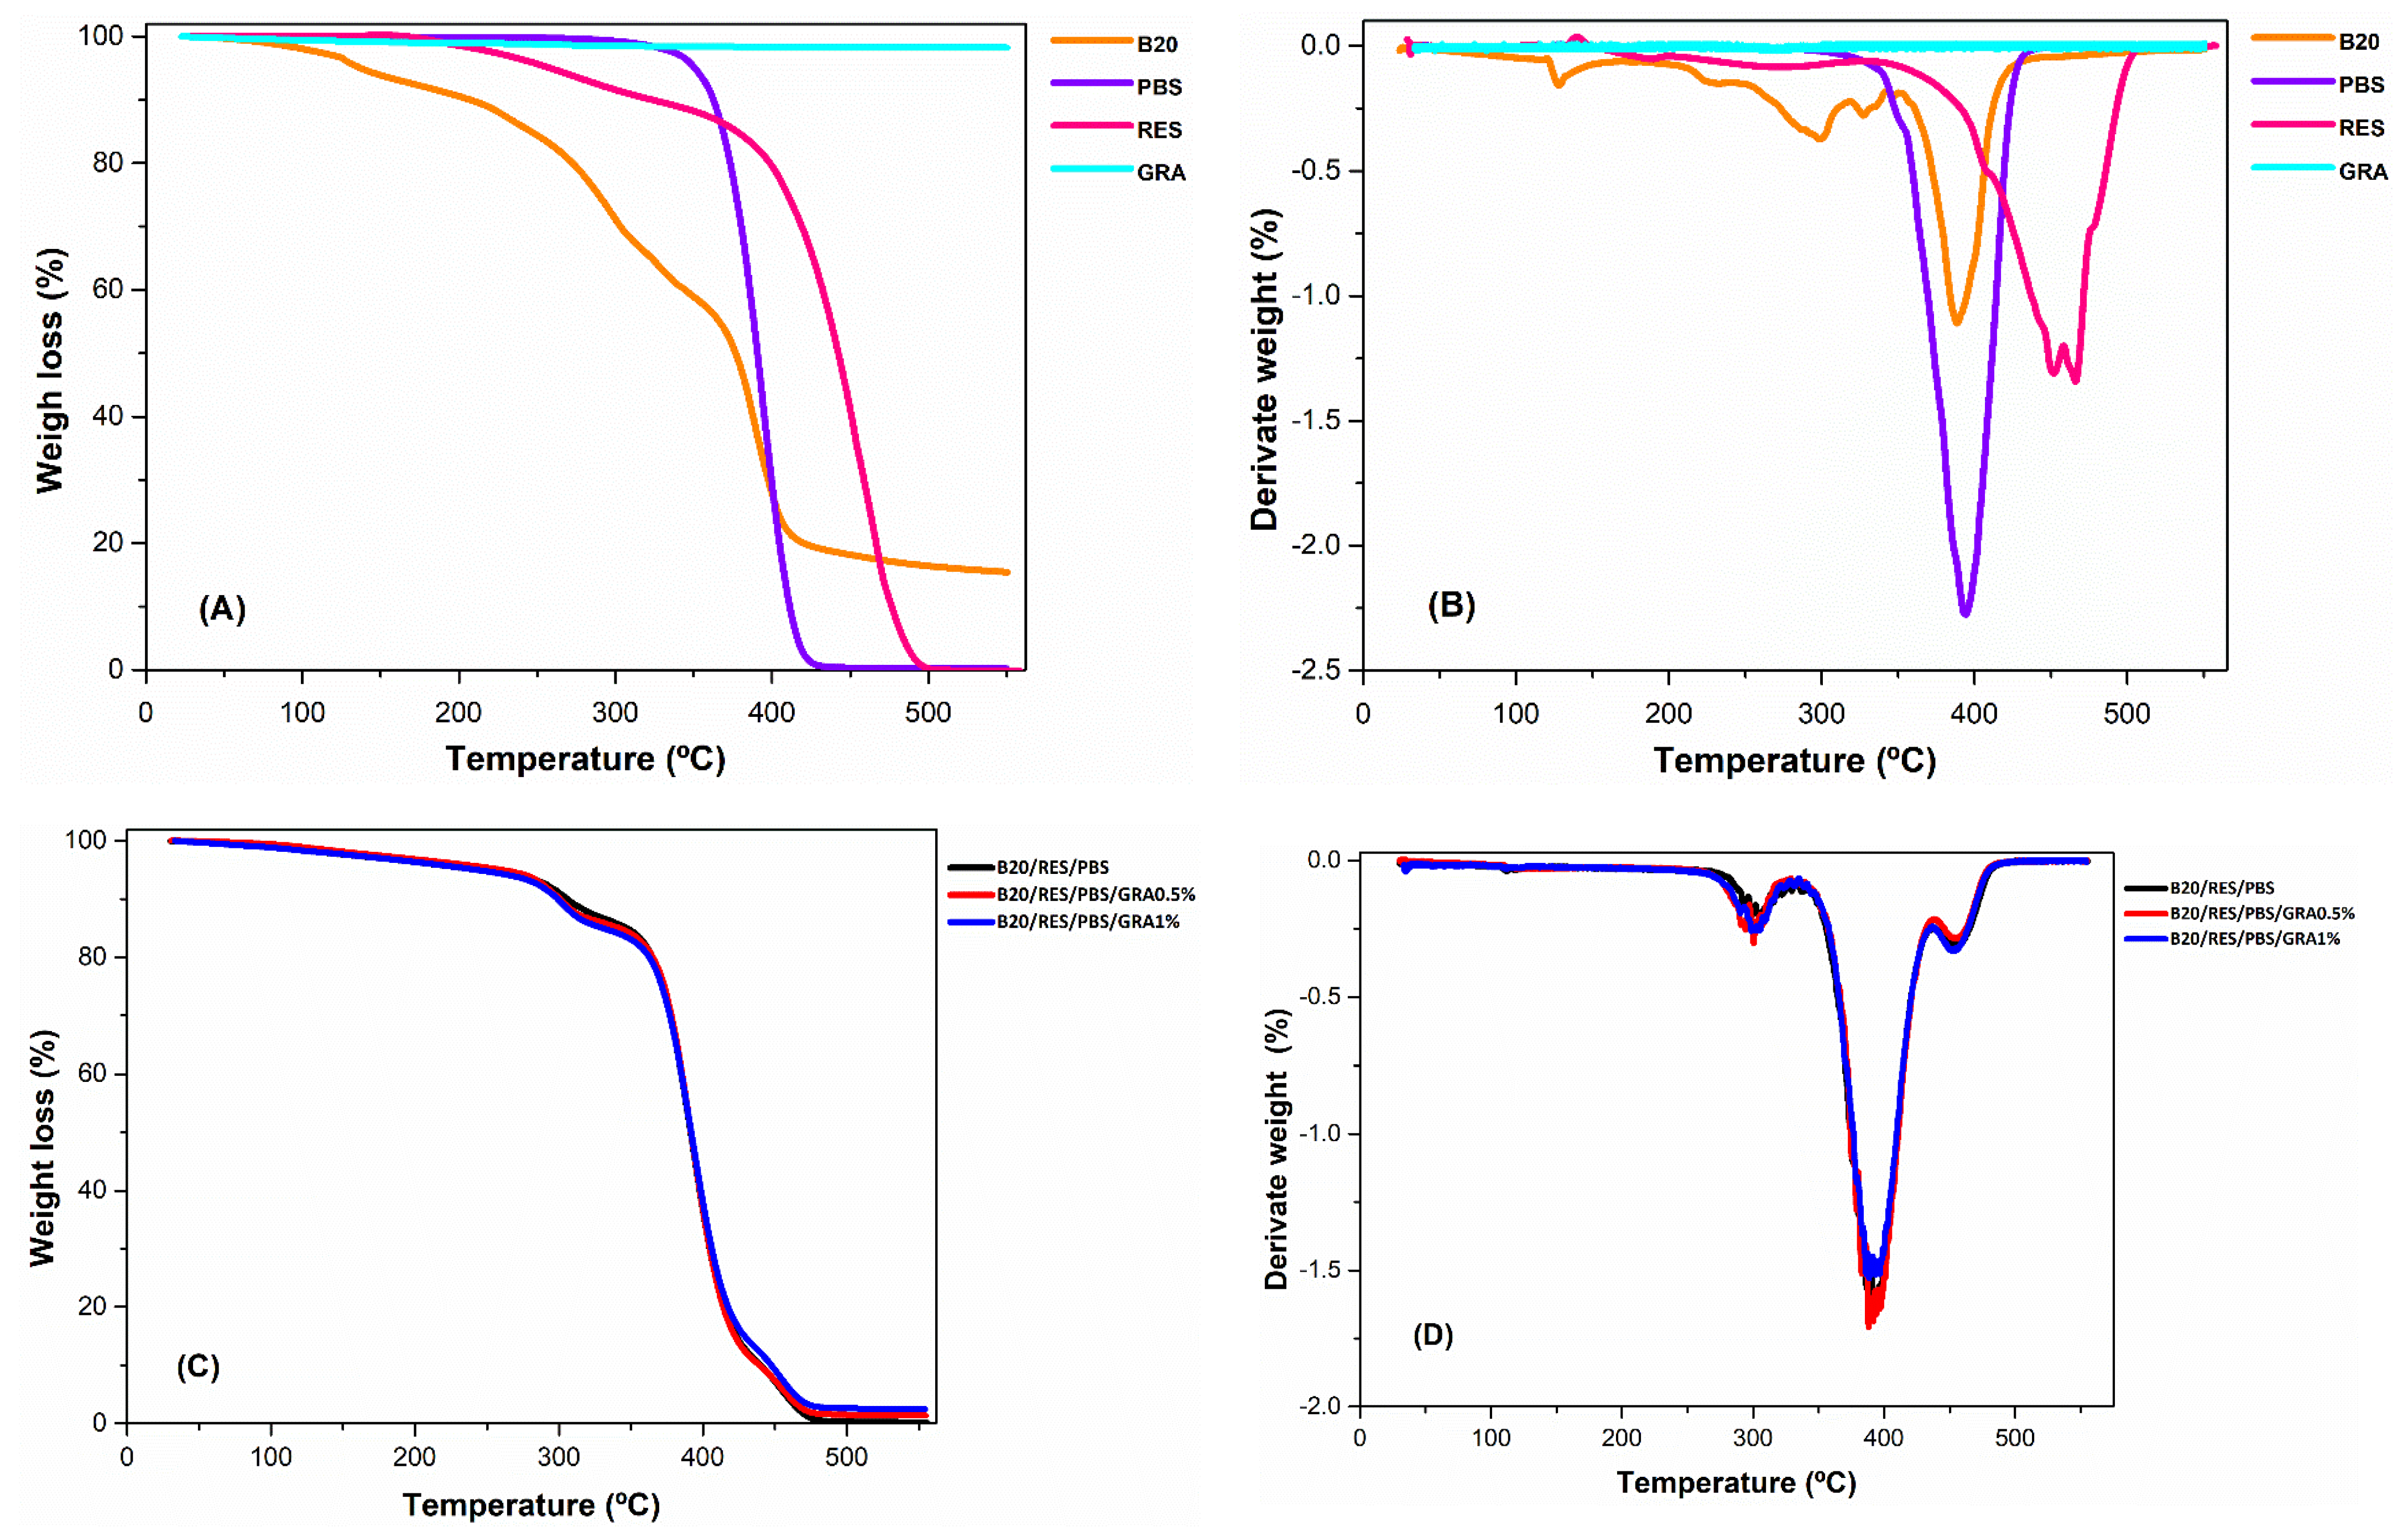
3.1. Thermal Properties
3.2. Rheological Properties
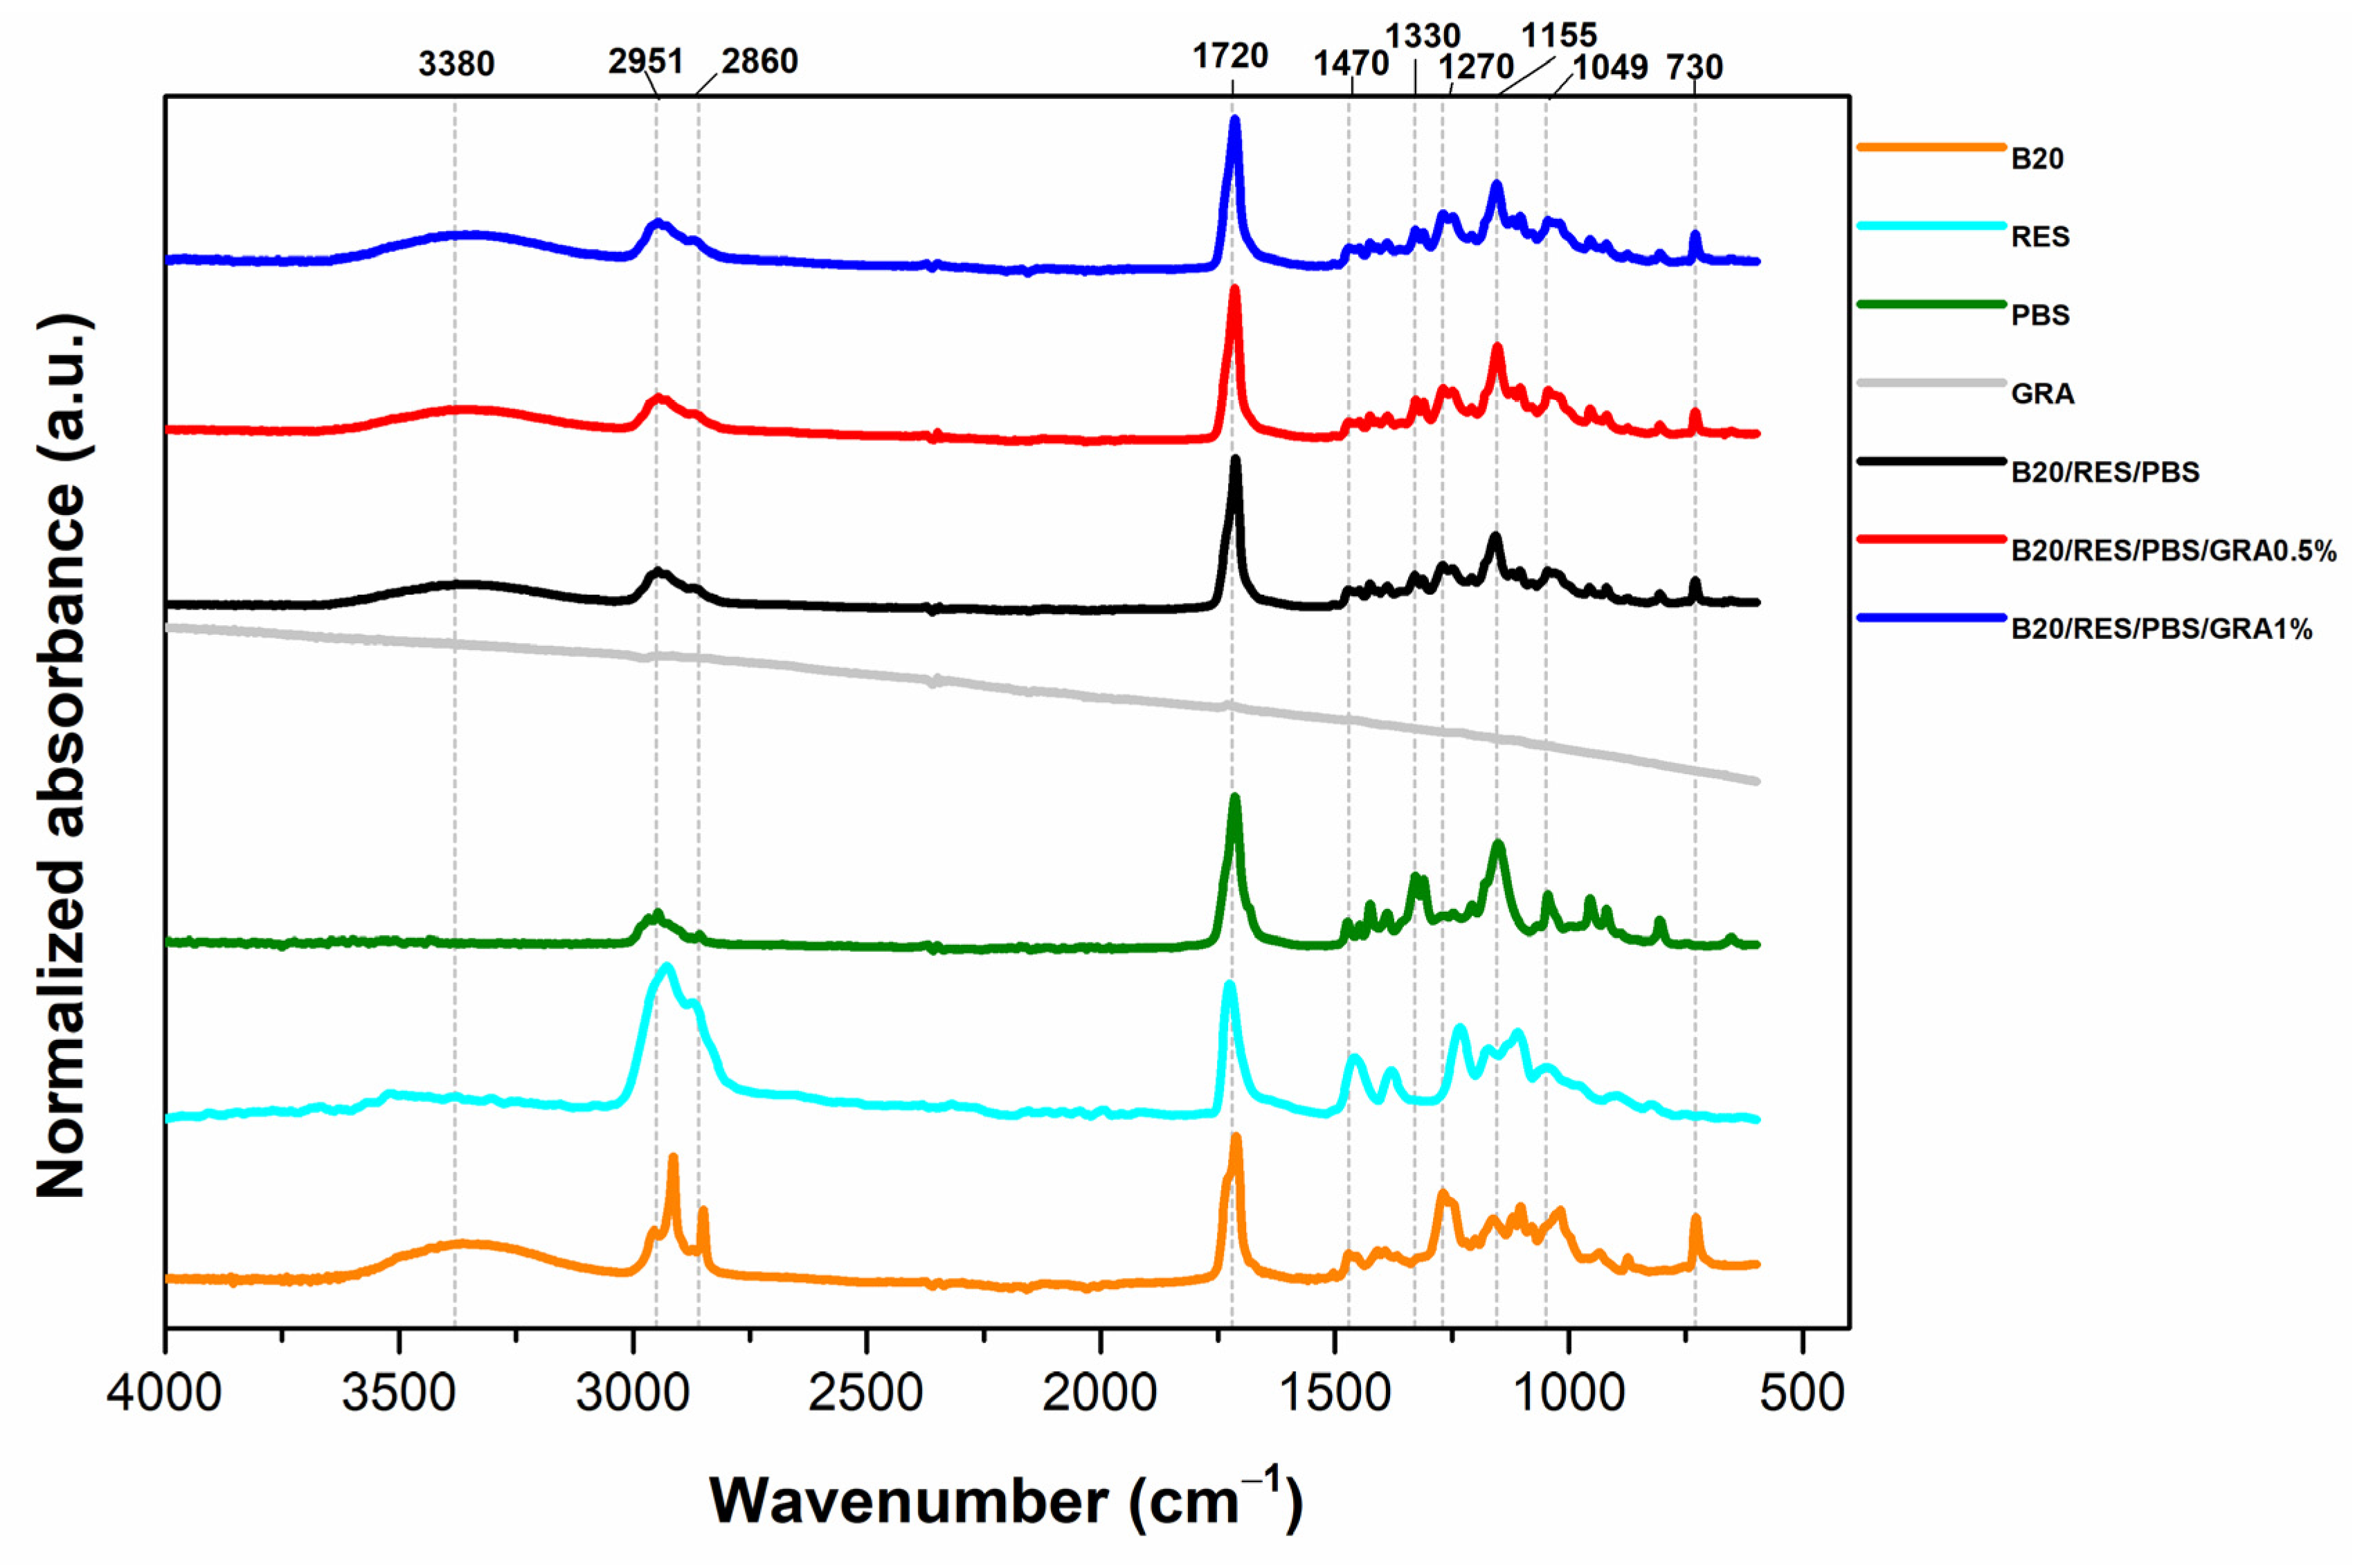
3.3. Fourier-Transform Infrared Spectroscopy
3.4. Mechanical Properties
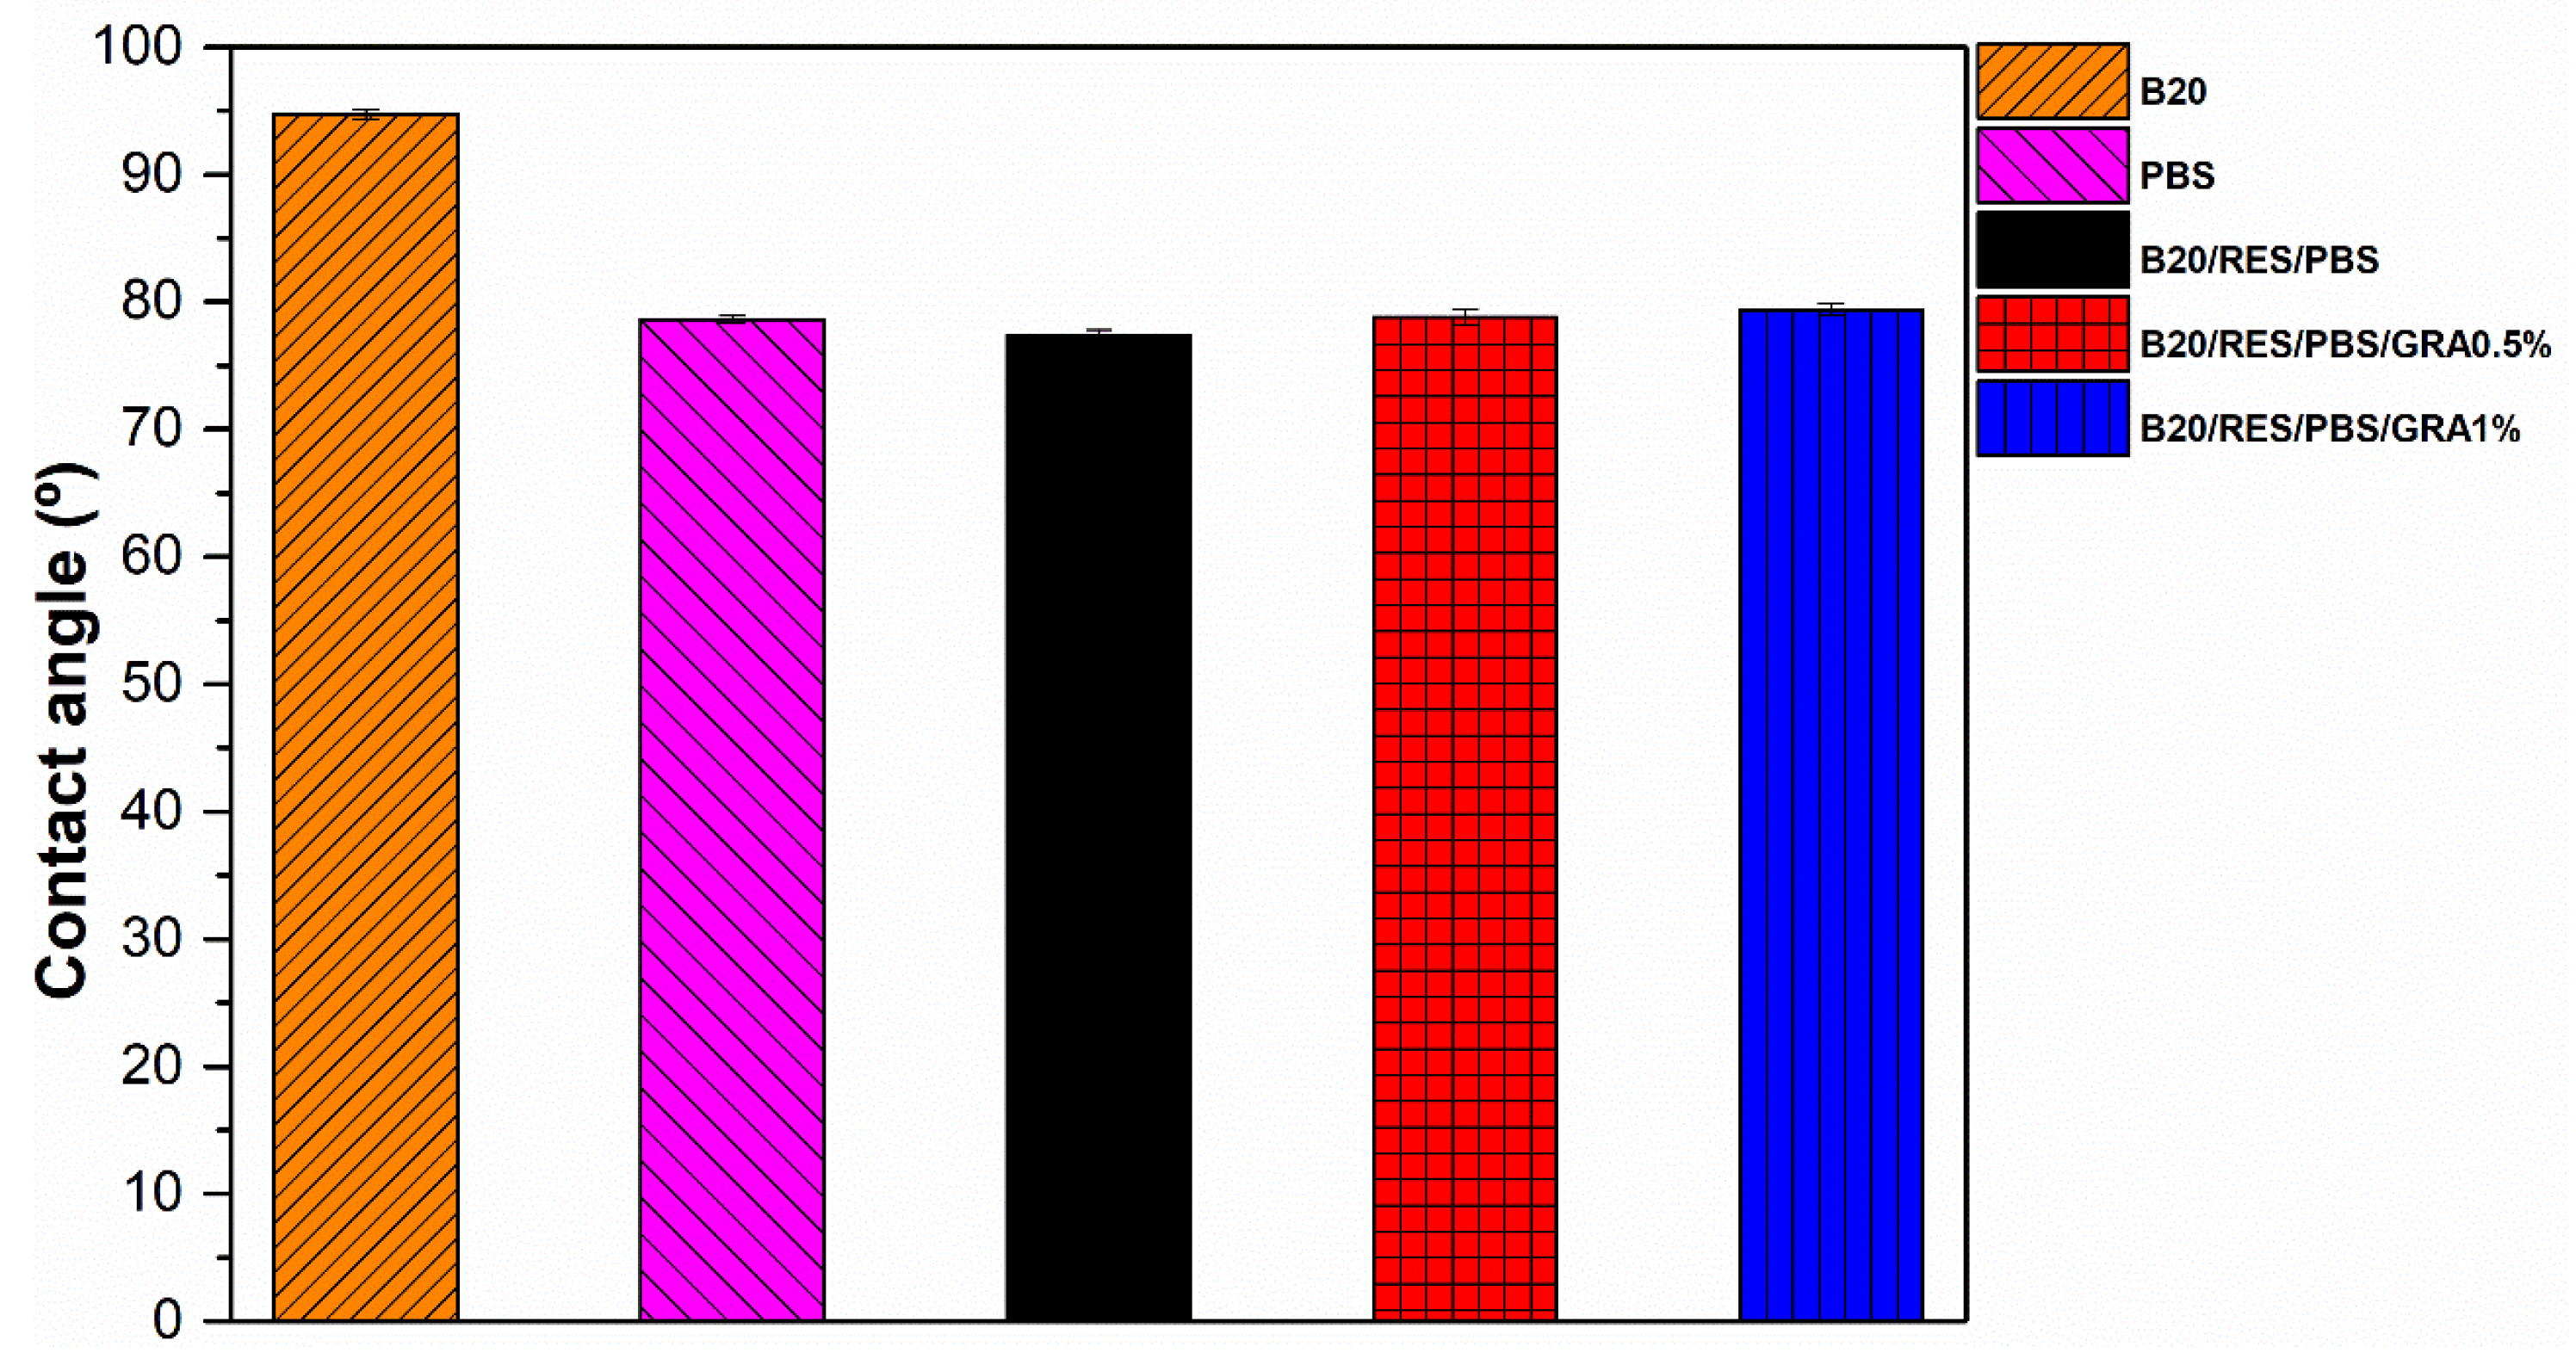
3.5. Contact Angle
3.6. Morphological Analysis
4. Conclusions
Author Contributions
Funding
Institutional Review Board Statement
Data Availability Statement
Acknowledgments
Conflicts of Interest
References
- Ali, A.; Bahadar, A.; Khan, A.; Sanaullah, K. 8—Role of agricultural waste in recycled plastic biocomposites. In Recycled Plastic Biocomposites; Rahman, M.R., Bin Bakri, M.K., Eds.; Woodhead Publishing: Cambridge, UK, 2022; pp. 165–194. [Google Scholar]
- Ponnusamy, P.G.; Mani, S. Material and Environmental Properties of Natural Polymers and Their Composites for Packaging Applications—A Review. Polymers 2022, 14, 4033. [Google Scholar] [CrossRef]
- Kabir, E.; Kaur, R.; Lee, J.; Kim, K.-H.; Kwon, E.E. Prospects of biopolymer technology as an alternative option for non-degradable plastics and sustainable management of plastic wastes. J. Clean. Prod. 2020, 258, 120536. [Google Scholar] [CrossRef]
- Santana, R.F.; Bonomo, R.C.F.; Gandolfi, O.R.R.; Rodrigues, L.B.; Santos, L.S.; dos Santos Pires, A.C.; de Oliveira, C.P.; da Costa Ilhéu Fontan, R.; Veloso, C.M. Characterization of starch-based bioplastics from jackfruit seed plasticized with glycerol. J. Food Sci. Technol. 2018, 55, 278–286. [Google Scholar] [CrossRef] [PubMed]
- Fabunmi, O.O.; Tabil, L.G.; Chang, P.R.; Panigrahi, S. Developing biodegradable plastics from starch. In Proceedings of the ASABE/CSBE North Central Intersectional Meeting, ASABE, St. Joseph, MI, USA; 2006; p. 1. [Google Scholar]
- Jayarathna, S.; Andersson, M.; Andersson, R. Recent Advances in Starch-Based Blends and Composites for Bioplastics Applications. Polymers 2022, 14, 4557. [Google Scholar] [CrossRef] [PubMed]
- Ayu, R.S.; Khalina, A.; Harmaen, A.S.; Zaman, K.; Jawaid, M.; Lee, C.H. Effect of Modified Tapioca Starch on Mechanical, Thermal, and Morphological Properties of PBS Blends for Food Packaging. Polymers 2018, 10, 1187. [Google Scholar] [CrossRef]
- Dammak, M.; Fourati, Y.; Tarrés, Q.; Delgado-Aguilar, M.; Mutjé, P.; Boufi, S. Blends of PBAT with plasticized starch for packaging applications: Mechanical properties, rheological behaviour and biodegradability. Ind. Crops Prod. 2020, 144, 112061. [Google Scholar] [CrossRef]
- Nevoralová, M.; Koutný, M.; Ujčić, A.; Starý, Z.; Šerá, J.; Vlková, H.; Šlouf, M.; Fortelný, I.; Kruliš, Z. Structure characterization and biodegradation rate of poly(ε-caprolactone)/starch blends. Front. Mater. 2020, 7, 141. [Google Scholar] [CrossRef]
- Mohamad, N.; Mazlan, M.M.; Tawakkal, I.S.M.A.; Talib, R.A.; Kian, L.K.; Jawaid, M. Characterization of Active Polybutylene Succinate Films Filled Essential Oils for Food Packaging Application. J. Polym. Environ. 2022, 30, 585–596. [Google Scholar] [CrossRef]
- Rafiqah, S.A.; Khalina, A.; Harmaen, A.S.; Tawakkal, I.A.; Zaman, K.; Asim, M.; Nurrazi, M.N.; Lee, C.H. A Review on Properties and Application of Bio-Based Poly(butylene succinate). Polymers 2021, 13, 1436. [Google Scholar] [CrossRef]
- Zeng, J.-B.; Li, Y.-D.; Zhu, Q.-Y.; Yang, K.-K.; Wang, X.-L.; Wang, Y.-Z. A novel biodegradable multiblock poly(ester urethane) containing poly(L-lactic acid) and poly(butylene succinate) blocks. Polymer 2009, 50, 1178–1186. [Google Scholar] [CrossRef]
- Zeng, J.-B.; Jiao, L.; Li, Y.-D.; Srinivasan, M.; Li, T.; Wang, Y.-Z. Bio-based blends of starch and poly(butylene succinate) with improved miscibility, mechanical properties, and reduced water absorption. Carbohydr. Polym. 2011, 83, 762–768. [Google Scholar] [CrossRef]
- Jariyasakoolroj, P.; Chirachanchai, S. In Situ Chemical Modification of Thermoplastic Starch with Poly(L-lactide) and Poly(butylene succinate) for an Effectively Miscible Ternary Blend. Polymers 2022, 14, 825. [Google Scholar] [CrossRef] [PubMed]
- Zhang, S.; He, Y.; Yin, Y.; Jiang, G. Fabrication of innovative thermoplastic starch bio-elastomer to achieve high toughness poly(butylene succinate) composites. Carbohydr. Polym. 2019, 206, 827–836. [Google Scholar] [CrossRef] [PubMed]
- Nazrin, A.; Sapuan, S.; Zuhri, M.; Ilyas, R.; Syafiq, R.; Sherwani, S. Nanocellulose reinforced thermoplastic starch (TPS), polylactic acid (PLA), and polybutylene succinate (PBS) for food packaging applications. Front. Chem. 2020, 8, 213. [Google Scholar] [CrossRef] [PubMed]
- Ayu, R.S.; Khalina, A.; Harmaen, A.S.; Zaman, K.; Isma, T.; Liu, Q.; Ilyas, R.A.; Lee, C.H. Characterization Study of Empty Fruit Bunch (EFB) Fibers Reinforcement in Poly(Butylene) Succinate (PBS)/Starch/Glycerol Composite Sheet. Polymers 2020, 12, 1571. [Google Scholar] [CrossRef]
- Waisarikit, A.; Ross, S.; Ross, G.M.; Mahasaranon, S. The influence of cassava starch on the properties of PLA/PBS/SCG films for packaging applications. Polym. Plast. Technol. Mater. 2023, 62, 1684–1695. [Google Scholar] [CrossRef]
- Surendren, A.; Mohanty, A.K.; Liu, Q.; Misra, M. A review of biodegradable thermoplastic starches, their blends and composites: Recent developments and opportunities for single-use plastic packaging alternatives. Green Chem. 2022, 24, 8606–8636. [Google Scholar] [CrossRef]
- Bastioli, C. Properties and applications of Mater-Bi starch-based materials. Polym. Degrad. Stab. 1998, 59, 263–272. [Google Scholar] [CrossRef]
- Arrieta, M.P.; Samper, M.D.; Jiménez-López, M.; Aldas, M.; López, J. Combined effect of linseed oil and gum rosin as natural additives for PVC. Ind. Crops Prod. 2017, 99, 196–204. [Google Scholar] [CrossRef]
- Aldas, M.; Pavon, C.; López-Martínez, J.; Arrieta, M.P. Pine Resin Derivatives as Sustainable Additives to Improve the Mechanical and Thermal Properties of Injected Moulded Thermoplastic Starch. Appl. Sci. 2020, 10, 2561. [Google Scholar] [CrossRef]
- Aldas, M.; Ferri, J.M.; Lopez-Martinez, J.; Samper, M.D.; Arrieta, M.P. Effect of pine resin derivatives on the structural, thermal, and mechanical properties of Mater-Bi type bioplastic. J. Appl. Polym. Sci. 2020, 137, 48236. [Google Scholar] [CrossRef]
- Suchao-in, K.; Koombhongse, P.; Chirachanchai, S. Starch grafted poly(butylene succinate) via conjugating reaction and its role on enhancing the compatibility. Carbohydr. Polym. 2014, 102, 95–102. [Google Scholar] [CrossRef]
- Rafiee, M.; Nitzsche, F.; Laliberte, J.; Hind, S.; Robitaille, F.; Labrosse, M.R. Thermal properties of doubly reinforced fiberglass/epoxy composites with graphene nanoplatelets, graphene oxide and reduced-graphene oxide. Compos. Part B Eng. 2019, 164, 1–9. [Google Scholar] [CrossRef]
- Anwar, Z.; Kausar, A.; Rafique, I.; Muhammad, B. Advances in Epoxy/Graphene Nanoplatelet Composite with Enhanced Physical Properties: A Review. Polym. Plast. Technol. Eng. 2016, 55, 643–662. [Google Scholar] [CrossRef]
- Cataldi, P.; Athanassiou, A.; Bayer, I.S. Graphene Nanoplatelets-Based Advanced Materials and Recent Progress in Sustainable Applications. Appl. Sci. 2018, 8, 1438. [Google Scholar] [CrossRef]
- Zhao, X.; Zhang, Q.; Chen, D.; Lu, P. Enhanced Mechanical Properties of Graphene-Based Poly(vinyl alcohol) Composites. Macromolecules 2010, 43, 2357–2363. [Google Scholar] [CrossRef]
- Kuilla, T.; Bhadra, S.; Yao, D.; Kim, N.H.; Bose, S.; Lee, J.H. Recent advances in graphene based polymer composites. Prog. Polym. Sci. 2010, 35, 1350–1375. [Google Scholar] [CrossRef]
- Shen, B.; Lu, D.; Zhai, W.; Zheng, W. Synthesis of graphene by low-temperature exfoliation and reduction of graphite oxide under ambient atmosphere. J. Mater. Chem. C 2013, 1, 50–53. [Google Scholar] [CrossRef]
- Cooper, C.J.; Abdelwahab, M.A.; Mohanty, A.K.; Misra, M. Hybrid Green Bionanocomposites of Bio-based Poly(butylene succinate) Reinforced with Pyrolyzed Perennial Grass Microparticles and Graphene Nanoplatelets. ACS Omega 2019, 4, 20476–20485. [Google Scholar] [CrossRef]
- Tavares, L.; Sousa, L.R.; Magalhães da Silva, S.; Lima, P.S.; Oliveira, J.M. Moisture Sorption Isotherms and Thermodynamic Properties of Biodegradable Polymers for Application in Food Packaging Industry. Polymers 2023, 15, 1634. [Google Scholar] [CrossRef]
- Pavon, C.; Aldas, M.; López-Martínez, J.; Ferrándiz, S. New Materials for 3D-Printing Based on Polycaprolactone with Gum Rosin and Beeswax as Additives. Polymers 2020, 12, 334. [Google Scholar] [CrossRef] [PubMed]
- BS EN ISO 527-2: 1996; Plastics-Determination of Tensile Properties—Part 2: Test Conditions for Moulding and Extrusion Plastics. British Standard: London, UK, 1996.
- International Organization for Standardization EN ISO 178:2003; Determination of Flexural Properties. International Organization for Standardization: Geneva, Switzerland, 2003.
- ASTM D 2240; Standard Test Method for Rubber Property Durometer Hardness. Annual Book of ASTM Standards. American Society for Testing and Materials: Philadelphia, PA, USA, 2017.
- Ujcic, A.; Nevoralova, M.; Dybal, J.; Zhigunov, A.; Kredatusova, J.; Krejcikova, S.; Fortelny, I.; Slouf, M. Thermoplastic Starch Composites Filled With Isometric and Elongated TiO2-Based Nanoparticles. Front. Mater. 2019, 6, 284. [Google Scholar] [CrossRef]
- Wang, Y.; Jiang, D.; Wen, X.; Tang, T.; Szymańska, K.; Sielicki, K.; Wenelska, K.; Mijowska, E. Investigating the Effect of Aluminum Diethylphosphinate on Thermal Stability, Flame Retardancy, and Mechanical Properties of Poly(butylene succinate). Front. Mater. 2021, 8, 737749. [Google Scholar] [CrossRef]
- Favvas, E.P.; Kouvelos, E.P.; Papageorgiou, S.K.; Tsanaktsidis, C.G.; Mitropoulos, A.C. Characterization of natural resin materials using water adsorption and various advanced techniques. Appl. Phys. A 2015, 119, 735–743. [Google Scholar] [CrossRef]
- Lima, P.; Magalhães da Silva, S.P.; Oliveira, J.; Costa, V. Rheological properties of ground tyre rubber based thermoplastic elastomeric blends. Polym. Test. 2015, 45, 58–67. [Google Scholar] [CrossRef]
- Magalhães da Silva, S.P.; Lima, P.S.; Oliveira, J.M. Rheological behaviour of cork-polymer composites for injection moulding. Compos. Part B Eng. 2016, 90, 172–178. [Google Scholar] [CrossRef]
- Melo de Lima, L.R.; Magalhães da Silva, S.P.; Trindade, T.; Oliveira, J.M. Rheological behavior of poly(propylene) reinforced with graphene nanoplatelets for injection molding. J. Appl. Polym. Sci. 2022, 139, e52492. [Google Scholar] [CrossRef]
- Li, Y.; Zhu, J.; Wei, S.; Ryu, J.; Sun, L.; Guo, Z. Poly(propylene)/Graphene Nanoplatelet Nanocomposites: Melt Rheological Behavior and Thermal, Electrical, and Electronic Properties. Macromol. Chem. Phys. 2011, 212, 1951–1959. [Google Scholar] [CrossRef]
- Hamad, K.; Kaseem, M.; Deri, F. Rheological and mechanical characterization of poly(lactic acid)/polypropylene polymer blends. J. Polym. Res. 2011, 18, 1799–1806. [Google Scholar] [CrossRef]
- Bilisik, K.; Akter, M. Graphene nanoplatelets/epoxy nanocomposites: A review on functionalization, characterization techniques, properties, and applications. J. Reinf. Plast. Compos. 2021, 41, 99–129. [Google Scholar] [CrossRef]
- Ou-Yang, Q.; Guo, B.; Xu, J. Preparation and Characterization of Poly(butylene succinate)/Polylactide Blends for Fused Deposition Modeling 3D Printing. ACS Omega 2018, 3, 14309–14317. [Google Scholar] [CrossRef]
- Girdthep, S.; Komrapit, N.; Molloy, R.; Lumyong, S.; Punyodom, W.; Worajittiphon, P. Effect of plate-like particles on properties of poly(lactic acid)/poly(butylene adipate-co-terephthalate) blend: A comparative study between modified montmorillonite and graphene nanoplatelets. Compos. Sci. Technol. 2015, 119, 115–123. [Google Scholar] [CrossRef]
- Kishore, M.; Amrita, M. Mechanical characterization of jute-basalt hybrid composites with graphene as nanofiller. J. Mech. Sci. Technol. 2022, 36, 3923–3929. [Google Scholar] [CrossRef]
- Li, Y.; Wang, S.; Wang, Q. A molecular dynamics simulation study on enhancement of mechanical and tribological properties of polymer composites by introduction of graphene. Carbon 2017, 111, 538–545. [Google Scholar] [CrossRef]
- Lin, Q.; Qu, L.; Lü, Q.; Fang, C. Preparation and properties of graphene oxide nanosheets/cyanate ester resin composites. Polym. Test. 2013, 32, 330–337. [Google Scholar] [CrossRef]
- Law, K.-Y. Water–surface interactions and definitions for hydrophilicity, hydrophobicity and superhydrophobicity. Pure Appl. Chem. 2015, 87, 759–765. [Google Scholar] [CrossRef]
- Li, M.; Jia, Y.; Shen, X.; Shen, T.; Tan, Z.; Zhuang, W.; Zhao, G.; Zhu, C.; Ying, H. Investigation into lignin modified PBAT/thermoplastic starch composites: Thermal, mechanical, rheological and water absorption properties. Ind. Crops Prod. 2021, 171, 113916. [Google Scholar] [CrossRef]
- Bulatović, V.O.; Mandić, V.; Kučić Grgić, D.; Ivančić, A. Biodegradable Polymer Blends Based on Thermoplastic Starch. J. Polym. Environ. 2021, 29, 492–508. [Google Scholar] [CrossRef]


| Formulation | Components | |||
|---|---|---|---|---|
| B20 | RES | PBS | GRA | |
| %wt | %wt | %wt | %wt a | |
| B20/RES/PBS | 40 | 20 | 40 | - |
| B20/RES/PBS/GRA0.5% | 40 | 20 | 40 | 0.5 |
| B20/RES/PBS/GRA1% | 40 | 20 | 40 | 1 |
| Sample | Temperature Range (°C) | Tmax (°C) | Rm (%) | ||
|---|---|---|---|---|---|
| Up to 150 | 150–250 | 250–400 | |||
| B20 | 6.1 | 9.5 | 56.6 | 388.5 | 15.4 |
| PBS | 0.1 | 0.1 | 70.3 | 394.5 | 0.2 |
| RES | 0.1 | 4.3 | 16.1 | 466.5 | 0.0 |
| GRA | 0.9 | 0.4 | 0.4 | 46.8 | 98.2 |
| B20/PBS/RES | 2.4 | 2.9 | 58.1 | 394.4 | 0.2 |
| B20/PBS/RES/GRA0.5% | 1.9 | 2.7 | 58.6 | 388.2 | 1.4 |
| B20/PBS/RES/GRA1% | 2.3 | 3.3 | 56.3 | 388.6 | 2.5 |
| Sample | η0 (Pa·s) | τ (Pa) | n |
|---|---|---|---|
| B20 | 2406.4 | 31,499.5 | 0.4 |
| PBS | 3403.3 | 87,934.1 | 0.3 |
| B20/RES/PBS | 800.4 | 54,226.5 | 0.4 |
| B20/RES/PBS/GRA0.5% | 778.9 | 62,381.9 | 0.4 |
| B20/RES/PBS/GRA1% | 731.6 | 59,969.4 | 0.4 |
| Samples | Tensile Modulus (MPa) | Elongation at Break (%) | Tensile Strength (MPa) | Flexural Modulus (MPa) | Flexural Strength (MPa) | Impact Strength (kJ/m2) | Hardness Shore D |
|---|---|---|---|---|---|---|---|
| B20 | 79.74 ± 4.84 e ** | 1207.02 ± 50.32 a | 13.86 ± 1.02 c | 58.28 ± 4.67 e | 3.22 ± 0.12 e | 28.62 ± 1.23 a | 36.29 ± 0.26 e |
| PBS | 810.24 ± 10.25 a | 31.58 ± 3.51 e | 40.32 ± 3.84 a | 456.45 ± 5.09 a | 32.35 ± 2.25 a | 12.09 ± 0.59 c | 64.57 ± 0.42 a |
| B20/RES/PBS | 551.01 ± 16.27 d | 511.34 ± 7.45 b | 19.77 ± 1.84 b | 370.17 ± 3.54 d | 12.86 ± 0.11 d | 22.58 ± 2.05 b | 51.28 ± 0.56 d |
| B20/RES/PBS/GRA0.5% | 692.52 ± 11.01 b | 131.41 ± 4.55 c | 17.56 ± 1.03 b | 382.44 ± 4.04 c | 14.92 ± 0.12 c | 11.51 ± 0.79 d | 54.77 ± 0.11 c |
| B20/RES/PBS/GRA1% | 745.37 ± 15.23 c | 89.65 ± 5.54 d | 17.93 ± 1.21 b | 428.34 ± 6.07 b | 15.07 ± 0.13 b | 7.64 ± 0.43 e | 59.26 ± 0.04 b |
Disclaimer/Publisher’s Note: The statements, opinions and data contained in all publications are solely those of the individual author(s) and contributor(s) and not of MDPI and/or the editor(s). MDPI and/or the editor(s) disclaim responsibility for any injury to people or property resulting from any ideas, methods, instructions or products referred to in the content. |
© 2023 by the authors. Licensee MDPI, Basel, Switzerland. This article is an open access article distributed under the terms and conditions of the Creative Commons Attribution (CC BY) license (https://creativecommons.org/licenses/by/4.0/).
Share and Cite
Tavares, L.; Sousa, L.R.; Silva, S.M.d.; Lima, P.S.; Oliveira, J.M. Effect of Incorporation of Graphene Nanoplatelets on Physicochemical, Thermal, Rheological, and Mechanical Properties of Biobased and Biodegradable Blends. Polymers 2023, 15, 3622. https://doi.org/10.3390/polym15173622
Tavares L, Sousa LR, Silva SMd, Lima PS, Oliveira JM. Effect of Incorporation of Graphene Nanoplatelets on Physicochemical, Thermal, Rheological, and Mechanical Properties of Biobased and Biodegradable Blends. Polymers. 2023; 15(17):3622. https://doi.org/10.3390/polym15173622
Chicago/Turabian StyleTavares, Loleny, Liliana R. Sousa, Sara Magalhães da Silva, Paulo S. Lima, and J. M. Oliveira. 2023. "Effect of Incorporation of Graphene Nanoplatelets on Physicochemical, Thermal, Rheological, and Mechanical Properties of Biobased and Biodegradable Blends" Polymers 15, no. 17: 3622. https://doi.org/10.3390/polym15173622