
Enhanced Synthesis of Poly(1,4-butanediol itaconate) via Box–Behnken Design Optimization


Abstract
:
1. Introduction
2. Materials and Methods
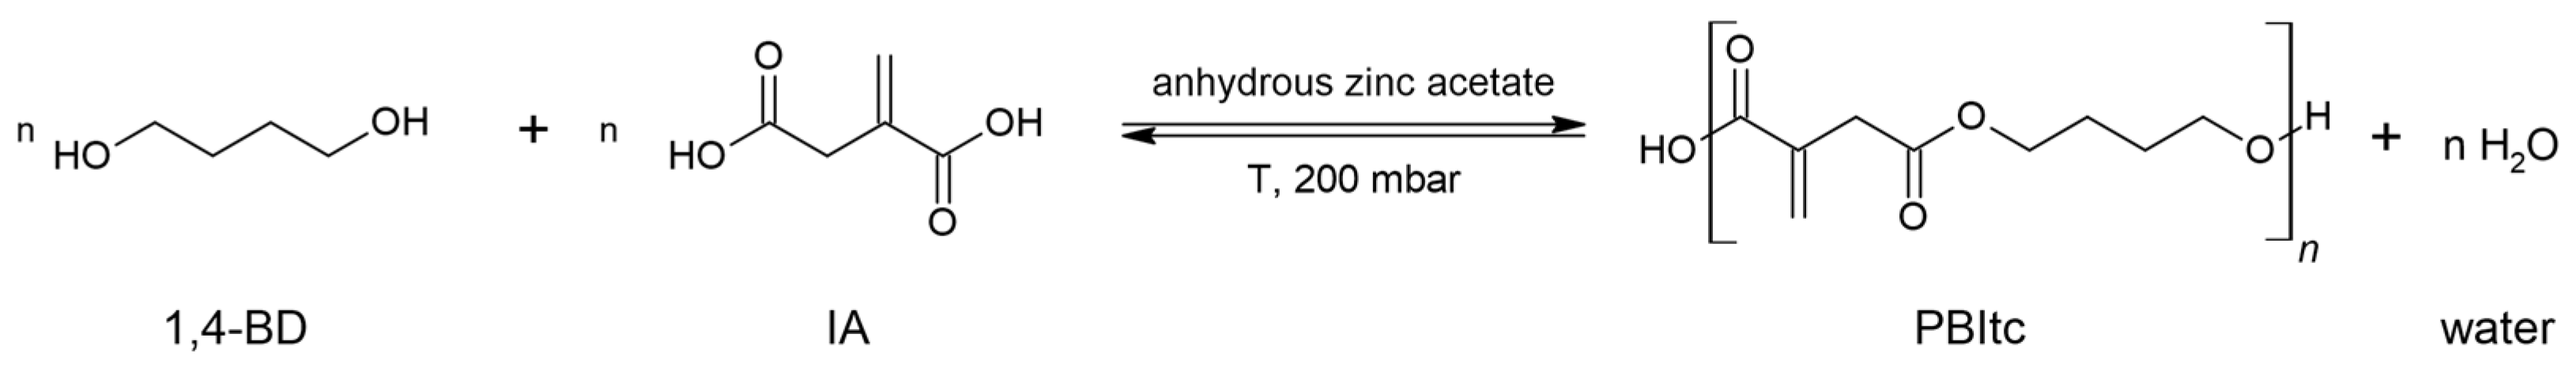
2.1. PBItc Syntheses Procedure
2.2. Amount of the Catalyst Used in the Synthesis
- nIA—the amount of itaconic acid used in the reaction [mol];
- %nCOOH—desired catalyst content relative to the molar number of acid groups [%];
- 183.48—molar mass of the catalyst—zinc acetate.
2.3. Acid Number (ANtit): Conversion of Carboxyl Groups
- V—the volume of 1 M NaOH solution used to titrate the investigated sample [cm3];
- V0—the volume of 1 M NaOH solution used for blank titration [cm3];
- MNaOH—the titer of the solution for the titration (1 M);
- 56.1—the molar mass of KOH [g/mol];
- m—the weight of the investigated sample [g].
- nIA—the amount of itaconic acid used in the synthesis [mol];
- w—weight of the substrates in the reaction system [g].
2.4. Ester Number (ENtit)
- V—the volume of aqueous 1 M HCl solution used to titrate the investigated sample [cm3];
- V0—the volume of aqueous 1 M HCl solution used for blank titration [cm3];
- 56.1—the molar mass of KOH [g/mol];
- m—the weight of the investigated sample [g].
2.5. Esterification Degree by Titration (EDtit)
- ENtit—ester number from titration;
- ANtit—acid number from titration.
2.6. Iodine Number (IN): Percentage of Unreacted C=C Bonds (%C=C IN)
- a—the volume of sodium thiosulphate solution (0.1 M) used for blank titration [cm3];
- b—the volume of the sodium thiosulphate solution (0.1 M) used to titrate the sample [cm3];
- c—the weight of the investigated sample [g].
- 253.
- 81—molar mass of the molecular iodine (I2) [g/mol].
2.7. Rheological Characterisation
- τ—shear stress [Pa];
- τ0—shear limit (yield stress) [Pa];
- ηp—rheological parameter (plastic viscosity) [Pa × s];
- —shear rate [s−1].
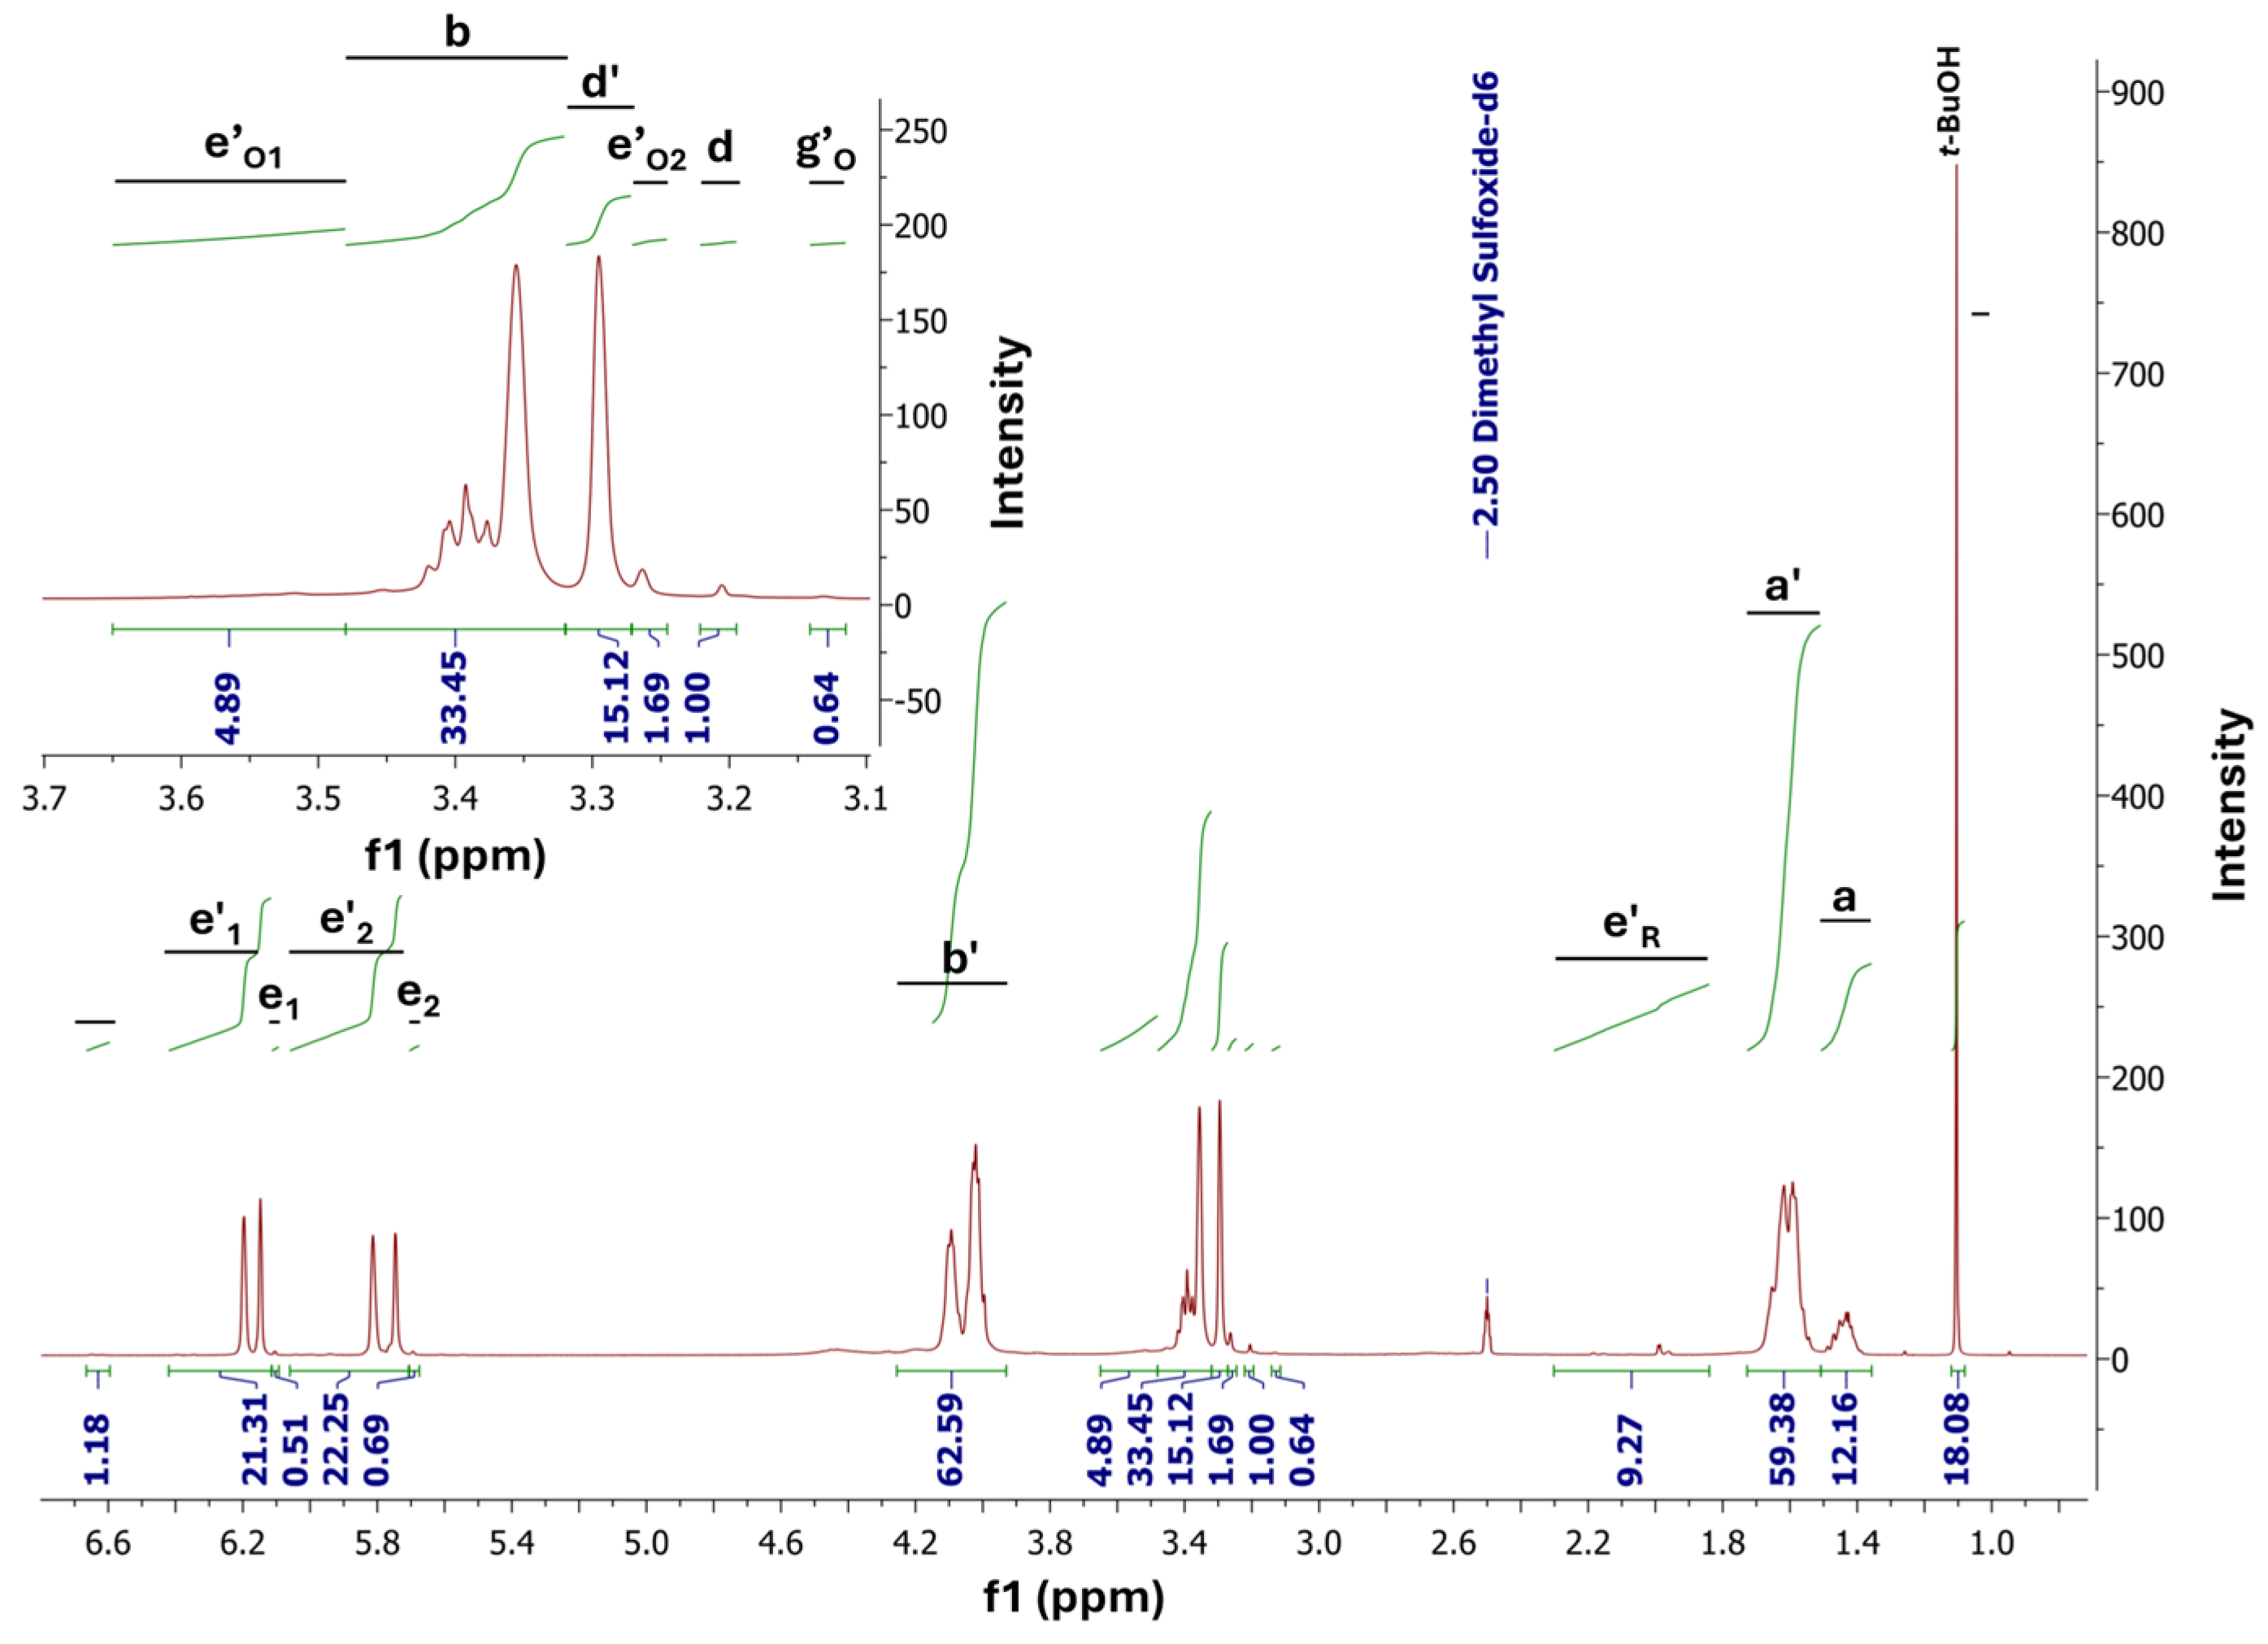
2.8. NMR Analysis
2.9. FTIR Analysis
2.10. Gel Permeation Chromatography (GPC) Analysis
2.11. Differential Scanning Calorimetry (DSC) Analysis
2.12. Thermogravimetry (TG) Analysis
2.13. Viscosity-Visual-Utility Analysis (VVU)
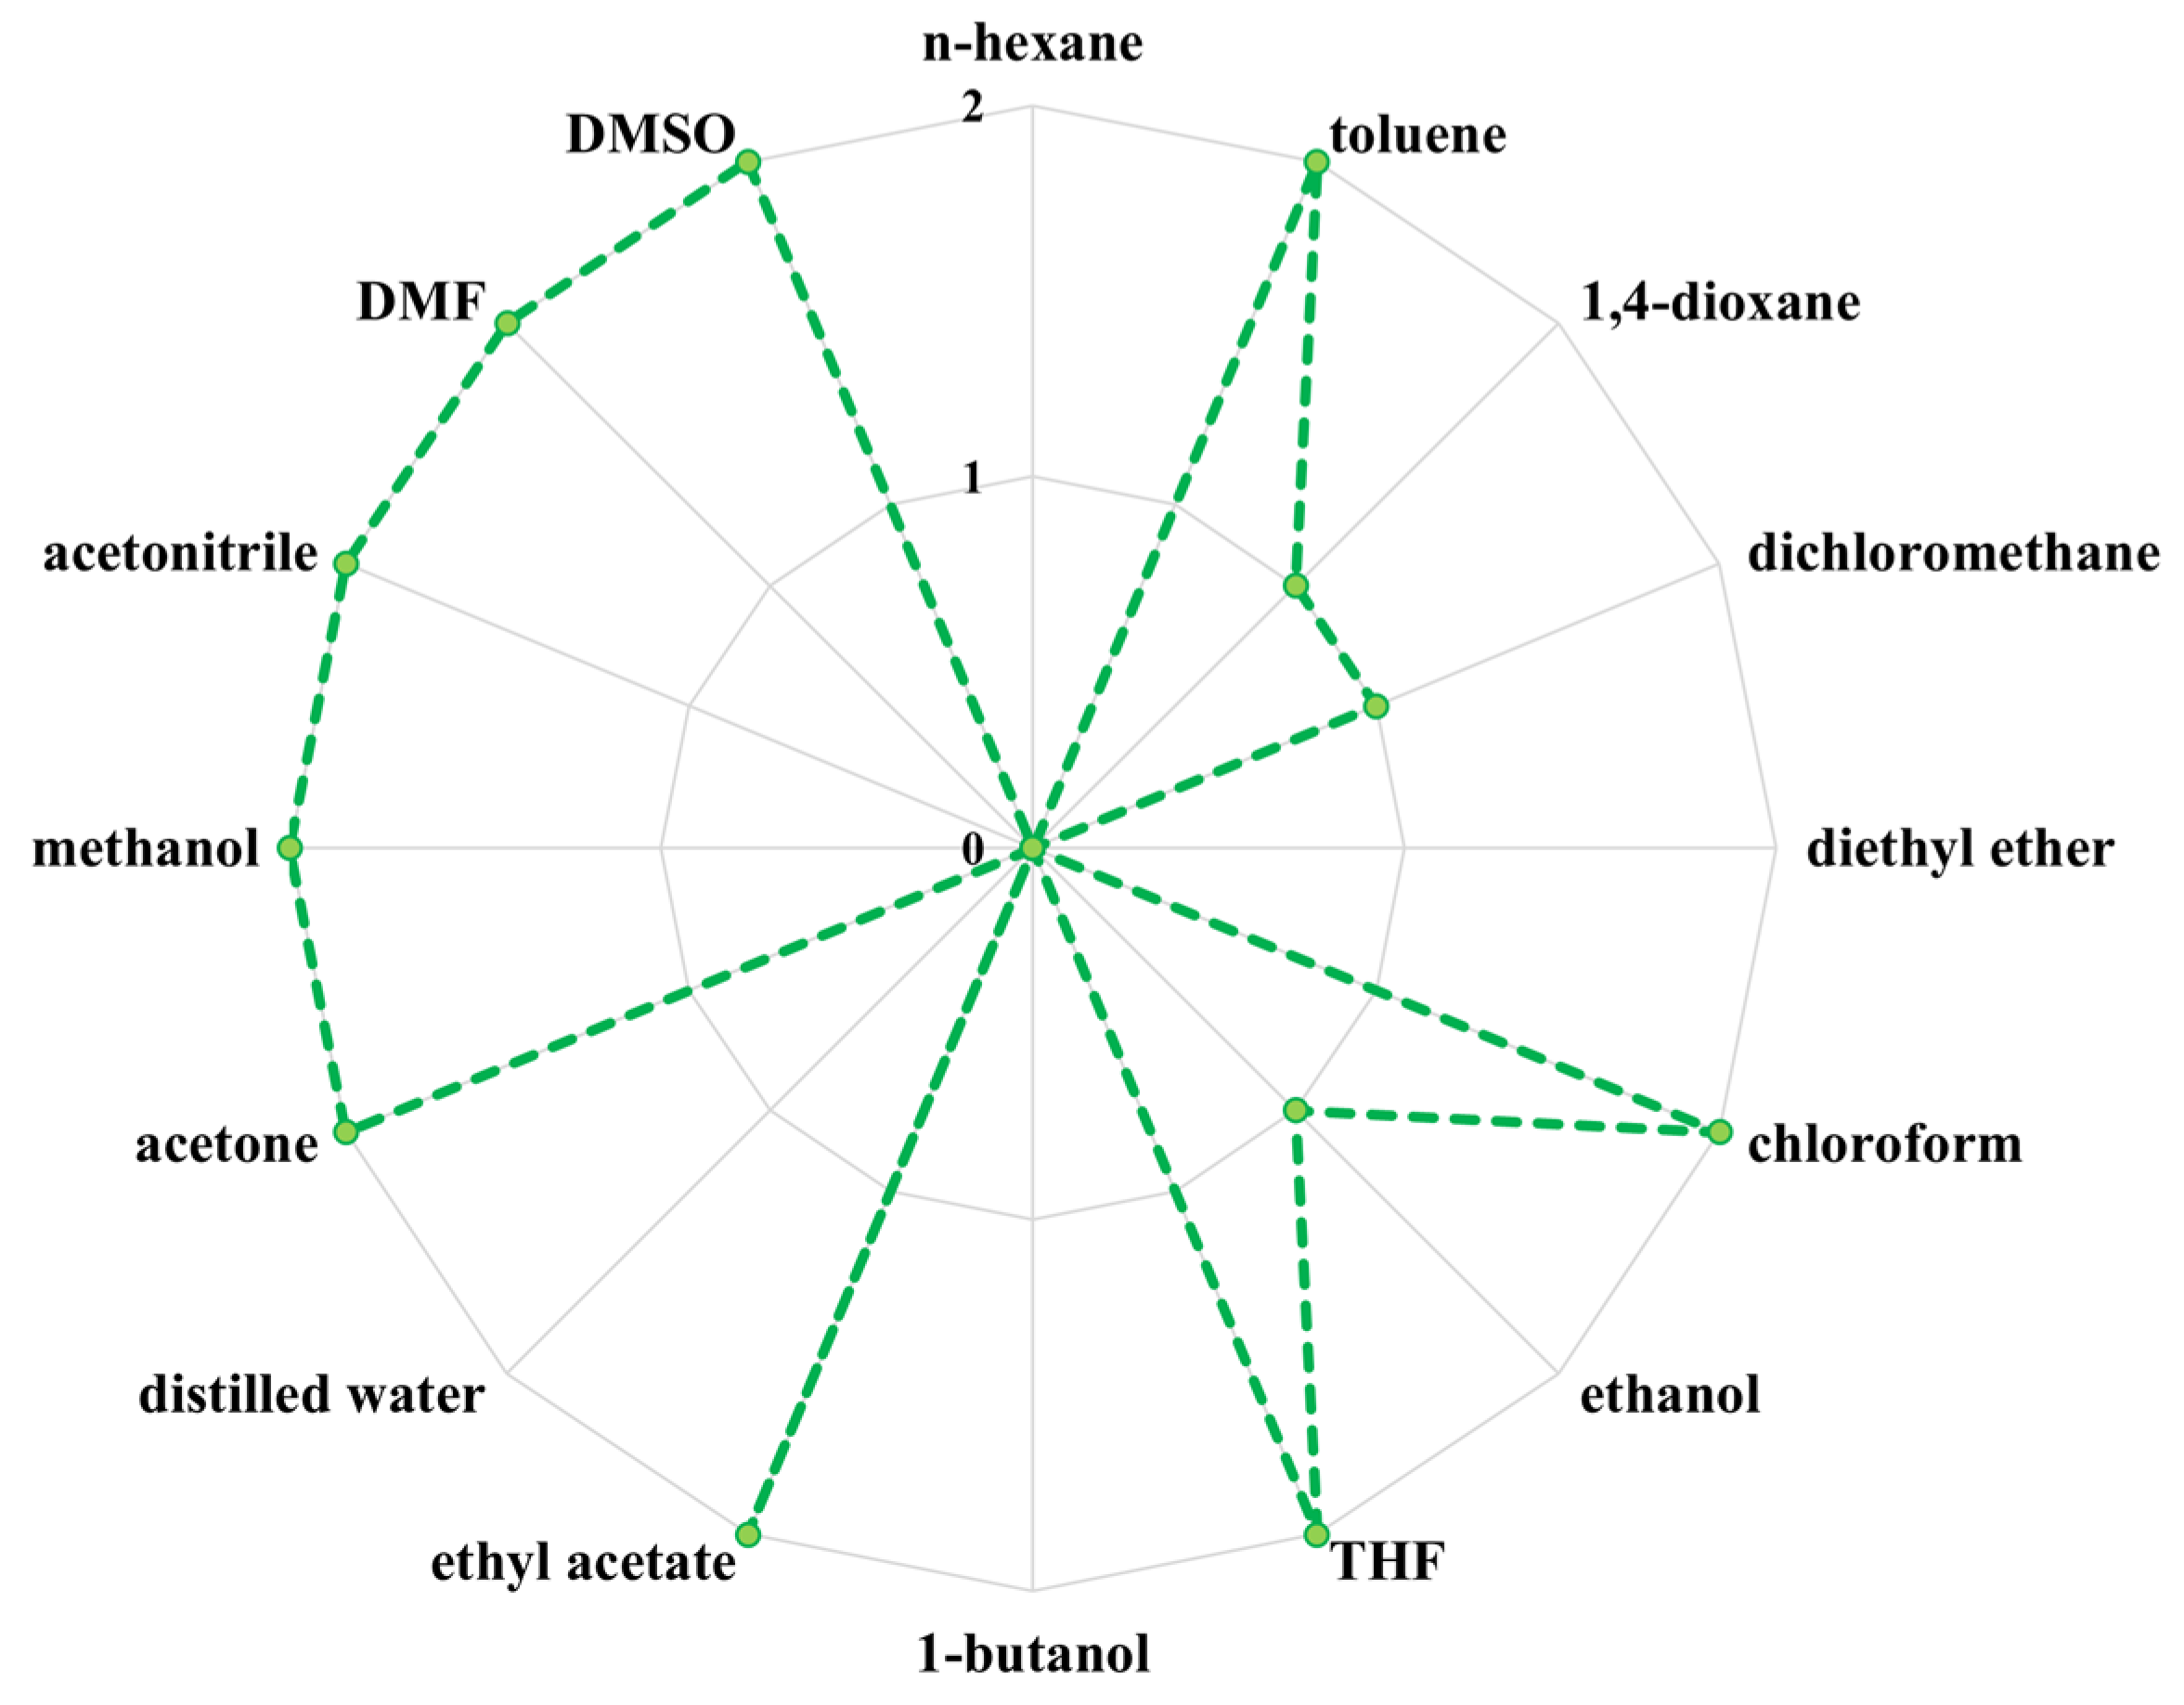
2.14. Solubility Analysis
3. Results and Discussion
3.1. FTIR and NMR Analysis
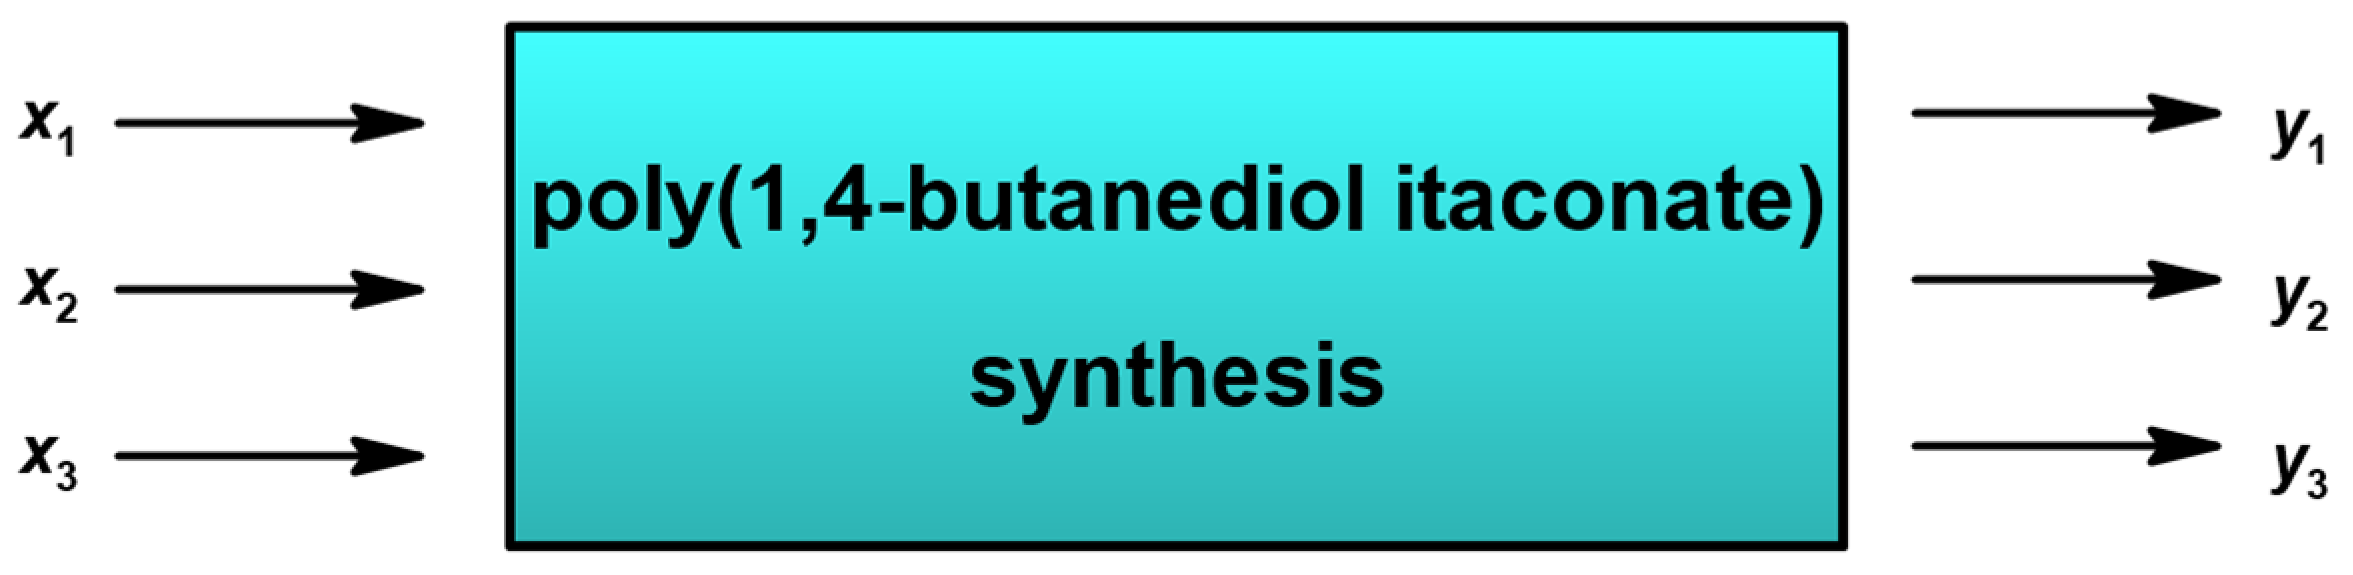
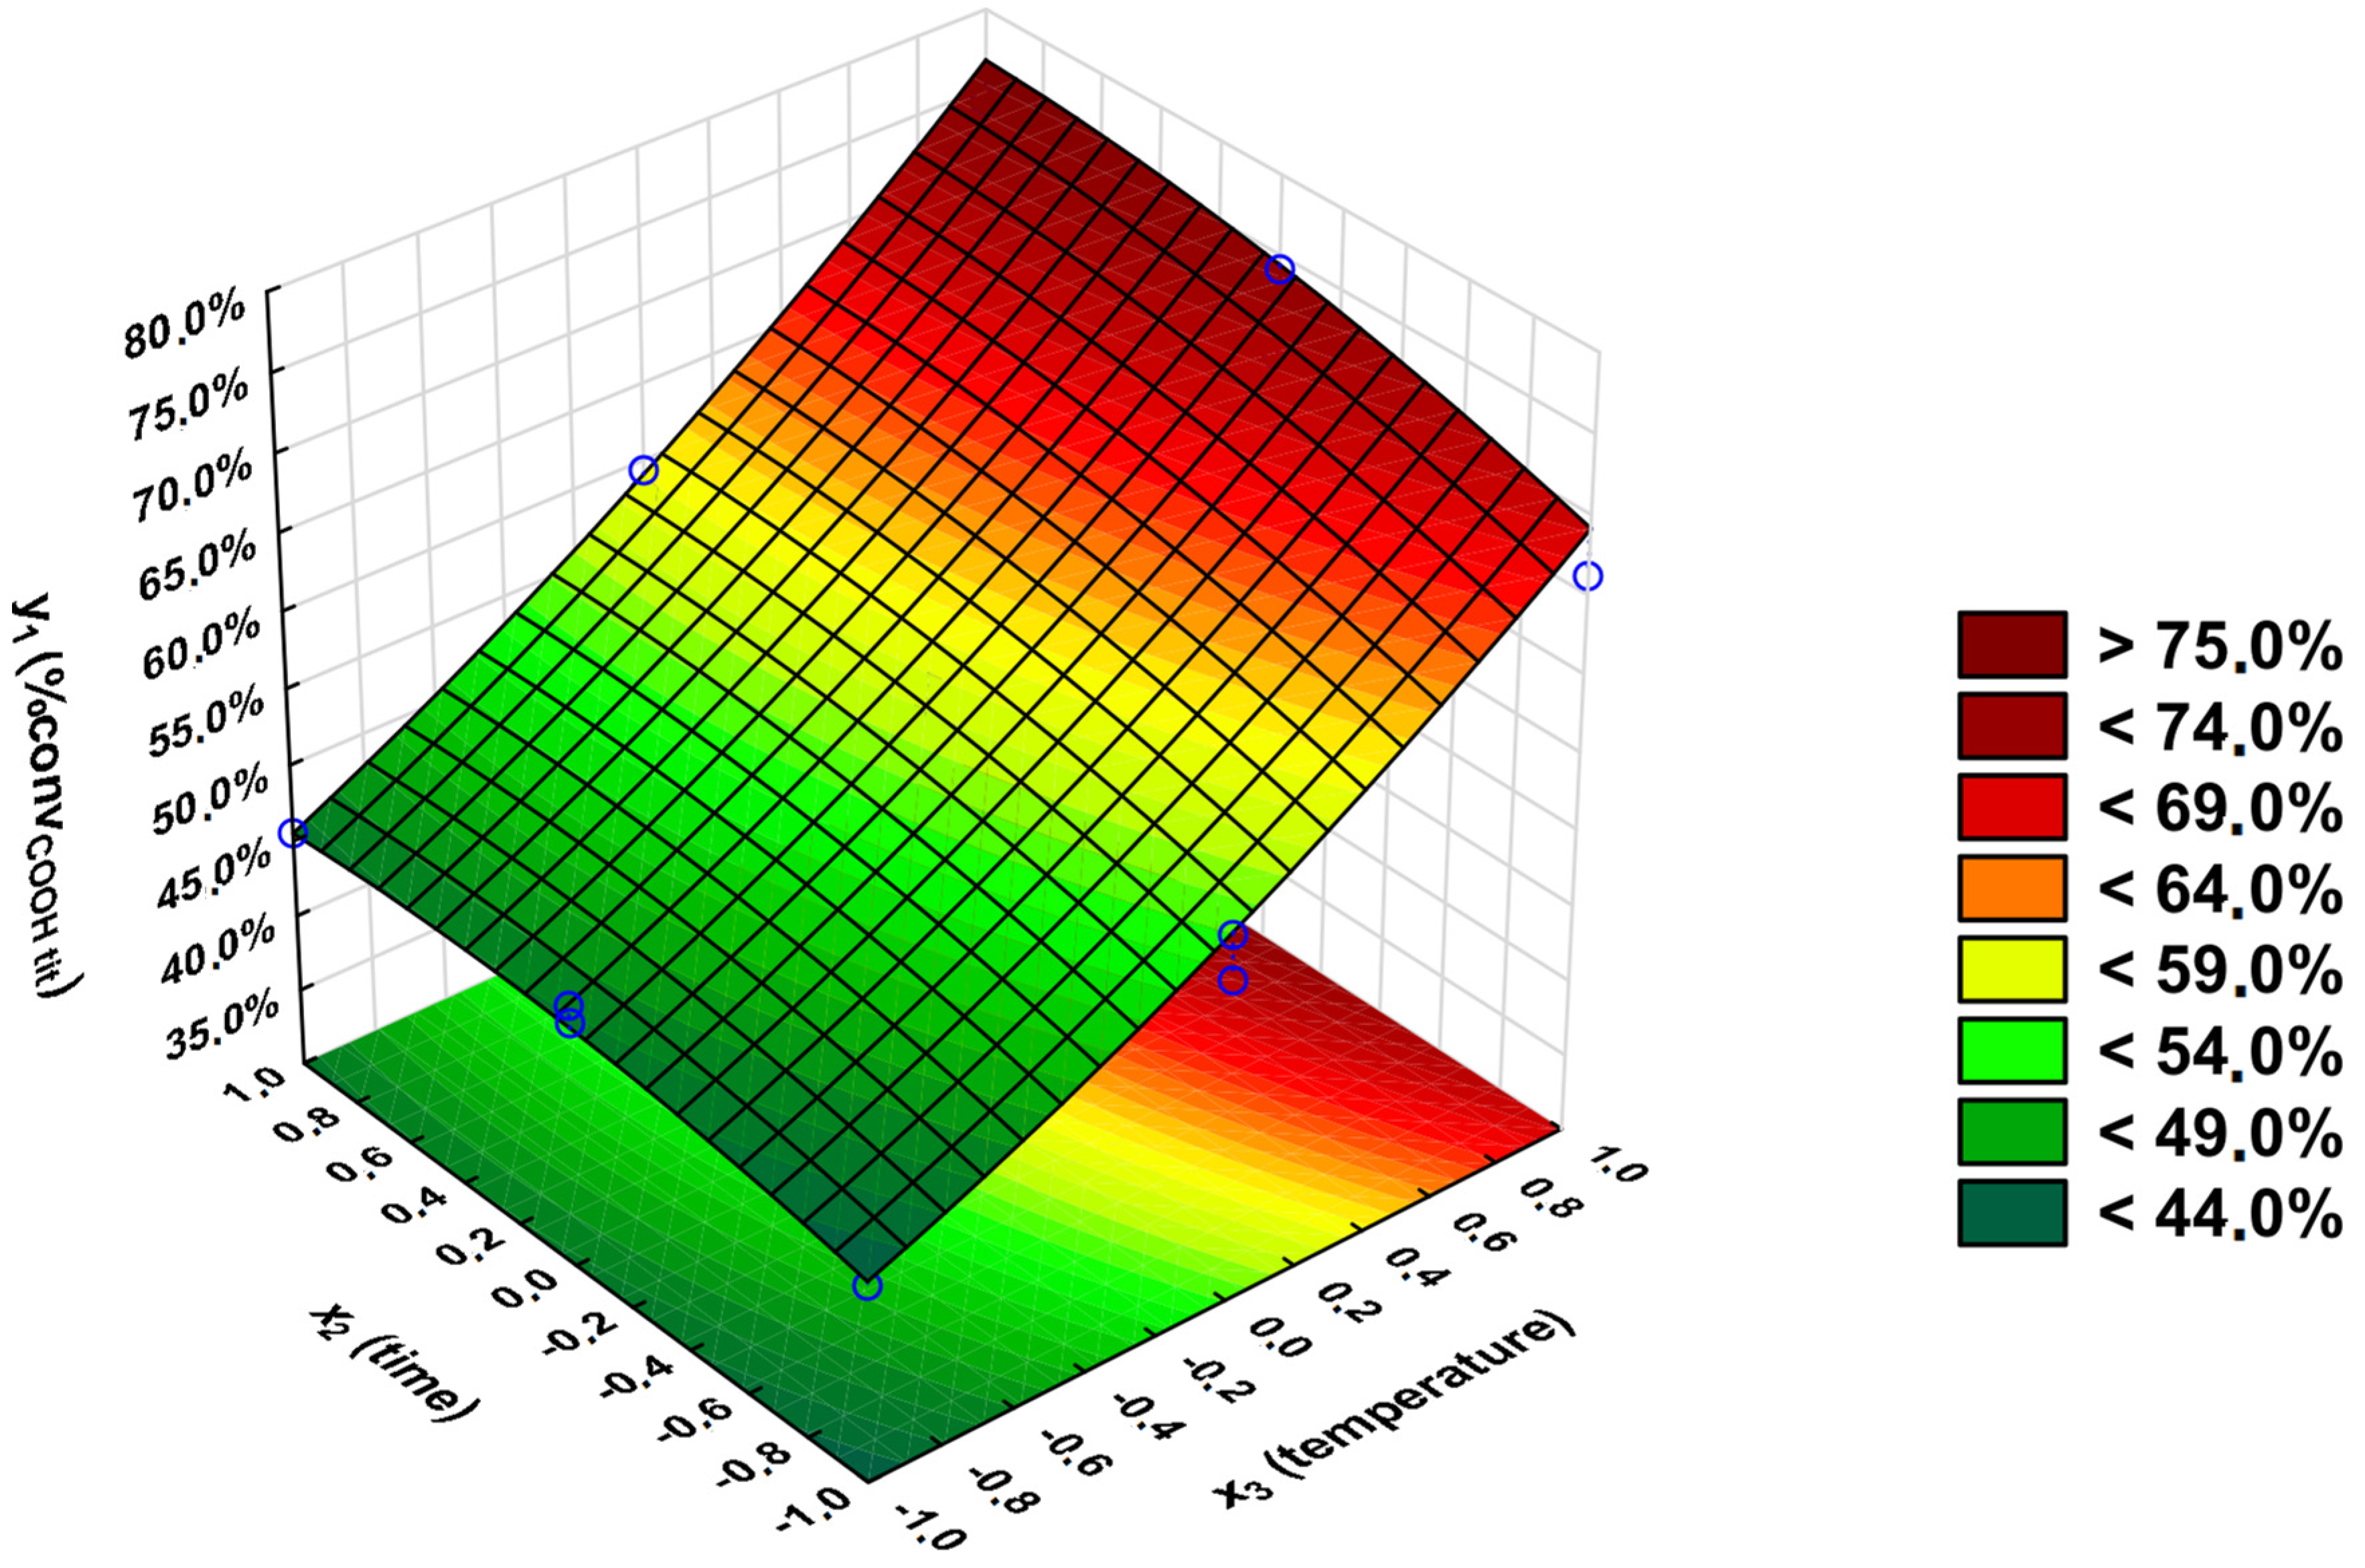
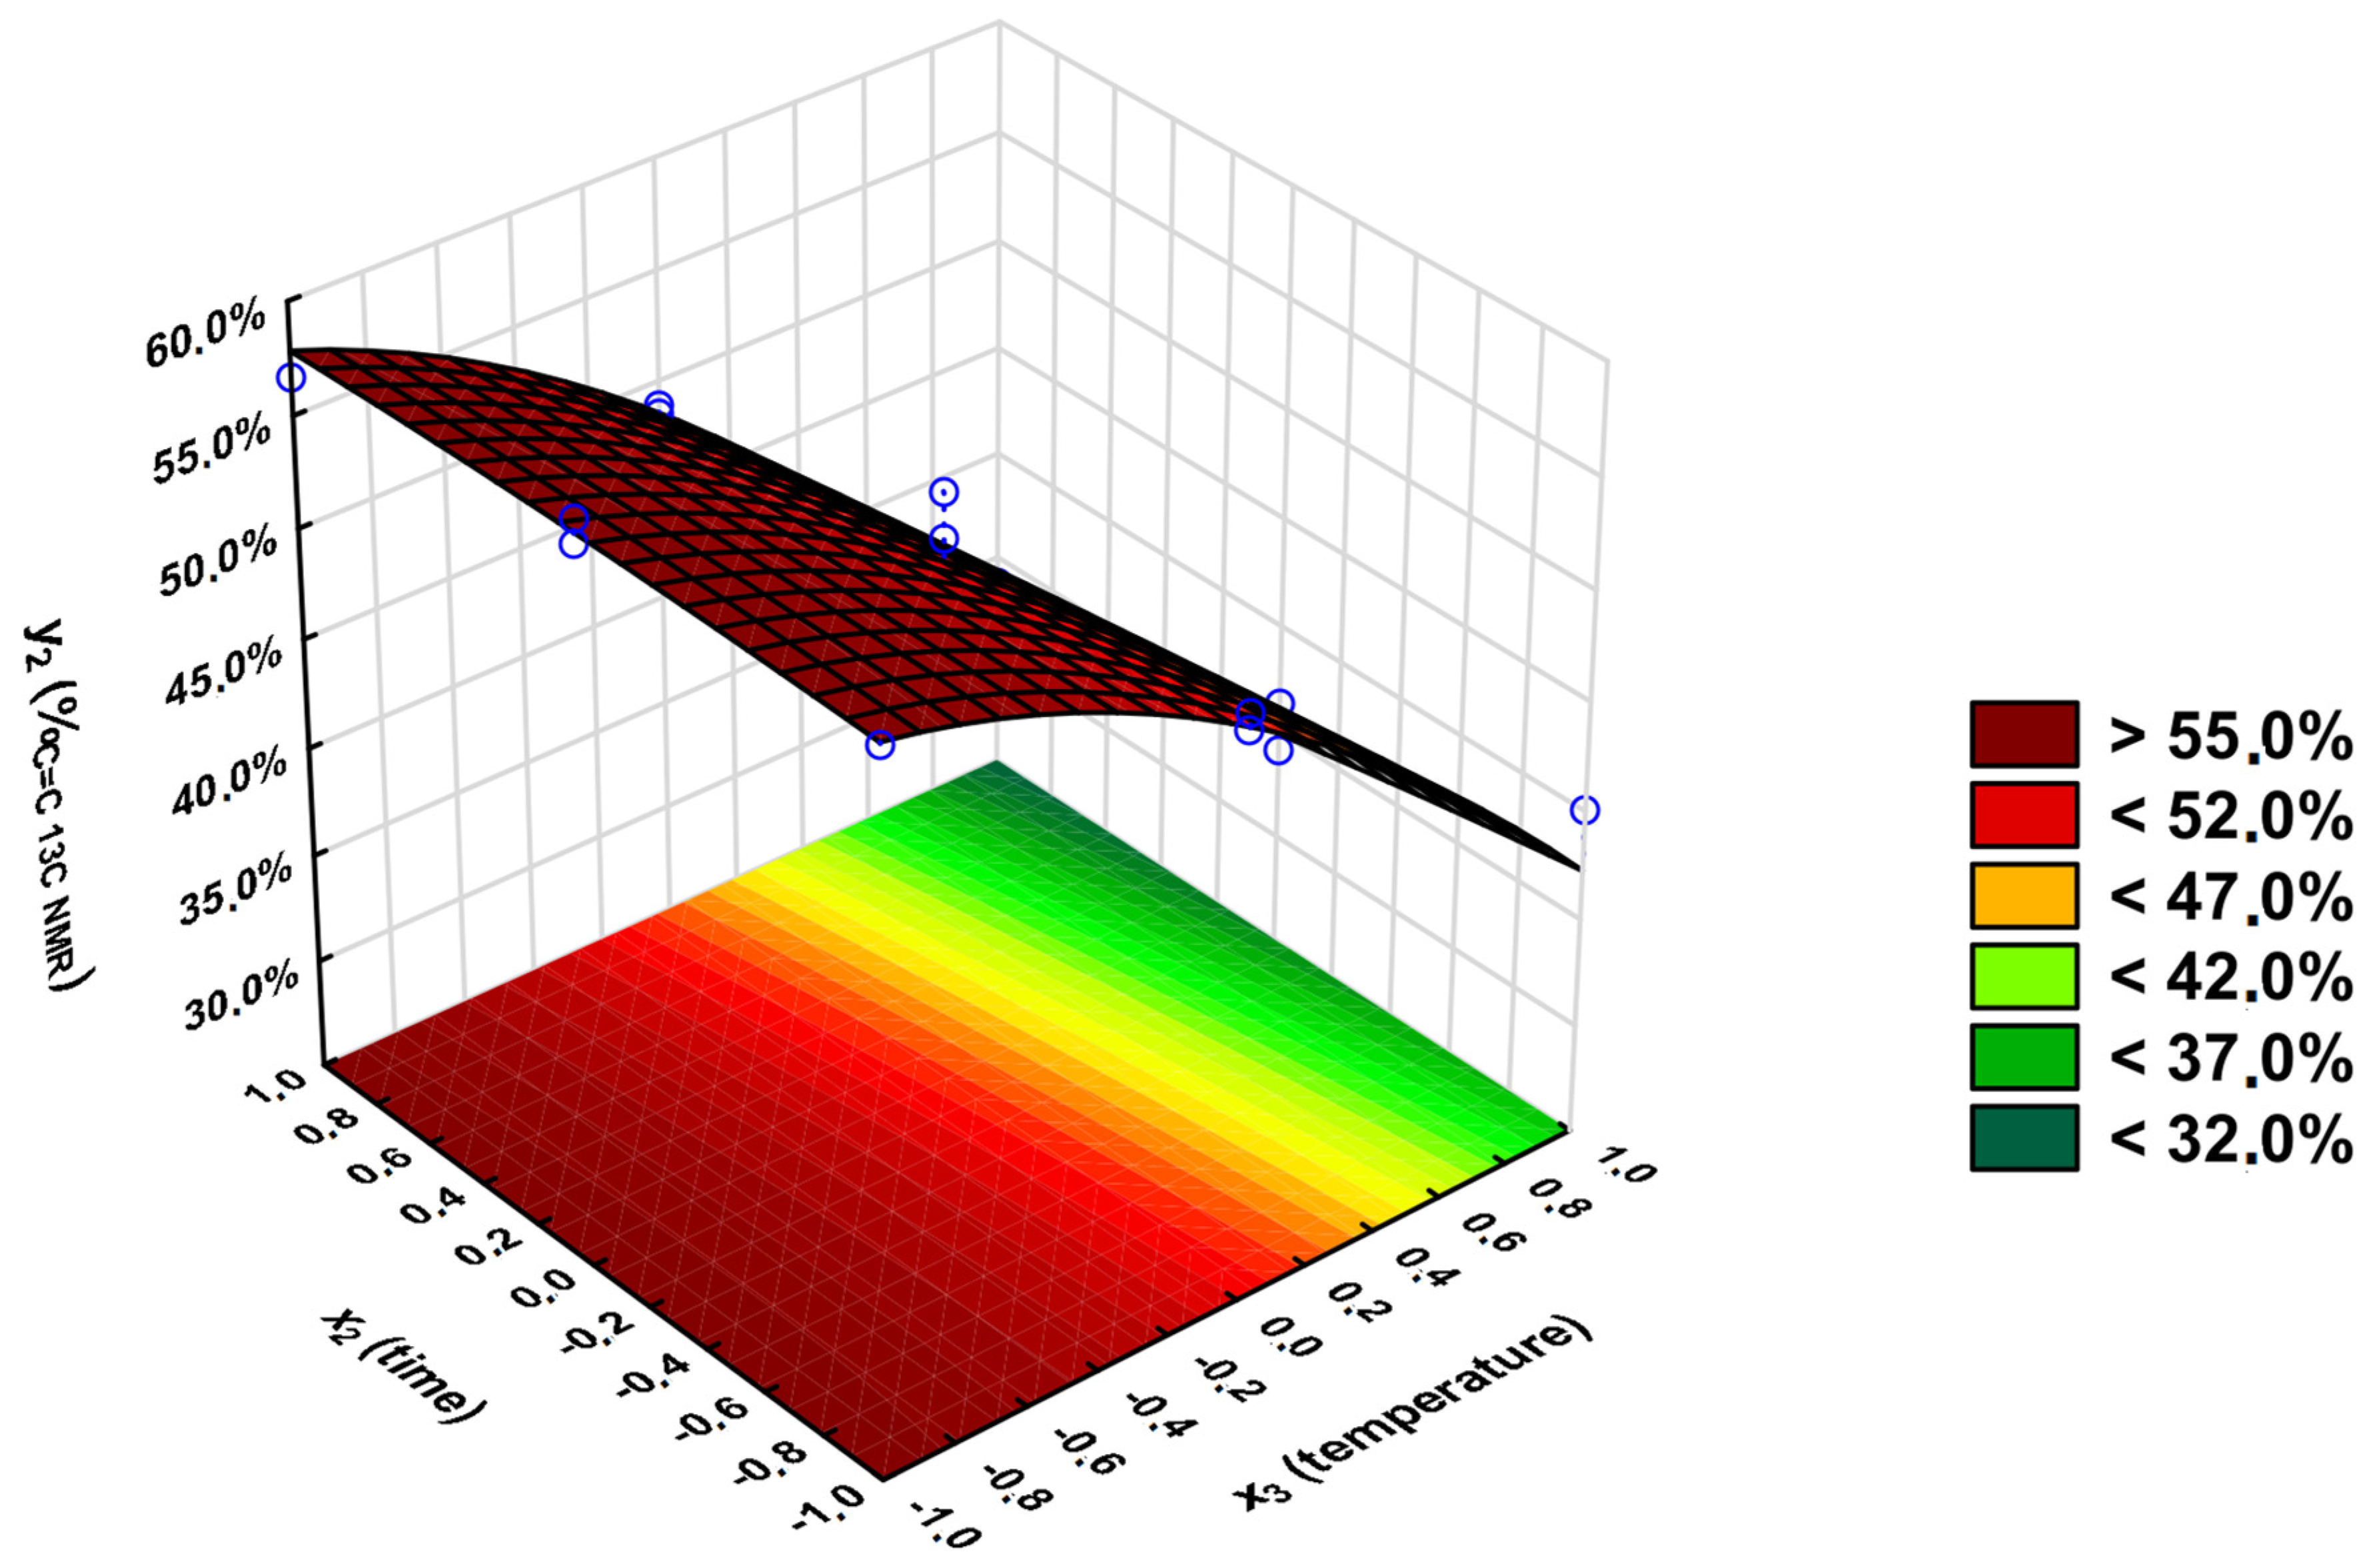
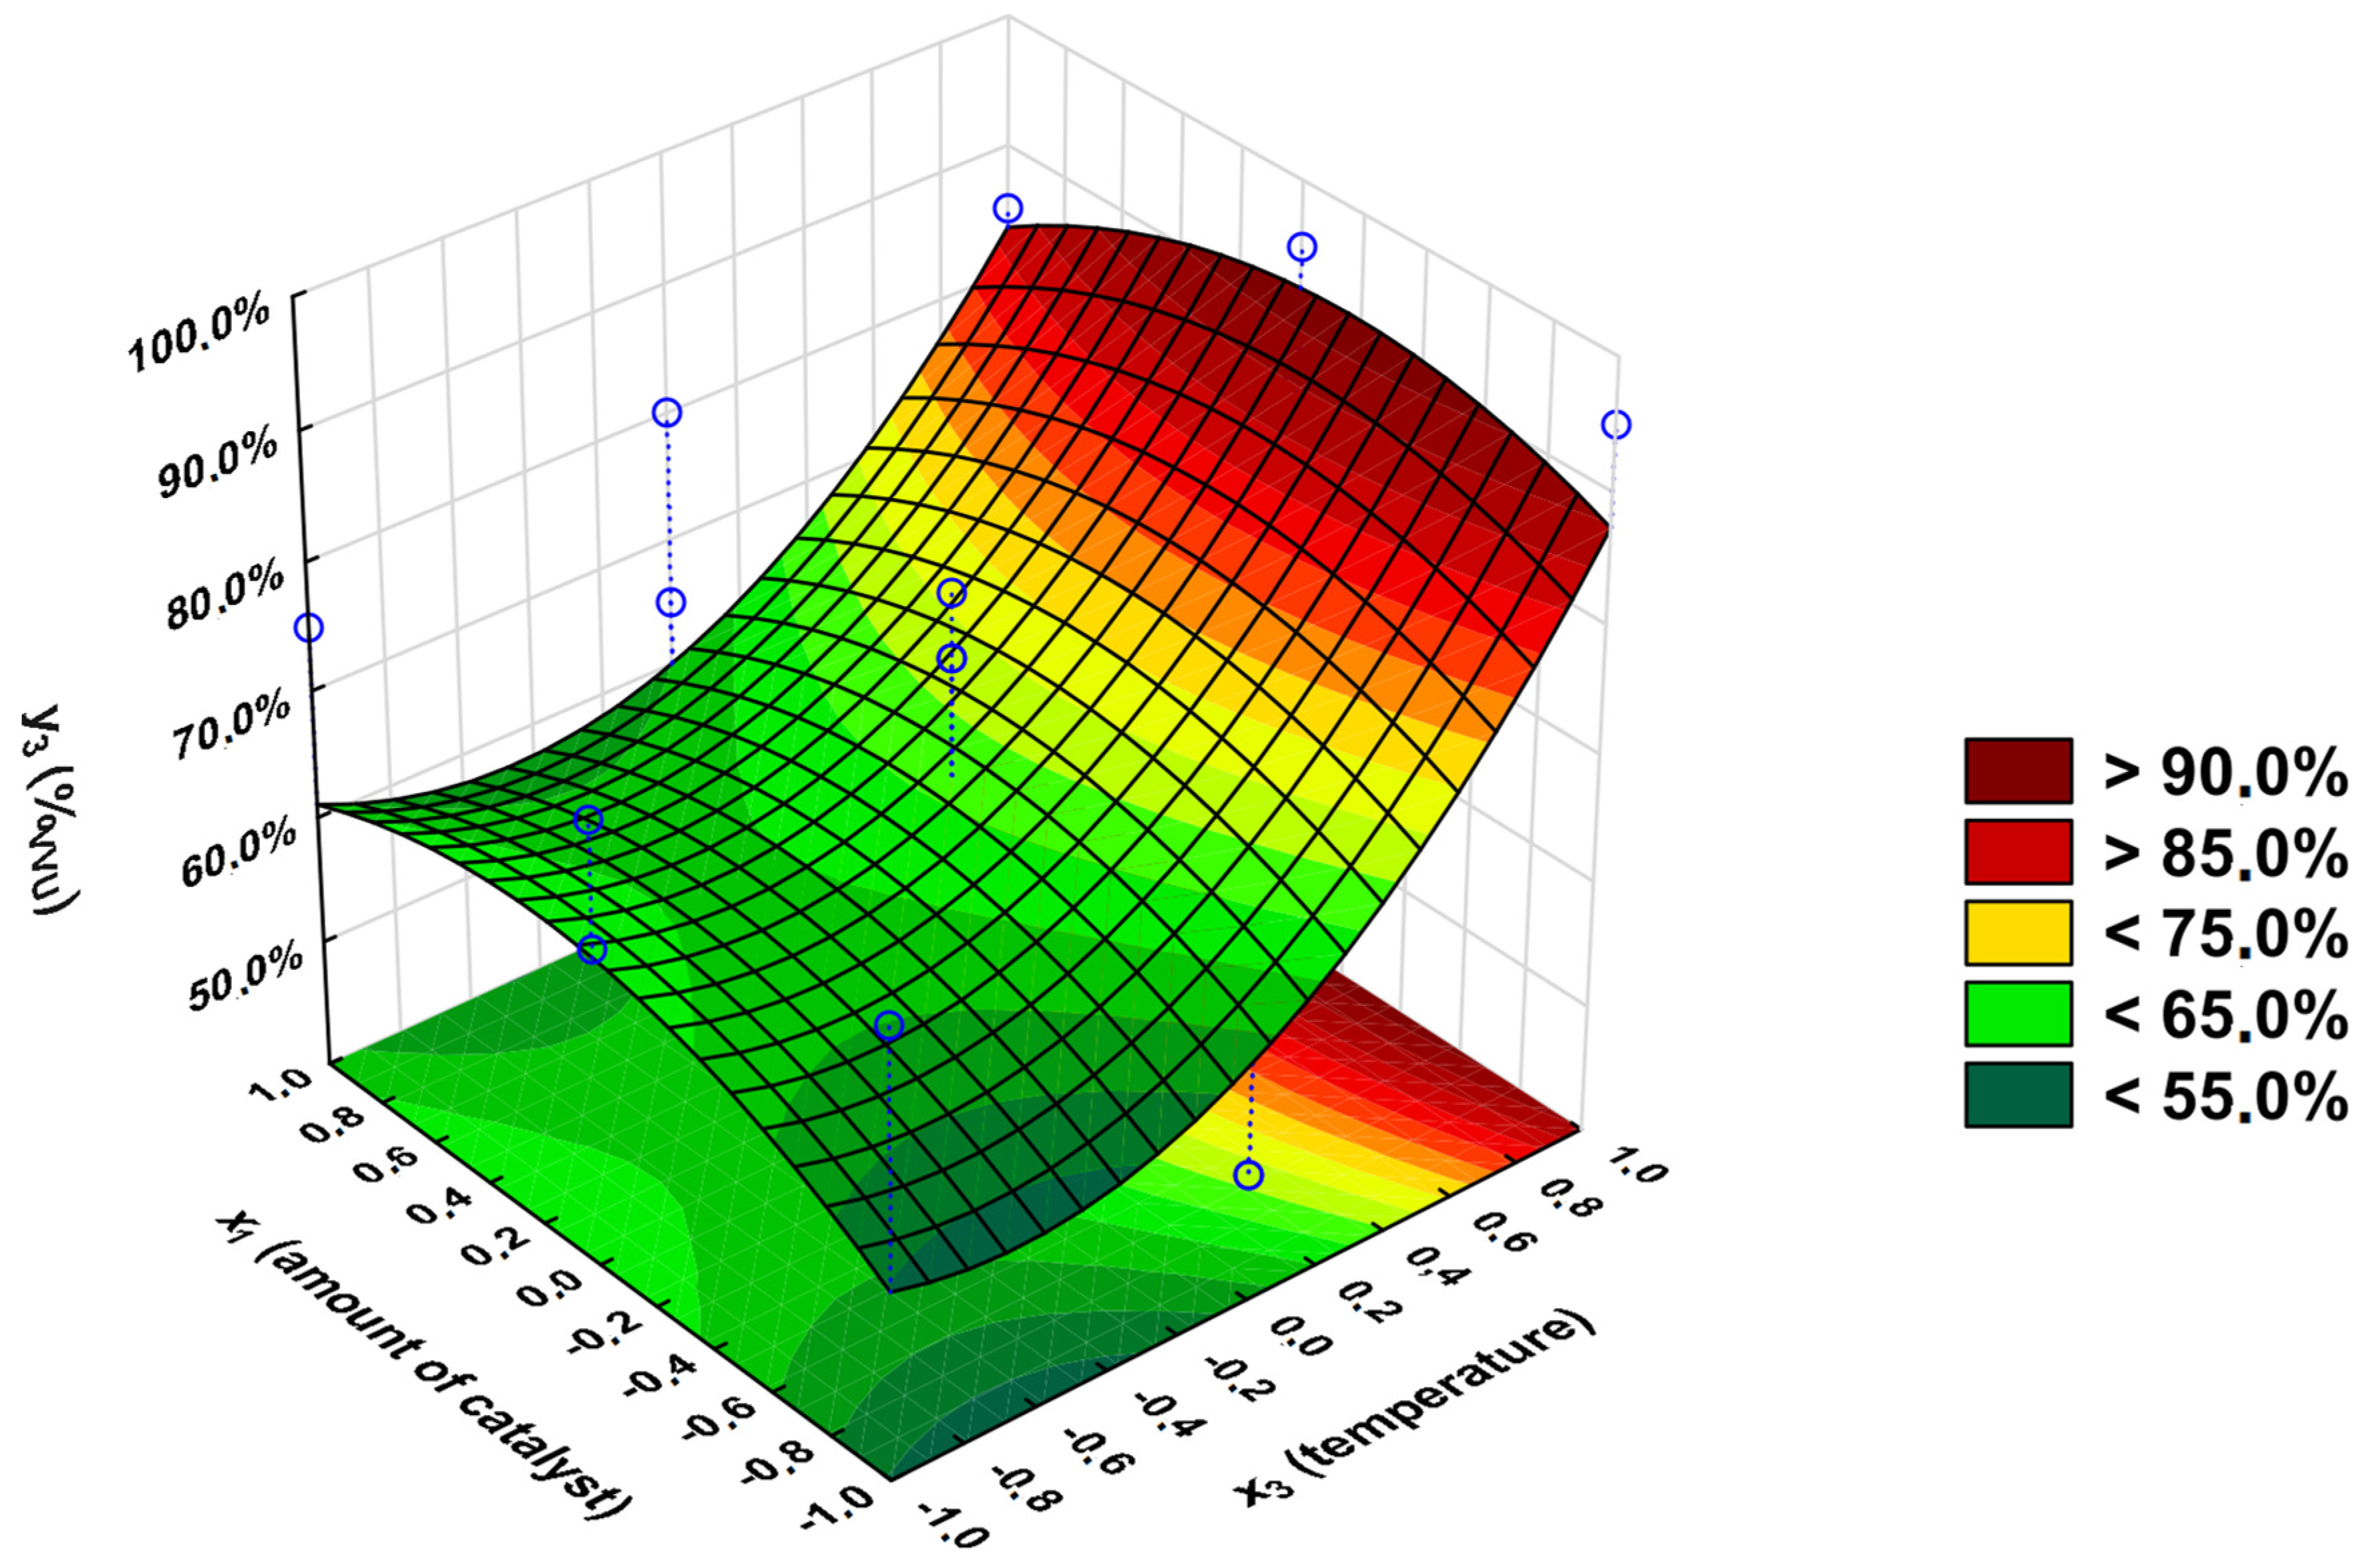
3.2. Statistical Analysis
- x1—amount of the used catalyst (%nCOOH);
- x2—time of the PBItc synthesis (t) [h];
- x3—temperature of the PBItc synthesis (T), [°C];
- y1—percentage conversion of carboxyl groups -COOH (convCOOH tit) (calculated from the ANtit);
- y2—percentage of unreacted unsaturated C=C double bonds (%C=C 13C NMR) (calculated from the 13C NMR-NOE spectra analysis);
- y3—Viscosity-Visual-Utility analysis (%VVU).
3.3. Optimal Conditions Synthesis
4. Conclusions
Supplementary Materials
Author Contributions
Funding
Institutional Review Board Statement
Data Availability Statement
Acknowledgments
Conflicts of Interest
Abbreviations
References
- O’Brien, F.J. Biomaterials & Scaffolds for Tissue Engineering. Materials Today 2011, 14, 88–95. [Google Scholar] [CrossRef]
- Godar, D.E.; Gurunathan, C.; Ilev, I. 3D Bioprinting with UVA1 Radiation and Photoinitiator Irgacure 2959: Can the ASTM Standard L929 Cells Predict Human Stem Cell Cytotoxicity? Photochem. Photobiol. 2019, 95, 581–586. [Google Scholar] [CrossRef] [PubMed]
- Ozbolat, I.T.; Hospodiuk, M. Current Advances and Future Perspectives in Extrusion-Based Bioprinting. Biomaterials 2016, 76, 321–343. [Google Scholar] [CrossRef]
- Gu, Y.; Forget, A.; Shastri, V.P. Biobridge: An Outlook on Translational Bioinks for 3D Bioprinting. Adv. Sci. 2022, 9, 2103469. [Google Scholar] [CrossRef] [PubMed]
- Zhang, K.; Xue, K.; Loh, X.J. Thermo-Responsive Hydrogels: From Recent Progress to Biomedical Applications. Gels 2021, 7, 77. [Google Scholar] [CrossRef] [PubMed]
- Mahtabi, R.; Benisi, S.Z.; Goodarzi, V.; Shojaei, S. Application of Biodegradable Bone Scaffolds Based on Poly(Lactic Acid)/Poly(Glycerol Succinic Acid) Containing Nano-Hydroxyapatite. J. Polym. Environ. 2023, 32, 548–559. [Google Scholar] [CrossRef]
- Maturi, M.; Spanu, C.; Maccaferri, E.; Locatelli, E.; Benelli, T.; Mazzocchetti, L.; Sambri, L.; Giorgini, L.; Franchini, M.C. (Meth)Acrylate-Free Three-Dimensional Printing of Bio-Derived Photocurable Resins with Terpene- and Itaconic Acid-Derived Poly(Ester-Thioether)S. ACS Sustain. Chem. Eng. 2023, 11, 17285–17298. [Google Scholar] [CrossRef]
- Cui, C.; Zhang, S. Synthesis, Characterization and Performance Evaluation of an Environmentally Benign Scale Inhibitor IA/AMPS Co-Polymer. New J. Chem. 2019, 43, 9472–9482. [Google Scholar] [CrossRef]
- Giacobazzi, G.; Gioia, C.; Colonna, M.; Celli, A. Thia-Michael Reaction for a Thermostable Itaconic-Based Monomer and the Synthesis of Functionalized Biopolyesters. ACS Sustain. Chem. Eng. 2019, 7, 5553–5559. [Google Scholar] [CrossRef]
- Ouyang, L.; Highley, C.B.; Rodell, C.B.; Sun, W.; Burdick, J.A. 3D Printing of Shear-Thinning Hyaluronic Acid Hydrogels with Secondary Cross-Linking. ACS Biomater. Sci. Eng. 2016, 2, 1743–1751. [Google Scholar] [CrossRef]
- Schoon, I.; Kluge, M.; Eschig, S.; Robert, T. Catalyst Influence on Undesired Side Reactions in the Polycondensation of Fully Bio-Based Polyester Itaconates. Polymers 2017, 9, 693. [Google Scholar] [CrossRef] [PubMed]
- Dai, J.; Ma, S.; Wu, Y.; Zhu, J.; Liu, X. High Bio-Based Content Waterborne UV-Curable Coatings with Excellent Adhesion and Flexibility. Prog. Org. Coat. 2015, 87, 197–203. [Google Scholar] [CrossRef]
- Brännström, S.; Finnveden, M.; Johansson, M.; Martinelle, M.; Malmström, E. Itaconate Based Polyesters: Selectivity and Performance of Esterification Catalysts. Eur. Polym. J. 2018, 103, 370–377. [Google Scholar] [CrossRef]
- Brännström, S.; Malmström, E.; Johansson, M. Biobased UV-Curable Coatings Based on Itaconic Acid. J. Coat. Technol. Res. 2017, 14, 851–861. [Google Scholar] [CrossRef]
- Prabakaran, R.; Marie, J.M.; Xavier, A.J.M. Biobased Unsaturated Polyesters Containing Castor Oil-Derived Ricinoleic Acid and Itaconic Acid: Synthesis. ACS Appl. Bio Mater. 2020, 3, 5708–5721. [Google Scholar] [CrossRef]
- Fertier, L.; Koleilat, H.; Stemmelen, M.; Giani, O.; Joly-Duhamel, C.; Lapinte, V.; Robin, J.J. The Use of Renewable Feedstock in UV-Curable Materials-A New Age for Polymers and Green Chemistry. Prog. Polym. Sci. 2013, 38, 932–962. [Google Scholar] [CrossRef]
- Guarneri, A.; Cutifani, V.; Cespugli, M.; Pellis, A.; Vassallo, R.; Asaro, F.; Ebert, C.; Gardossi, L. Functionalization of Enzymatically Synthesized Rigid Poly(Itaconate)s via Post-Polymerization Aza-Michael Addition of Primary Amines. Adv. Synth. Catal. 2019, 361, 2559–2573. [Google Scholar] [CrossRef]
- Kandil, H.; Ekram, B.; Abo-Zeid, M.A.M.; Abd El-Hady, B.M.; Amin, A. Hydroxyapatite/Hyperbranched Polyitaconic Acid/Chitosan Composite Scaffold for Bone Tissue Engineering. Polym. Compos. 2023, 44, 5633–5646. [Google Scholar] [CrossRef]
- Qiao, F.; Dong, C.; Yao, D.; Xu, Z.; Lv, Y. 4-Octyl Itaconate Modified Demineralized Bone Matrix Scaffold Improves Bone Repair by Regulating Early Inflammation. Chem. Eng. J. 2021, 425, 131490. [Google Scholar] [CrossRef]
- Corici, L.; Pellis, A.; Ferrario, V.; Ebert, C.; Cantone, S.; Gardossi, L. Understanding Potentials and Restrictions of Solvent-Free Enzymatic Polycondensation of Itaconic Acid: An Experimental and Computational Analysis. Adv. Synth. Catal. 2015, 357, 1763–1774. [Google Scholar] [CrossRef]
- Werpy, T.; Petersen, G. Top Value Added Chemicals from Biomass Volume I—Results of Screening for Potential Candidates from Sugars and Synthesis Gas; National Renewable Energy Laboratory: Golden, CO, USA, 2004.
- Perković, I.; Beus, M.; Schols, D.; Persoons, L.; Zorc, B. Itaconic Acid Hybrids as Potential Anticancer Agents. Mol. Divers. 2022, 26, 1–14. [Google Scholar] [CrossRef] [PubMed]
- Shou, Y.; Campbell, S.B.; Lam, A.; Lausch, A.J.; Santerre, J.P.; Radisic, M.; Davenport Huyer, L. Toward Renewable and Functional Biomedical Polymers with Tunable Degradation Rates Based on Itaconic Acid and 1,8-Octanediol. ACS Appl. Polym. Mater. 2021, 3, 1943–1955. [Google Scholar] [CrossRef]
- Yehye, W.A.; Rahman, N.A.; Ariffin, A.; Abd Hamid, S.B.; Alhadi, A.A.; Kadir, F.A.; Yaeghoobi, M. Understanding the Chemistry behind the Antioxidant Activities of Butylated Hydroxytoluene (BHT): A Review. Eur. J. Med. Chem. 2015, 101, 295–312. [Google Scholar] [CrossRef] [PubMed]
- Boudghane, L.C.; Bouabdellah, N.; Bouanane, S.; Ahmed, F.Z.B.; Laroussi, M.A.; Bendiaf, Y.; Nas, F.; Merzouk, H. Phytochemical, Antioxidant, and Antimicrobial Attributes of Different Extracts of Seeds: The Algerian Variety of Dates ‘Deglet Nour’ (Phoenix dactylifera L.). Vegetos 2023, 36, 559–565. [Google Scholar] [CrossRef]
- Bouftira, I. Butylated Hydroxytoluene (BHT): A Review. Quantum J. Med. Health Sci. 2023, 2, 1–13. [Google Scholar] [CrossRef]
- Sapota, A.; Skrzypińska-Gawrysiak, M. 4-Metoksyfenol - Dokumentacja Dopuszczalnych Wielkości Narażenia Zawodowego. Podstawy I Metod. Oceny Sr. Pr. 2007, 23, 101–119. [Google Scholar] [CrossRef]
- Achar, J.C.; Nam, G.; Jung, J.; Klammler, H.; Mohamed, M.M. Microbubble Ozonation of the Antioxidant Butylated Hydroxytoluene: Degradation Kinetics and Toxicity Reduction. Environ. Res. 2020, 186, 109496. [Google Scholar] [CrossRef]
- Winkler, M.; Lacerda, T.M.; Mack, F.; Meier, M.A.R. Renewable Polymers from Itaconic Acid by Polycondensation and Ring-Opening-Metathesis Polymerization. Macromolecules 2015, 48, 1398–1403. [Google Scholar] [CrossRef]
- Robert, T.; Friebel, S. Itaconic Acid-a Versatile Building Block for Renewable Polyesters with Enhanced Functionality. Green Chem. 2016, 18, 2922–2934. [Google Scholar] [CrossRef]
- Zerkowski, J.A.; Solaiman, D.K.Y. 2-Fatty Acrylic Acids: New Highly Derivatizable Lipophilic Platform Molecules. JAOCS J. Am. Oil Chem. Soc. 2014, 91, 1225–1233. [Google Scholar] [CrossRef]
- Sokołowska, M.; Fray, M. El “Green” Poly(Butylene Succinate-Co-Dilinoleic Succinate) Copolymers Synthesized Using Candida Antarctica Lipase B (CAL-B) as Biocatalyst. Proceedings 2021, 69, 33. [Google Scholar]
- Zvosec, D.L.; Smith, S.W.; McCutcheon, J.R.; Spillane, J.; Hall, B.J.; Peacock, E.A. Adverse Events, Including Death, Associated with the Use of 1,4-Butanediol. N. Engl. J. Med. 2001, 344, 87–94. [Google Scholar] [CrossRef]
- Sheldon, R.A. Green and Sustainable Manufacture of Chemicals from Biomass: State of the Art. Green Chem. 2014, 16, 950–963. [Google Scholar] [CrossRef]
- Schep, L.J.; Knudsen, K.; Slaughter, R.J.; Vale, J.A.; Mégarbane, B. The Clinical Toxicology of Gamma-Hydroxybutyrate, Gamma-Butyrolactone and 1,4-Butanediol. Clin. Toxicol. 2012, 50, 458–470. [Google Scholar] [CrossRef] [PubMed]
- Sokołowska, M.; Marchwiana, M.; Fray, M. El Vitamin E-Loaded Polymeric Nanoparticles from Biocompatible Adipate-Based Copolymer Obtained Using the Nanoprecipitation Method. Polim./Polym. 2022, 67, 11–12. [Google Scholar] [CrossRef]
- Li, H.; Chang, J.; Cao, A.; Wang, J. In Vitro Evaluation of Biodegradable Poly(Butylene Succinate) as a Novel Biomaterial. Macromol. Biosci. 2005, 5, 433–440. [Google Scholar] [CrossRef]
- Niedźwiedź, M.J.; Demirci, G.; Kantor-Malujdy, N.; Sobolewski, P.; El Fray, M. Fatty-Acid-Derived Ester-Urethane Macromonomers Synthesized Using Bismuth and Zinc Catalysts. Eur. Polym. J. 2022, 170, 111168. [Google Scholar] [CrossRef]
- Bakrani Balani, S.; Mokhtarian, H.; Salmi, T.; Coatanéa, E. An Investigation of the Influence of Viscosity and Printing Parameters on the Extrudate Geometry in the Material Extrusion Process. Polymers 2023, 15, 2202. [Google Scholar] [CrossRef]
- Farmer, T.J.; Castle, R.L.; Clark, J.H.; Macquarrie, D.J. Synthesis of Unsaturated Polyester Resins from Various Bio-Derived Platform Molecules. Int. J. Mol. Sci. 2015, 16, 14912–14932. [Google Scholar] [CrossRef]
- Robert, T.; Eschig, S.; Biemans, T.; Scheifler, F. Bio-Based Polyester Itaconates as Binder Resins for UV-Curing Offset Printing Inks. J. Coat. Technol. Res. 2019, 16, 689–697. [Google Scholar] [CrossRef]
- Dai, J.; Ma, S.; Wu, Y.; Han, L.; Zhang, L.; Zhu, J.; Liu, X. Polyesters Derived from Itaconic Acid for the Properties and Bio-Based Content Enhancement of Soybean Oil-Based Thermosets. Green Chem. 2015, 17, 2383–2392. [Google Scholar] [CrossRef]
- Yin, J.; Yan, M.; Wang, Y.; Fu, J.; Suo, H. 3D Bioprinting of Low-Concentration Cell-Laden Gelatin Methacrylate (GelMA) Bioinks with a Two-Step Cross-Linking Strategy. ACS Appl. Mater. Interfaces 2018, 10, 6849–6857. [Google Scholar] [CrossRef]
- Barrioni, B.R.; De Carvalho, S.M.; Oréfice, R.L.; De Oliveira, A.A.R.; Pereira, M.D.M. Synthesis and Characterization of Biodegradable Polyurethane Films Based on HDI with Hydrolyzable Crosslinked Bonds and a Homogeneous Structure for Biomedical Applications. Mater. Sci. Eng. C 2015, 52, 22–30. [Google Scholar] [CrossRef] [PubMed]
- Mondal, S.; Martin, D. Hydrolytic Degradation of Segmented Polyurethane Copolymers for Biomedical Applications. Polym. Degrad. Stab. 2012, 97, 1553–1561. [Google Scholar] [CrossRef]


| Structure of the Obtained PBItc | Consistency of the Obtained PBItc | Transparency of the Obtained PBItc | Ability to Spread the PBItc Sample on the Table in Troom * | a Viscosity at (a) Troom and (b) T = 36.6 °C | |||||
|---|---|---|---|---|---|---|---|---|---|
| 1 | Hard and brittle | 1 | Wax | 1 | None | 1 | Yes | 1 | η < 10 or η > 1000 |
| 2 | Incompressible and sticky | 2 | Wax/Resin | 2 | Partial | 2 | Partial | 2 | 500 < η < 1000 |
| 3 | Compressible and sticky | 3 | Resin | 3 | Full | 3 | No | 3 | 100 < η < 500 |
| 4 | 10 < η < 100 | ||||||||
| No. | Coded Variable | convCOOH tit [%] | %C=C 13C NMR [%] | %VVU [%] | ||||||||
|---|---|---|---|---|---|---|---|---|---|---|---|---|
| x1 | x2 | x3 | Exp. * | Calc. * | Diff. * | Exp. | Calc. | Diff. | Exp. | Calc. | Diff. | |
| 1 | −1 | −1 | 0 | 51.0 | 51.2 | −0.2 | 51.6 | 52.0 | −0.3 | 50.0 | 55.0 | −5.0 |
| 2 | 1 | −1 | 0 | 53.8 | 54.1 | −0.2 | 50.9 | 51.0 | −0.2 | 80.0 | 71.3 | 8.7 |
| 3 | −1 | 1 | 0 | 57.9 | 57.7 | 0.2 | 48.5 | 48.3 | 0.2 | 50.0 | 58.8 | −8.8 |
| 4 | 1 | 1 | 0 | 59.3 | 59.1 | 0.2 | 48.9 | 48.5 | 0.3 | 65.0 | 60.0 | 5.0 |
| 5 | −1 | 0 | −1 | 47.1 | 46.8 | 0.3 | 57.5 | 56.8 | 0.8 | 75.0 | 66.9 | 8.1 |
| 6 | 1 | 0 | −1 | 46.0 | 45.7 | 0.3 | 58.6 | 58.0 | 0.6 | 75.0 | 80.6 | −5.6 |
| 7 | −1 | 0 | 1 | 68.7 | 69.0 | −0.3 | 36.3 | 36.9 | −0.6 | 95.0 | 89.4 | 5.6 |
| 8 | 1 | 0 | 1 | 74.1 | 74.4 | −0.3 | 34.2 | 34.9 | −0.8 | 85.0 | 93.1 | −8.1 |
| 9 | 0 | −1 | −1 | 42.8 | 42.9 | −0.1 | 57.5 | 57.9 | −0.4 | 75.0 | 78.1 | −3.1 |
| 10 | 0 | 1 | −1 | 45.5 | 46.0 | −0.5 | 56.7 | 57.6 | −0.9 | 65.0 | 64.4 | 0.6 |
| 11 | 0 | −1 | 1 | 66.2 | 65.7 | 0.5 | 40.1 | 39.2 | 0.9 | 85.0 | 85.6 | −0.6 |
| 12 | 0 | 1 | 1 | 74.1 | 74.0 | 0.1 | 33.7 | 33.3 | 0.4 | 95.0 | 91.9 | 3.1 |
| 13 | 0 | 0 | 0 | 56.3 | 56.5 | −0.3 | 53.0 | 50.9 | 2.1 | 80.0 | 76.7 | 3.3 |
| 14 | 0 | 0 | 0 | 57.1 | 56.5 | 0.6 | 48.8 | 50.9 | −2.1 | 75.0 | 76.7 | −1.7 |
| 15 | 0 | 0 | 0 | 56.2 | 56.5 | −0.3 | 50.9 | 50.9 | 0.0 | 75.0 | 76.7 | −1.7 |
| Results | convCOOH tit [%] | %C=C 13C NMR [%] | %VVU [%] |
|---|---|---|---|
| Calculated | 71.3 | 36.5 | 97.7 |
| Experimental | 71.7 | 35.0 | 95.0 |
| DSC Analysis | |||
| Tg1 [°C] | Tg2 [°C] | ||
| −38.1 | −24.9 | ||
| TG Analysis | |||
| Td5% [°C] | Td30% [°C] | Td50% [°C] | Td85% [°C] |
| 215.2 | 299.6 | 356.3 | 410.0 |
Disclaimer/Publisher’s Note: The statements, opinions and data contained in all publications are solely those of the individual author(s) and contributor(s) and not of MDPI and/or the editor(s). MDPI and/or the editor(s) disclaim responsibility for any injury to people or property resulting from any ideas, methods, instructions or products referred to in the content. |
© 2024 by the authors. Licensee MDPI, Basel, Switzerland. This article is an open access article distributed under the terms and conditions of the Creative Commons Attribution (CC BY) license (https://creativecommons.org/licenses/by/4.0/).
Share and Cite
Miętus, M.; Cegłowski, M.; Gołofit, T.; Gadomska-Gajadhur, A. Enhanced Synthesis of Poly(1,4-butanediol itaconate) via Box–Behnken Design Optimization. Polymers 2024, 16, 2708. https://doi.org/10.3390/polym16192708
Miętus M, Cegłowski M, Gołofit T, Gadomska-Gajadhur A. Enhanced Synthesis of Poly(1,4-butanediol itaconate) via Box–Behnken Design Optimization. Polymers. 2024; 16(19):2708. https://doi.org/10.3390/polym16192708
Chicago/Turabian StyleMiętus, Magdalena, Mateusz Cegłowski, Tomasz Gołofit, and Agnieszka Gadomska-Gajadhur. 2024. "Enhanced Synthesis of Poly(1,4-butanediol itaconate) via Box–Behnken Design Optimization" Polymers 16, no. 19: 2708. https://doi.org/10.3390/polym16192708