3.1. Proton Conductivity
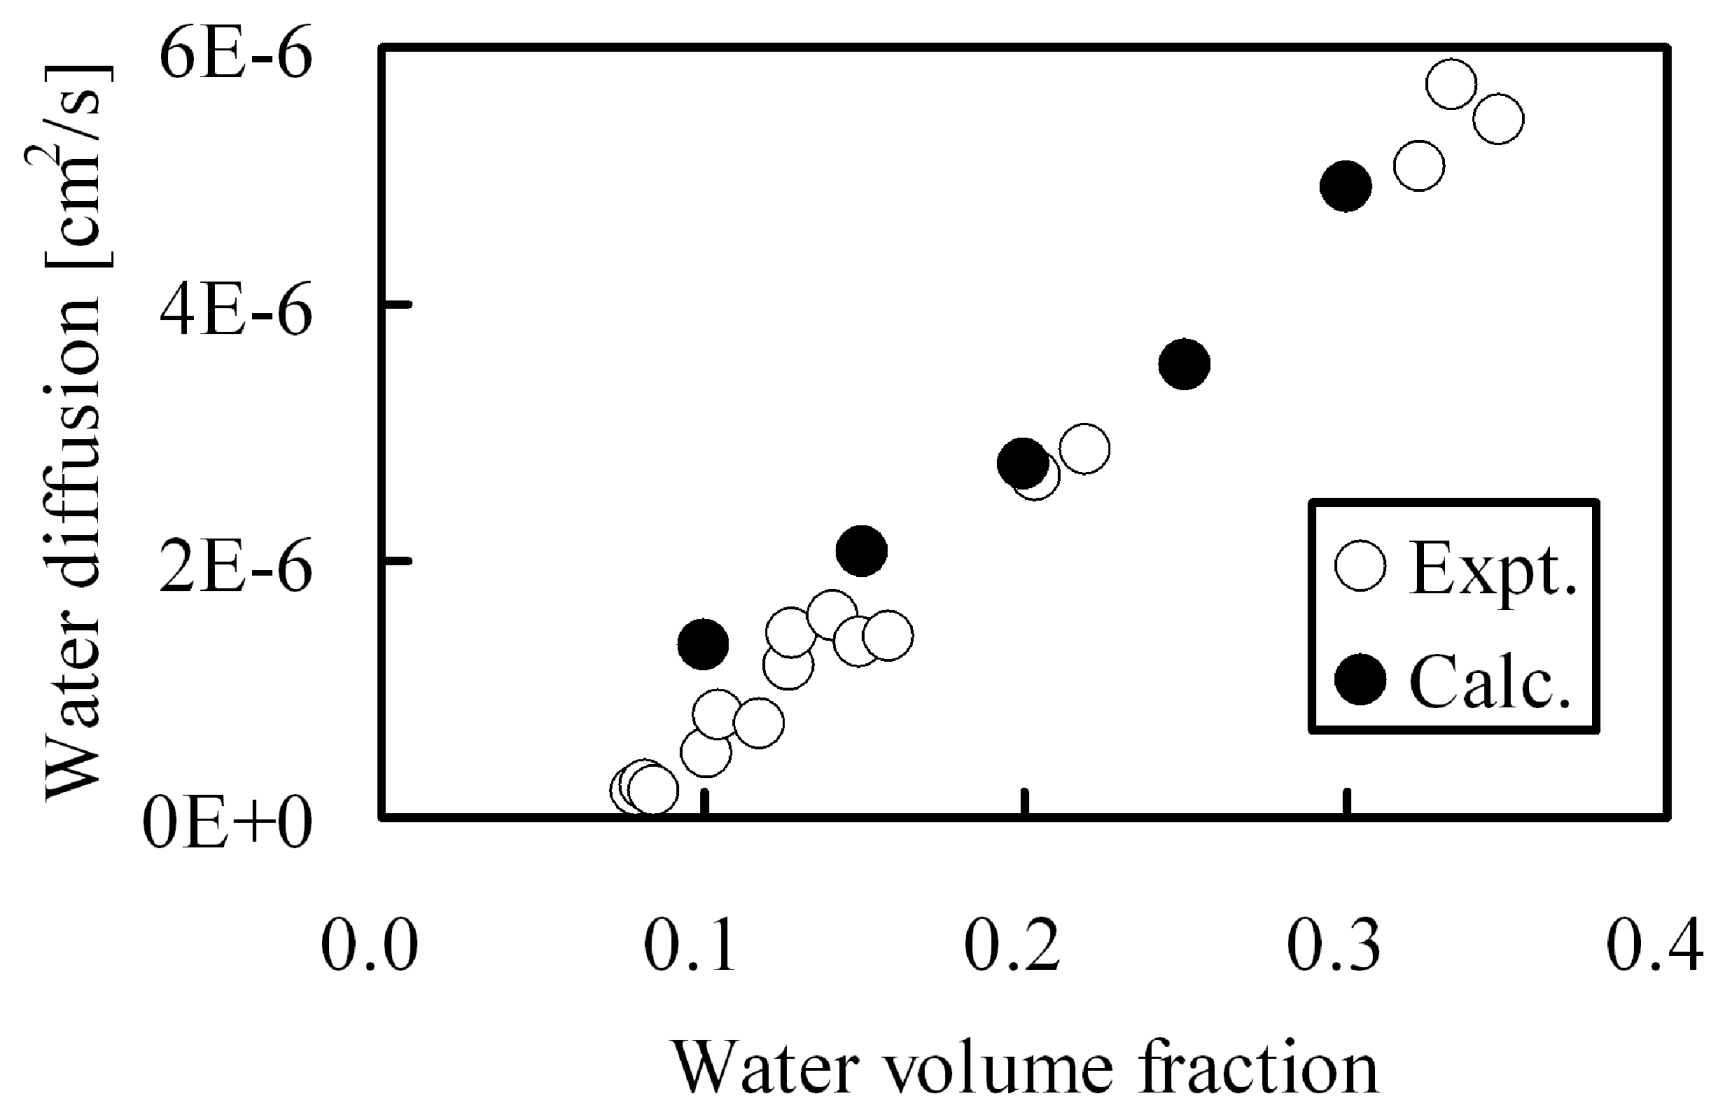
Since protons are conducted through the hydrophilic water-containing phase, good correlation is recognized between proton conductivity and water diffusion. Therefore, water cluster shapes in membranes were calculated by the DPD module contained in Materials Studio commercialized by Accelrys Inc., and water diffusion though these clusters was evaluated by MC tracer diffusion simulations. A comparison between calculated diffusion constants with those obtained from experiment in Nafion117 are shown in
Figure 3.
Figure 3.
Water diffusion in hydrated Nafion as function of water volume fraction: (○) experimental data [
8]; (●) DPD and MC calculation.
Figure 3.
Water diffusion in hydrated Nafion as function of water volume fraction: (○) experimental data [
8]; (●) DPD and MC calculation.
In the calculations, water was allowed to diffuse within the hydrophilic pore network. The calculations agree well with the experimental values over a wide range of moisture absorption This indicates that the DPD-MC approach can be utilized for quantitative estimation of diffusion constants. As for the required CPU time, one type of membrane can be evaluated within about one day and therefore a systematic search can be performed for membranes with various molecular structures generated in a computer virtually. This allowed us to deduce persistent trends for diffusion when a certain parameter is systematically varied, such as membrane EW [
16], side chain length, block length, parameters between different molecular fragments [
3],
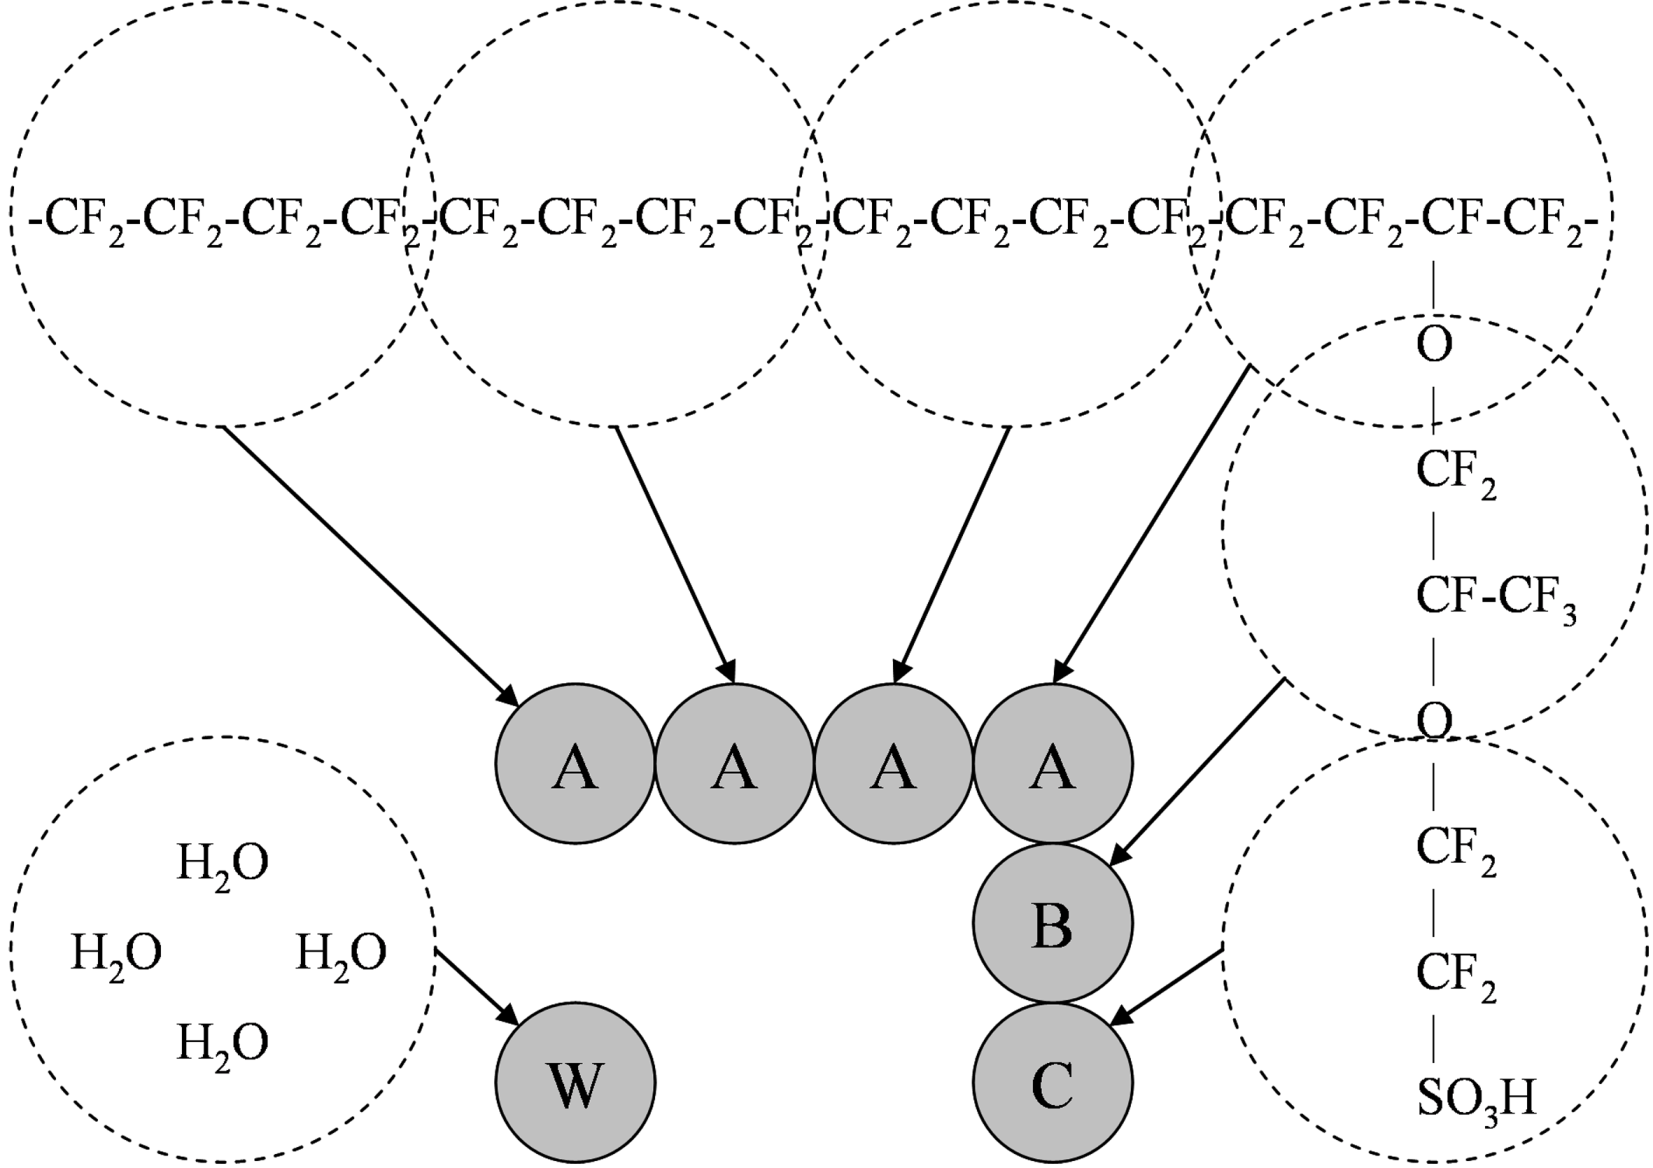
etc. For this reason, polyelectrolyte membranes shown in
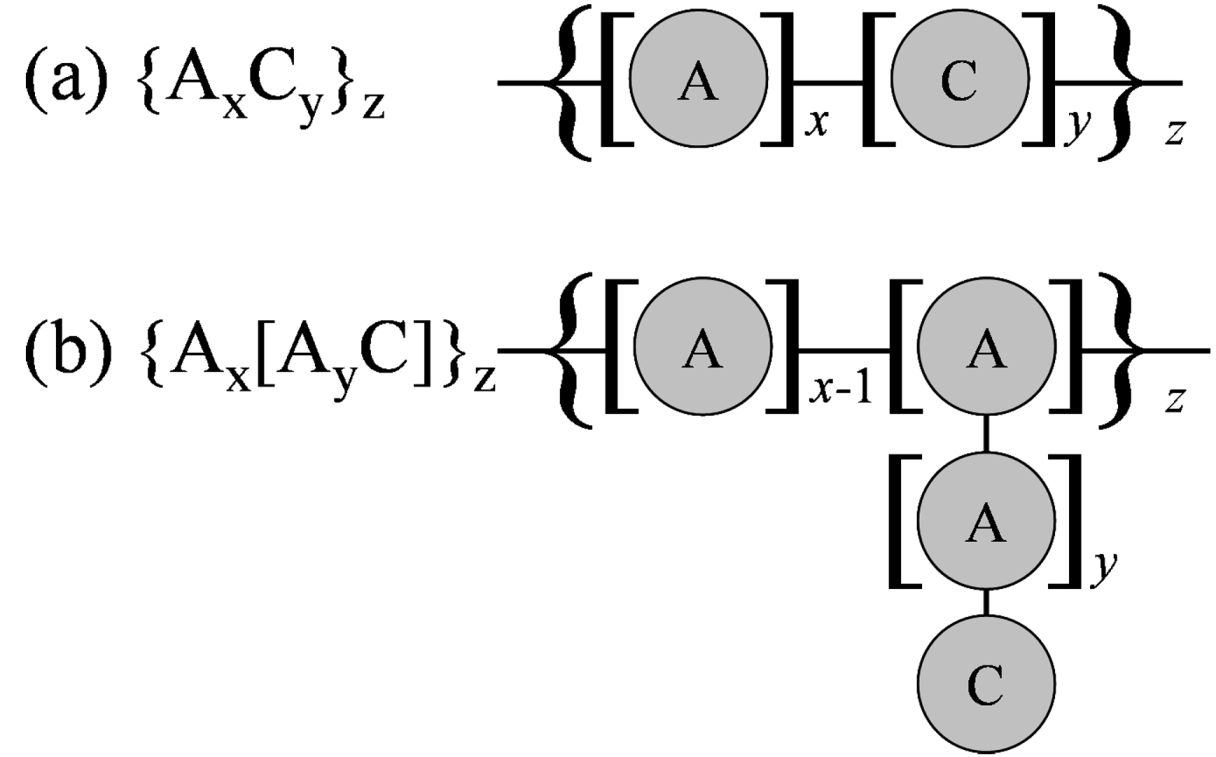
Figure 4 were investigated. The effect of the block chain length of hydrophobic A particles and hydrophilic C particles for the block type (a), and the effect of main chain length and side chain length for the grafted type (b), were estimated by changing values of
x and
y in
Figure 4.
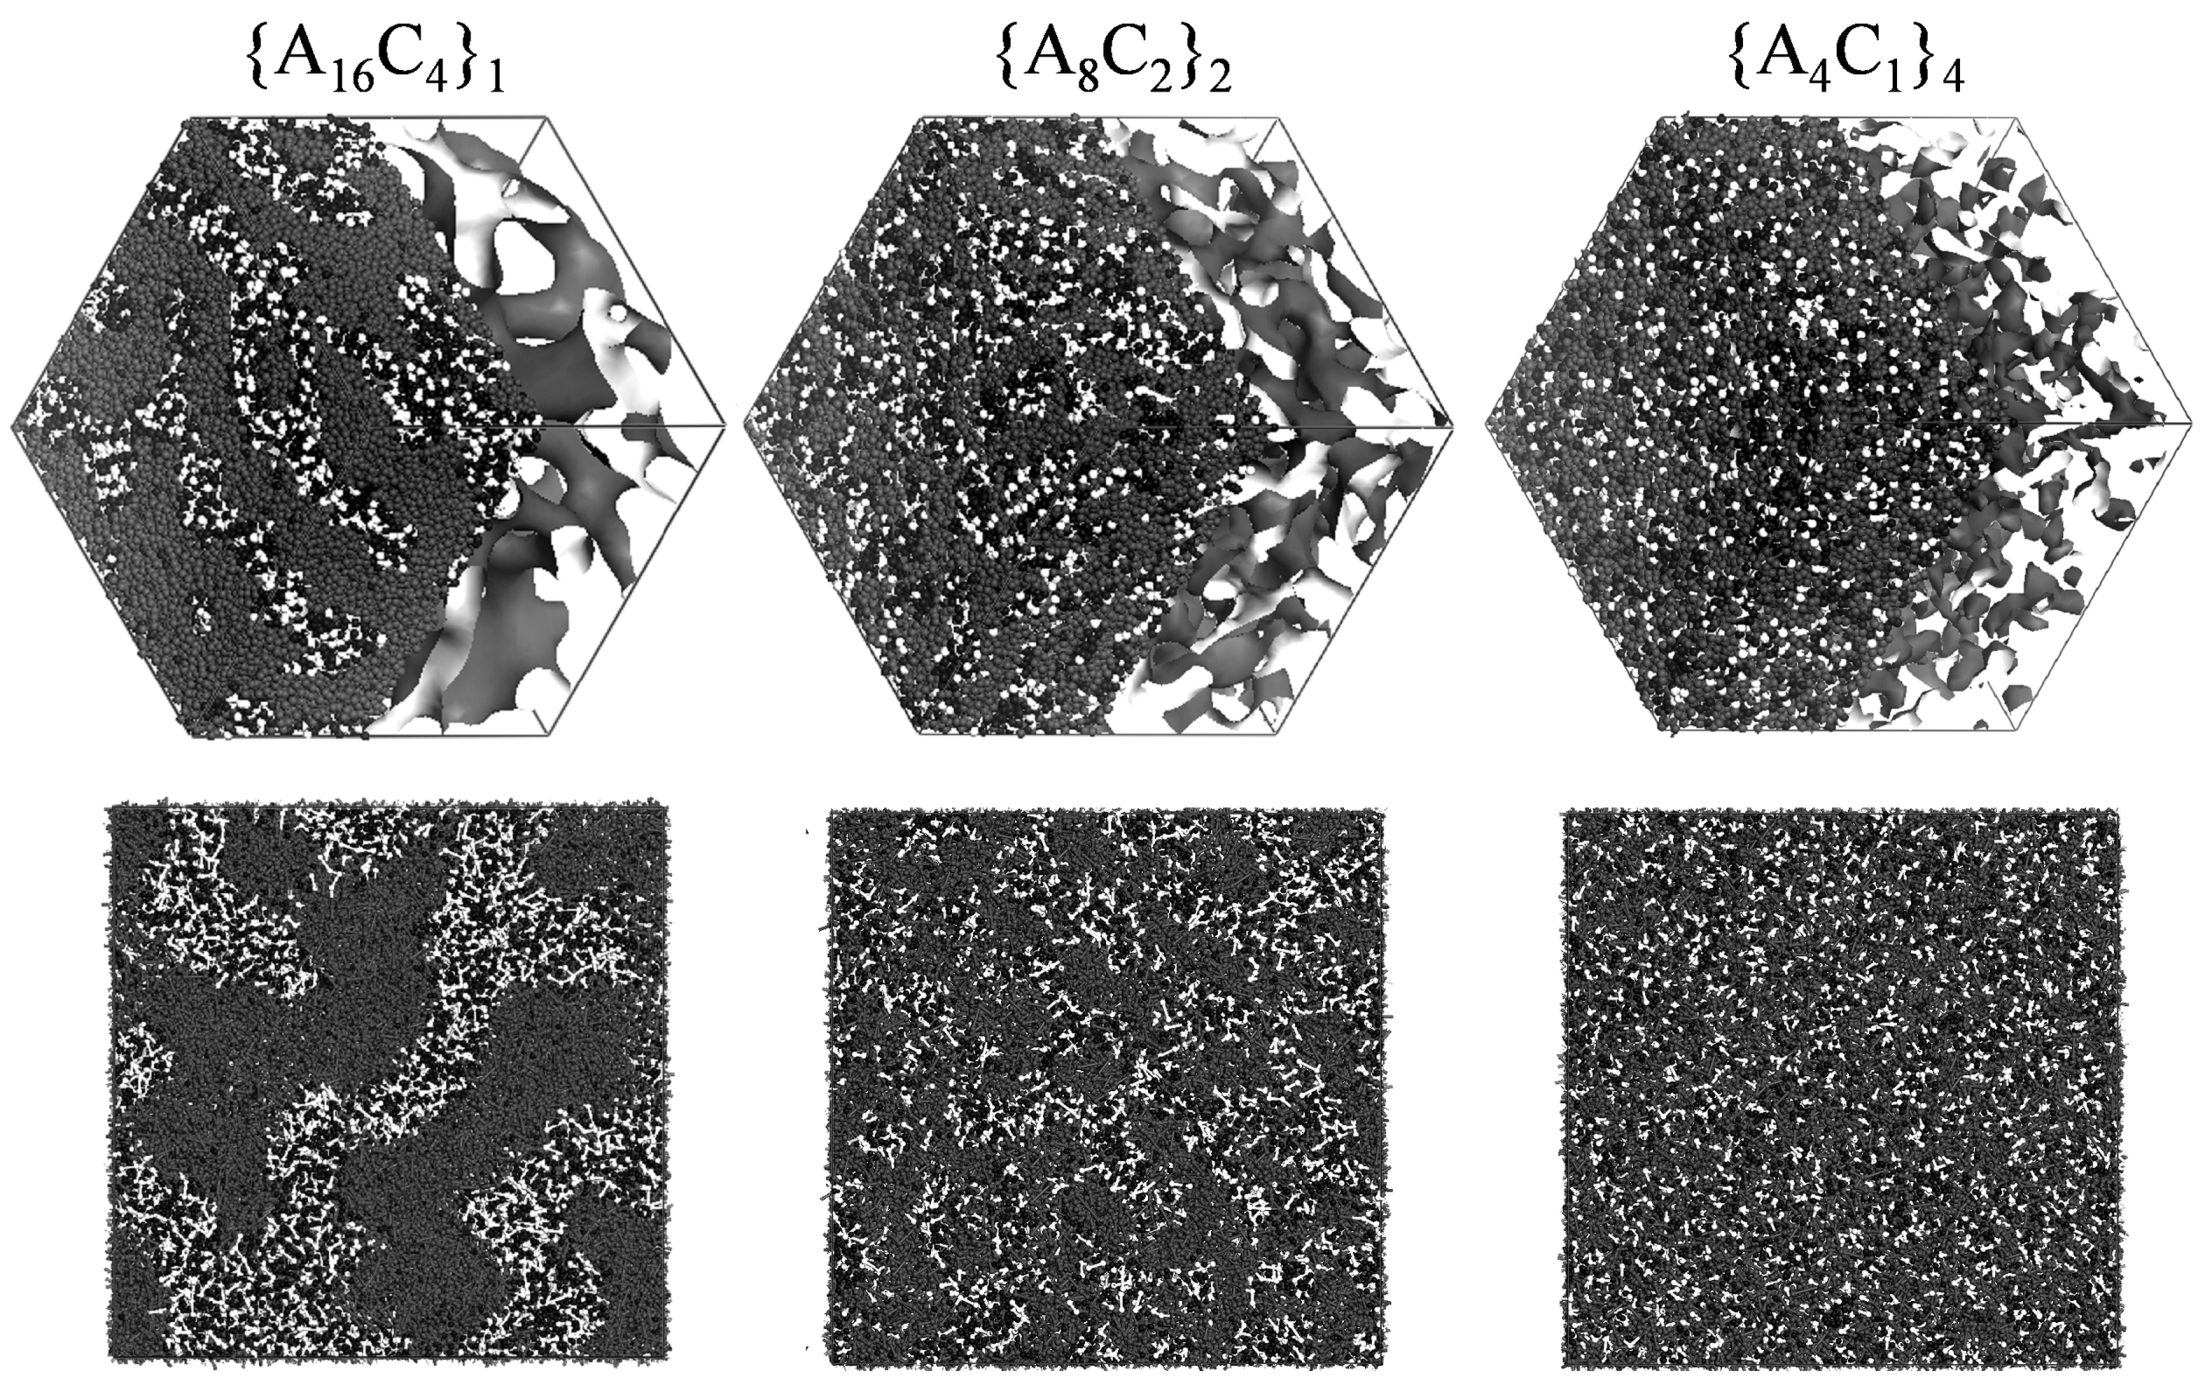
Figure 5 shows the water cluster networks that were obtained for three types of block polymer architectures that contain 28.6 vol % water. Since the C bead fraction within each type is the same, the equivalent weight (EW), defined as the average molecular weight per acid molecule, was also the same for all membranes. For {A
16C
4}
1, which had the longest hydrophilic and hydrophobic block chain lengths, well-connected water clusters with a large diameter were seen. For{A
8C
2}
2, for which the block lengths were two times smaller, water clusters were connected, but their diameter was small. On the other hand, for {A
4C
1}
4, extremely small clusters that seem to be badly connected were seen and some of them were even isolated. The calculated water diffusion coefficient increases with an increase of hydrophilic block length. In order to explore the effect of water cluster shapes on water diffusion, the cluster radius and the separation between clusters were estimated from the pair correlation function of the W beads. The inter-cluster distance is defined as the position where the second peak in the pair correlation function occurs, while the pore radius is defined as that distance for which the pair correlation function of the W beads starts to drop below the value 1.
Figure 4.
Bead representations of polymers considered: (a) Block polymer; (b) Grafted polymer.
Figure 4.
Bead representations of polymers considered: (a) Block polymer; (b) Grafted polymer.
Figure 5.
DPD structures obtained for the sequences {A
16C
4}
1, {A
8C
2}
2 and {A
4C
1}
4. A bead is in gray, C bead in white and W bead in black.Reproduced with permission from [
3]. Copyright 2010 Royal Society of Chemistry.
Figure 5.
DPD structures obtained for the sequences {A
16C
4}
1, {A
8C
2}
2 and {A
4C
1}
4. A bead is in gray, C bead in white and W bead in black.Reproduced with permission from [
3]. Copyright 2010 Royal Society of Chemistry.
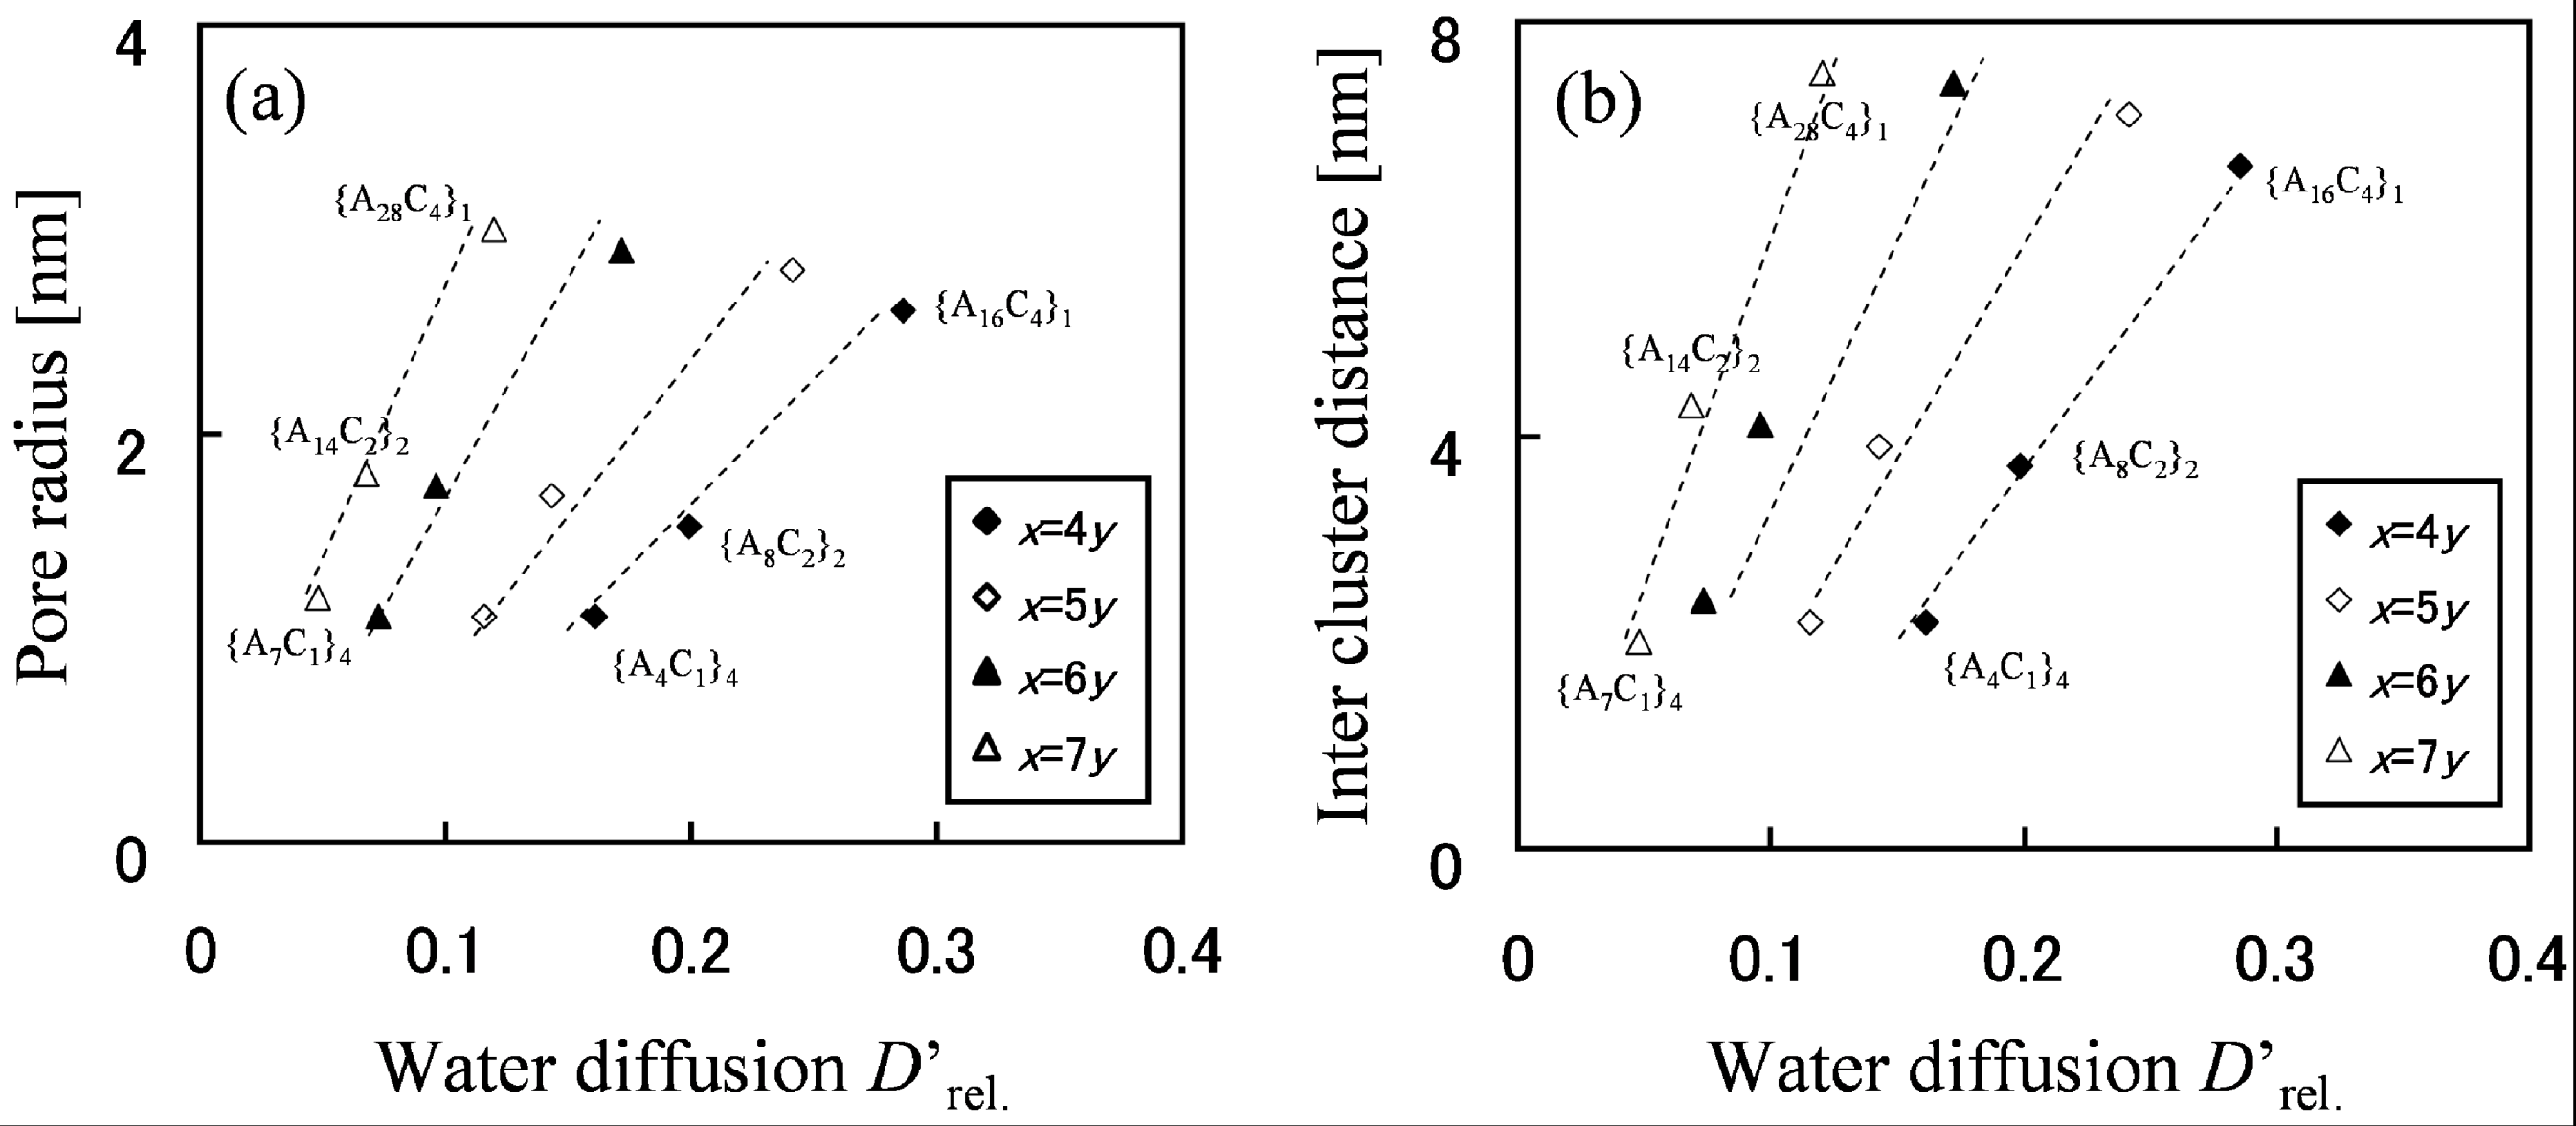
The relationship between cluster shape and water diffusion is presented in
Figure 6 for block types with various molecular structures. For each block type, the level of moisture absorption expressed as the number of water molecules per acidic site was at the same level of λ = 4. In
Figure 6, dotted lines are drawn as guide lines that connect the results obtained for different block chain lengths, but with the same EW.
Figure 6.
(
a) Pore radius and (
b) inter-cluster distance derived from pair correlation function plotted against
D'
rel.. Reproduced with permission from [
3]. Copyright 2010Royal Society of Chemistry.
Figure 6.
(
a) Pore radius and (
b) inter-cluster distance derived from pair correlation function plotted against
D'
rel.. Reproduced with permission from [
3]. Copyright 2010Royal Society of Chemistry.
Figure 6 indicates that water diffusion is enhanced with the increase of water cluster radius and also with cluster separation. Moreover, since in the graph water diffusion is enhanced by moving to the different dotted line on the right hand side, rather than by moving up to the upper right along the same dotted line, it is understood that effective molecular design to enhance water diffusion is achieved by reducing EW at the first step and lengthening the block length at the next step.
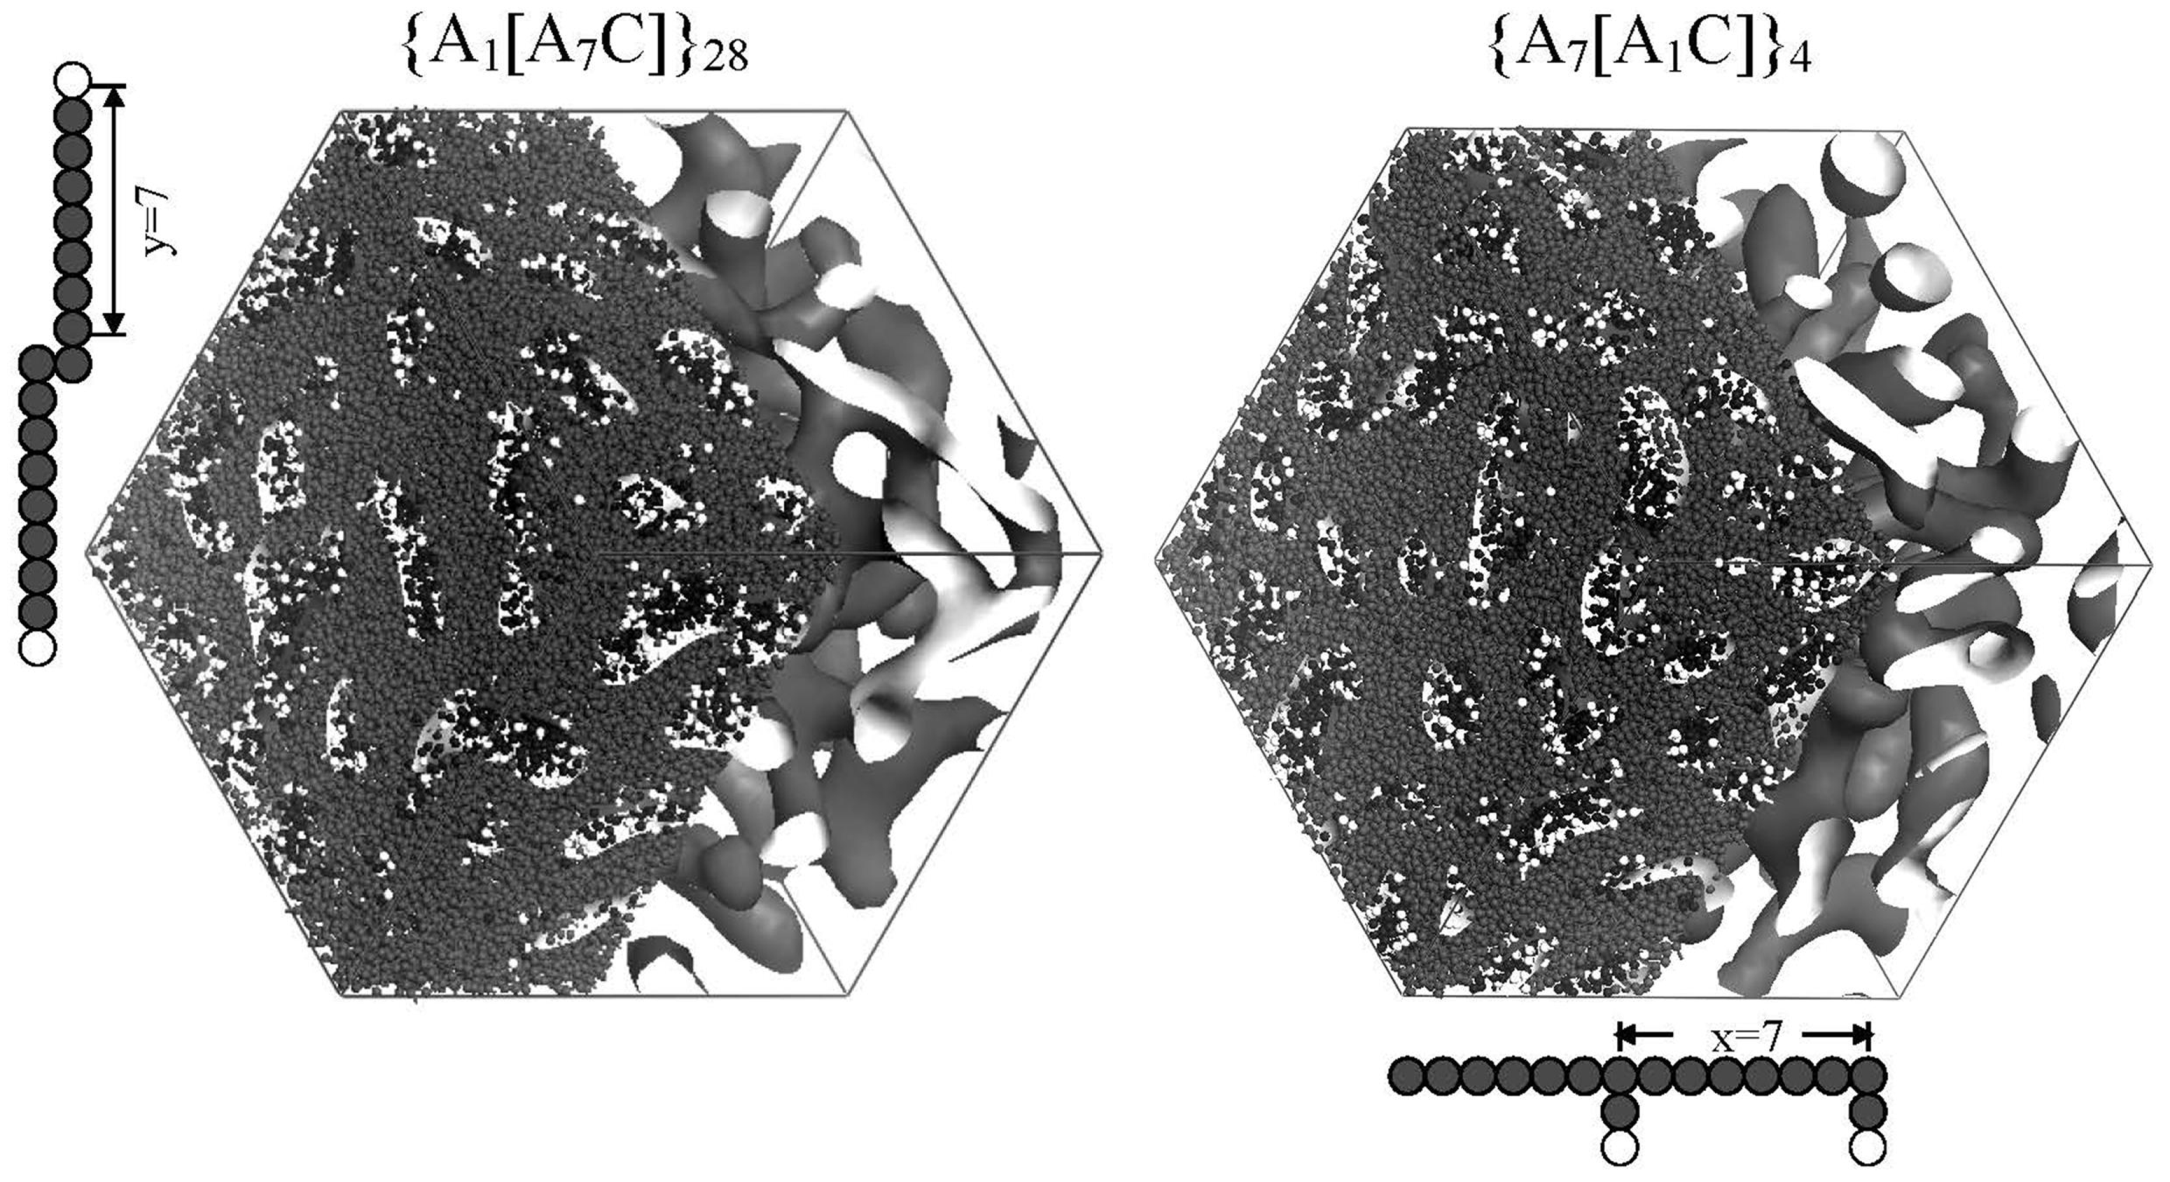
Figure 7 shows water cluster networks for two grafted type membranes that differ in side chain length without changing EW. The moisture absorption was 18.2 vol % for both. Although the water cluster shapes are almost the same, the cluster radius and separation distance increase were found to increase with side chain length and the water diffusion is also enhanced.
Figure 7.
Pore morphologies obtained for the sequences {A
7[A
1C]}
4 and {A
1[A
7C]}
28. DPD bead representations of two repeat units are included. Reproduced with permission from [
3]. Copyright 2010Royal Society of Chemistry.
Figure 7.
Pore morphologies obtained for the sequences {A
7[A
1C]}
4 and {A
1[A
7C]}
28. DPD bead representations of two repeat units are included. Reproduced with permission from [
3]. Copyright 2010Royal Society of Chemistry.
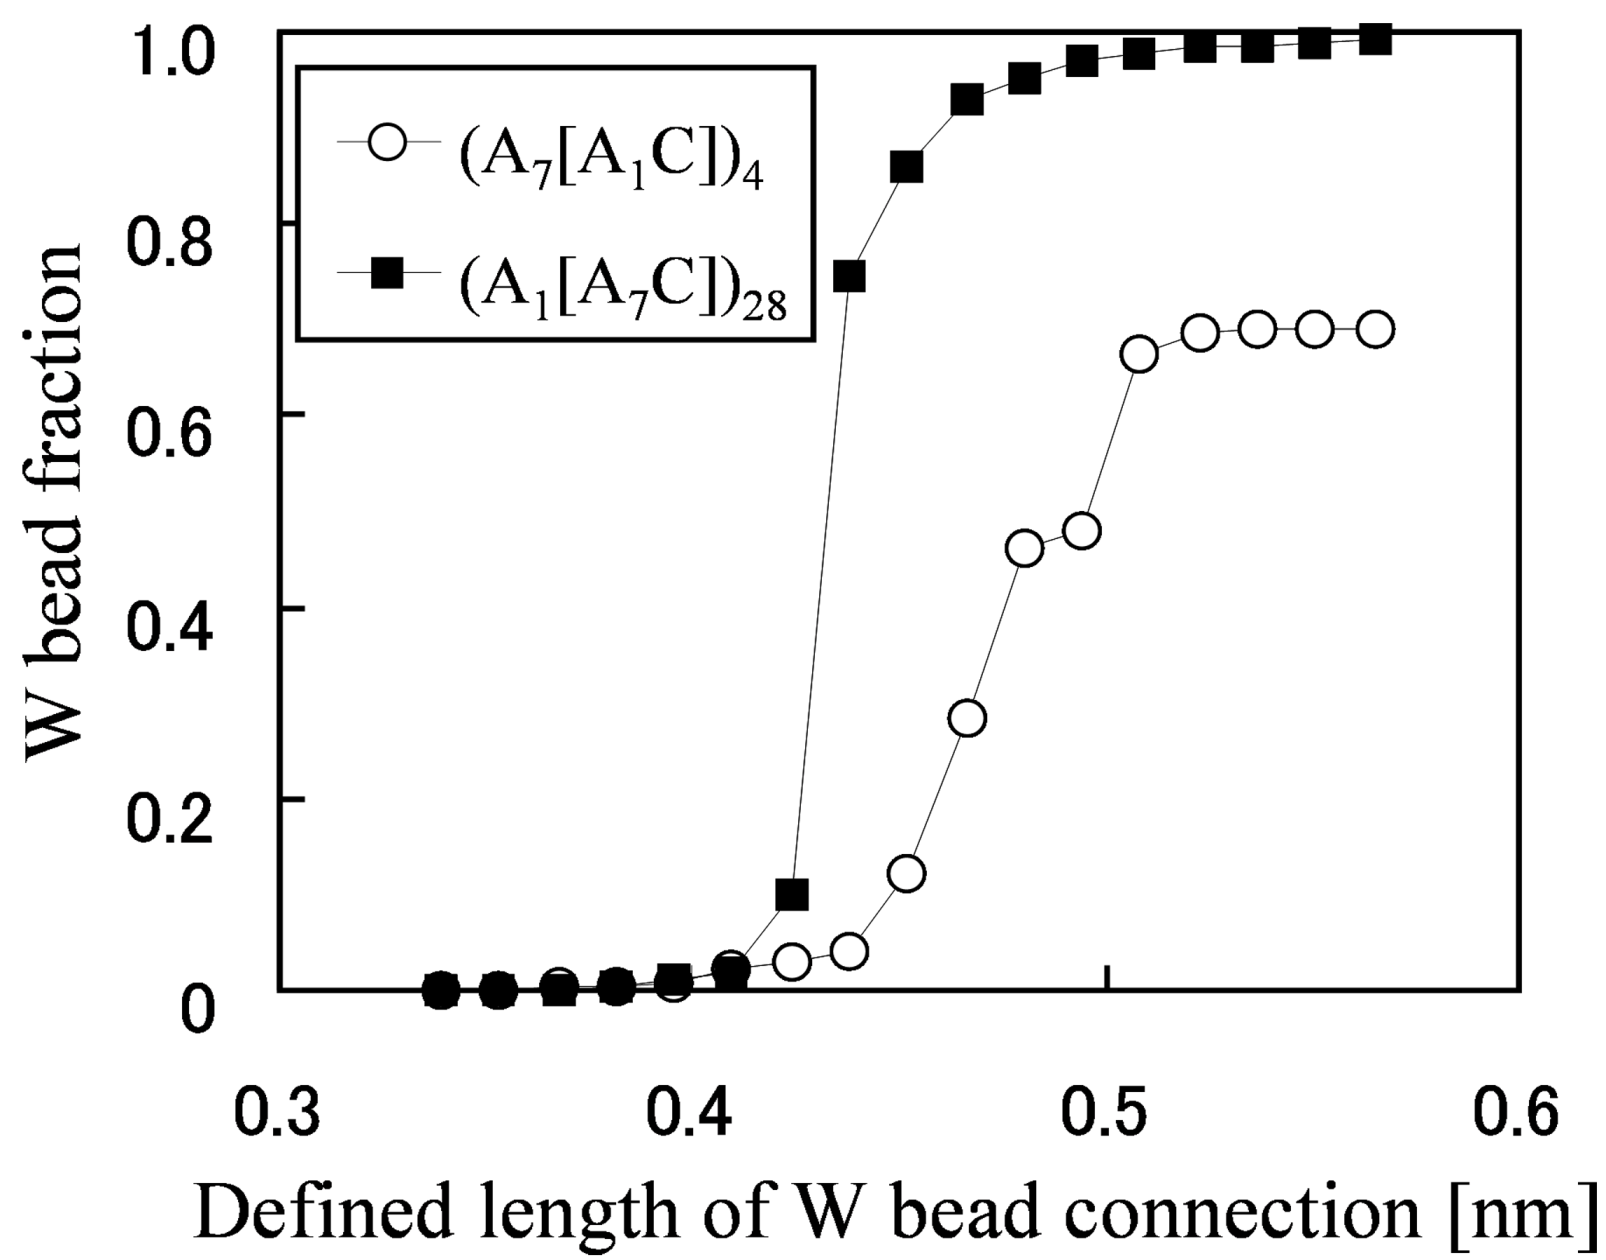
In order to figure out why the water diffusion greatly differs in spite of similar morphologies, a percolation analysis was performed for the network structures (
Figure 8). The fraction of the W beads that is contained within the largest cluster is plotted against the maximum distance for which two W particles are considered to be connected and join the same cluster. It enables the grasping of the critical distance for which almost all W particles are contained in one network from the inflection points of the graph, and the capturing of the quantity of the isolated water clusters which are not included in the network from the convergent values for which the graph becomes flat at large-defined length of W bead connection.
Figure 8 indicates that this critical distance is large and the W bead fraction at which the graphs converge is small in the membrane with short side chains. In other words, water clusters are difficult to be connected and 30% of the water exist as isolated clusters, so this is the cause of the drastically low water diffusion.
Figure 8.
W bead fraction contained within the largest water cluster
vs. length which defines connection between W beads. Reproduced with permission from [
3]. Copyright 2010Royal Society of Chemistry.
Figure 8.
W bead fraction contained within the largest water cluster
vs. length which defines connection between W beads. Reproduced with permission from [
3]. Copyright 2010Royal Society of Chemistry.
As a result of a systematical search, in which diffusion constants were derived for several tens of polymer architectures, interesting trends were obtained.
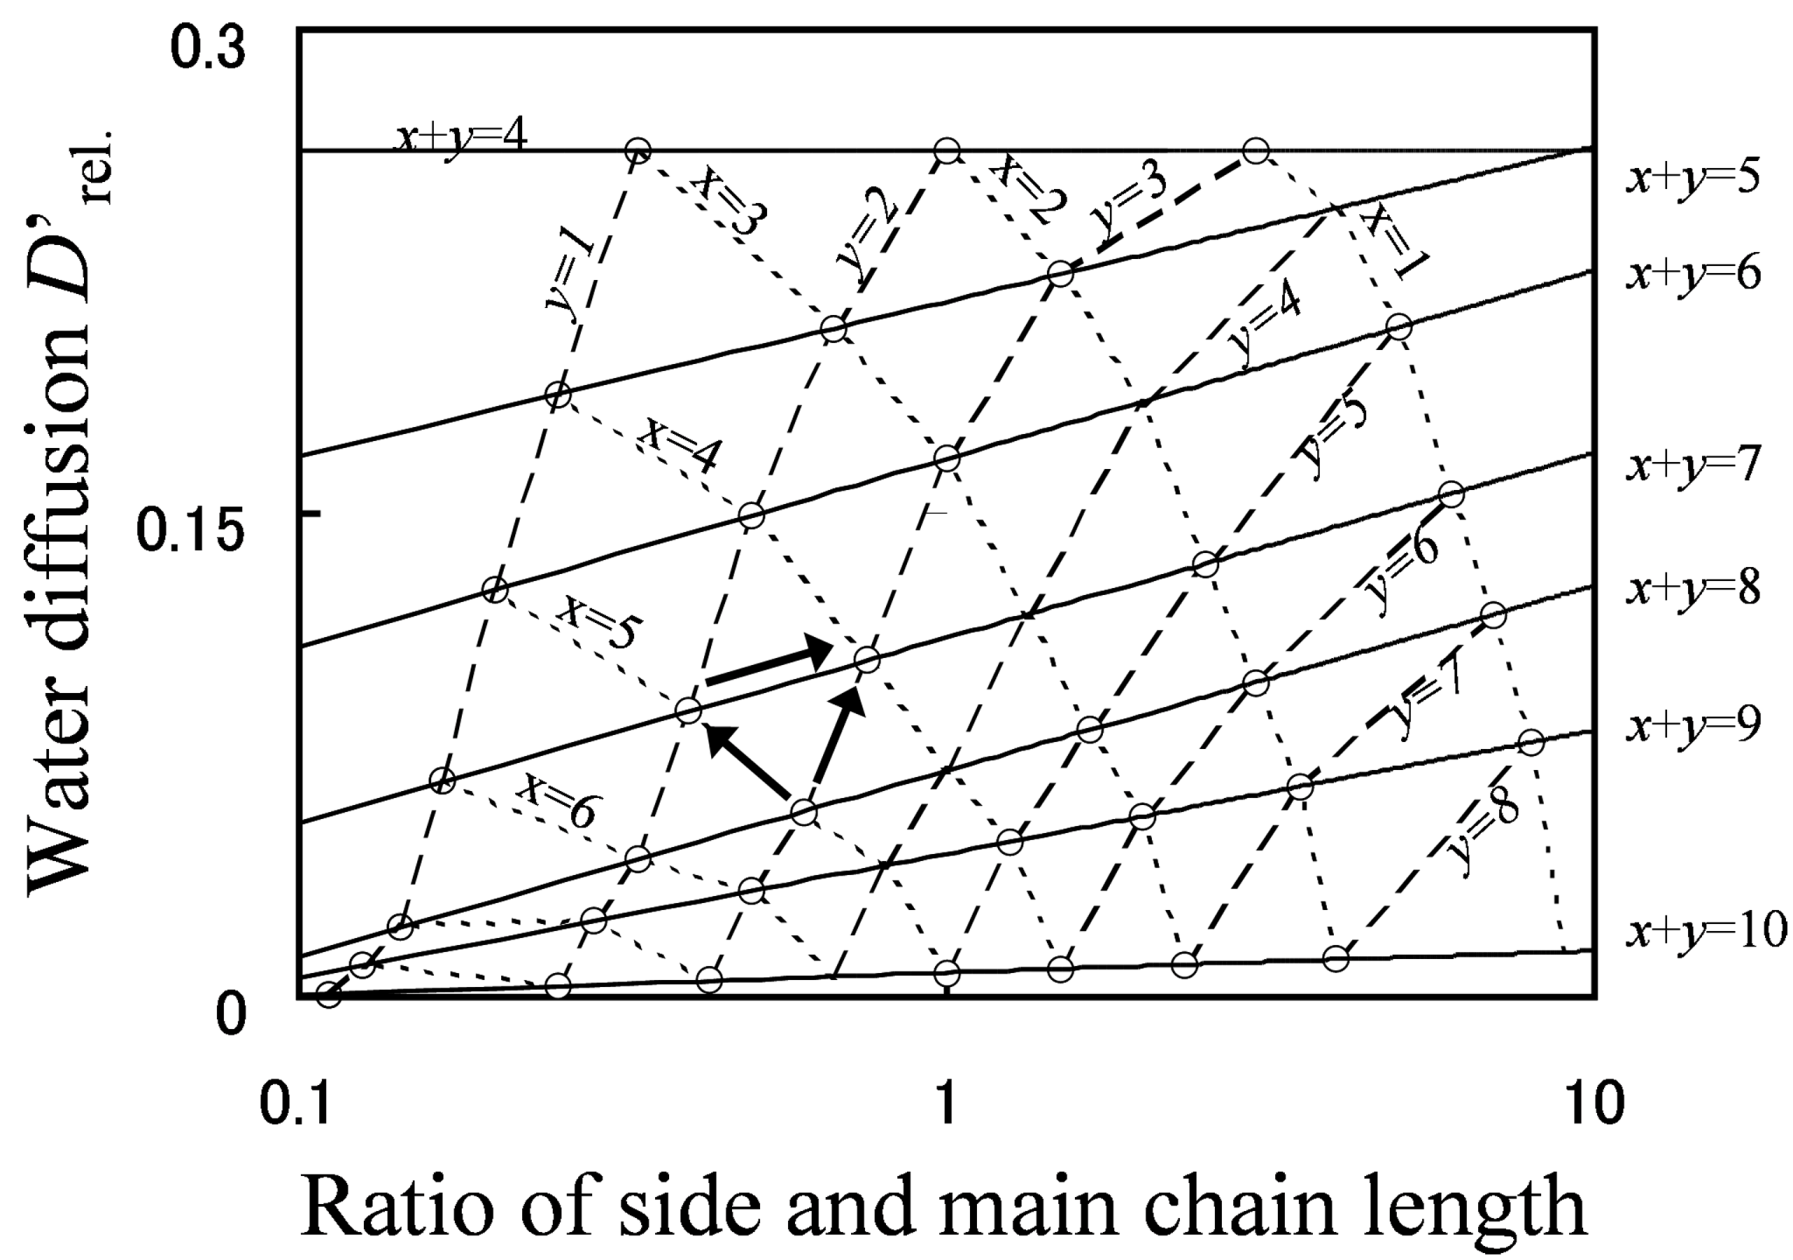
Figure 9 shows the relationship between grafted type molecular structures and water diffusion. The line of constant EW is indicated with a solid line, that of constant main chain length is indicated with a broken line, and that of constant side chain length is indicated with a dotted line.
As shown by the arrows in the figure, there are three molecular design indices to enhance water diffusion. Among these indices, lowering EW by shortening the main chain (reducing x) has the most significant effect on enhancing water diffusion, lowering EW by shortening the side chain (reducing y) has the middle effect, and the effect of lengthening the side chain while keeping the EW fixed is lowest. Moreover, if the molecular structure of the membrane is drastically changed, water diffusion can be improved greatly, even by means of lengthening the side chain with keeping EW at constant.
Figure 9.
D'
rel. plotted against
y/
x (the ratio of side chain length and branching point distance). Reproduced with permission from [
3]. Copyright 2010Royal Society of Chemistry.
Figure 9.
D'
rel. plotted against
y/
x (the ratio of side chain length and branching point distance). Reproduced with permission from [
3]. Copyright 2010Royal Society of Chemistry.
3.2. Gas Permeability
First, the solubility S and diffusion coefficient D of gas species within the hydrated membrane were estimated, before calculating the gas permeability K as K = S × D. Contrary to water and protons, gas dissolves not only within the water phase, but also within the polymer phase, and gas diffusion occurs within both phases. Furthermore, in the diffusion process, gas species can enter one phase while leaving the other. In the hydrated Nafion, the solubility within these two components were obtained based on the assumption that the gas solubility is determined as the volume averaged value based on the solubility and volume fraction of each component. The volume averaged value of solubility is expressed in Equation (12) where fNafion is the volume fraction of Nafion.
Equations (13a) and (13b) were used for solubility of H
2 and O
2 in dry Nafion, respectively. These equations were derived from the experimental data [
20]. The H
2 and O
2 solubility in water were deduced from the temperature dependencies of the molar fraction solubility [
24,
25] and water mass density [
25]. Thus obtained temperature dependent solubilities are given by Equations (14a) and (14b).
Equations (15–18) with
T in Kelvin were used for diffusion in the Nafion phase [
26] and water phase [
27].
As an example, for 40 degrees Celsius, the solubilities of oxygen are 1.02 mmol/L in water and 6.11 mmol/L in Nafion, while the diffusions of oxygen are 3.04 × 10⁻⁵ cm2/s in water and 0.014 × 10⁻⁵ cm2/s in Nafion.
The calculation of diffusion coefficients was performed by MC. Since the diffusion of both gas species is always highest in Nafion, a move trial of a gas particle to jump from water node towards a nearby selected water node is always accepted, while within the Nafion phase this probability is reduced by DNafion/Dwater. The gas solubility within the Nafion phase is always larger than within the water phase. Therefore, for a gas particle that tries to leave a water node and enter a nearest selected Nafion node, the trial is always accepted, while a jump trial in the reverse direction is reduced and becomes Swater/SNafion. These jumping rules ensured that the diffusion of the gas particles within both phases was well described, and that during the simulations, the gas particle concentration within each phase matched exactly the experimental pure phase component solubility. The gas diffusion constants within the membrane were obtained by multiplication of the slopes derived from the MSD curves with the diffusion constant of oxygen and hydrogen in the pure water phase given by Equations (17) and (18), respectively. The permeability K was calculated by multiplying of the thus-obtained diffusion constant with the solubility values given by Equation (12).
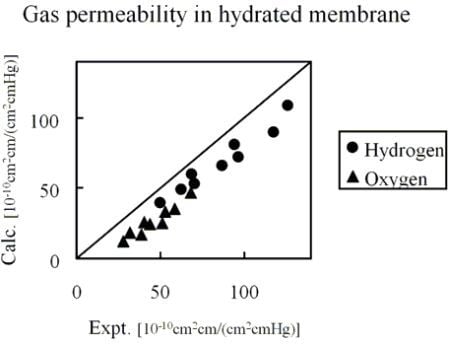
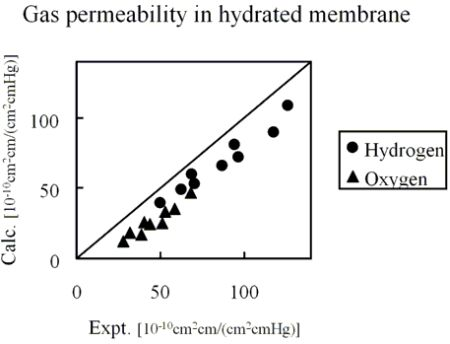
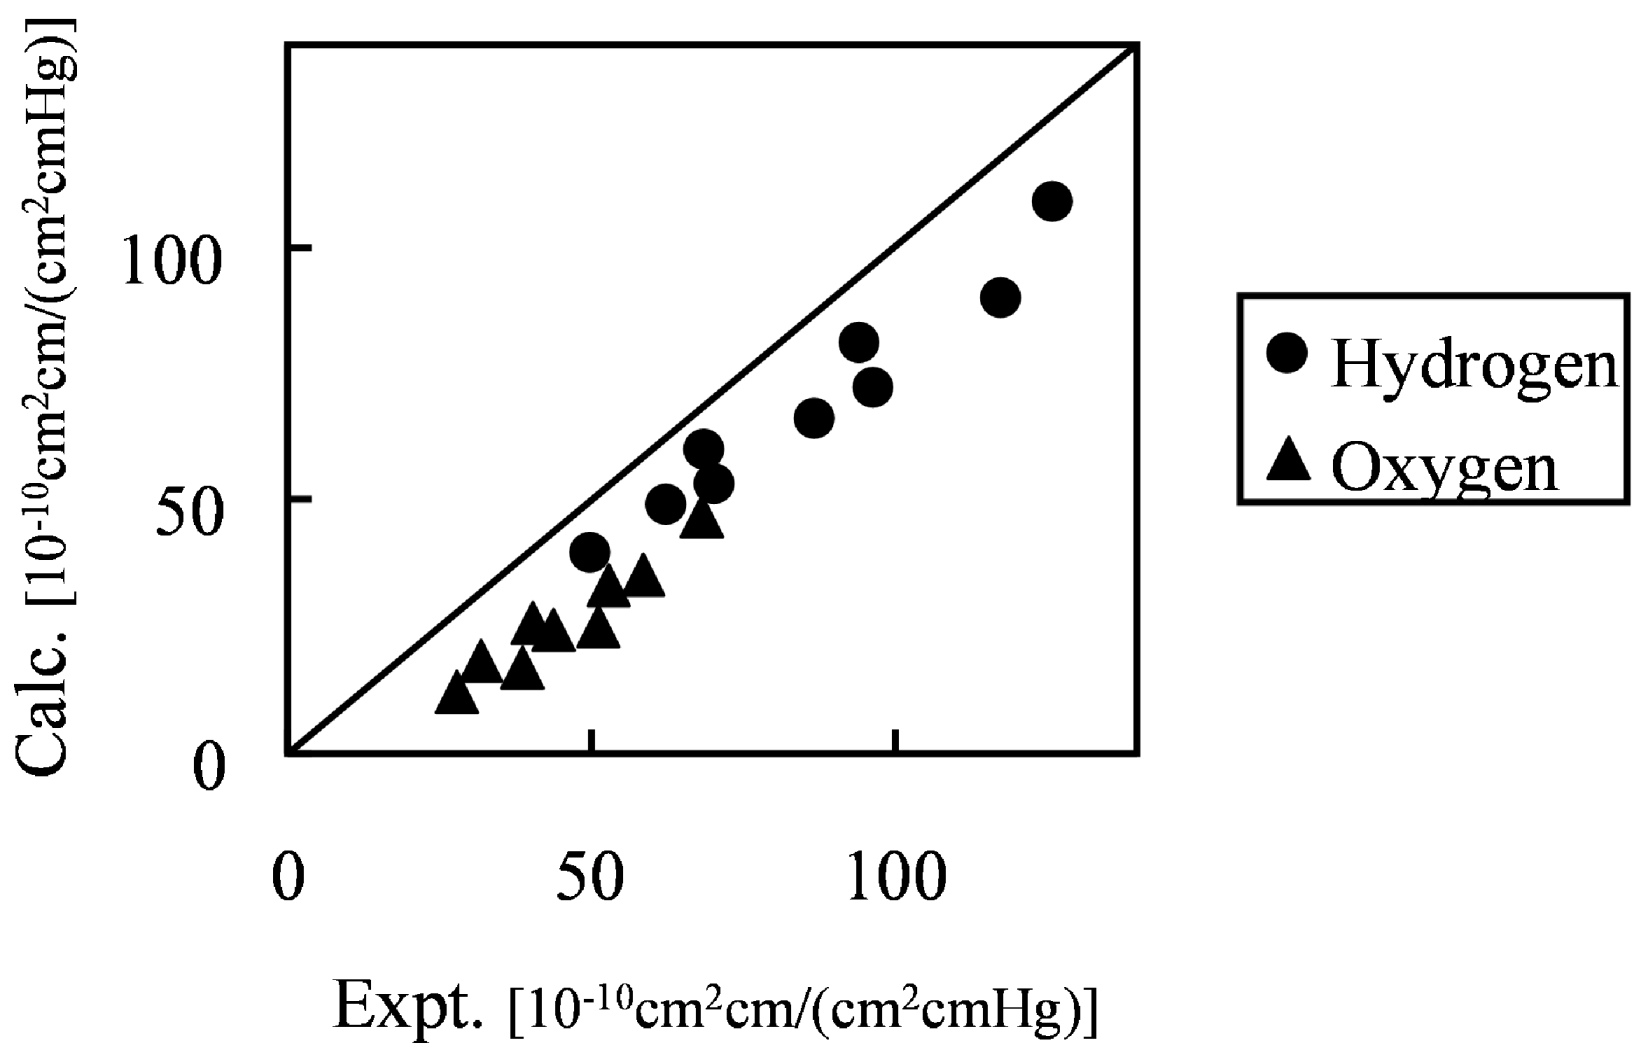
Figure 10 shows the comparison of hydrogen and oxygen permeability through Nafion 125 with experimental values. Three different hydration levels at three temperature conditions were considered, volume fractions of Nafion are 0.5, 0.6 and 0.7 and temperature conditions are 40, 55 and 70 degrees Celsius.
Figure 10.
Calculated permeability value in hydrated Nafion compared with experimental data [
26]: (●) hydrogen; (▲) oxygen.
Figure 10.
Calculated permeability value in hydrated Nafion compared with experimental data [
26]: (●) hydrogen; (▲) oxygen.
The results indicate that gas permeability can be predicted quantitatively by the developed method for various gaseous species, component fractions and temperatures. There may be several reasons why the predicted values are less than in the experiment. For instance, due to the plasticizing effects of the diffusion coefficient, the Nafion component might increase with the increase of moisture sorption. However, when considering the gas transport through hydrated membranes, it is difficult to distinguish between diffusion constants in Nafion phase and water phase from an experiment. Realizing this would likely make the model prediction better. A similar argumentation can be made for the actual gas solubility within the Nafion phase with the water uptake. The interesting finding presented in
Figure 10 is that, without invoking any fitting parameters, gas permeability values can be approached by the developed coarse-graining DPD-MC strategy.
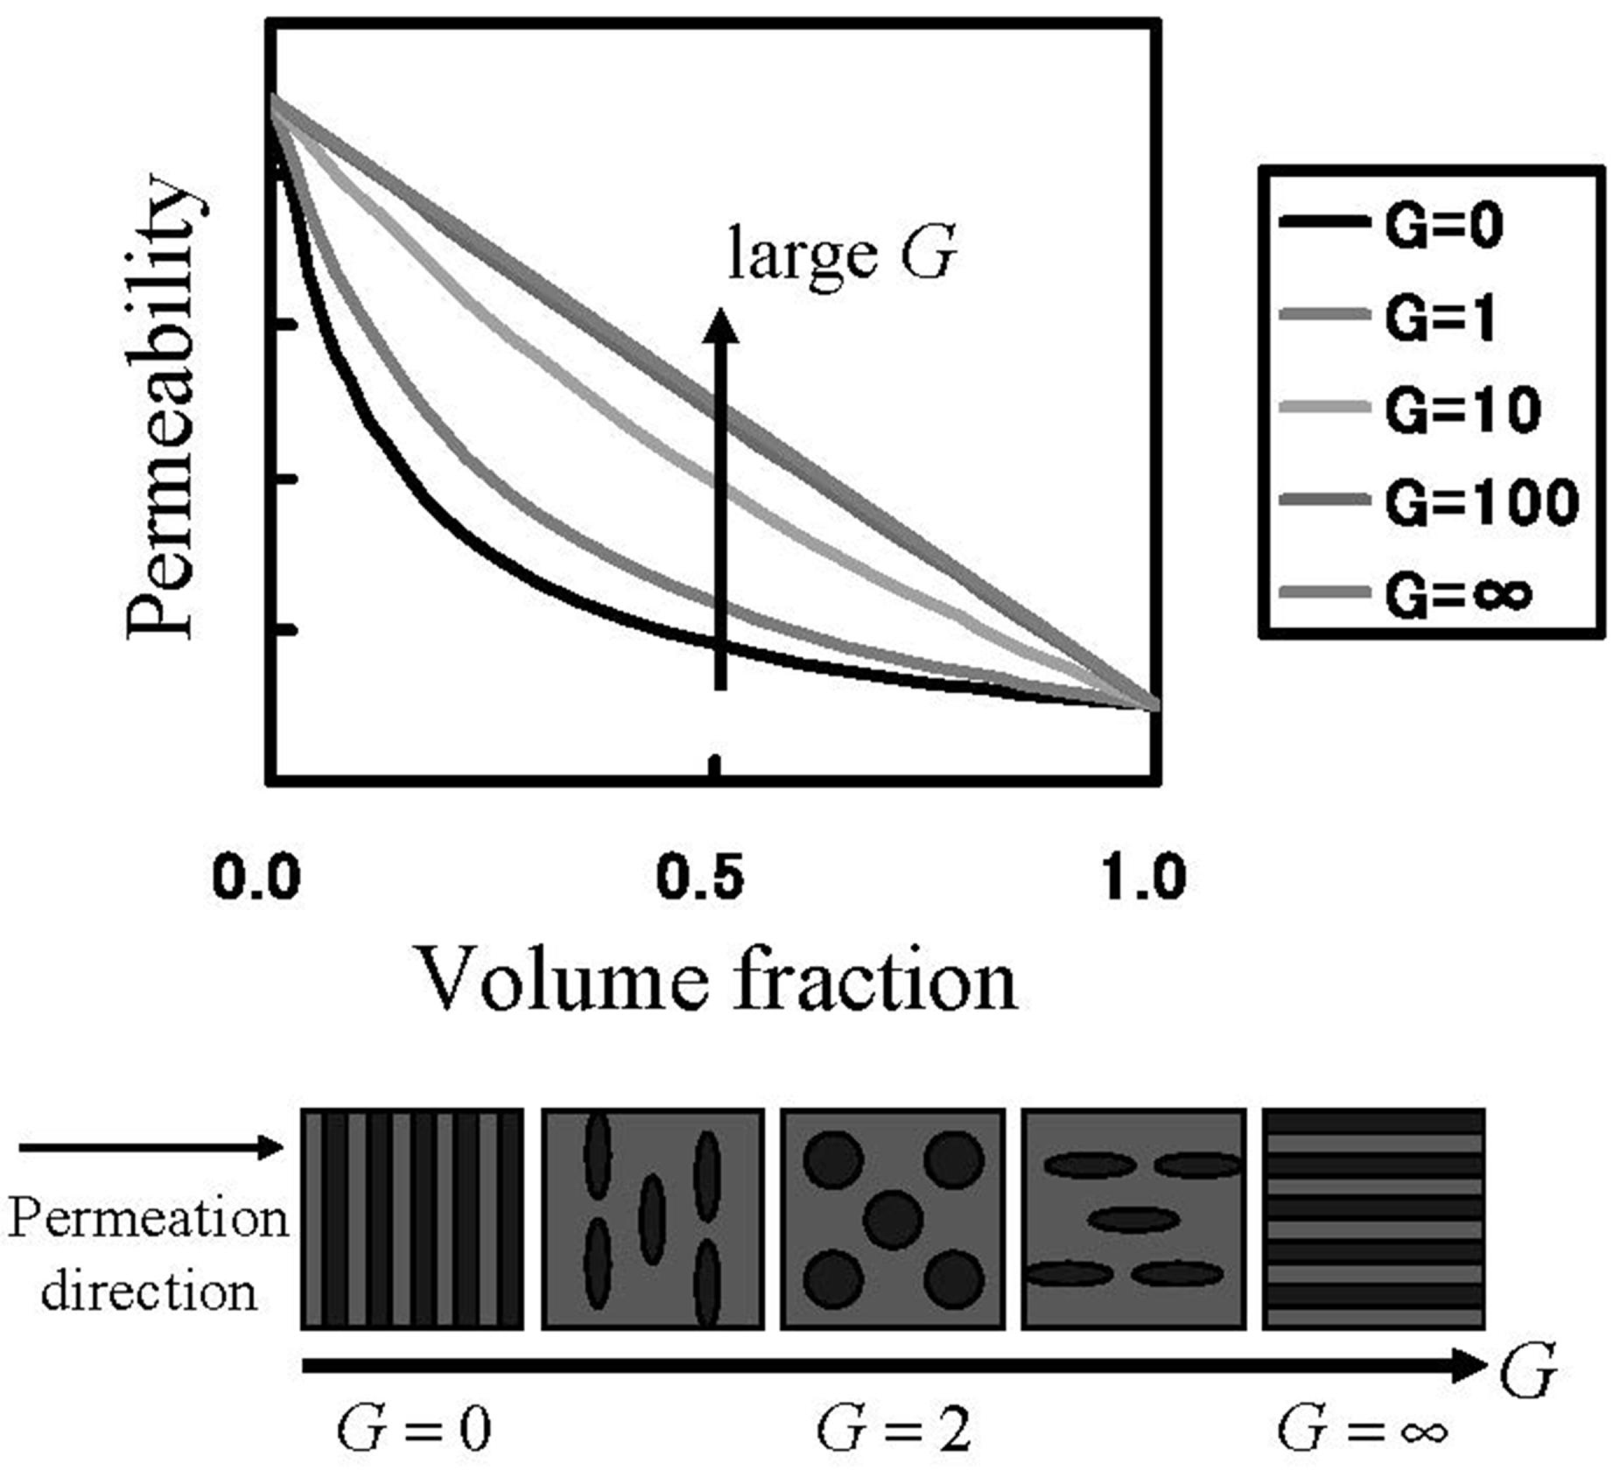
In order to know the direction to raise gas barrier properties of oxygen and hydrogen, which are fuel gases, gas transport phenomena were analyzed. The Maxwell model for gas transport in heterogeneous media was used for the analysis [
28] of the MC permeation results. The Maxwell model enables the association of the permeability with inner structures of the two-component system by the parameter
G in Equation (19), as shown in
Figure 11. In Equation (19),
Kwater and
KNafion are the permeability of the gas species in the pure water and Nafion components, respectively.
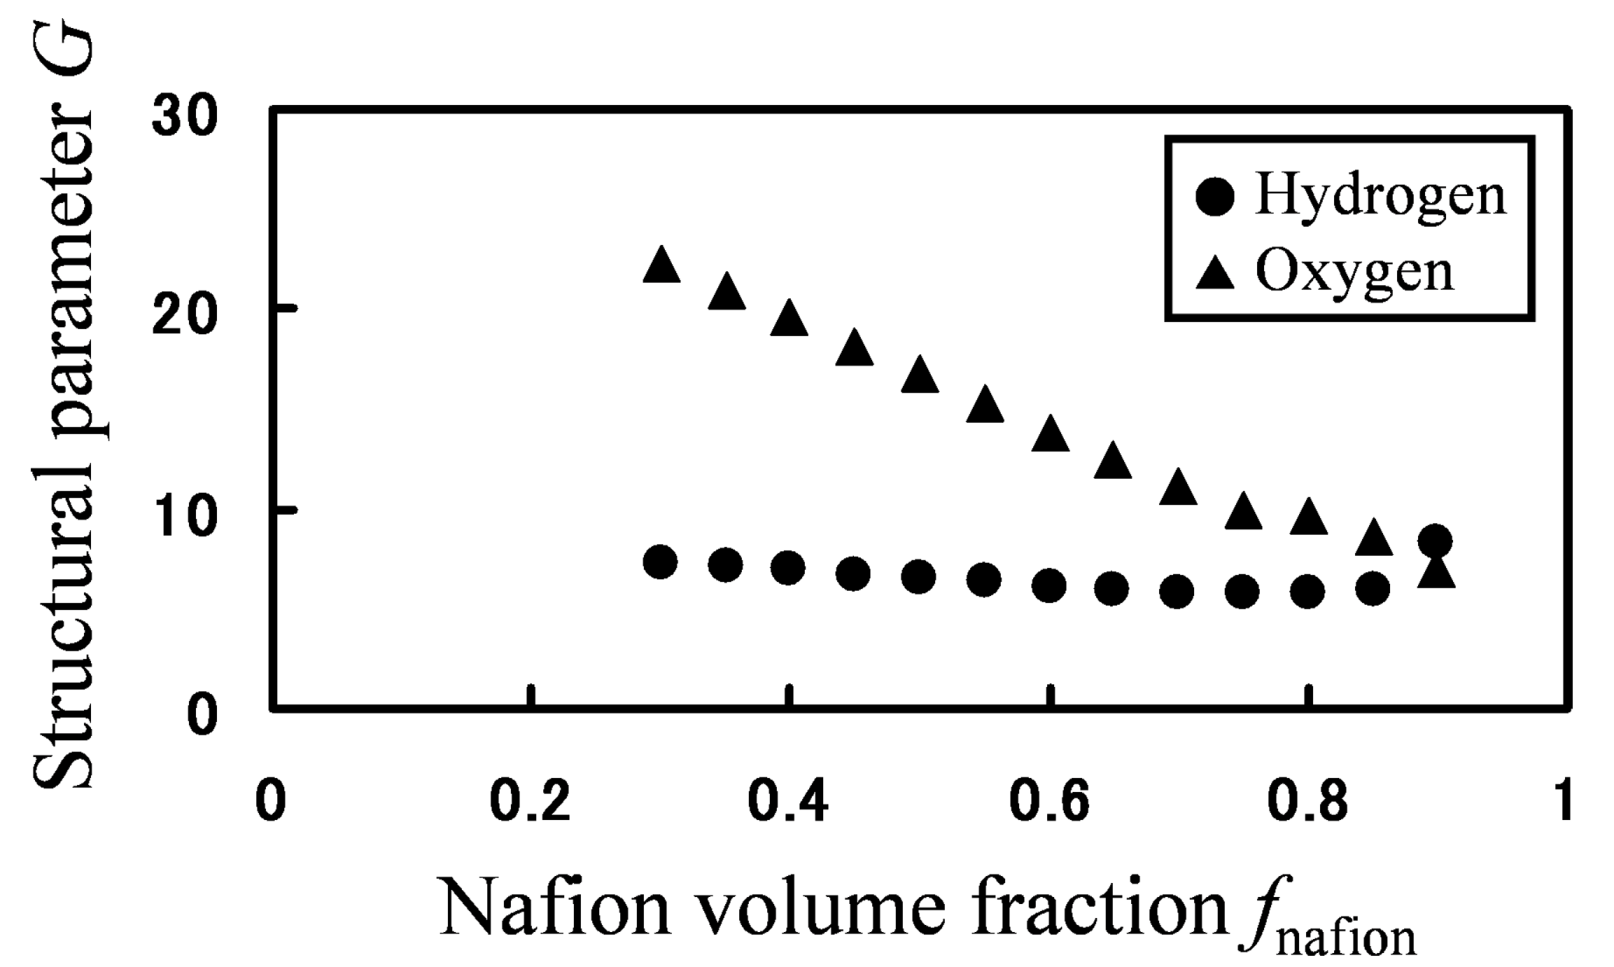
Based on the calculated hydrogen and oxygen permeability, the parameter
G was calculated by Equation (19) for various Nafion fractions (
Figure 12).
Figure 11.
Permeation through heterogeneous media. Relation between permeability and internal heterogeneous structure.
Figure 11.
Permeation through heterogeneous media. Relation between permeability and internal heterogeneous structure.
Figure 12.
Structural parameter G as function of Nafion volume fraction: (●) hydrogen; (▲) oxygen.
Figure 12.
Structural parameter G as function of Nafion volume fraction: (●) hydrogen; (▲) oxygen.
If mobility between different components would be the same, one
G value can be associated with a certain structure. However, for the same phase-separated structures at the same Nafion volume fraction, values of
G greatly differ depending on gaseous species, so mobility between two components are different for hydrogen and oxygen. Moreover, as the volume fraction of Nafion decreases, the water cluster networks are better connected leading to an increased
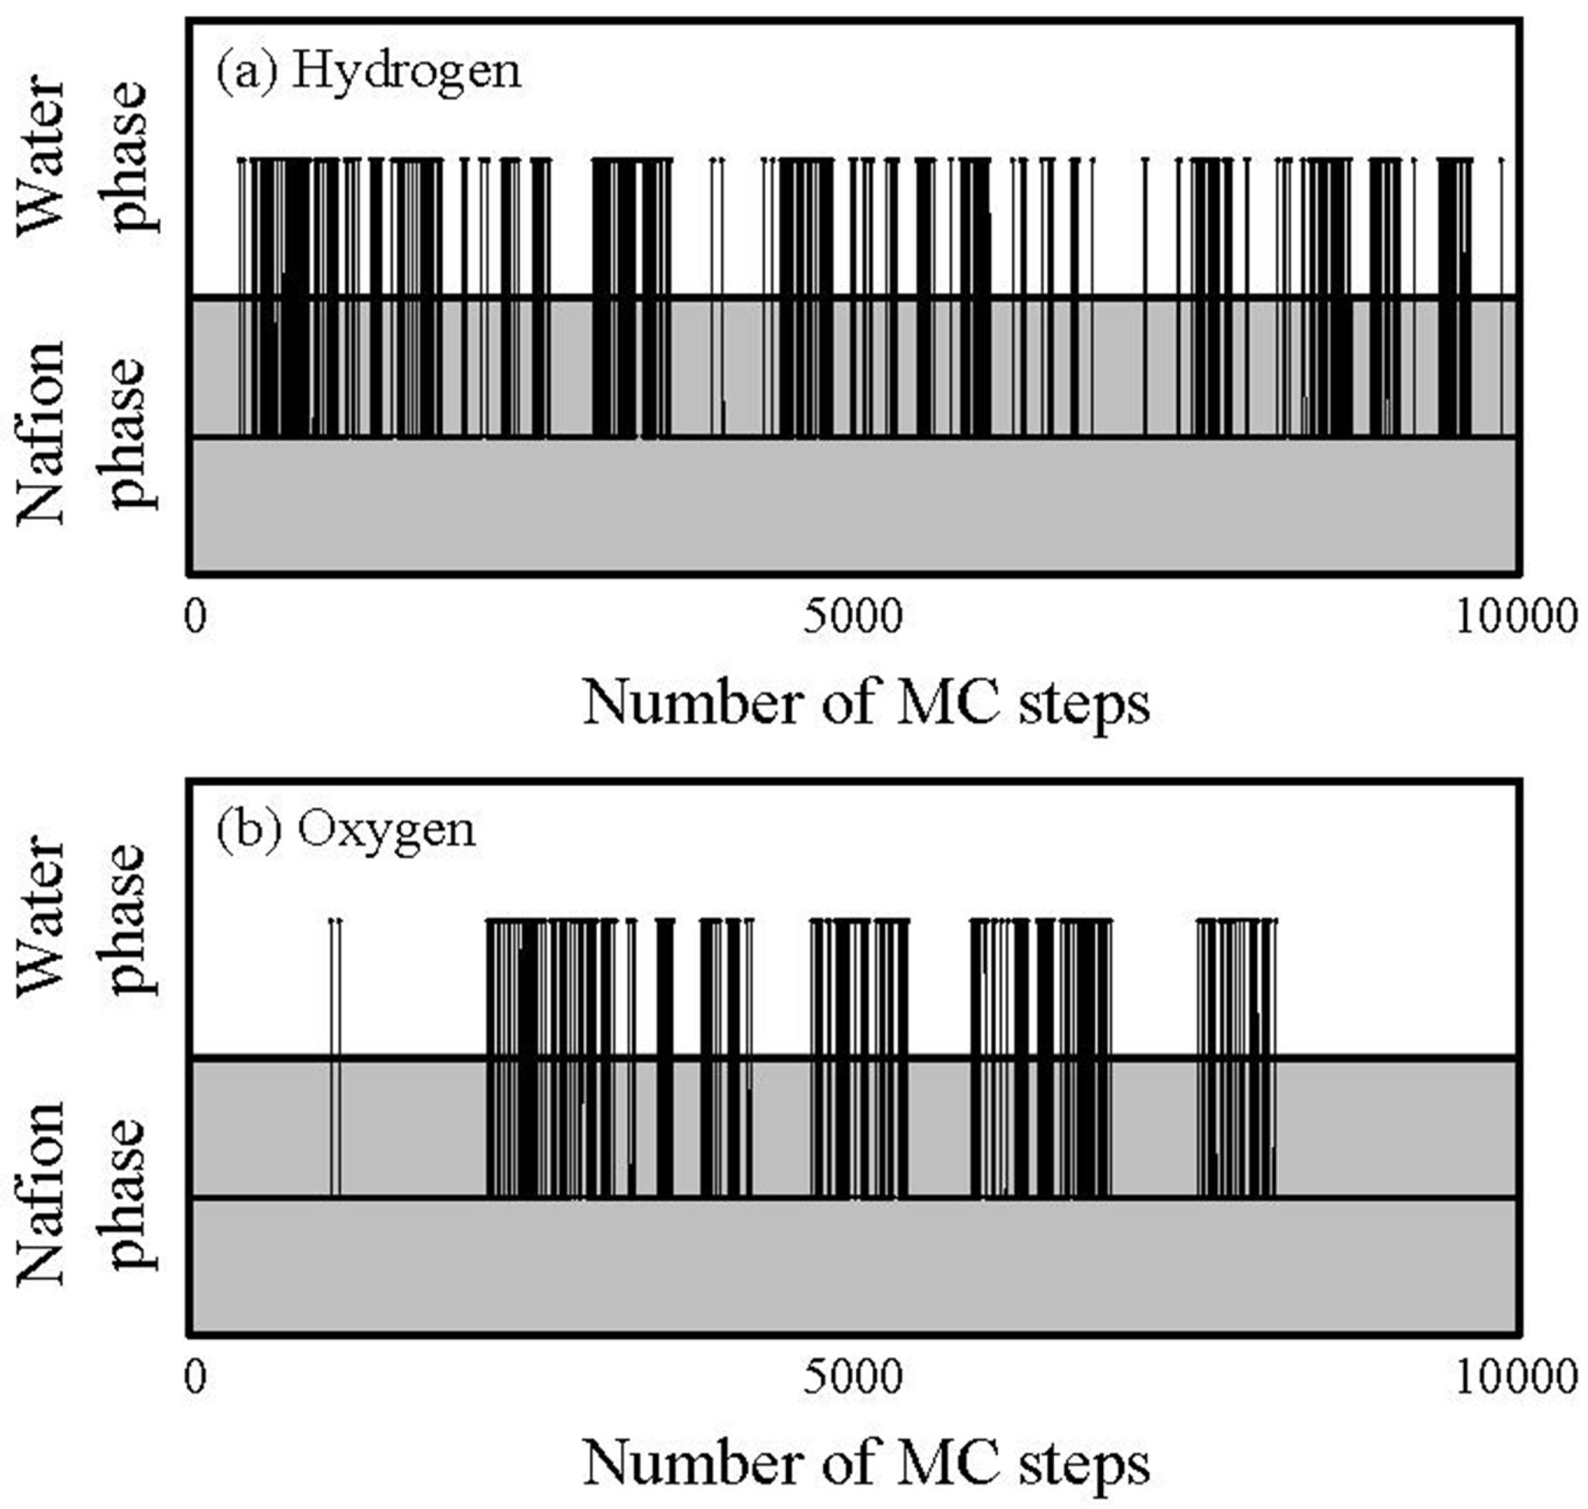
G value. This is indeed clearly seen for oxygen, but not for hydrogen. This is because the migration or transfer between two components occurs more easily for hydrogen, while the migration of oxygen mainly occurs within the single water component. That is, the migration-location differs depending on gaseous species. In order to confirm the migration-location directly, we investigated the component where gas particles mainly stay during 10,000 steps. The results are presented in
Figure 13.
Figure 13.
Tragectory of gas particlesduring diffusion process through hydrated Nafion at 40 degrees Celsius and 0.7 volume fraction of Nafion.
Figure 13.
Tragectory of gas particlesduring diffusion process through hydrated Nafion at 40 degrees Celsius and 0.7 volume fraction of Nafion.
The horizontal and vertical axes indicate time and components in which the particles stay, respectively, and the line across the components indicates a jump between two components.
Figure 13 also shows that, although the jump events occur for both hydrogen and oxygen, the frequency of which they occur is higher for hydrogen. Also, the oxygen gas particles stay longer in the Nafion component than the hydrogen particles.
Since the extent to which gas migration occurs within one phase as compared to the other is different for hydrogen and oxygen, this will affect the direction of polymer design in order to control permeation of fuel gasses. Therefore, it has been clarified that gas barriers can be enhanced by control of percolation and interface structures of water clusters for hydrogen and also be enhanced by lowering the diffusivity in the polymer phase for oxygen.
3.3. Mechanical Strength
Mechanical strength was calculated for membranes at various moisture levels. Each Nafion 117 chain consisted of 25 repeat units and the water volume fraction within the Nafion membrane was varied as listed in
Table 3. After generating coarse-graining particles of Nafion and water randomly at the initial state, energy was converged within the NPT ensemble at 25 degrees Celsius for more than 10
6 time steps to obtain equilibrium structures of hydrated membranes. The time step was set at 0.006 so that relative errors of the temperature were less than 0.3%. When evaluating elastic modulus from a stress-strain curve by extending the hydrated membranes, the cells were deformed by 5% with a speed of 0.0176 m/s along one direction while keeping the cell volume constant under the deformation. To save the calculation cost the deformation rate used here is almost twenty times higher as the deformation rate in the experiment [
29]. The general coarse graining molecular dynamics simulator OCTA/COGNAC [
30] was used for the calculation.
Table 3.
Simulation conditions of hydrated Nafion membrane at various water content values.
Table 3.
Simulation conditions of hydrated Nafion membrane at various water content values.
| λ = NH20/NSO3H | Number of Nafion chains | Number of W particles |
|---|
| 0 | 41 | 0 |
| 3 | 128 | 2397 |
| 4 | 37 | 919 |
| 4 | 124 | 3103 |
| 5 | 121 | 3780 |
| 8 | 33 | 1663 |
| 14 | 98 | 8518 |
| 20 | 26 | 3201 |
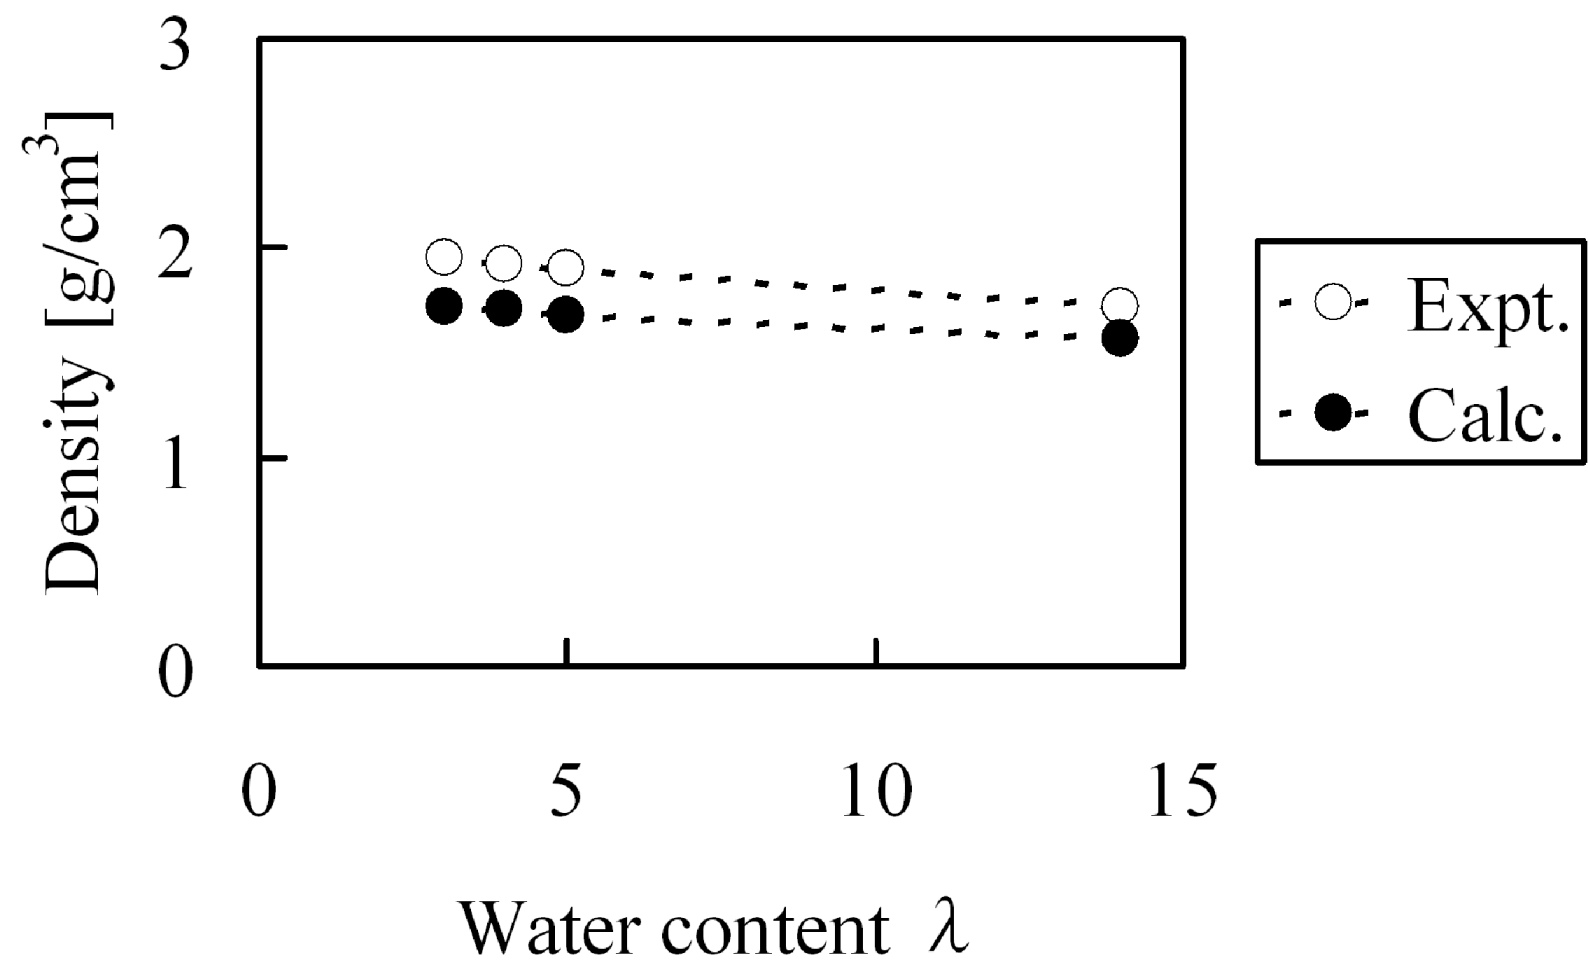
At first, before evaluating elastic modulus, we confirmed whether the experiment could be reproduced with regards to the bulk density and water cluster network structures for hydrated Nafion membranes. The experimental Nafion mass density in dry state was reported as 2.05 g/cm
3 [
31] while our calculated value was 1.94 g/cm
3. Under the water absorption conditions at λ = 3, λ = 4, λ = 5 and λ = 14, the mass densities shown in
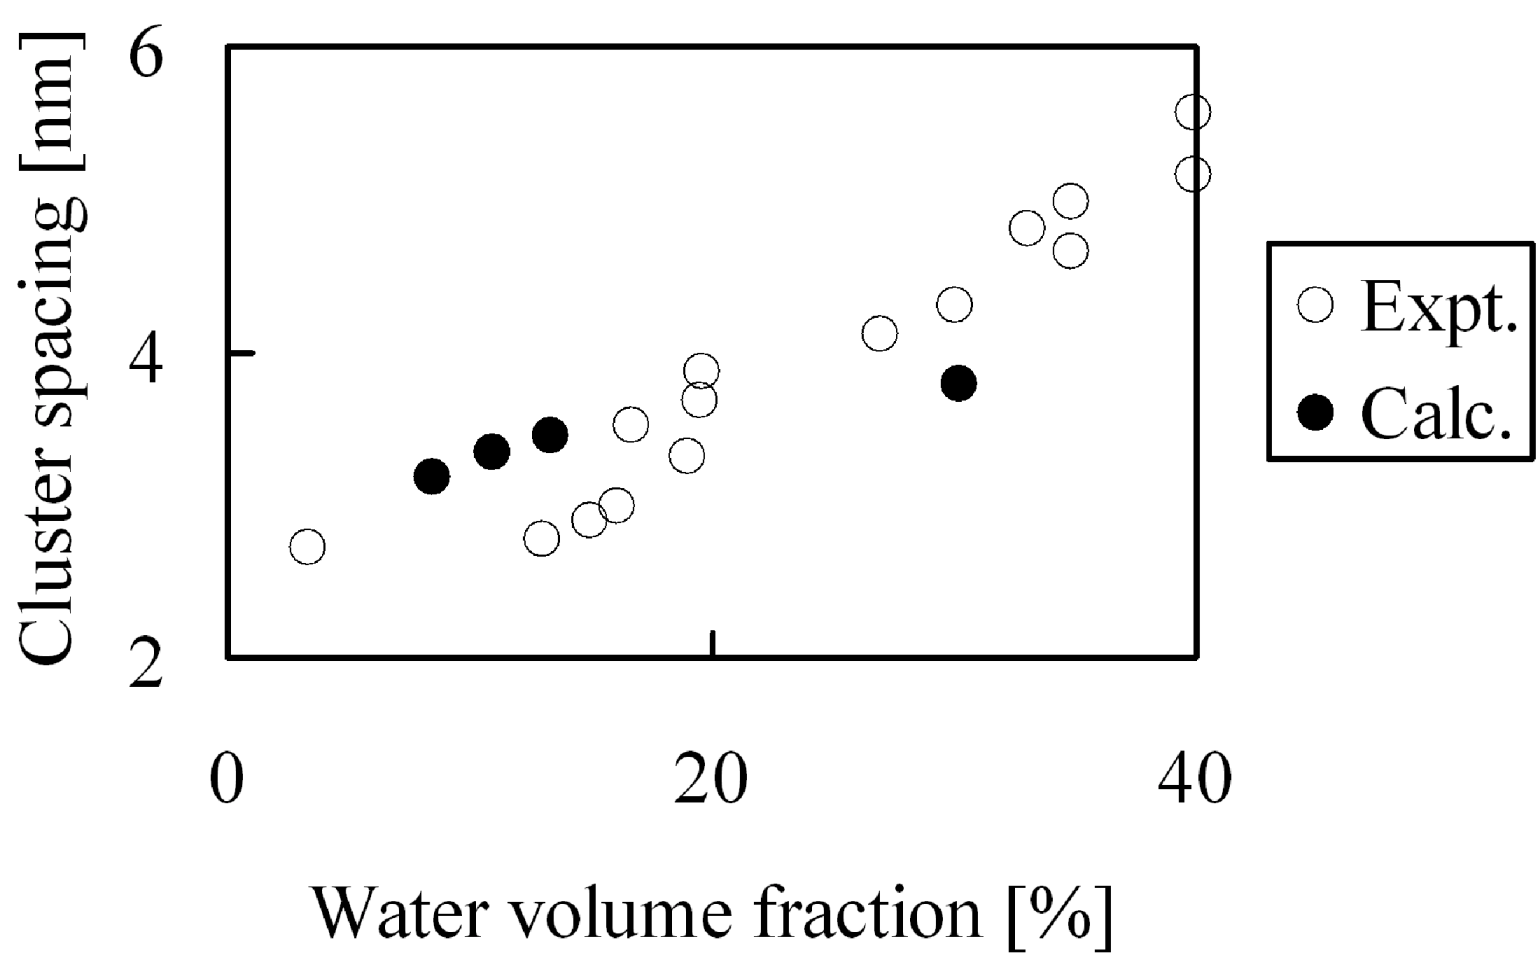
Figure 14 were obtained, this indicates that the calculated bulk density agreed well with the experimental values. On the other hand, absorbed water forms cluster network structures inside the membranes and the separation distance between the clusters have already been estimated from small-angle X-ray scattering experiments [
7,
8]. We estimated the cluster separations from the radial distribution function of the coarse-graining water particles, and the results are compared with the experimental results in
Figure 15. Overall, the inner structures were reproduced well quantitatively for a wide range of hydration levels, which reveals that the calculation method used in this study is adequate. At high water volume fraction the obtained cluster spacing is slightly lower than the experimental values. The reason for this might be that the atomistic force field used for the water molecules to obtain the coarse-grained potentials is the 3-site model, which might somewhat underestimate the interaction between water, resulting in more dense water and therefore smaller cluster spacings at high hydration levels.
Figure 14.
Density of hydrated Nafion as function of water content: (○) experimental data [
31]; (●) coarse-grained calculation.
Figure 14.
Density of hydrated Nafion as function of water content: (○) experimental data [
31]; (●) coarse-grained calculation.
Figure 15.
Cluster spacing of hydrated Nafion as function of water volume fraction: (○) experimental data [
8]; (●) coarse-grained calculation.
Figure 15.
Cluster spacing of hydrated Nafion as function of water volume fraction: (○) experimental data [
8]; (●) coarse-grained calculation.
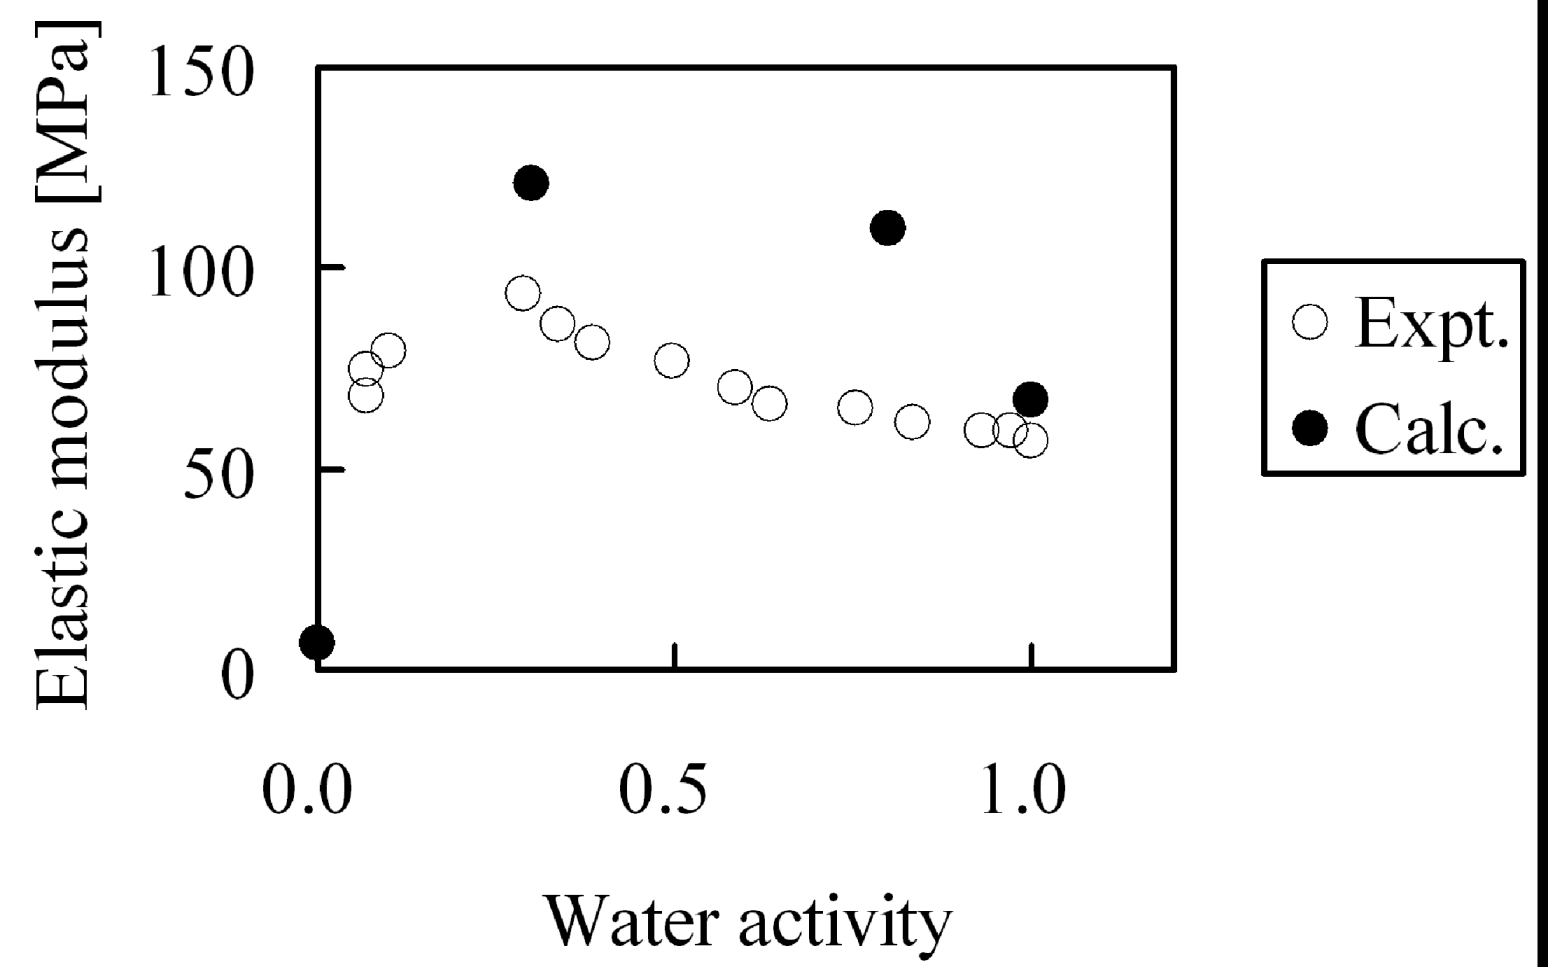
Second, the membranes with moisture absorption of λ = 0, λ = 4, λ = 8 and λ = 20 were stretched and elastic modulus was evaluated. Since deformation volume at the longest extension is as small as 5%, while the yield point in the experiments appears above 5% deformation, we calculated the elastic modulus from the gradient of the stress-strain curve under the assumption that stress distortion occurred within the elastic domain. The moisture absorption dependence of the elastic modulus is shown in
Figure 16. While from the simulations the tendency appears in which elastic modulus has a maximum when plotted against moisture absorption as observed in experiment, the absolute values of the elastic modulus cannot be reproduced quantitatively. As mentioned above, this is because the extension speed was twenty times faster than in the experiments.
Figure 16.
Elastic modulus of hydrated Nafion as function of water activity: (○) experimental data [
29]; (●) coarse-grained calculation.
Figure 16.
Elastic modulus of hydrated Nafion as function of water activity: (○) experimental data [
29]; (●) coarse-grained calculation.
The cause of the apparent maximum in the elastic modulus in
Figure 16 was investigated by analyzing the internal structure of the hydrated membranes. Since higher-order structure such as appearance of crystals was not observed during our calculations for any hydrated membrane, we tried to analyze from the viewpoint of the molecular theory of rubber elasticity.
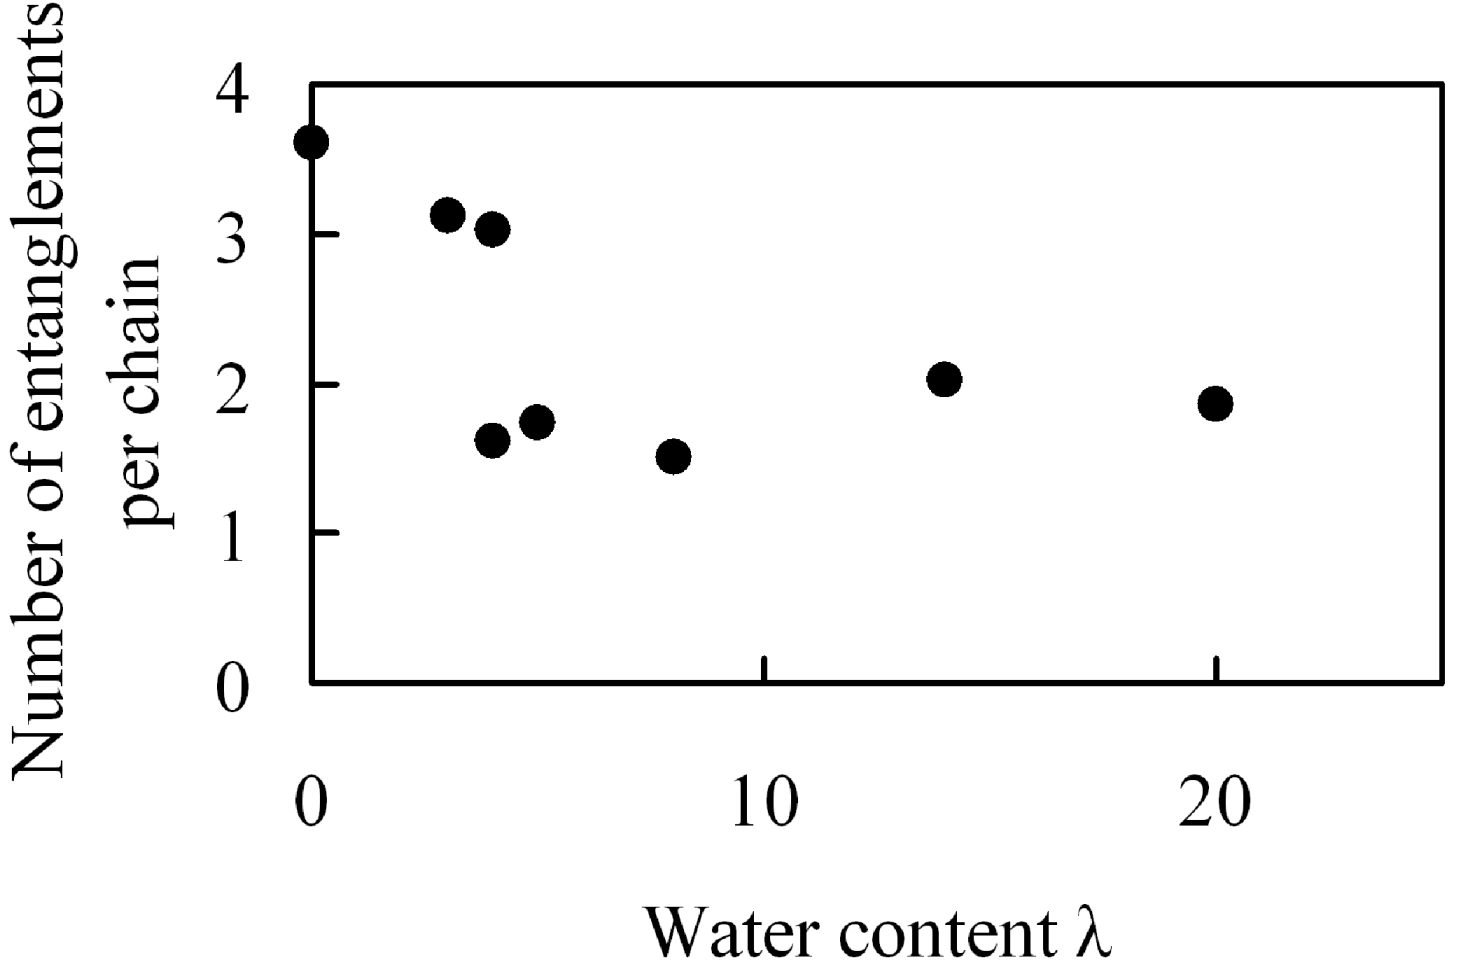
In membranes, polymer chain configurations are complicated and intertwined with each other, and this intertwinement acts as a crosslink under deformation. Since we presumed that the extent in which intertwinements occur depends on the amount of absorbed water, we analyzed them. In the analysis, chains were pulled by shortening the equilibrium bond length while keeping both ends of all polymer chains fixed in space, and we evaluated the number of entanglement points per chain by counting how many of them are intertwined with each other [
32]. The results are shown in
Figure 17.
Figure 17.
Number of entanglements per chain in hydrated Nafion as function of water content.
Figure 17.
Number of entanglements per chain in hydrated Nafion as function of water content.
There are 1.5–3.6 entanglements per polymer chain and overall they decrease monotonously with the amount of absorbed moisture. This change in the number of entanglements with water moister uptake observed in
Figure 17 seems not to be related with the elastic modulus data in which a maximum was recognized.
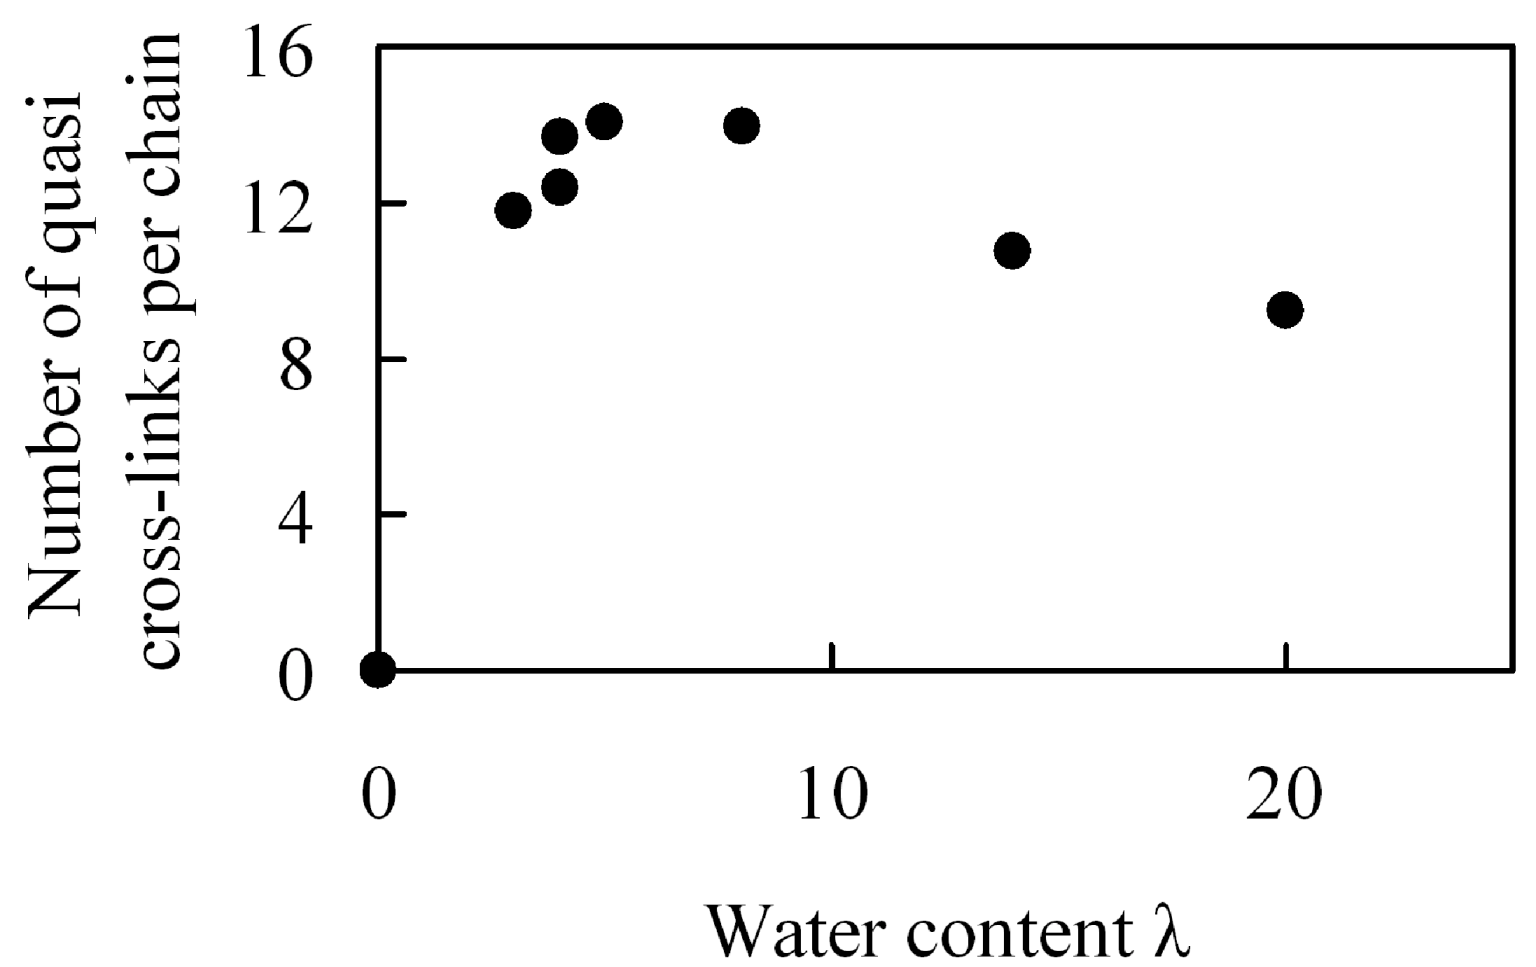
The effect of water content on crosslink formation was examined. Although Nafion does not have an intrinsic crosslinked molecular structure, it is possible that the sulfonic groups in the structure, along with water molecules, generate tightly bound hydrogen bonds, and that these hydrogen bonds are involved in quasi-crosslinked structures between two sulfonic groups that are bridged by water molecules. Presuming that these quasi-crosslinks are related to the enhancement of mechanical strength, we estimated the number of quasi-crosslinked C–W–C structures that are generated between the coarse-grained C particles and the coarse-grained water W particles. A quasi-crosslink is defined as a C–W–C bridge for which both C–W and W–C distances are shorter than the equilibration distance 1.1σ obtained from the interaction potential.
Figure 18 shows moisture absorption dependence of the number of quasi crosslinks per polymer chain. The number of quasi crosslinks has a maximal value for moisture absorption near λ = 5 which is near the λ value for which a maximum in the elastic modulus occurs. Moreover, near this maximum, more than a half of the sulfonic groups in one polymer chain are involved in the formation of quasi-crosslinked structures. Since the number is about 1.5 times larger than in the case of large amount of water, it is likely that quasi-crosslinked structures consisting of sulfonic groups and water molecules are the source of the maximum value observed for the elastic modulus, which affects mechanical strength of membranes. If the quasi-crosslinks affect the elasticity significantly, the quasi-crosslink points that are once formed are supposed to persist during elongation. Thus, we investigated how much of the initial crosslinked structures are maintained when they are stretched. Since the result showed that about 70% of the structures were maintained after extension by 5%, it is understood that quasi-crosslinks cause the generation of elasticity. Further, the reason why the number of quasi crosslinks decreases for large moisture absorption is that the quantity of water contained between sulfonic groups increases, which makes it difficult to form quasi-crosslinks.
Figure 18.
Number of quasi-crosslinks per chain in hydrated Nafion as a function of water content.
Figure 18.
Number of quasi-crosslinks per chain in hydrated Nafion as a function of water content.
From the above results, an increase of quasi-crosslinked structures is one of the methods to enhance the mechanical strength of membranes and to improve its durability. In order to increase quasi-crosslinks also under high moisture absorption conditions, it is important to generate narrow water channels as cluster networks, where a large quantity of water cannot easily be located between the acidic sites. It is possible to perform molecular design for membranes that realize the above from the relationship between cluster sizes and polymer structures [
3]. However, water cluster networks are the migration path of protons. Therefore, proton conductivity simultaneously could fall for narrow channels. Hence, it is important to clarify the cluster size that realizes both higher mechanical strength and better proton conductivity. Utilization of polymer simulation enables the deriving of molecular structures which can have optimal values of cluster sizes within a short simulation time. For the mechanical strength, further study in regards to the variation of internal polymer conformations and elastic property after swelling and shrinking the membrane repeatedly will be needed.


