3.1. Failure Modes
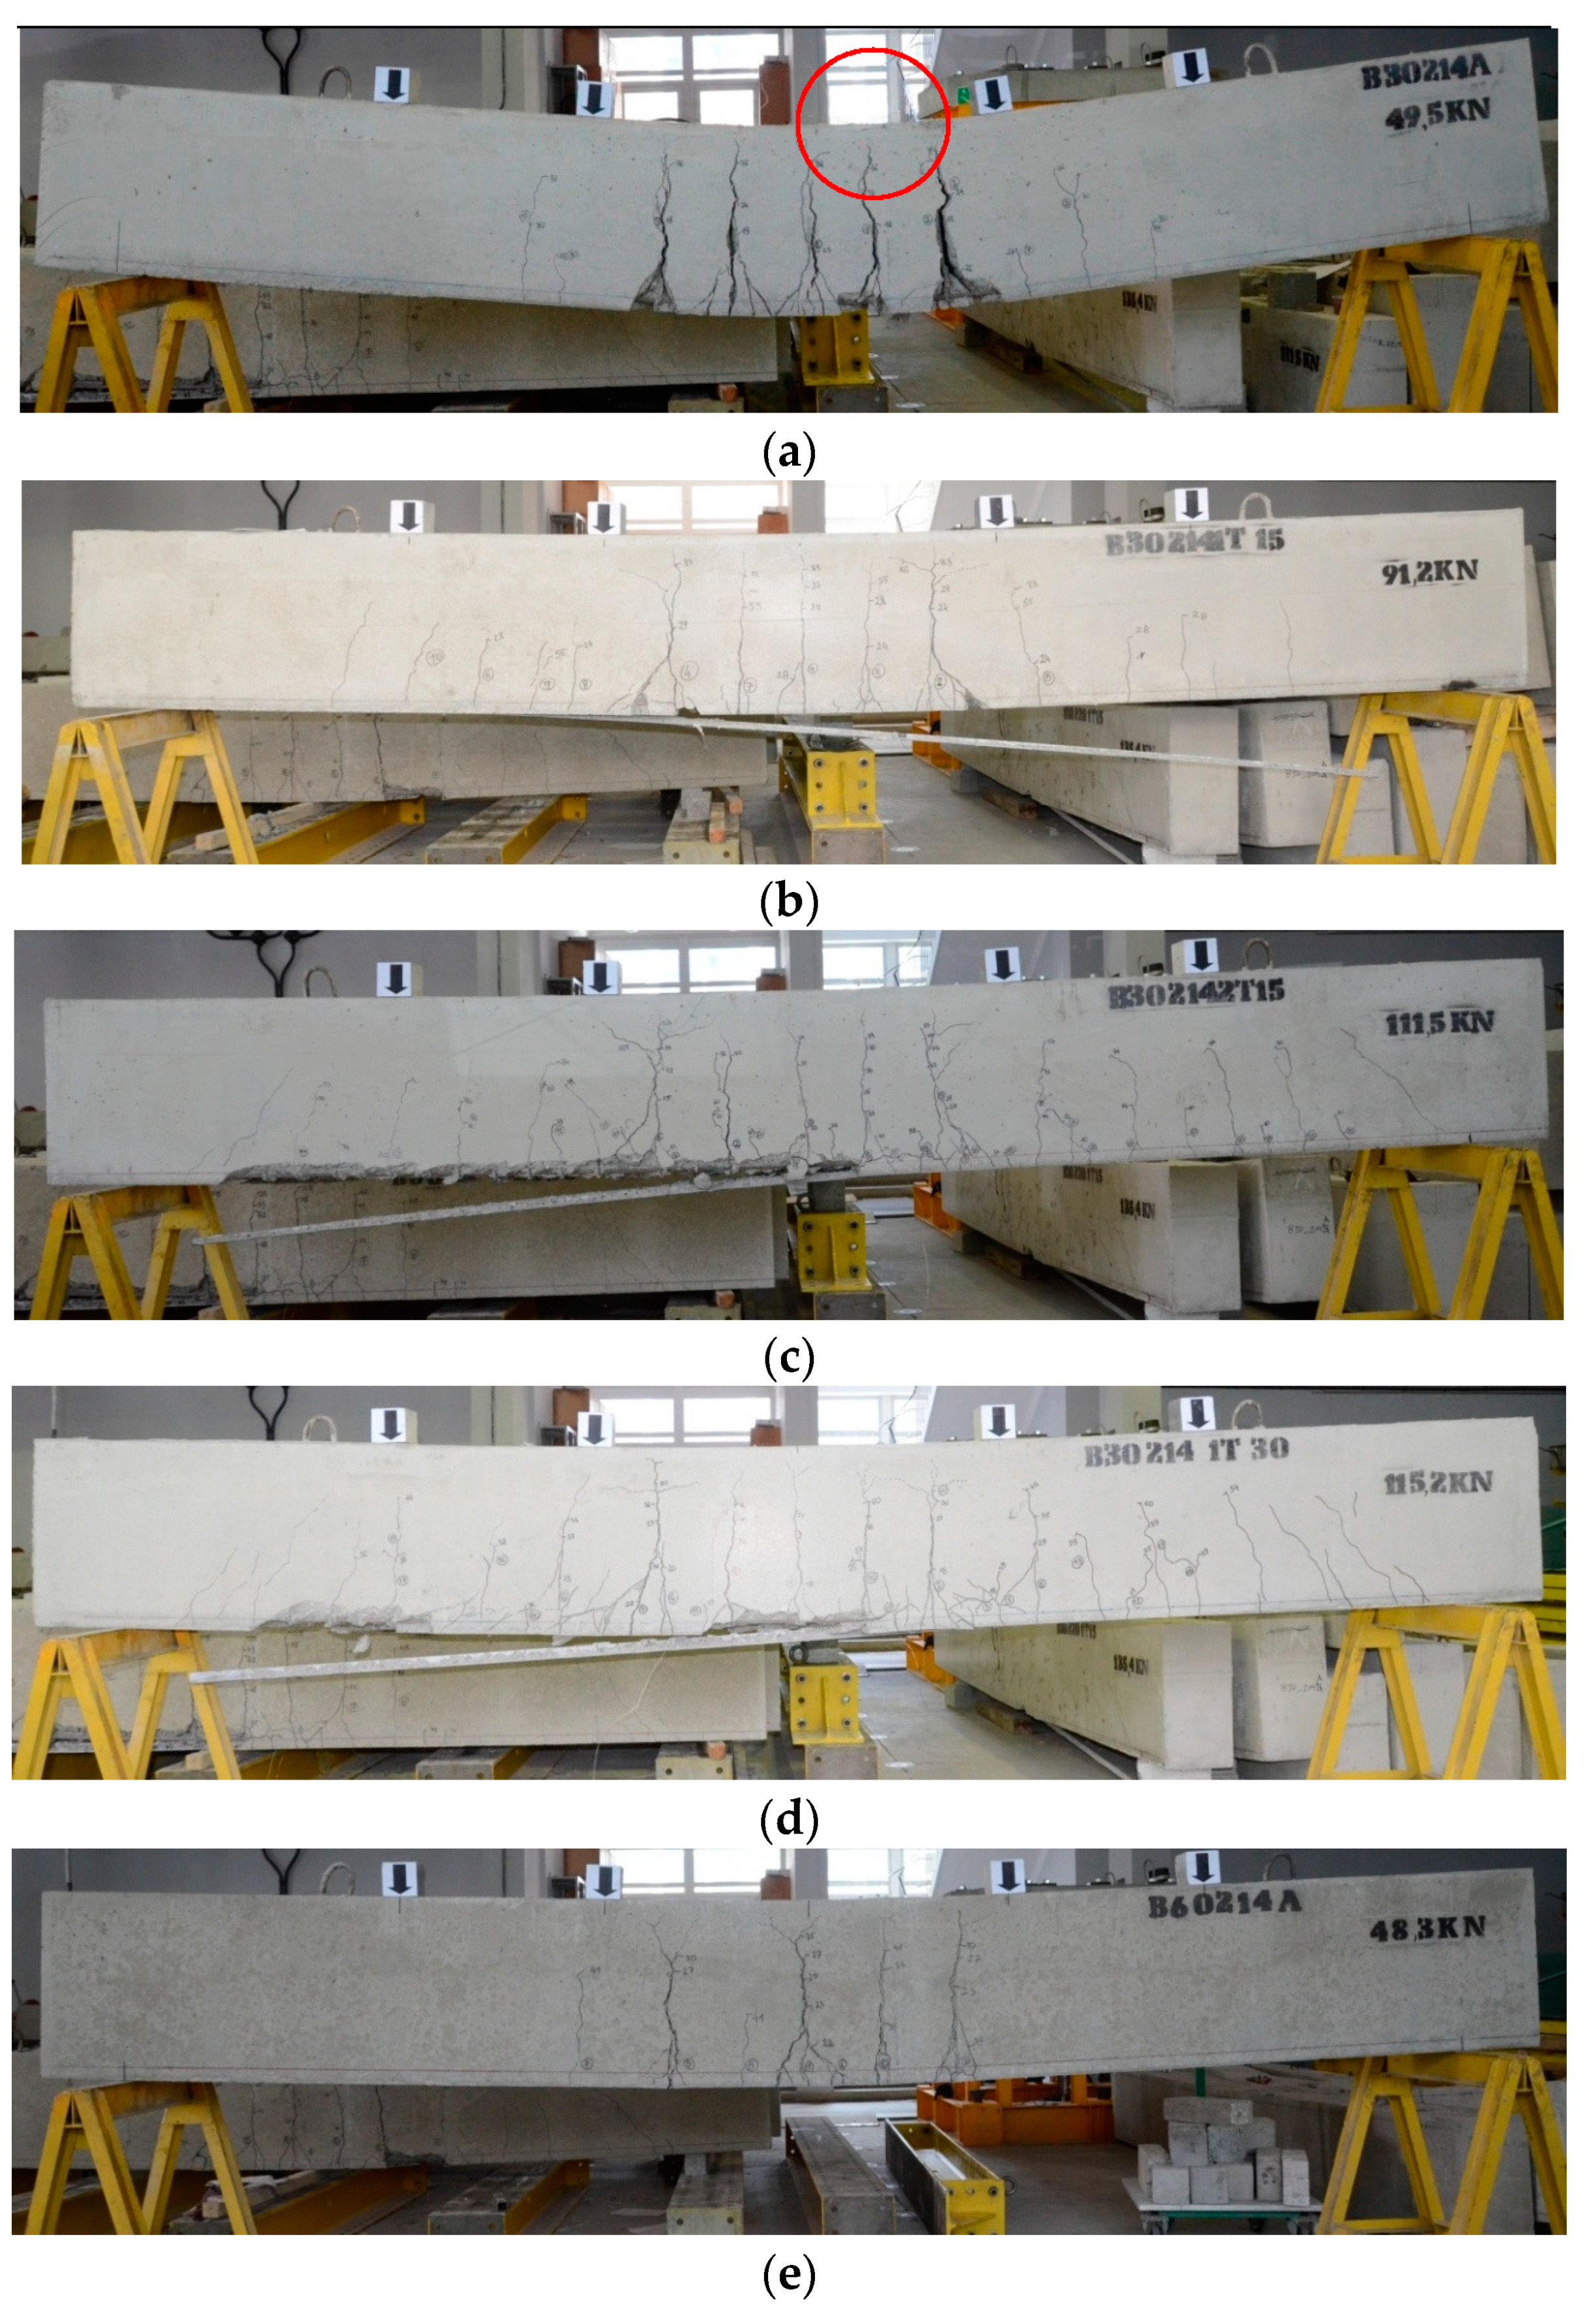
Reference beams (B30-214-A and B60-214-A) failed in a ductile flexural mode typical of under-reinforced steel-RC structures. The failure featured yielding of the tensile steel reinforcement (SY), which is seen as a progressive increase in the mid-span deflection and a small increase in the applied load, which is discussed in
Section 3.3. After the steel yielding and progressive increase in midspan deflection of beam B60-214-A, the applied load was stopped when the mid-span LVDT exceeded its range of 50 mm. In order to obtain higher deflections in beam B30-214-A, a longer 200 mm LVDT was used. When the midspan deflection reached 104 mm, the concrete in compression, close to the internal loading point started crushing (see
Figure 5a) and the beam was immediately unloaded (see
Section 3.3). It is worth noting, that these crucial points in the reference beam tests were identified as the ultimate loads and corresponding maximum mid-span deflections. It is expected that the B60 beam would have continued to a maximum deflection only slightly less than the B30 beam.
Figure 5.
Failure modes of tested beams: (
a–
i) corresponding to beams No. (1–9,
Table 1).
Figure 5.
Failure modes of tested beams: (
a–
i) corresponding to beams No. (1–9,
Table 1).
The strengthened beams failed in almost all cases by intermediate crack debonding (ICD) of the CFRP profiles with adjacent concrete cover splitting (CCS) (
Figure 5c–i). This failure initiated in the concrete cover, starting next to the flexural crack closest to the innermost load (
i.e., the crack at which the shear-to-moment ratio is greatest). As the width of this crack increased, the crack changed inclination toward the horizontal. Failure occurred as an abrupt debonding from near midspan toward one support of the CFRP profile with attached concrete cover separation (CCS) at the level of the longitudinal steel reinforcement. Failure modes observed in all tested beams are summarized in
Table 4 and
Figure 5.
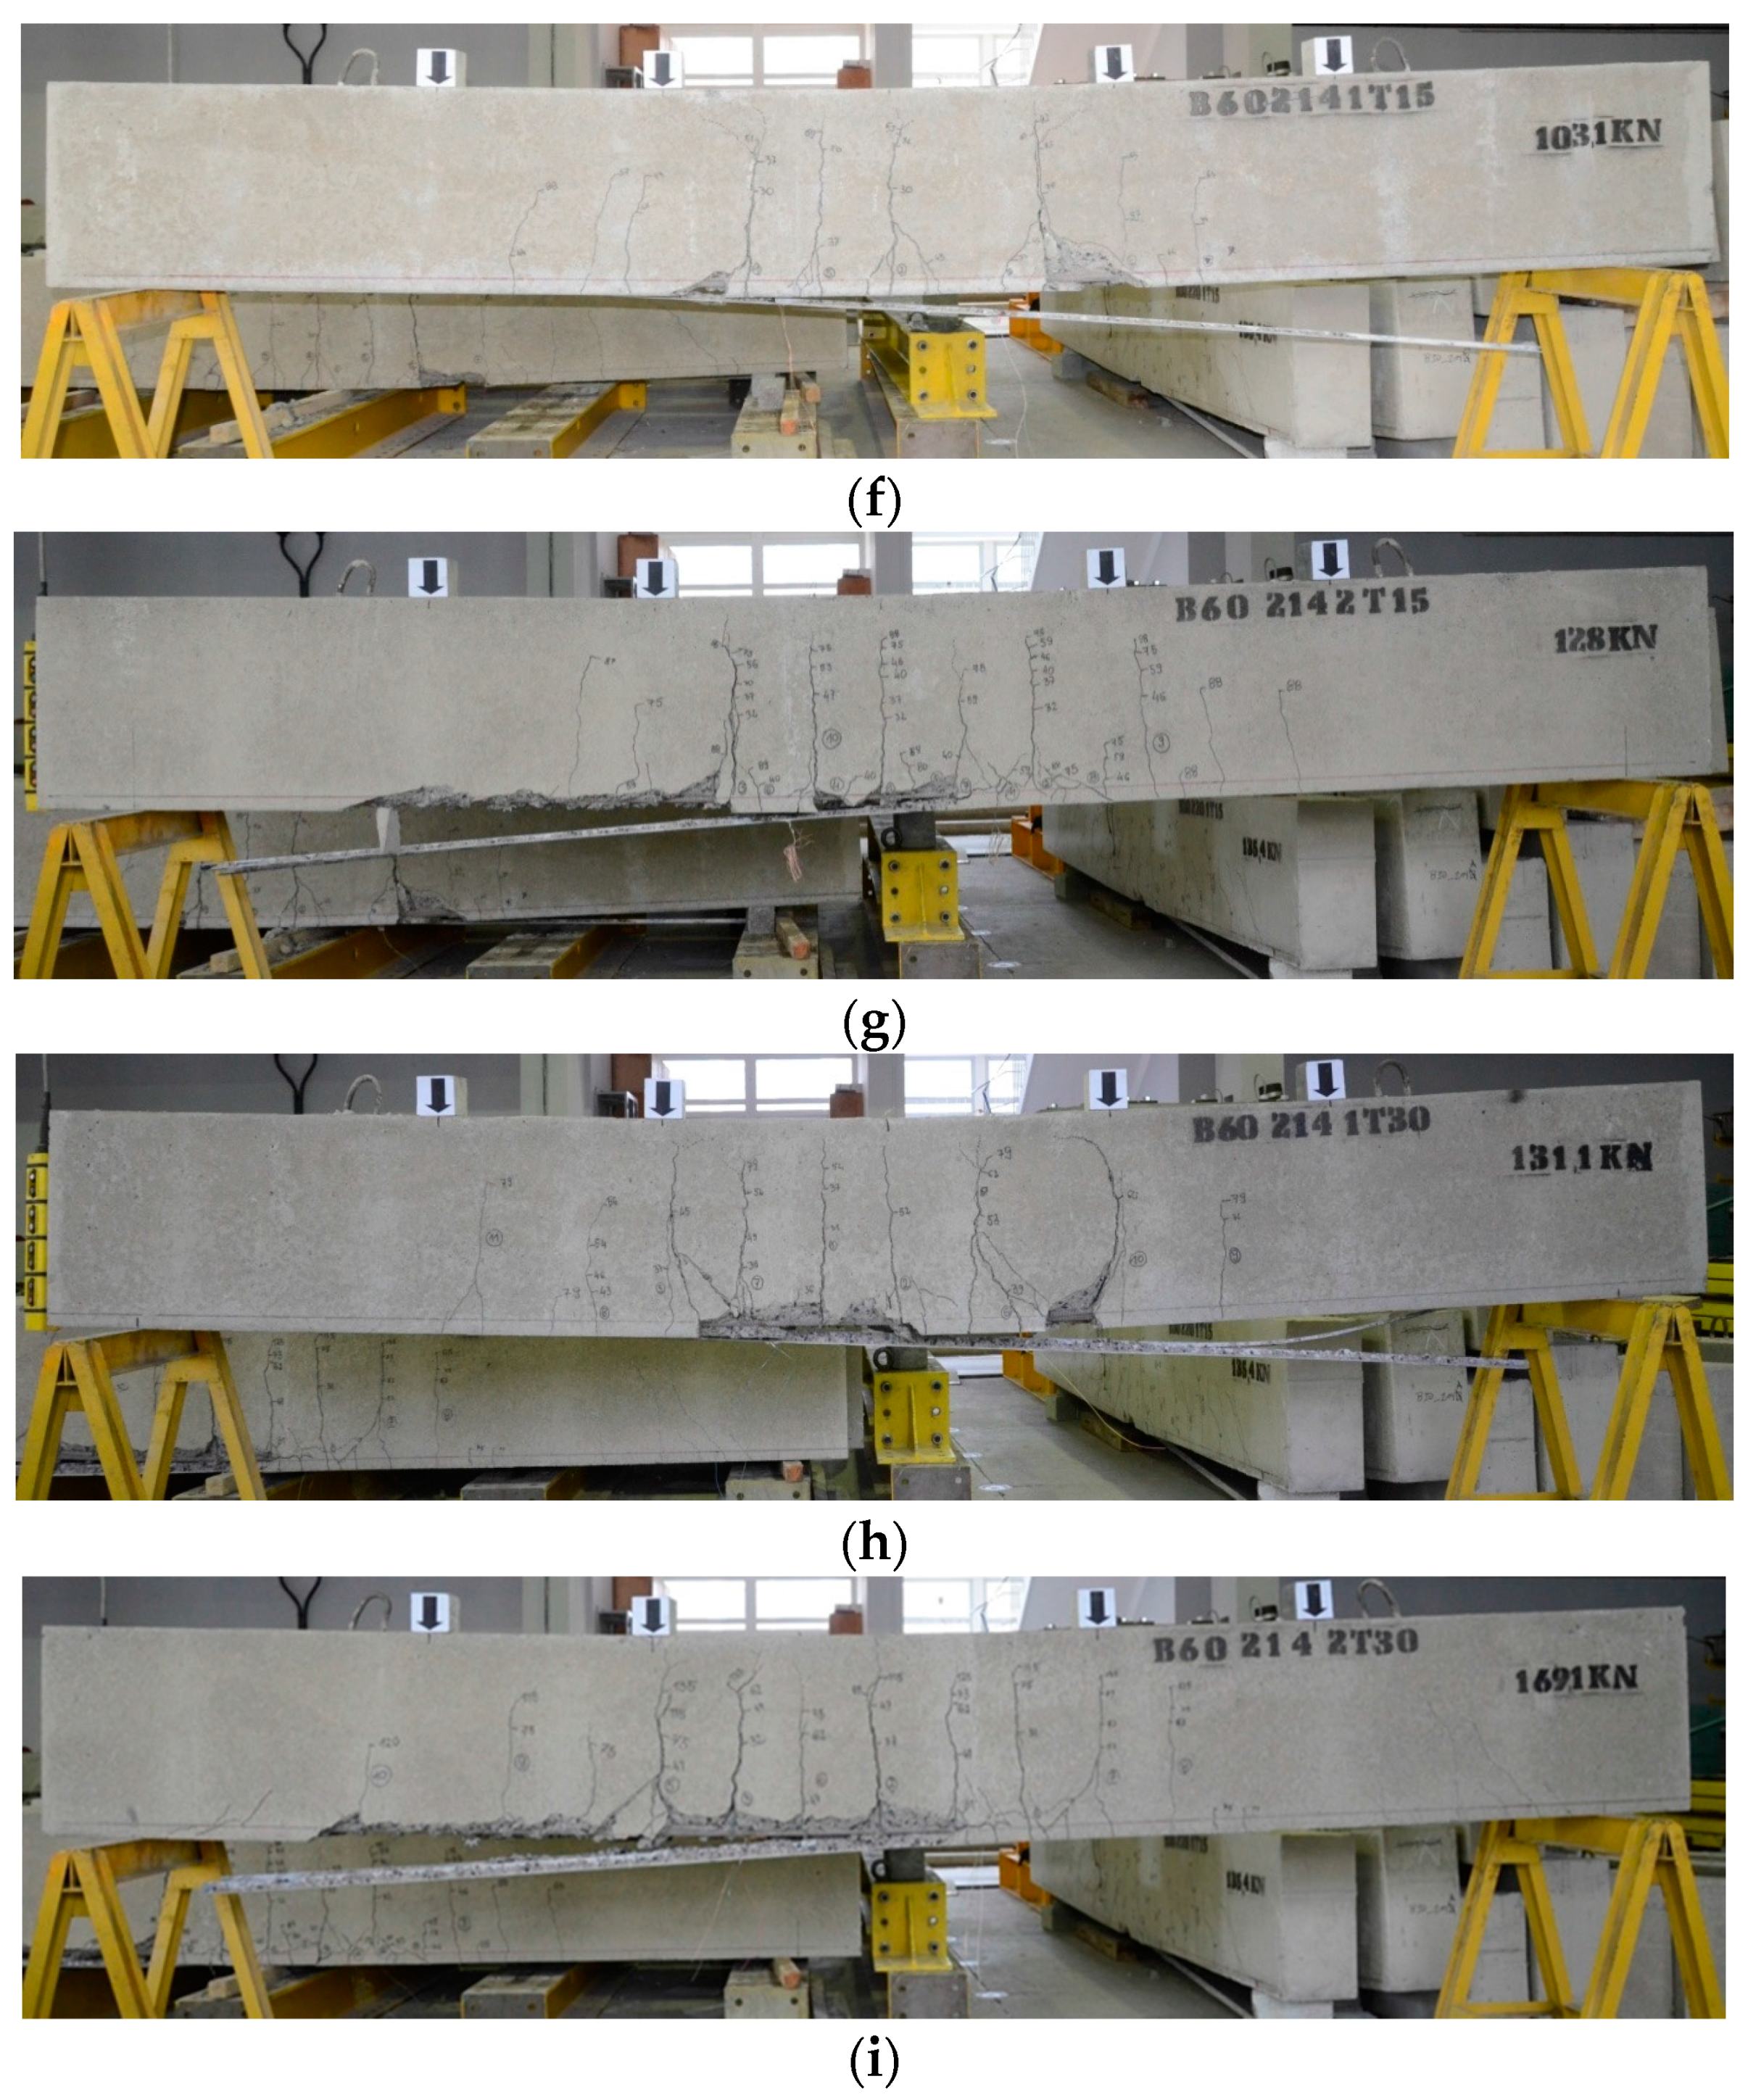
One of the strengthened beams (B60-214-1T-15) partially failed by intermediate crack debonding (ICD) and pure interfacial bond failure between the CFRP profile and adhesive (BPA). This failure was caused by a poor adhesion between the smooth CFRP profile and adhesive. In the beams strengthened with the 15 mm deep profiles, a detached concrete cover consisted of a concrete triangular prism with the CFRP profile inside (see
Figure 6).
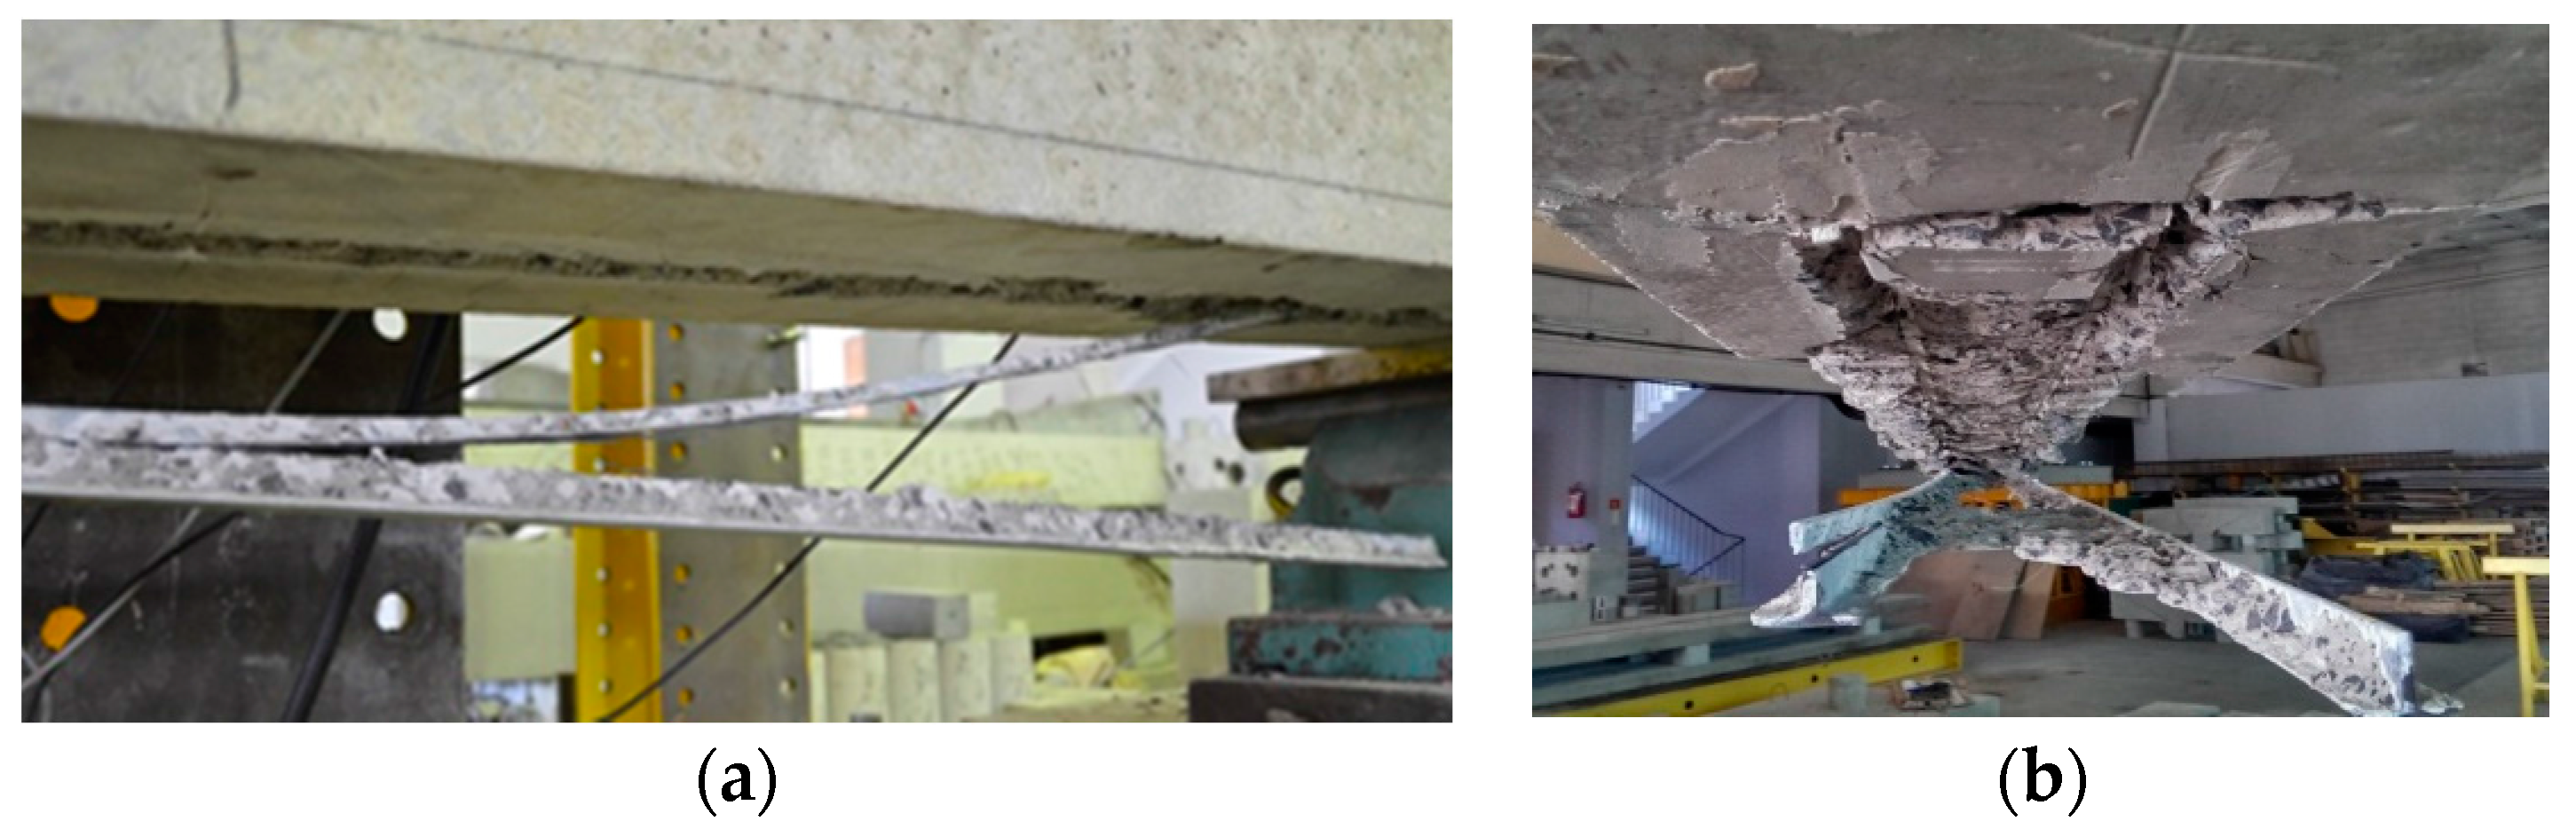
In two beams strengthened with 30 mm deep profiles (B60-214-1T-30 and B60-214-2T-30), the ICD failure of the CFRP profile occurred with the partial longitudinal crack separation of the CFRP profiles along the fiber interface being observed (
Figure 7). Longitudinal fracture (LFP) of the profile’s web occurred after failure of the beams and was caused by the large deflections of the beams and the high interlaminar shear stress developed in the web of the CFRP profile (
Figure 7).
The number of profiles (one or two) and their depth had a significant effect on the eventual damaged region of the concrete cover; this was wider in the beams strengthened with two CFRP profiles than in the beams with only one and also wider for a greater web depth (
Figure 7). The installation of the 30 mm deep CFRP profiles required cutting of all stirrups along the beam. This did not have any significant impact on the behavior of the strengthened RC members or on the ultimate loads, confirming the observations of [
14,
22,
23].
Table 4.
Failure modes of the beams.
Table 4.
Failure modes of the beams.
| Series | Figure 5 | Symbol | Failure modes |
|---|
| C30/37 | a | B30-214-A | SY + CC |
| b | B30-214-1T-15 | ICD + CCS |
| c | B30-214-2T-15 | ICD + CCS |
| d | B30-214-1T-30 | ICD + CCS |
| C50/60 | e | B60-214-A | SY + CC |
| f | B60-214-1T-15 | ICD + BPA |
| g | B60-214-2T-15 | ICD + CCS |
| h | B60-214-1T-30 | ICD + LFP |
| i | B60-214-2T-30 | ICD + LFP |
Figure 6.
Failure modes: (a) BPA; (b) ICD and (c) BPA.
Figure 6.
Failure modes: (a) BPA; (b) ICD and (c) BPA.
Figure 7.
Longitudinal fracture of the CFRP profile web in beams: (a) B60-214-1T-30; (b) B60-214-2T-30.
Figure 7.
Longitudinal fracture of the CFRP profile web in beams: (a) B60-214-1T-30; (b) B60-214-2T-30.
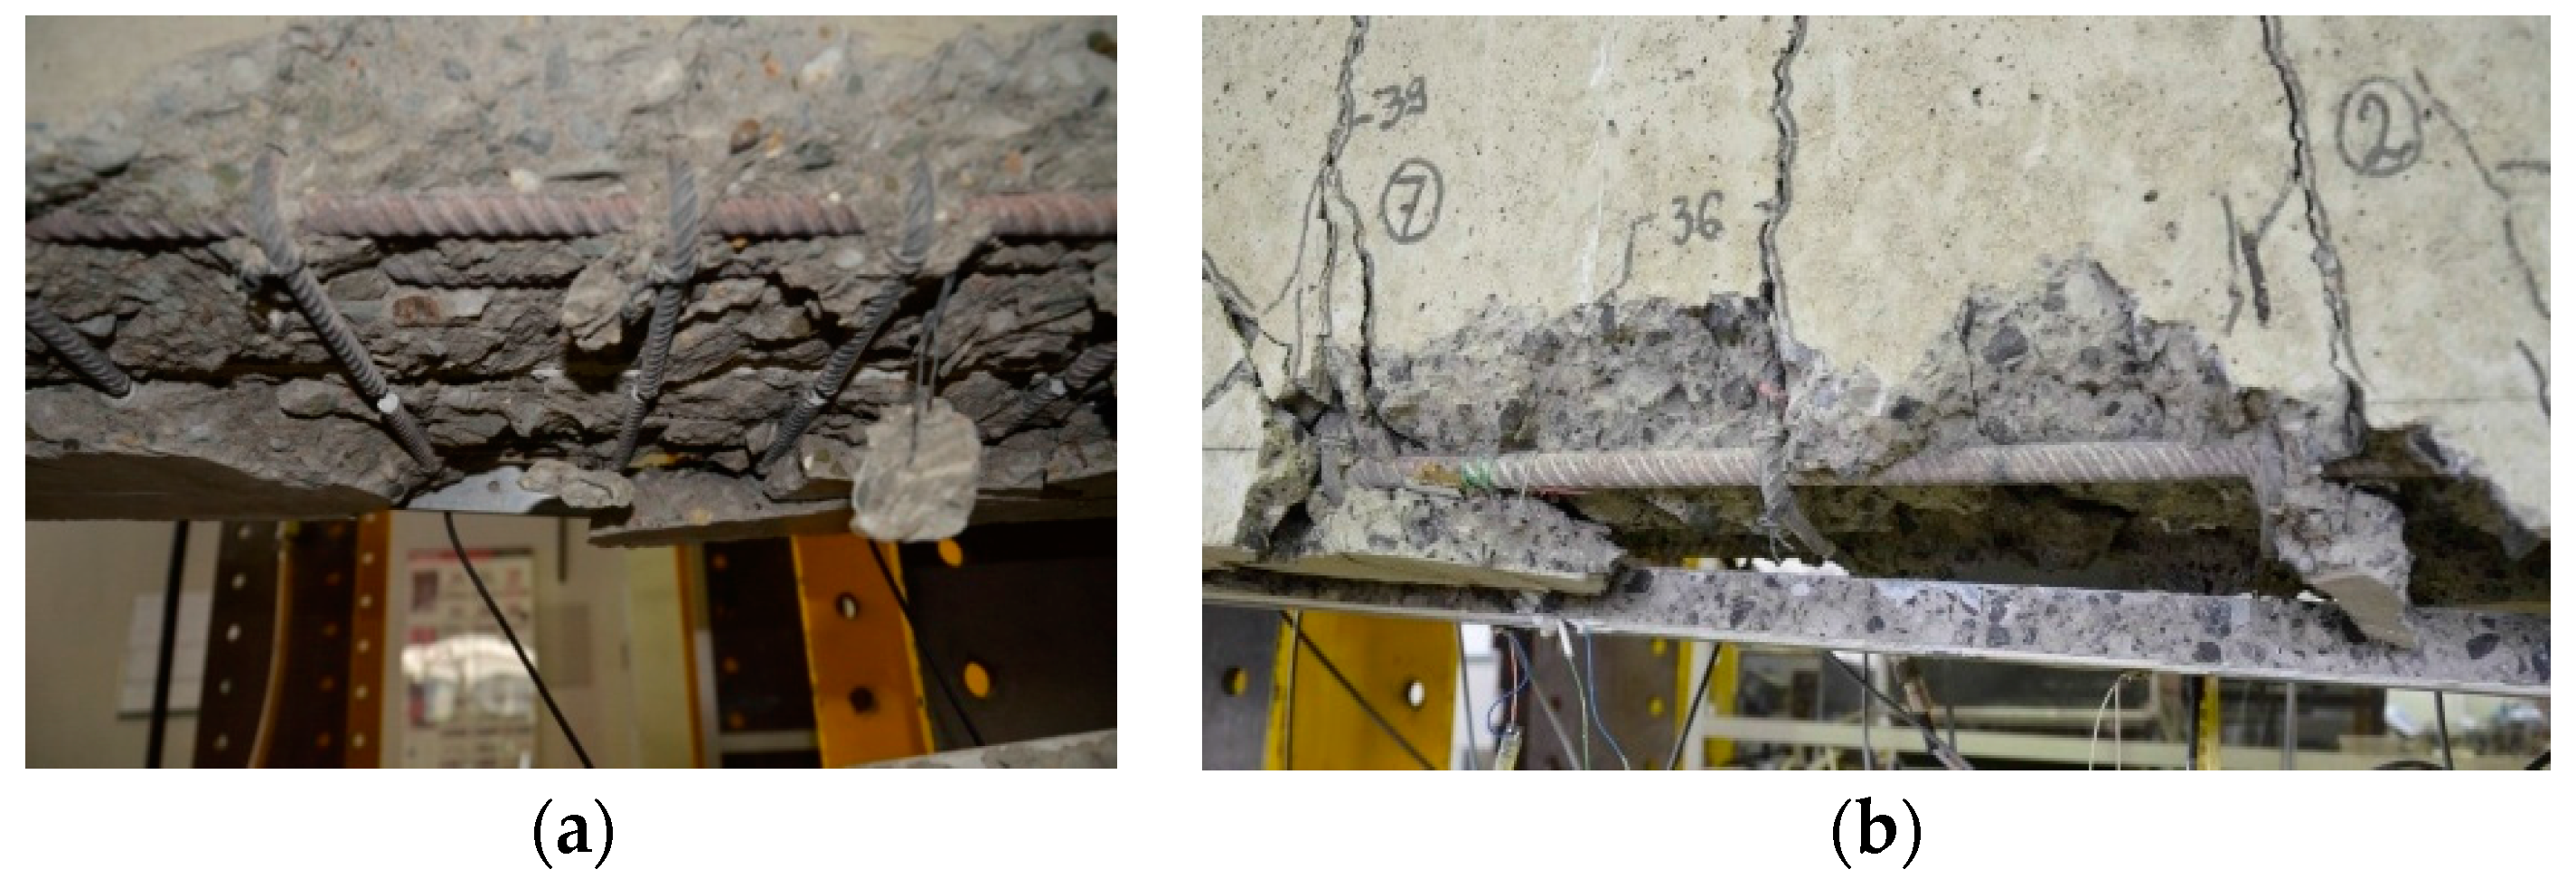
Application of the 30 mm deep profiles led to separation of a large amount of concrete cover (CCS), completely exposing the tensile and shear reinforcement (
Figure 8).
Figure 8.
Separation of a large concrete cover in beam B60-214-1T-30 strengthened with 30 mm deep profile: (a) bottom side of beam with cut stirrups after T profile separation; (b) debonding of profile with concrete cover separation.
Figure 8.
Separation of a large concrete cover in beam B60-214-1T-30 strengthened with 30 mm deep profile: (a) bottom side of beam with cut stirrups after T profile separation; (b) debonding of profile with concrete cover separation.
3.2. Beam Load Carrying Capacity
The load values in
Table 5 the sum of the applied loads from all four actuators (
i.e., 2 × 1
F + 2 × 0.7
F = 3.4
F). The midspan moment is therefore 0.58 times the total load reported (kN-m) and the maximum shear is 0.5 times the total load reported (kN). The applied load corresponding to concrete cracking (3.4
Fcr, column 3), steel yielding (3.4
Fsy, column 5) and the ultimate load (3.4
Fu, column 7), and their corresponding deflections (Δ, columns 4, 6, 8) are shown in
Table 5. The cracking load refers to the load at which the first flexural crack occurred. The yielding load corresponds to the load, at which the strain gauges mounted on the tensile steel reinforcement recorded strain corresponding to the steel yielding (see
Table 3).
Table 5.
Results of the experimental program.
Table 5.
Results of the experimental program.
| 1 | 2 | 3 | 4 | 5 | 6 | 7 | 8 | 9 | 10 | 11 | 12 |
|---|
| No. | Symbol | 3.4 Fcr | Δcr | 3.4 Fy | Δy | 3.4 Fu | Δu | ηf | εf.flange | εf.web | ηε |
|---|
| (kN) | (mm) | (kN) | (mm) | (kN) | (mm) | (%) | (%) | (%) | (%) |
|---|
| 1 | B30-214-A | 61.2 | 1.8 | 119 | 6.8 | 166.6 | 103.5 | - | - | - | - |
| 2 | B30-214-1T-15 | 81.6 | 2.5 | 186.6 | 9.4 | 309.4 | 29.4 | 85.7 | 0.73 | 0.75 | 69.0 |
| 3 | B30-214-2T-15 | 61.2 | 1.2 | 255 | 6.8 | 380.8 | 25.9 | 128.6 | 0.52 | 0.55 | 48.0 |
| 4 | B30-214-1T-30 | 68.0 | 1.4 | 221.3 | 10.8 | 391.0 | 40.1 | 134.7 | 0.77 | X | 71.0 |
| 5 | B60-214-A | 78.2 | 0.7 | 136 | 6.6 | 163.2 | 61.7 | - | - | - | - |
| 6 | B60-214-1T-15 | 102 | 1.5 | 204 | 8.3 | 350.2 | 36.2 | 114.6 | 0.78 | 0.80 | 74.0 |
| 7 | B60-214-2T-15 | 108.8 | 1.5 | 272 | 9.3 | 435.2 | 25.2 | 166.7 | 0.61 | 0.67 | 62.0 |
| 8 | B60-214-1T-30 | 105.4 | 1.4 | 221 | 7.6 | 445.4 | 44.4 | 172.9 | 0.92 | 0.89 | 85.0 |
| 9 | B60-214-2T-30 | 105.4 | 1.1 | 316.2 | 10.7 | 574.6 | 32.4 | 252.1 | 0.69 | 0.69 | 64.0 |
A measure of strengthening efficiency is the strengthening ratio calculated as:
where
Fu and
F0 are the ultimate load of the strengthened and unstrengthened reference beam, respectively.
In terms of the ultimate load, the strengthening efficiency ranged from 85.7% (beam B30-214-1T-15) to 252.1% (for the beam B60-214-2T30). A similar or marginally greater strengthening effect was achieved for the beams strengthened with one T30 profile (ηf = 134.7% and 172.9% for B30 and B60, respectively) over those with two T15 profiles (ηf = 128.6% and 166.7%). It is also seen from these results that the efficiency of the strengthening was improved for the higher strength concrete beams. This is to be expected for these initially under-reinforced sections: the greater reinforcement permits a greater concrete component to be engaged in resisting moment.
As expected, the greatest strengthening effect was obtained for beam B60-214-2T30, strengthened with two CFRP 30 mm deep profiles, showing a 29% increase in capacity over beam B60-214-1T30 strengthened with only one 30 mm profile.
The maximum strains in the CFRP profile flange (ε
f.flange, column 10) and in the CFRP web (ε
f.web, column 11) of the profile are reported in
Table 5. The strain efficiency (η
ε, column 12), is the ratio of the maximal CFRP tensile strain ε
f.max to the experimentally determined ultimate strain of ε
fu = 1.08%:
The test results indicated the influence of the concrete strength on the strengthening efficiency. Strengthening of the C50/60 beams indicated an increase in the cracking load (Fcr) of 30.4% to 39.1% for the B60 series and 0% to 33% for the B30 series. While the concrete strength affected an increase in the ultimate load of 11.6% for the beam strengthened with one 15 mm profile (compare beams B30-214-1T-15 and B60-214-1T-15), more than 14.3% for the beams strengthened with two 15 mm profiles (B30-214-2T-15 and B60-214-2T-15) and 13.9% for beams with one 30 mm profile (B30-214-1T-30 and B60-214-1T-30).
The typical limit state for EBR and NSM strengthening is FRP-to-concrete bond conditions with NSM attributing greater bond performance. Based on existing studies on bond behavior of the NSM FRP-to-concrete [
8,
9,
17], the recommended value of the design FRP strain in NSM technique is ε
fd = 0.7ε
fu. The maximum strain of the 15 mm profiles reach an average strain of ε
f.max = 0.78ε
f.u. The cross section area of the 15 mm T-profile is about 4.4 times greater than a conventional (15 mm × 2.5 mm) NSM embedded strip therefore requiring only about one quarter of the installation time, labor, and cost to achieve the same strengthening effect. Similarly, by comparison to the EB technique, where intermediate crack debonding may limit efficiency to the order of ε
f.max = 0.35ε
f.u, the use of the 15 mm deep T-profile is almost twice as efficient, requiring only one half of the material. Like the T-profile, most procured CFRP strips for EB or NSM application are pultruded, thus the cost difference between the profile and strip is based mostly on the amount of material, since manufacturing complexity is essentially the same.
3.3. Force-Deflection Relationships
Comparison of the load-deflection curves for the reference and strengthened beams in terms of the CFRP profile height, the number of profiles, and concrete strength are shown in
Figure 9 and
Figure 10, respectively. The test results confirm the opinion [
17,
26] on the influence of the CFRP ratio (ϱ
f) and CFRP stiffness (
Ef If) on strengthened beam ductility. An increase in ϱ
f leads to a decrease in the maximal mid-span deflection and renders the strengthened element less ductile.
A comparative analysis of the vertical mid-span displacement depends mainly on the influence of the concrete strength, number of profiles, and their height. The results of all beams confirmed a significant reduction of between 67%–83% and 30%–60%, for B30 and B60 series, respectively, in mid-span deflection following strengthening. The concrete strength had an effect on the stiffness of the beams (compare B30-214-1T-15 and B60-214-1T-15), which, as expected, was greater for the beams made of higher concrete strength.
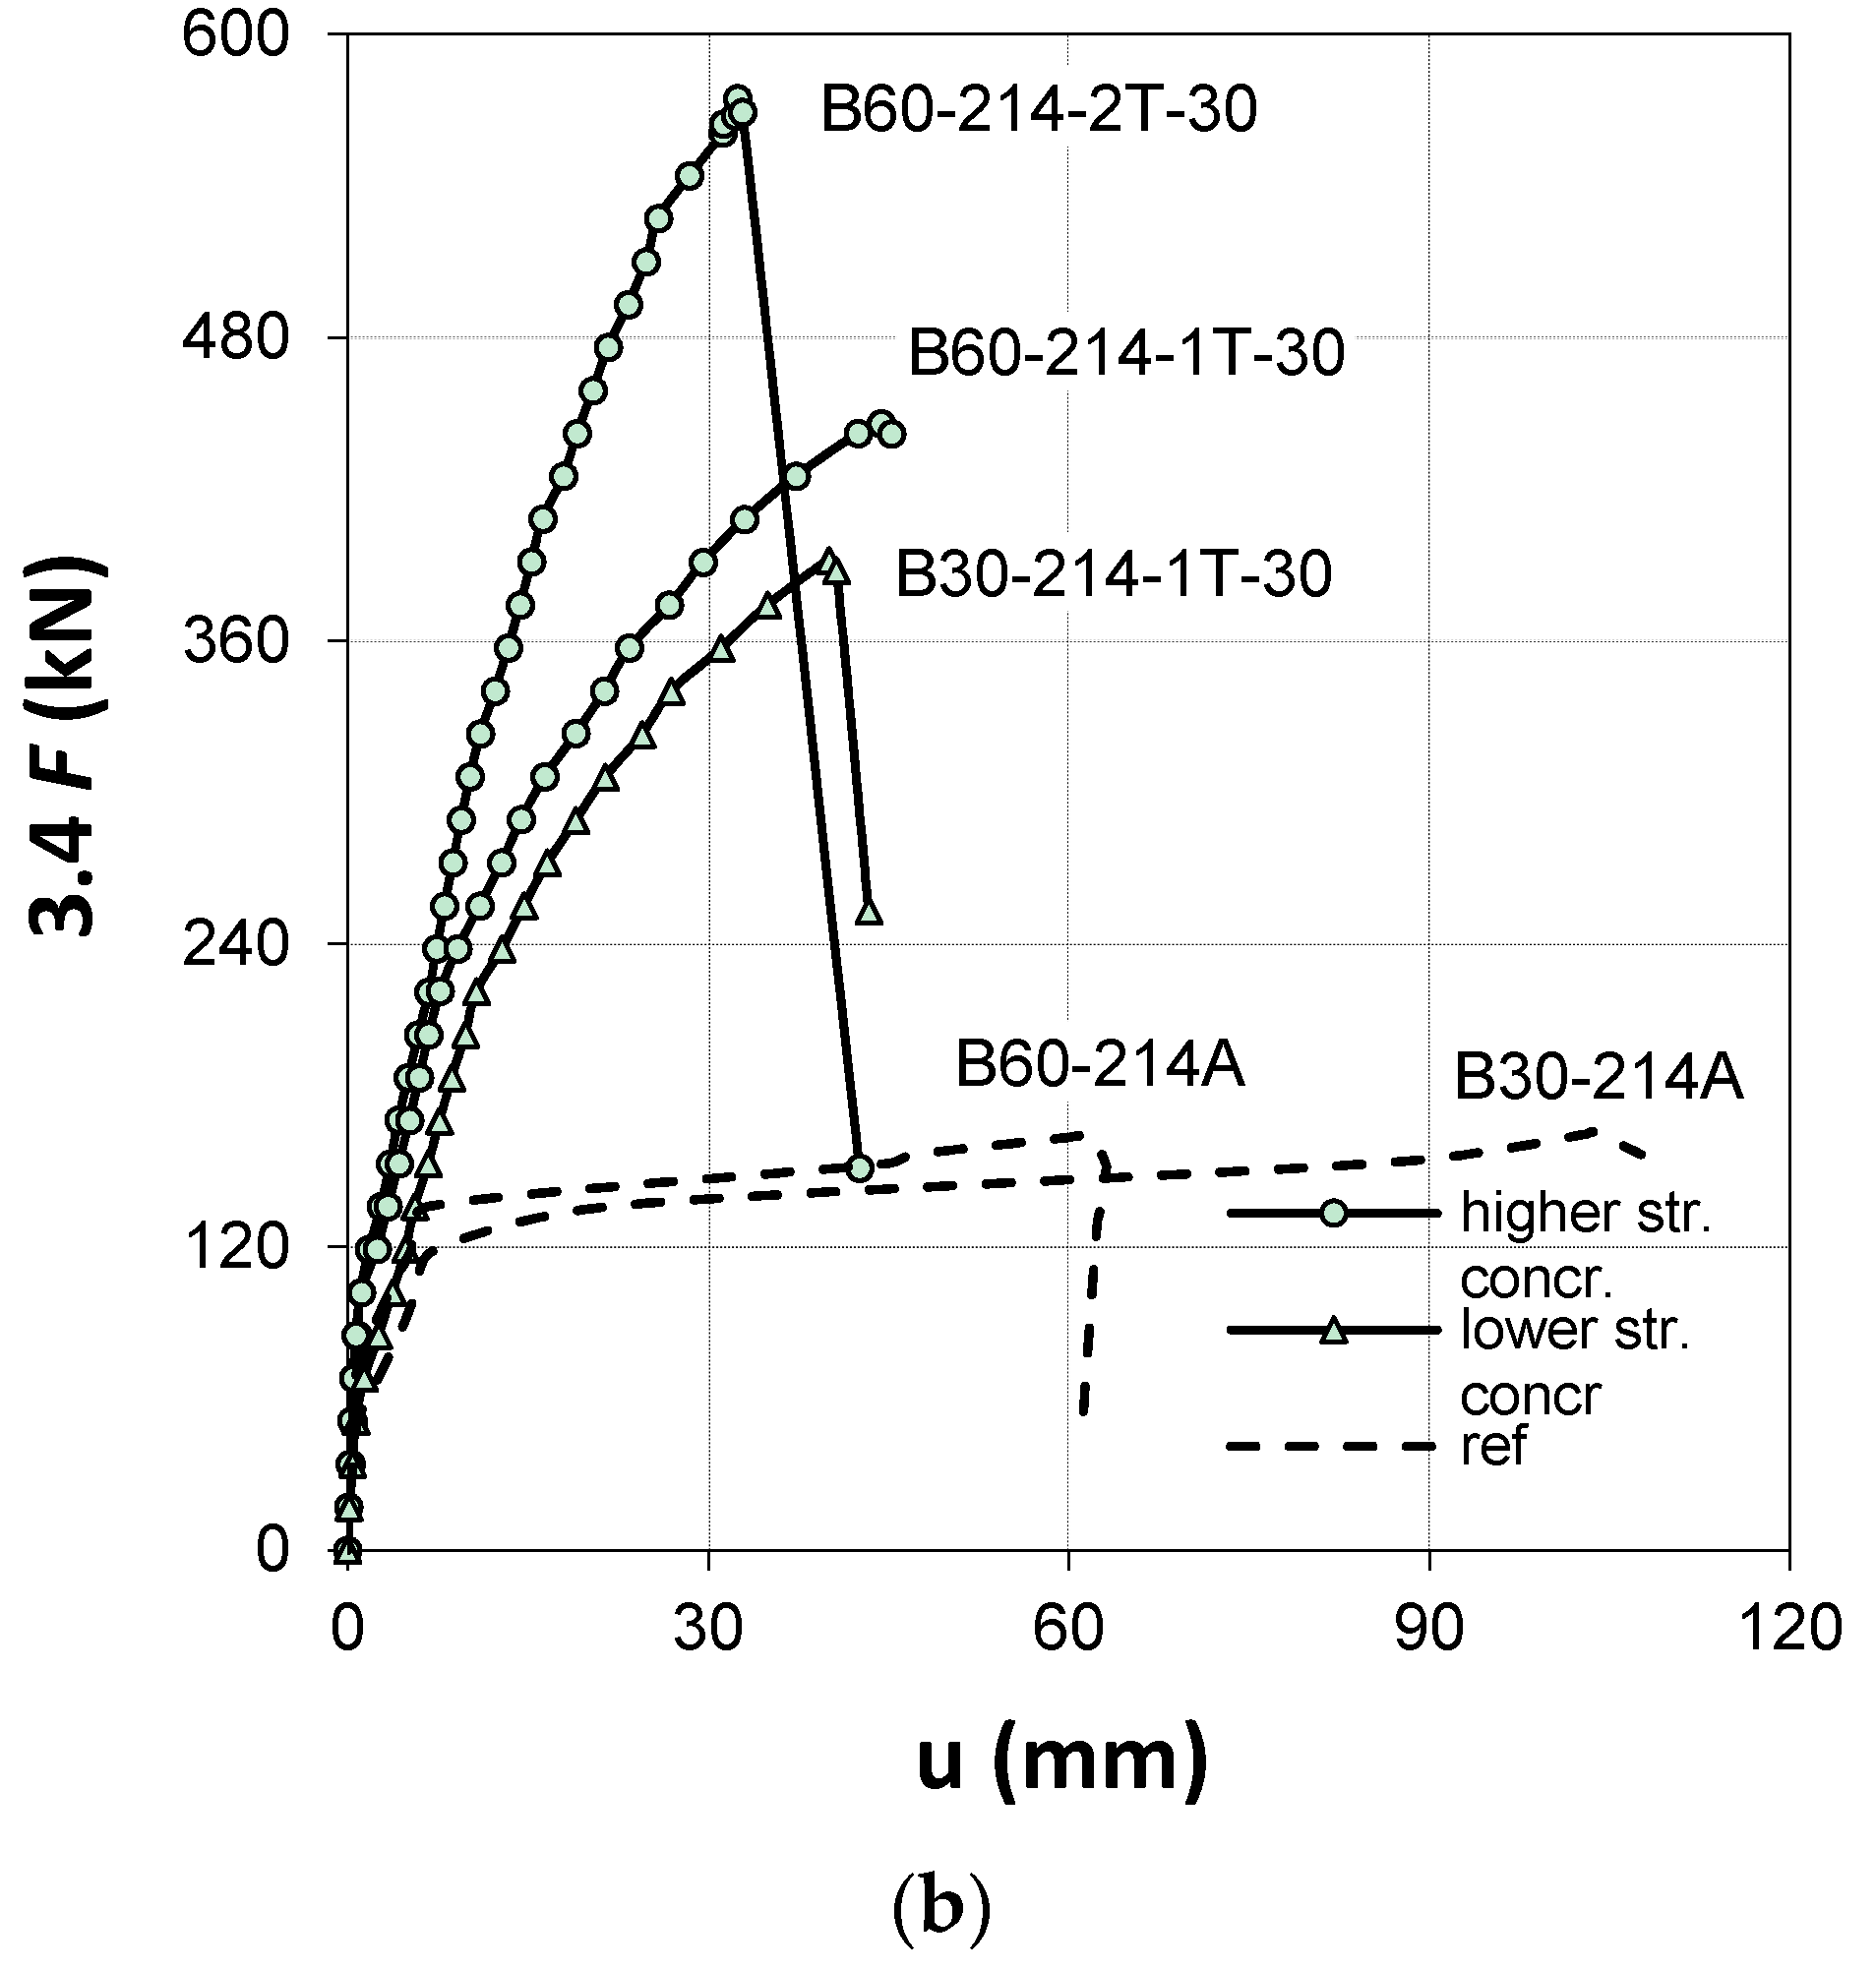
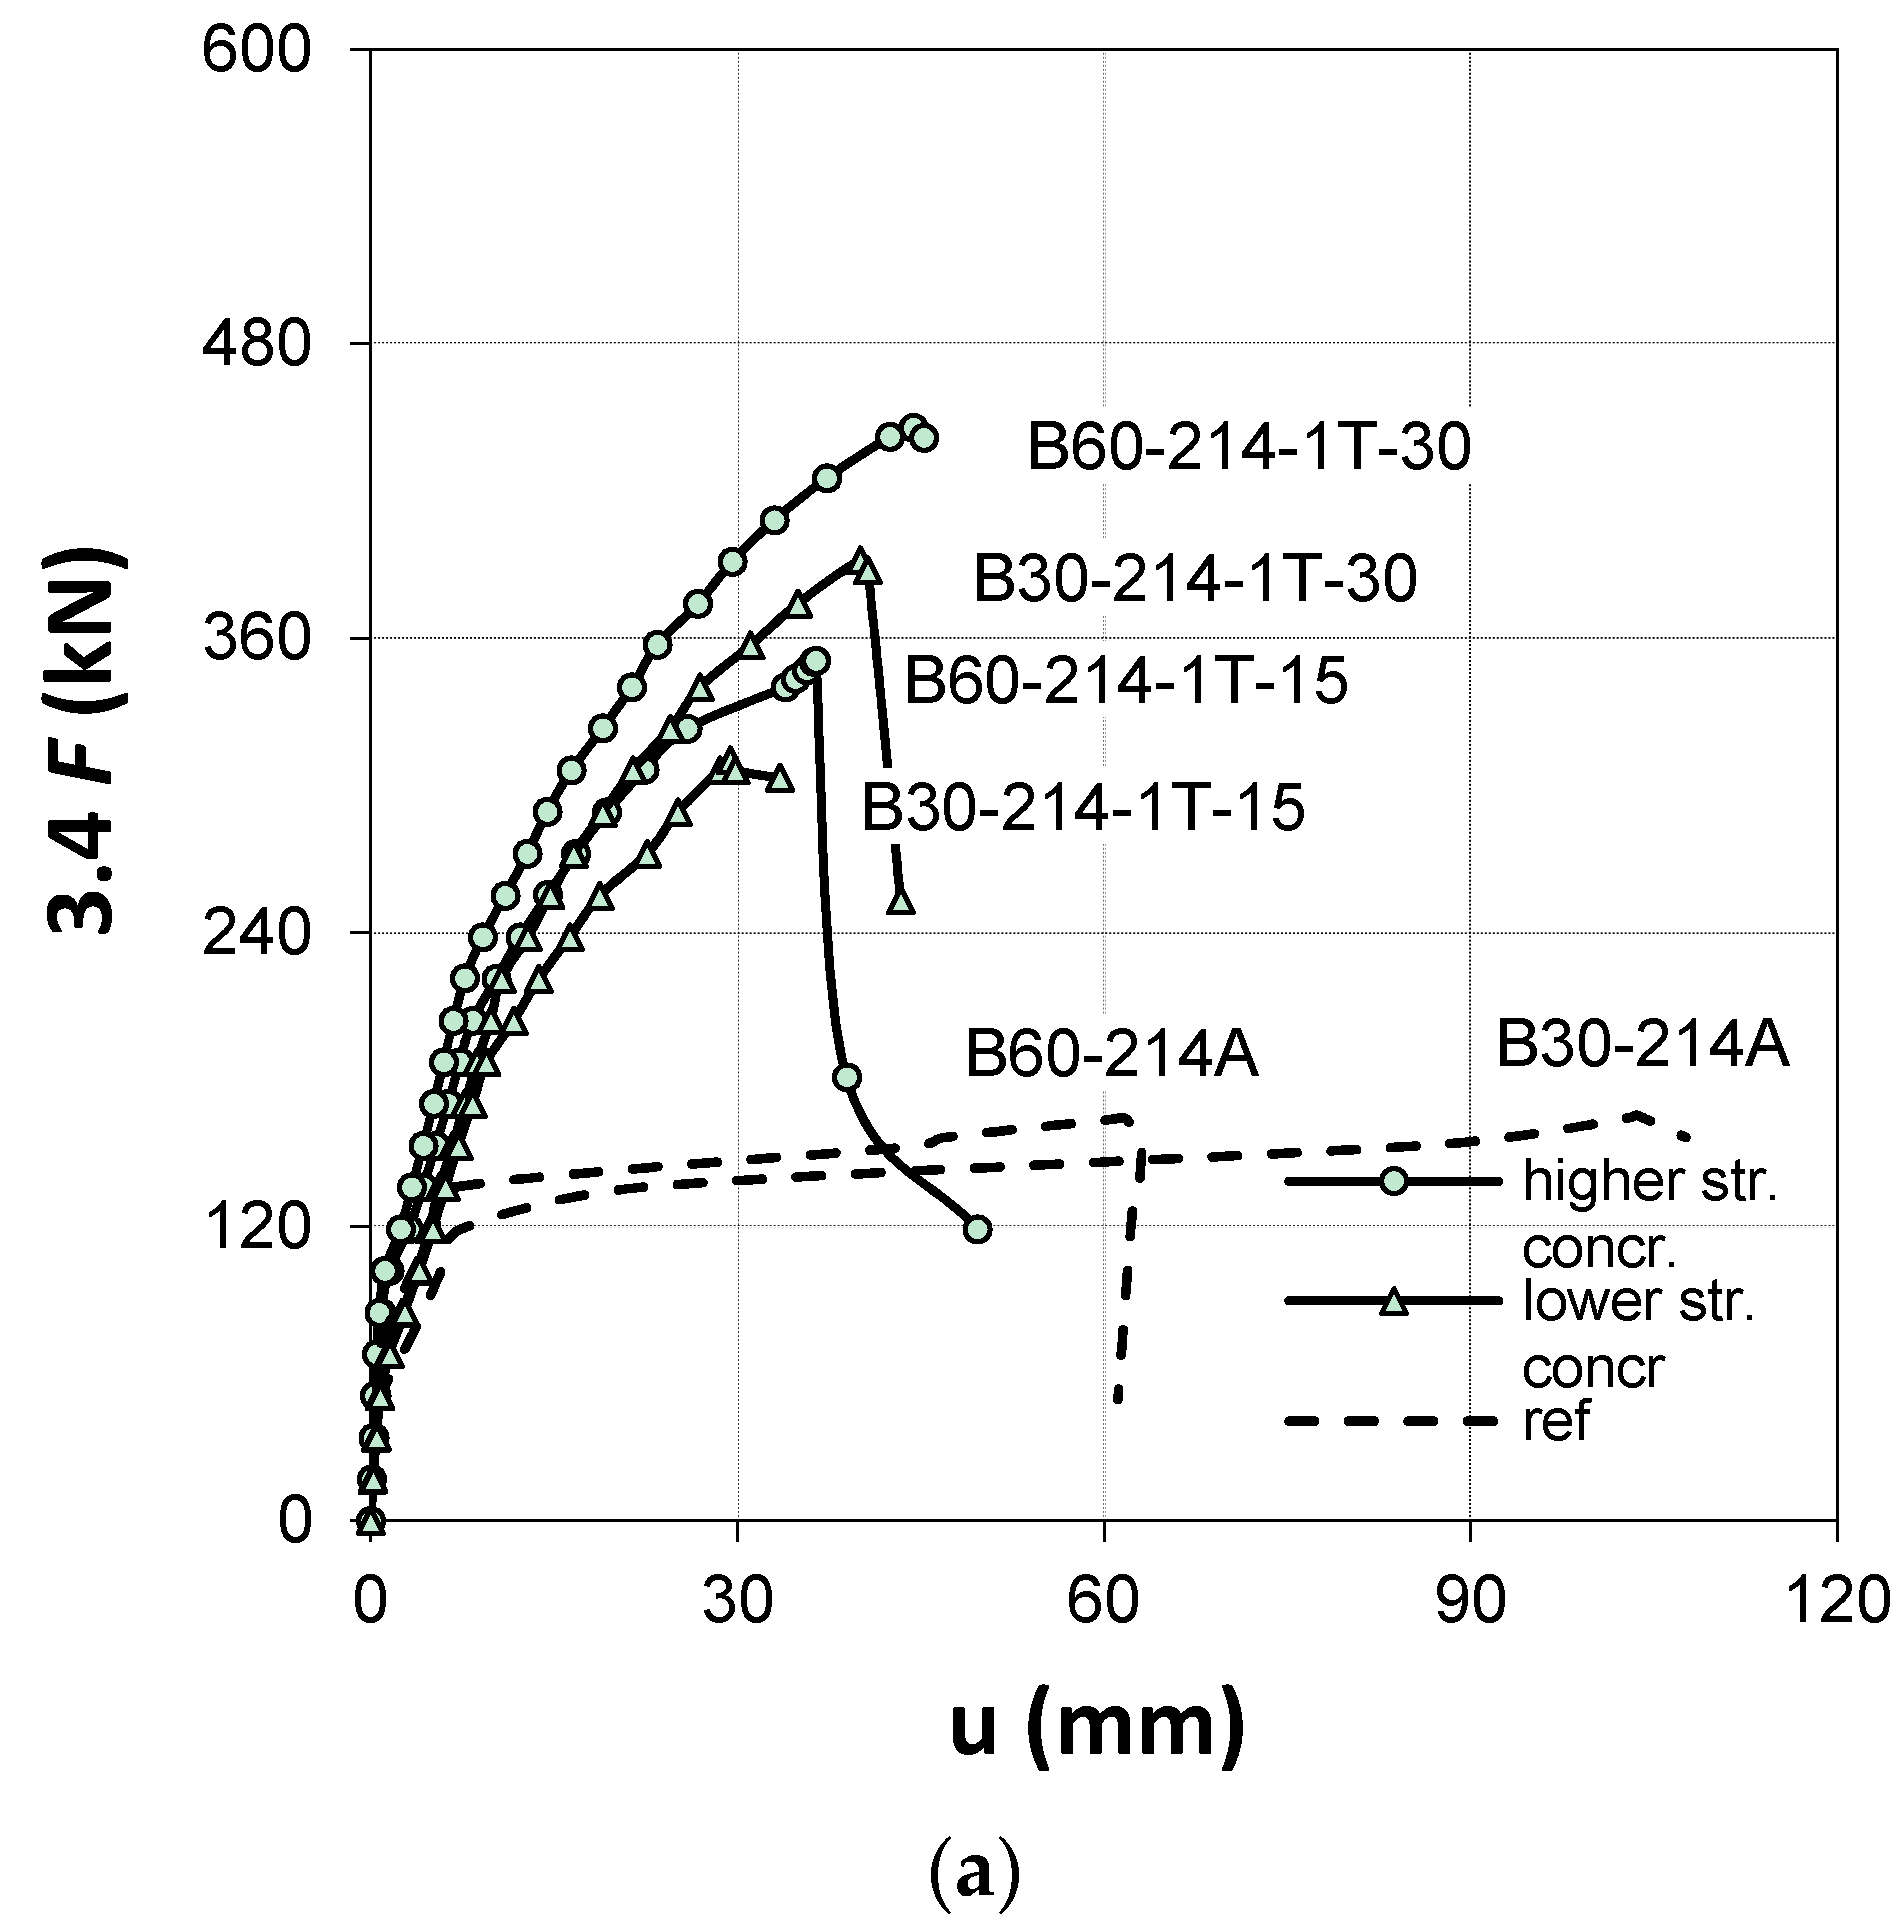
Figure 9.
Total load vs. mid-span deflection relationships in terms of profile web height: (a) T15 and (b) T30.
Figure 9.
Total load vs. mid-span deflection relationships in terms of profile web height: (a) T15 and (b) T30.
Comparing mid-span deflection curves of the beams strengthened with 15 and 30 mm profiles, an insignificant difference in stiffness was observed between concrete cracking and the steel yielding. This difference grows following the internal steel reinforcement yielding, however, but is observed only in the beams strengthened with the single CFRP profile. The beams strengthened with two CFRP profiles indicated a difference in the beam stiffness only following concrete cracking. This observation confirms opinion about the effect of the CFRP ratio (ϱ
f) [
17,
26] on the concrete cracking initiation.
A detailed summary of midspan deflection through the load history is shown in
Table 6. It is confirmed that with an increase in the CFRP reinforcement ratio the maximum deflection decreases. The shaded regions in
Table 6 indicate pre-steel yielding loads.
Figure 10.
Total load vs. mid-span deflection relationships in terms of a number of profiles in beams reinforced with profiles: (a) T15 and (b) T30.
Figure 10.
Total load vs. mid-span deflection relationships in terms of a number of profiles in beams reinforced with profiles: (a) T15 and (b) T30.
Table 6.
Mid-span deflection at various total applied load levels.
Table 6.
Mid-span deflection at various total applied load levels.
| No. | Symbol | | 3.4 F |
|---|
| 85 kN | 119 kN | 170 kN | 225 kN | 340 kN | 425 kN | 510 kN |
|---|
| 1 | B30-214-A | ultimate deflection at the load level (mm) | 5.0 | 6.0 | - | - | - | - | - |
| 2 | B30-214-1T-15 | 3.0 | 5.0 | 8.0 | 19.0 | - | - | - |
| 3 | B30-214-2T-15 | 3.0 | 4.0 | 6.0 | 11.0 | 19.0 | - | - |
| 4 | B30-214-1T-30 | 2.5 | 5.0 | 7.5 | 14.5 | 27.0 | - | - |
| 5 | B60-214-A | 2.0 | 5.0 | - | - | - | - | - |
| 6 | B60-214-1T-15 | <1.0 1 | 3.0 | 6.5 | 14.5 | 34.0 | - | - |
| 7 | B60-214-2T-15 | <1.0 1 | 2.0 | 4.5 | 8.5 | 14.5 | 23.5 | - |
| 8 | B60-214-1T-30 | 0.5 1 | 2.5 | 5.0 | 10.0 | 20.0 | 37.5 | - |
| 9 | B60-214-2T-30 | <1.0 1 | 1.5 | 4.0 | 8.0 | 12.0 | 18.0 | 25.0 |
For example, in the reference beam B60-214-A the maximum deflection of 6 mm was registered under the load of 3.4
F = 119 kN. While in the corresponding beams strengthened with the CFRP profiles, a significant reduction of deflection was observed for the same loads (see
Table 6). The beams B30-214-A, B30-214-1T-15, and B30-214-2T-15 showed under the load of 3.4
F = 119 kN the mid-span deflections of 6 mm, 5 mm, and 4 mm, respectively. The green fields in
Table 6 refer to deflections before steel yielding, while the blank fields present the vertical displacements after steel yielding.
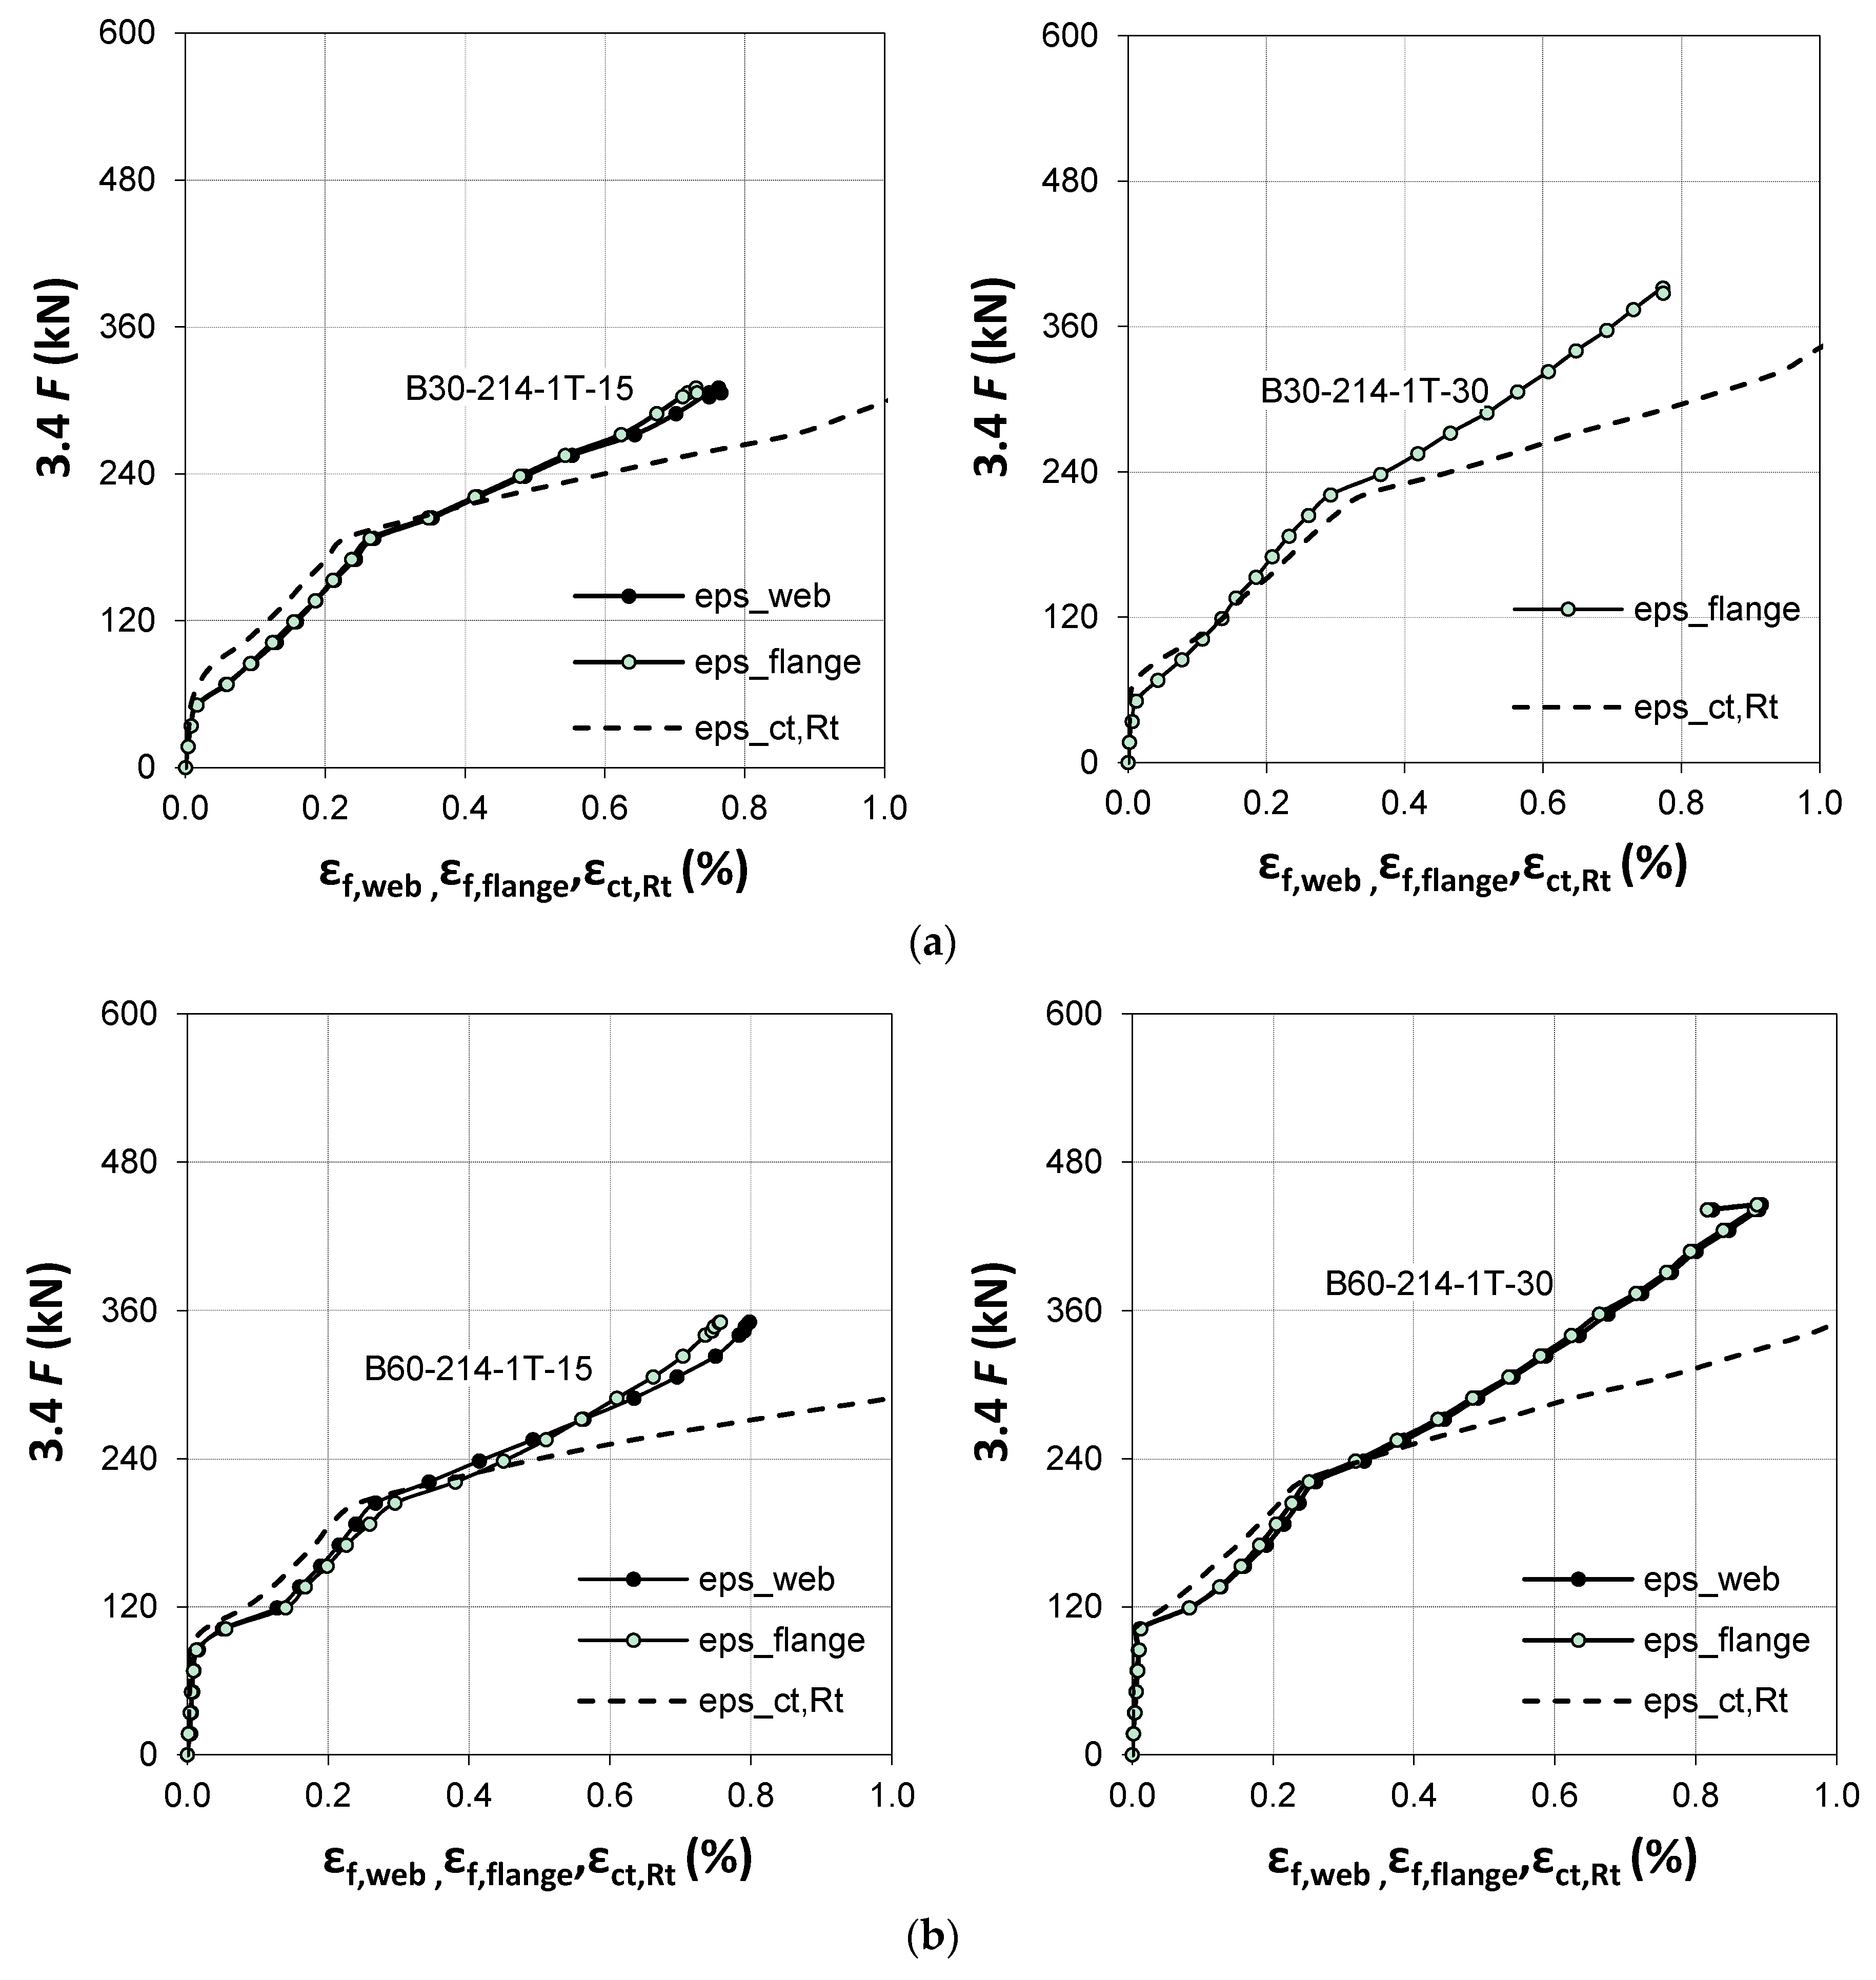
3.4. Force-Strain Relationship
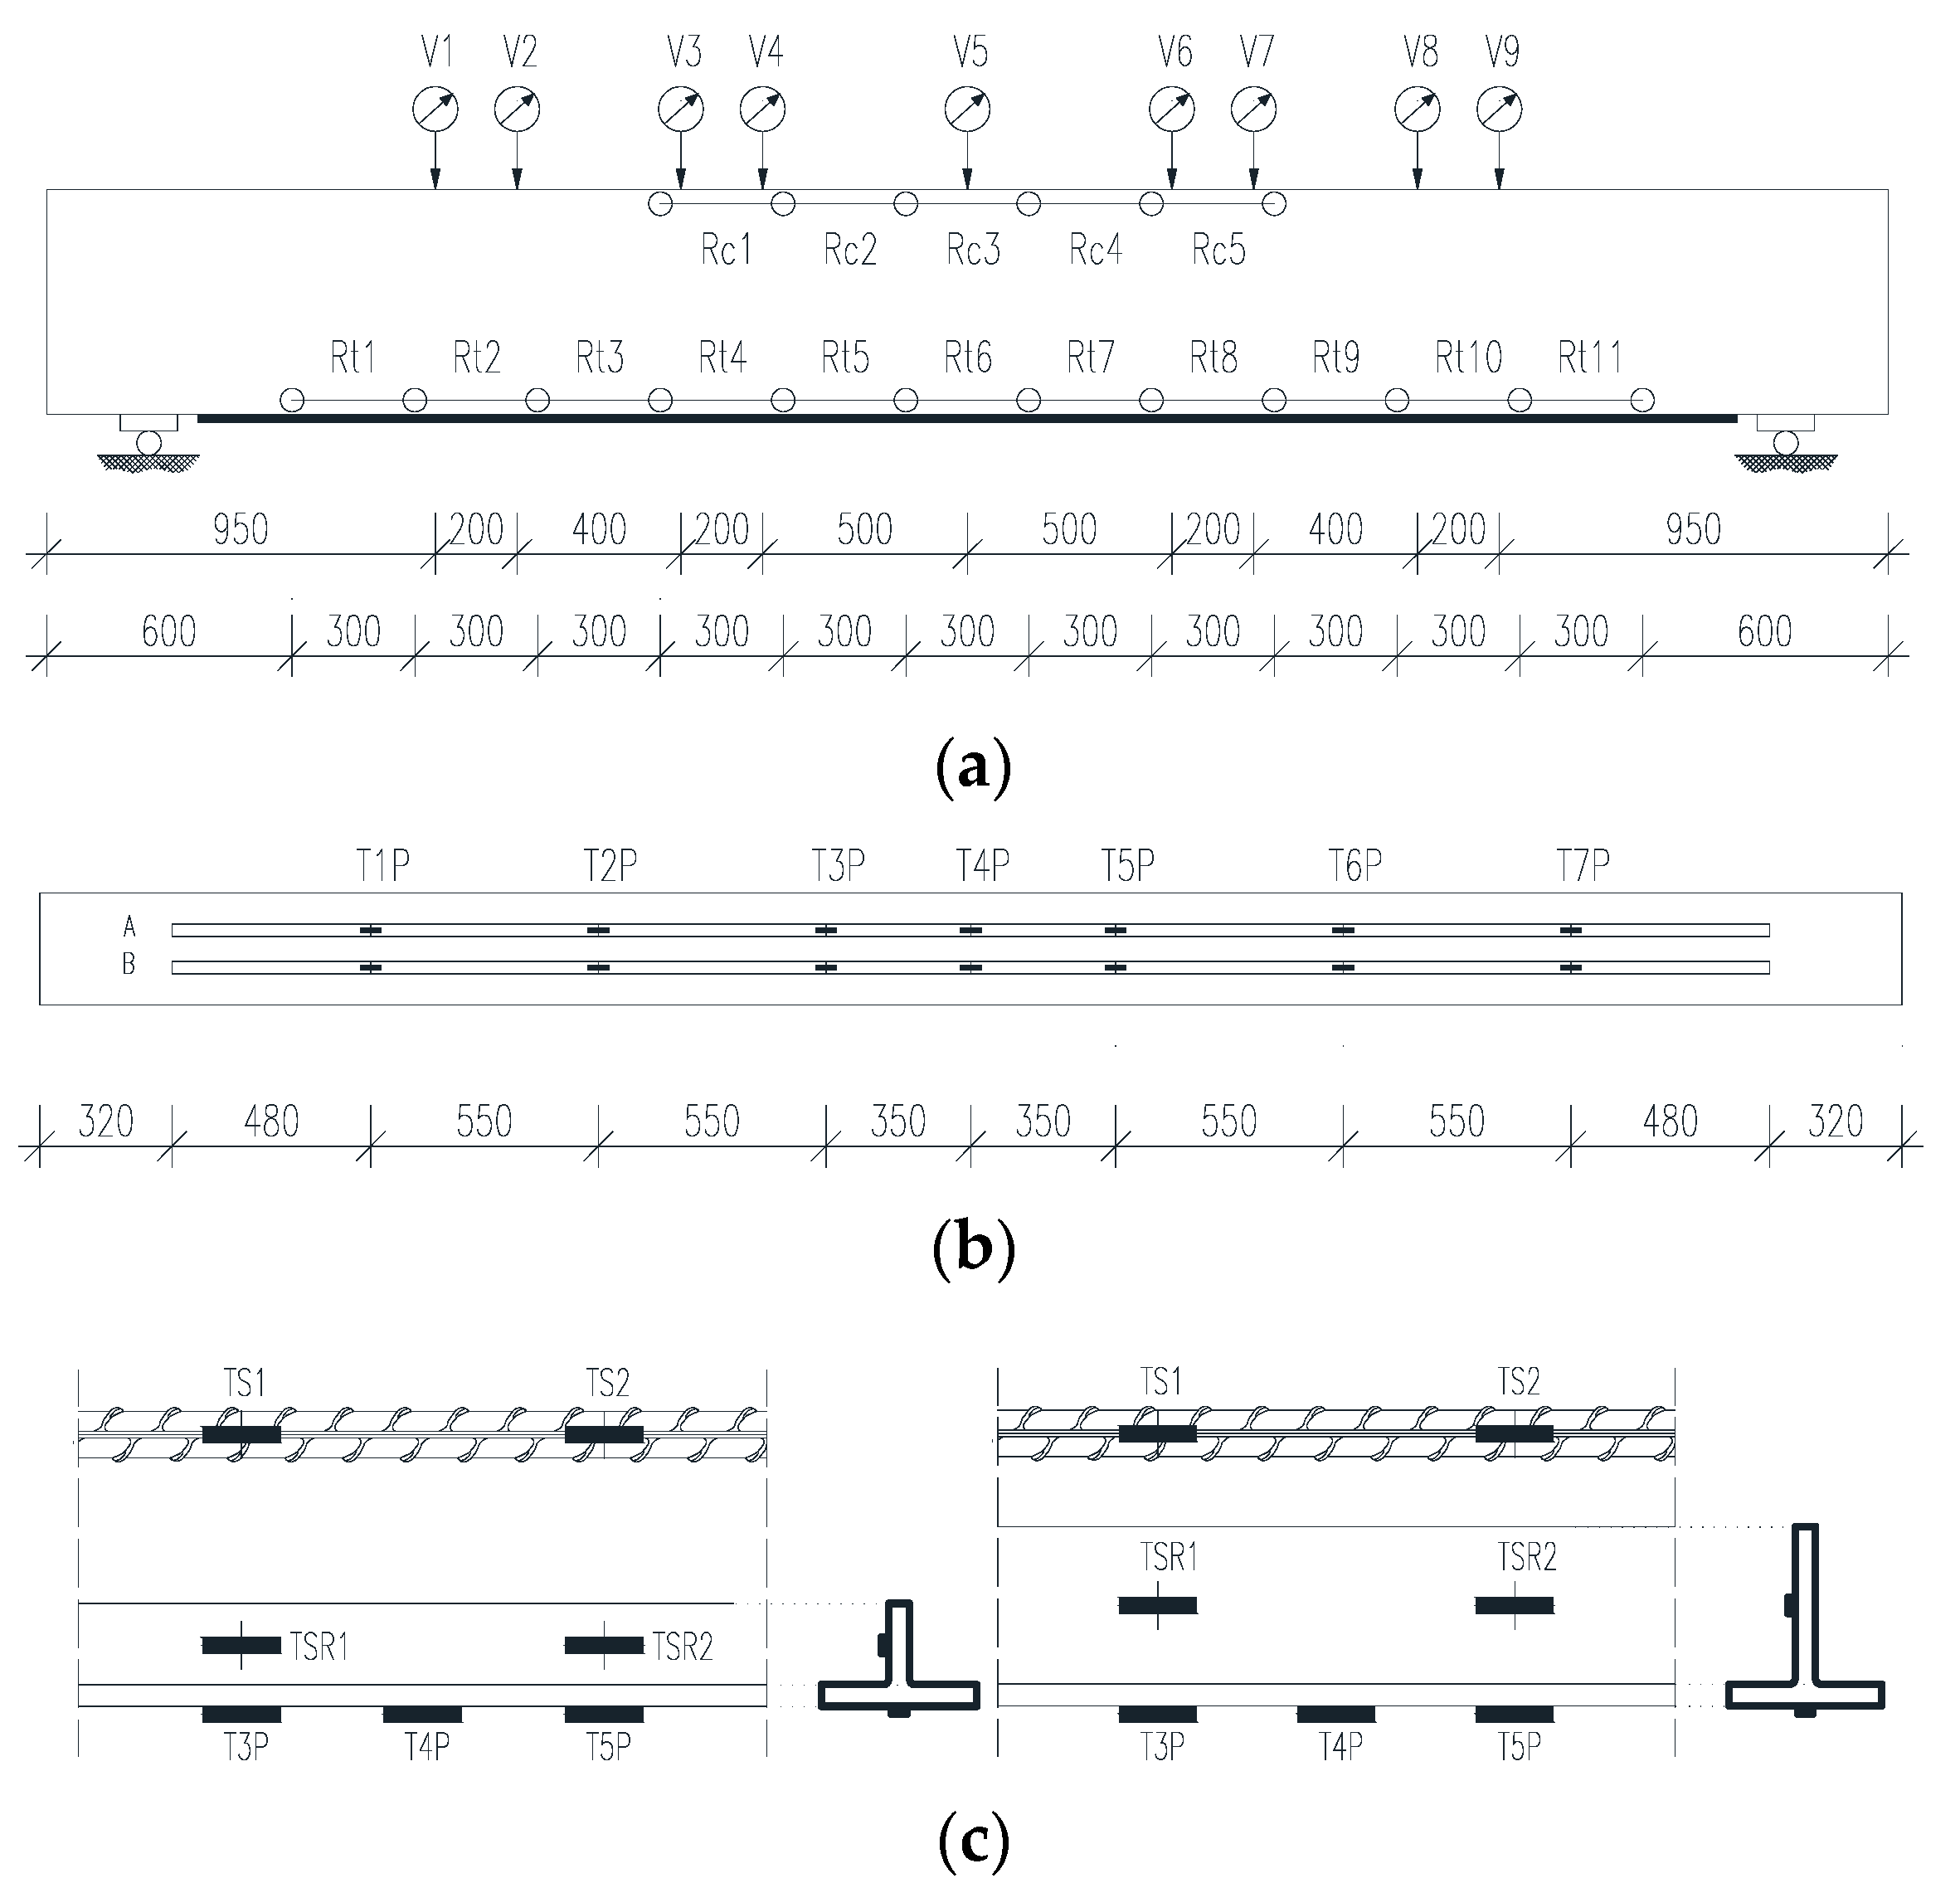
Figure 11 and
Figure 12 show the strains measured on the web and flange of the CFRP profile (averaged from two characteristic locations:
T3P and
T5P on the flange and
TSR1 and
TSR2 on the web). A similar strain distribution and history is seen in each beam.
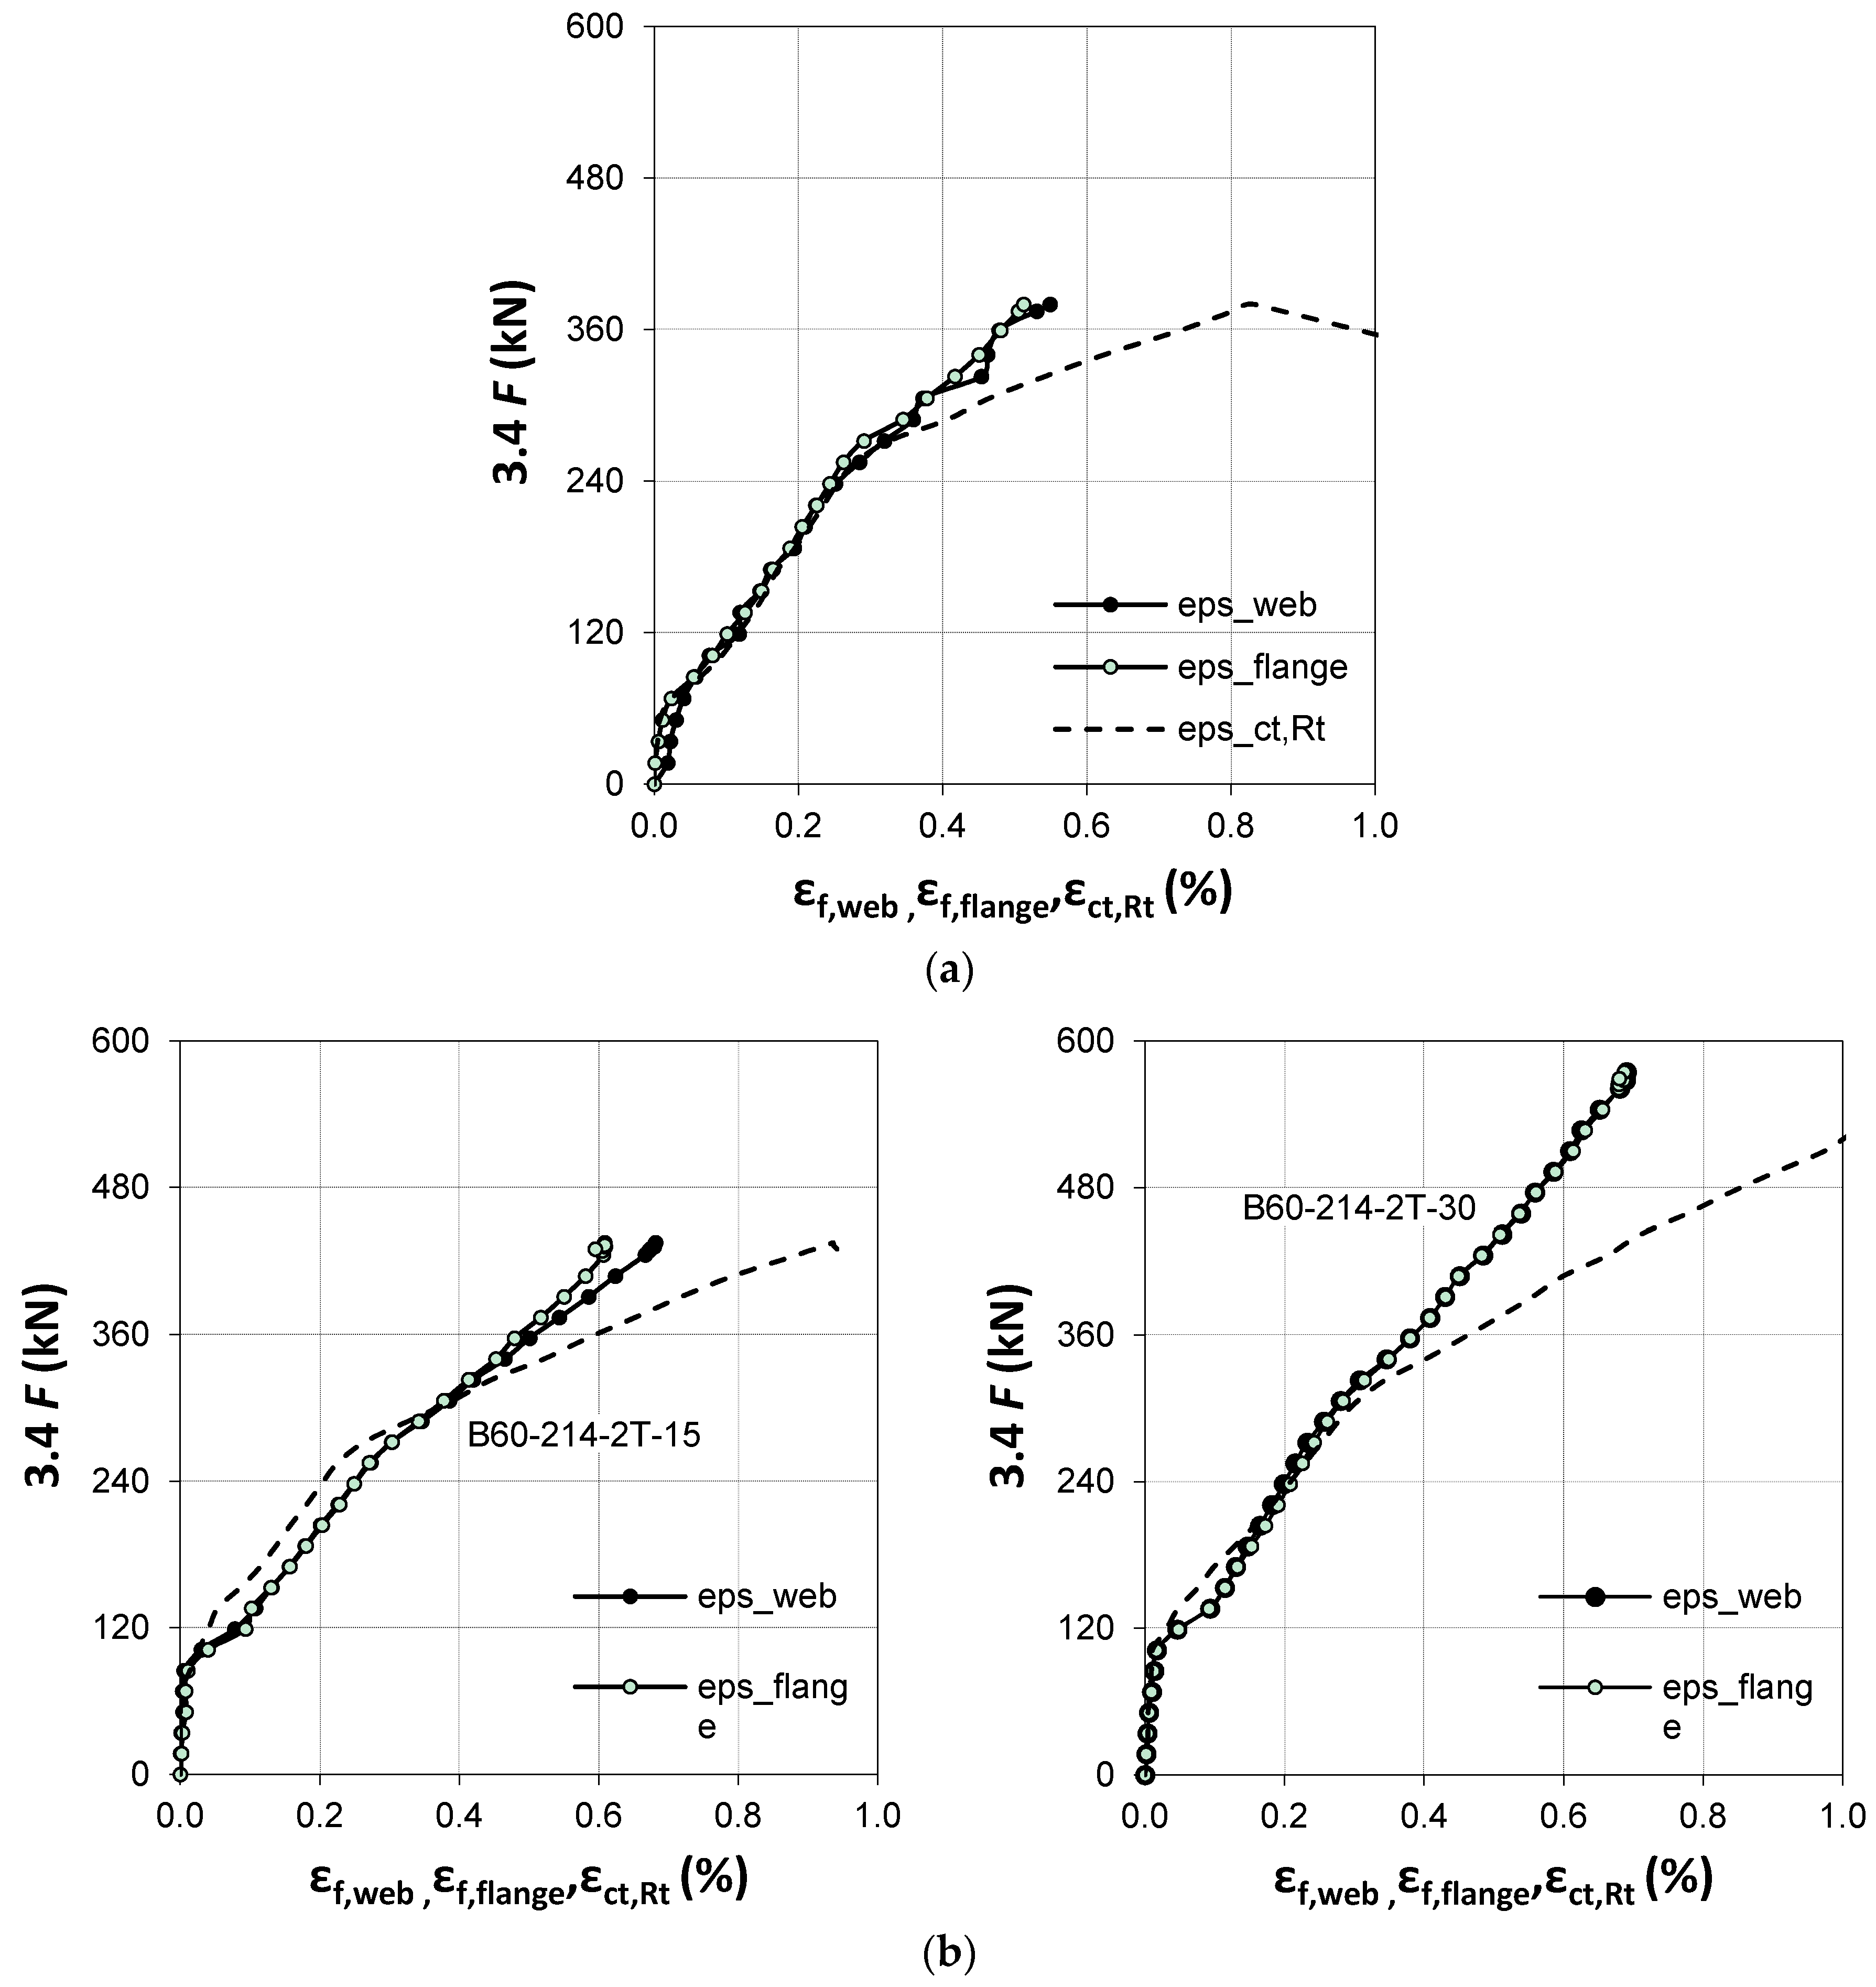
An increase in the CFRP reinforcing ratio corresponds to a decrease in the maximum CFRP strain observed at failure reflecting a bond-dominated less ductile response. Also shown in
Figure 11 and
Figure 12 is the average concrete strain measured obtained from two LVDTs (Rt5 and Rt7) placed in the constant moment region at the level of the tensile steel reinforcement. The plots confirm initiation and gradual CFRP debonding from the concrete cover for CFRP strain greater than about 0.4%).
Figure 11.
Total load vs. CFRP strain for the beams strengthened with one CFRP profile: (a) concrete C25/30; (b) concrete C50/60.
Figure 11.
Total load vs. CFRP strain for the beams strengthened with one CFRP profile: (a) concrete C25/30; (b) concrete C50/60.
The CFRP strain in the beams strengthened with a single T-shaped profile indicated higher values than those strengthened with two profiles. Moreover, a beneficial effect of the concrete strength on the CFRP strain is apparent in
Figure 11 and
Figure 12. The maximum strain in the 30 mm profiles was slightly higher than that in the 15 mm profiles; this likely results from the greater bond area of the 30 mm profiles.
Figure 12.
Total load vs. CFRP strain for the beams strengthened with two CFRP profiles (a) concrete C25/30; (b) concrete C50/60.
Figure 12.
Total load vs. CFRP strain for the beams strengthened with two CFRP profiles (a) concrete C25/30; (b) concrete C50/60.


