4.1. Phase Behavior and Physicochemical Characterisation
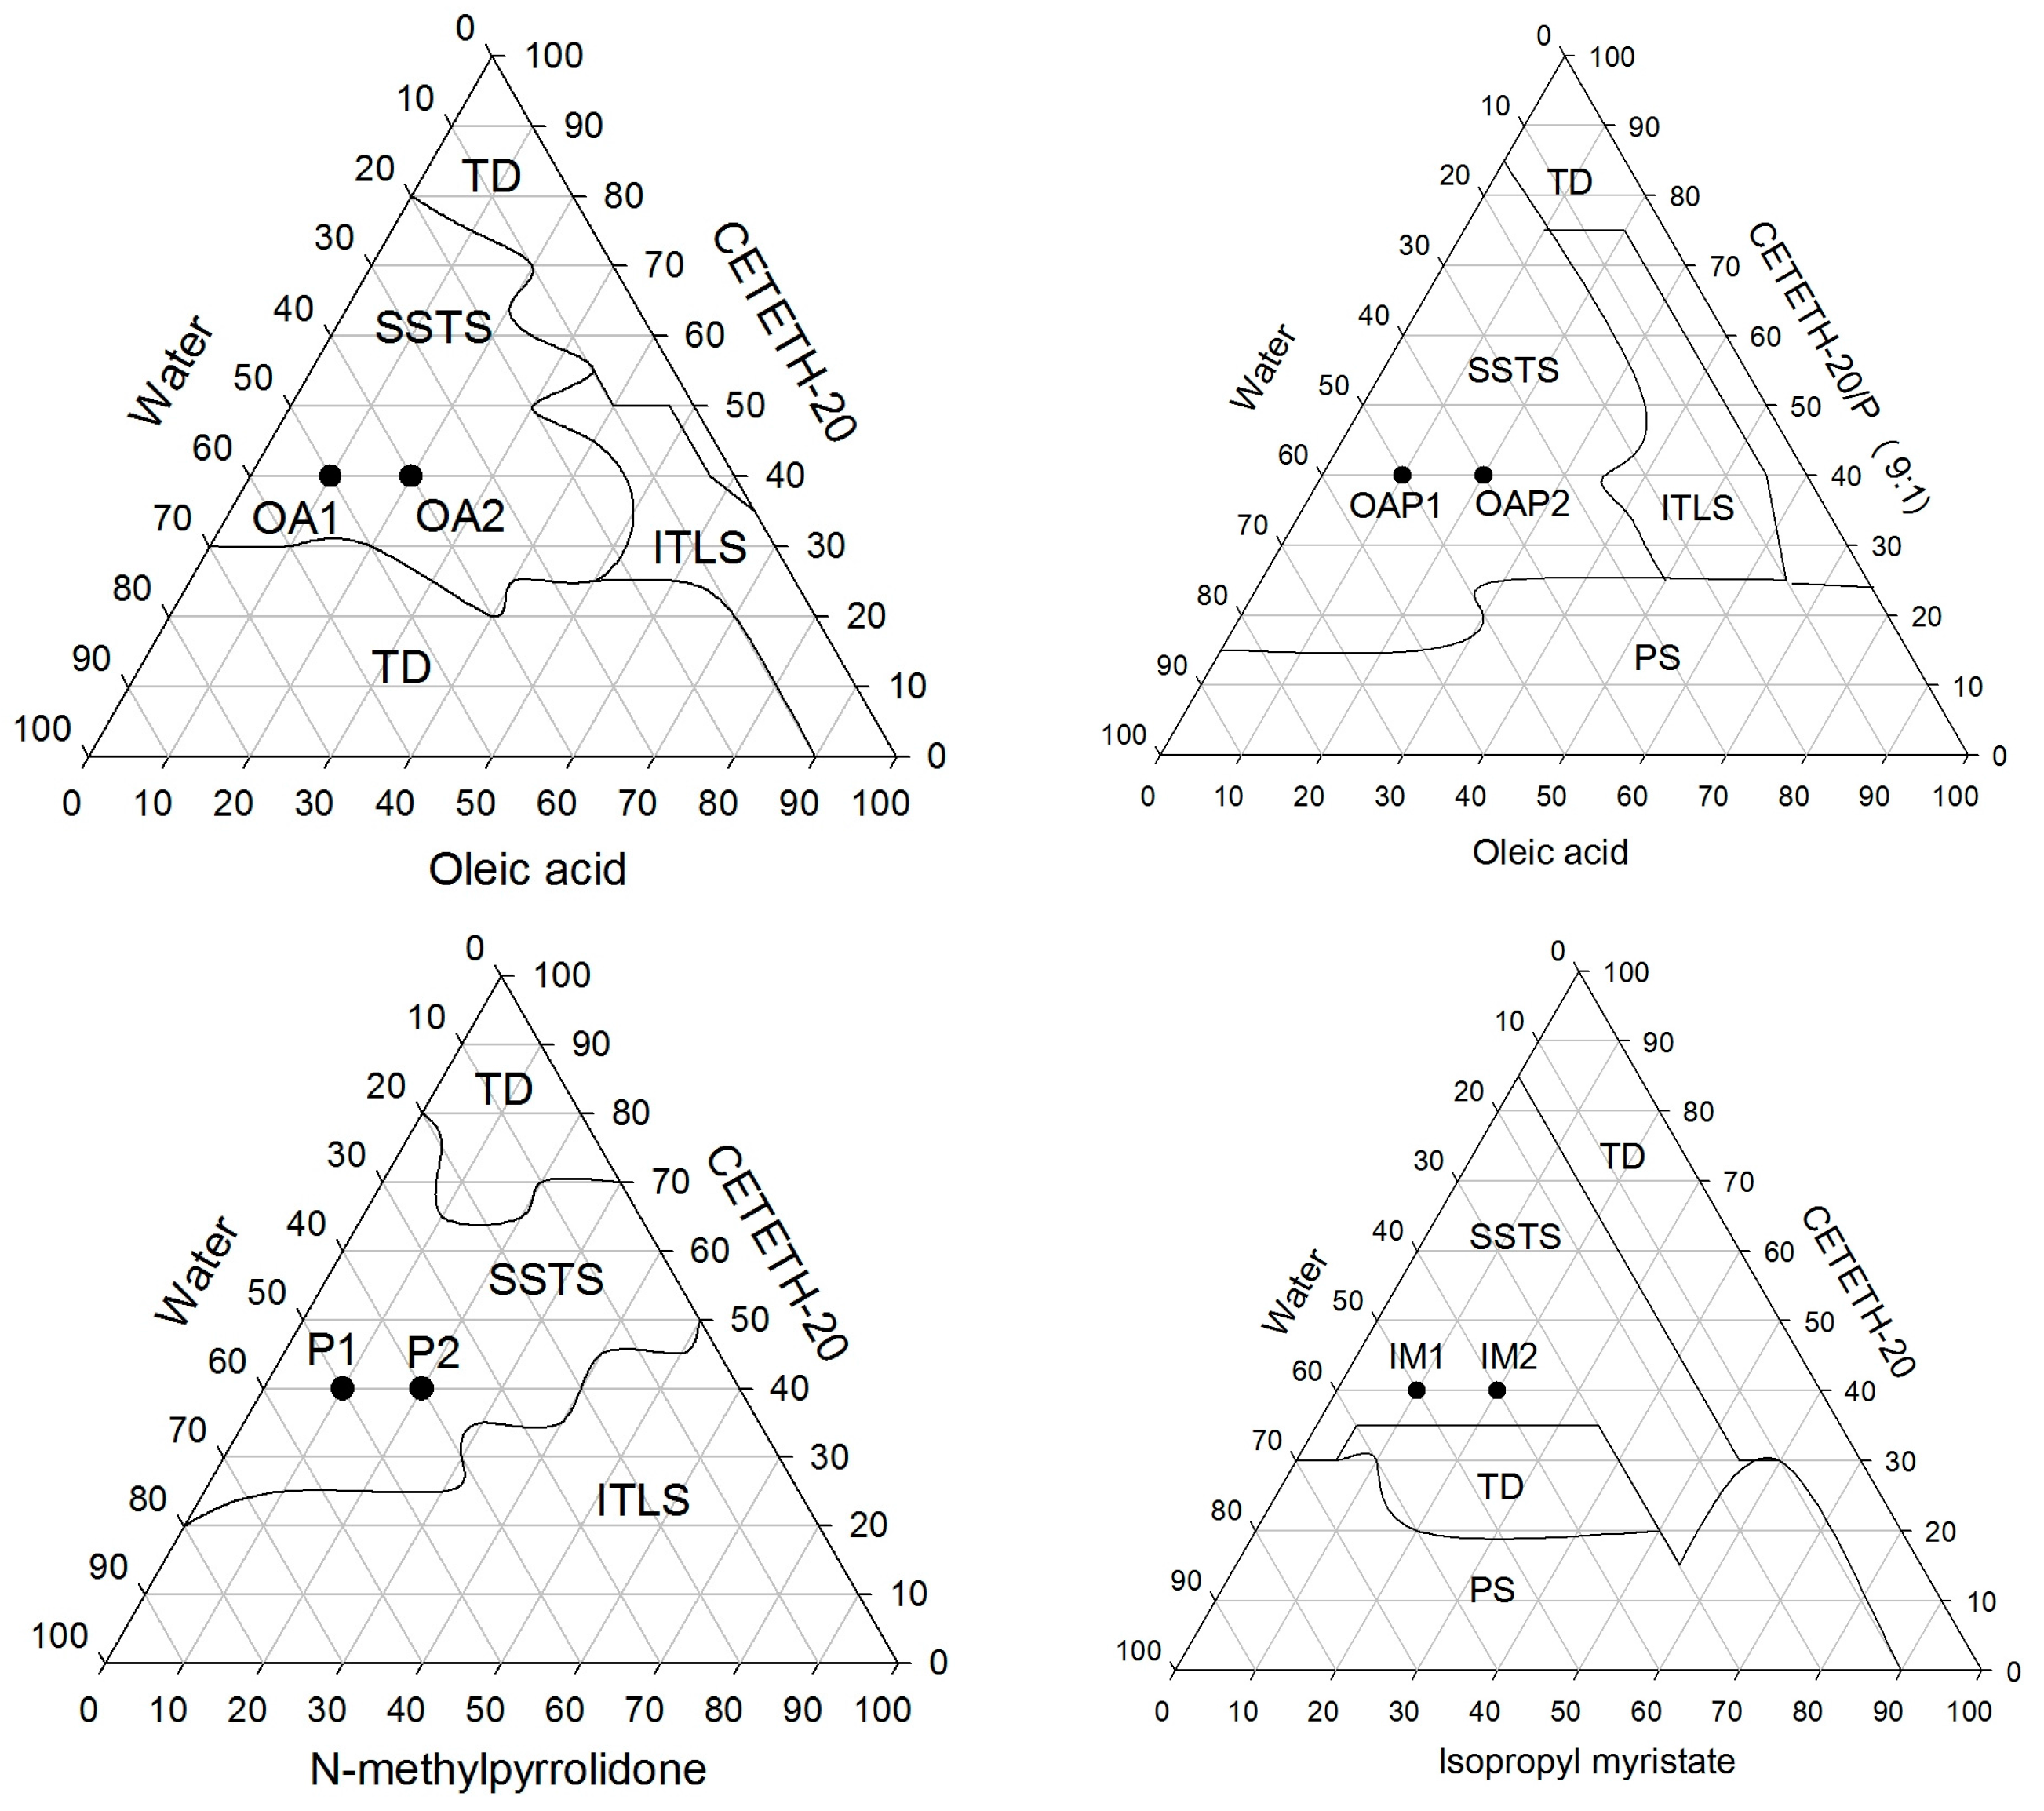
A phase diagram is an excellent tool to provide an overview of where phase transitions may occur. The ternary phase diagrams constructed for the oily phases including OA, P, and IM are presented in
Figure 2. The systems, termed semi-solid transparent systems (SSTS), were visually classified as potential liquid crystals when they were semi-solid, exhibited transparency, were spontaneously formed, and had thermodynamic stability. The SSTS occurred over a wide range of surfactant concentrations (from 20 to 90%) and may be composed of straight and reverse structures since it was possible to obtain SSTS with oily phases of approximately 1–50%.
Physico-chemical studies were performed for formulations (1) and (2), as indicated in the ternary phase diagrams in
Figure 2, and their compositions are listed in
Table 1. The concentration of the surfactant (CETETH-20) was fixed at 40% (
w/
w), whereas the other concentrations varied. Results of the stability tests showed that the formulations kept their homogeneity, color, mesophase, and pH (3.51–4.91).
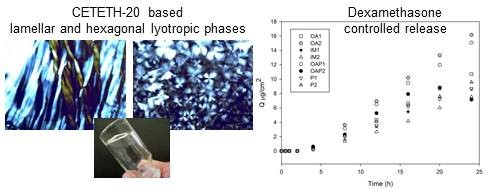
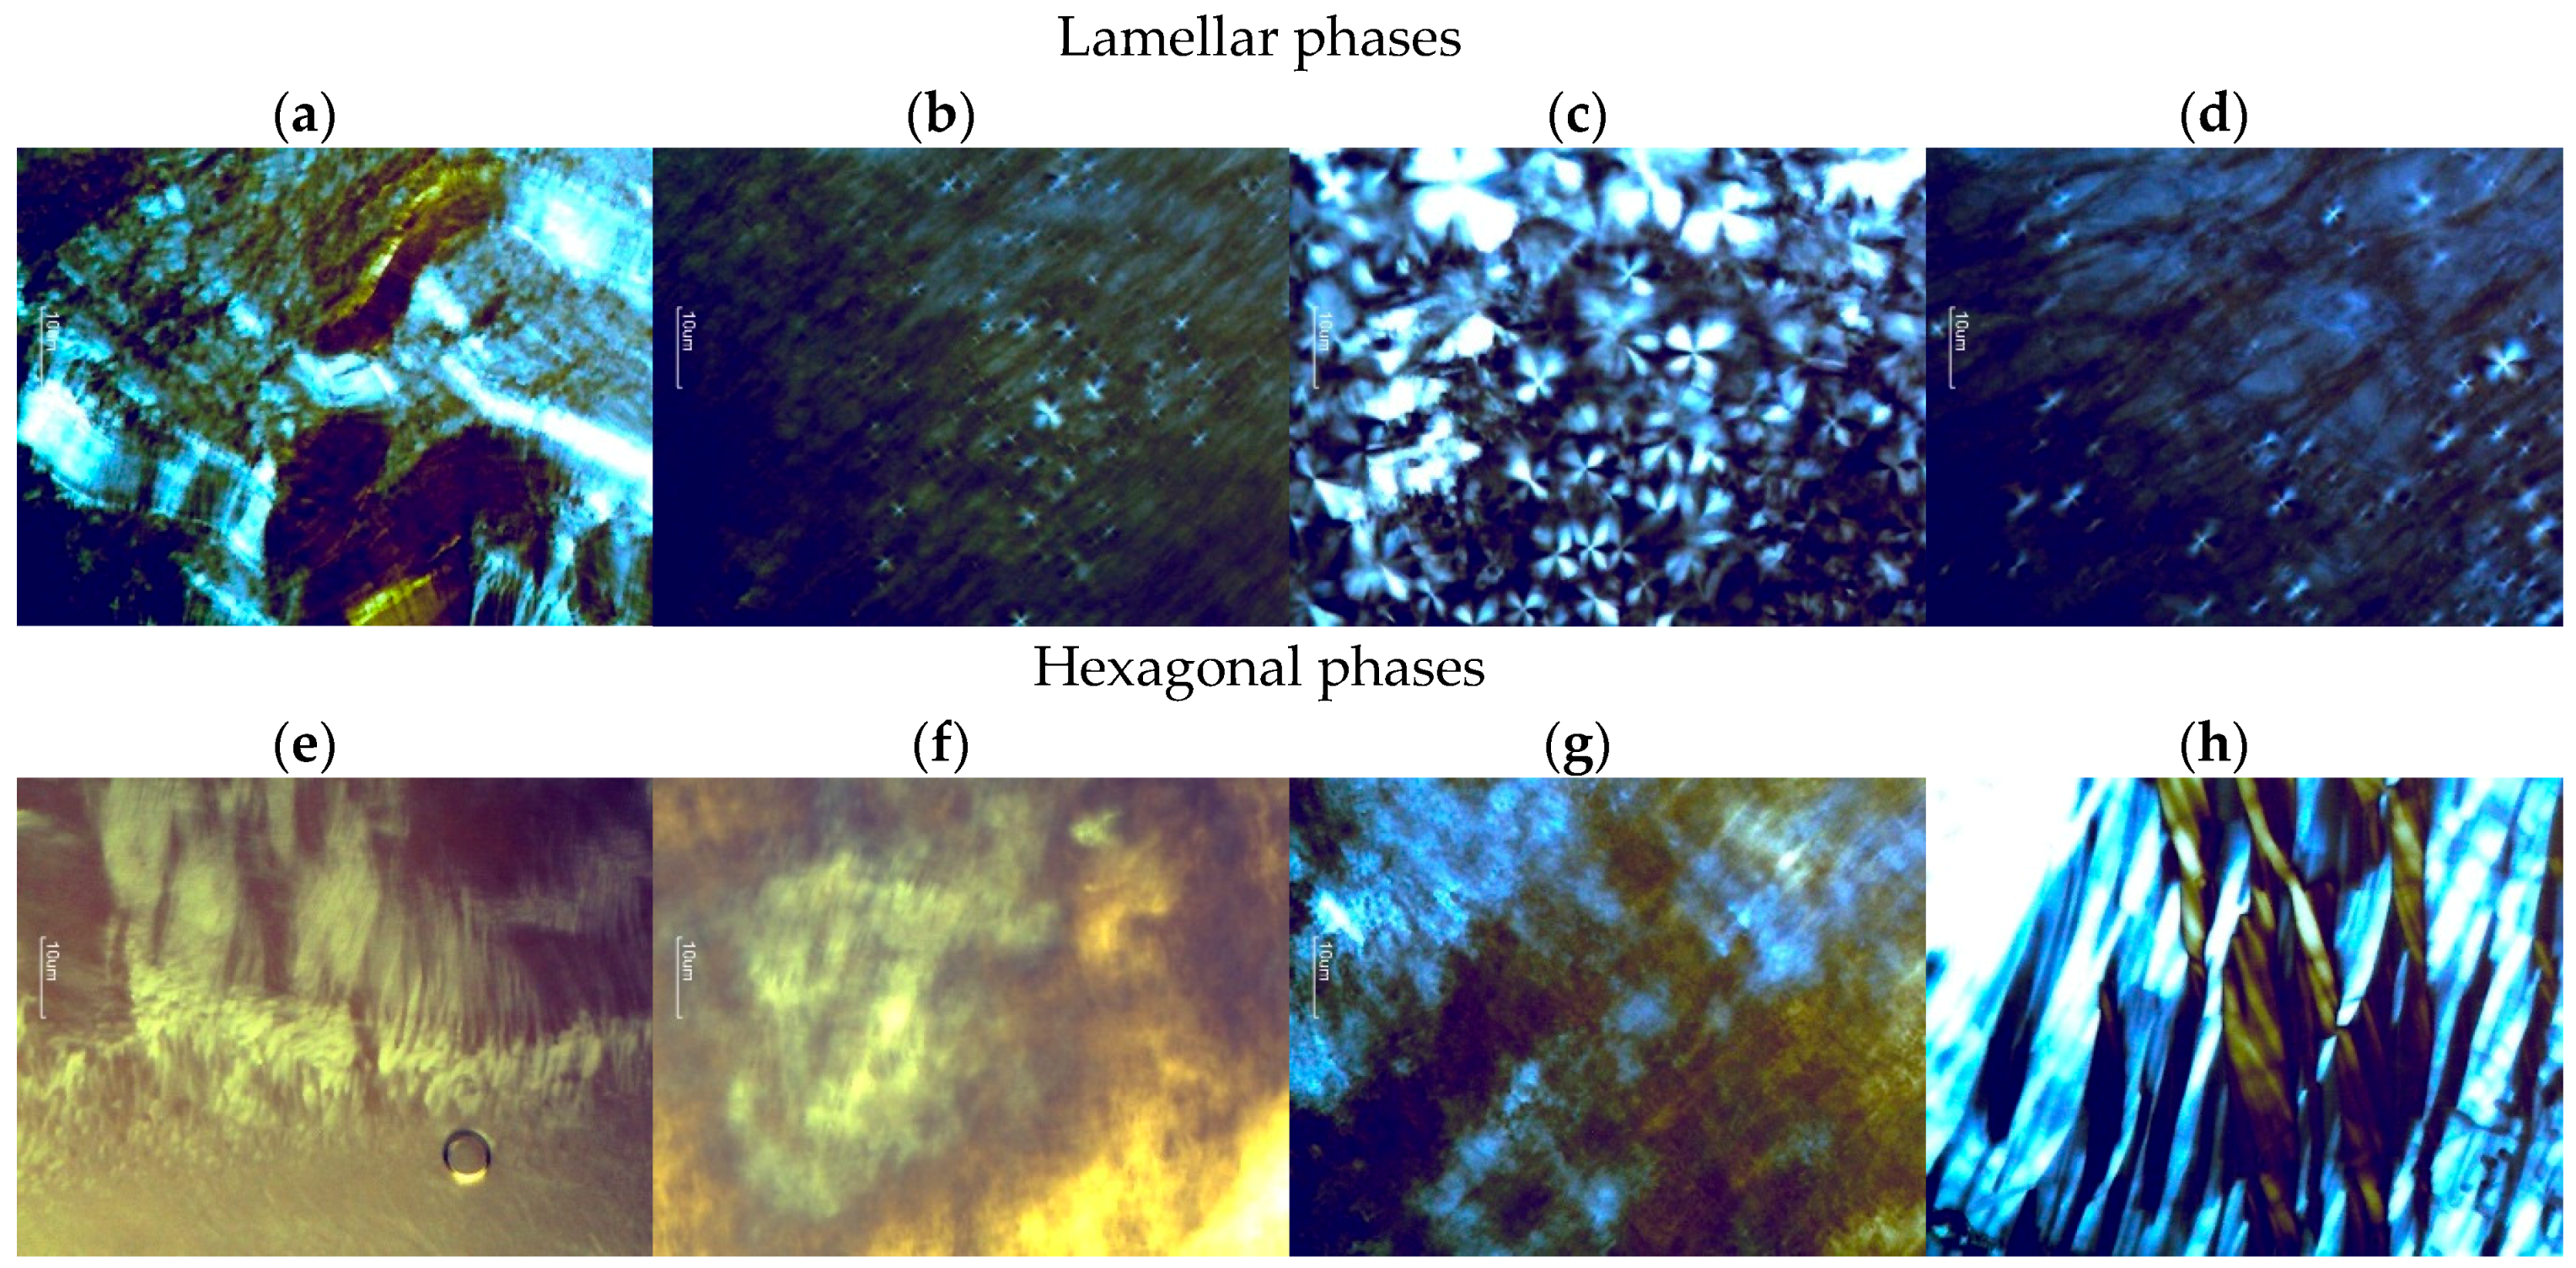
Lyotropic liquid crystals that are anisotropic and rotate the polarization plane result in various patterns of colors and texture. Hexagonal structures lead to fan-like images and lamellar phases have “strip-like” structures [
15] as can be observed in
Figure 3. In this way, samples P and IM are potential hexagonal phases and OA and OAP can be lamellar phases.
The formation of various mesophases with different textures can be observed. Macroscopic and microscopic observations cannot be the only assessment criterion for lyotropic liquid crystals but should be verified using additional methods [
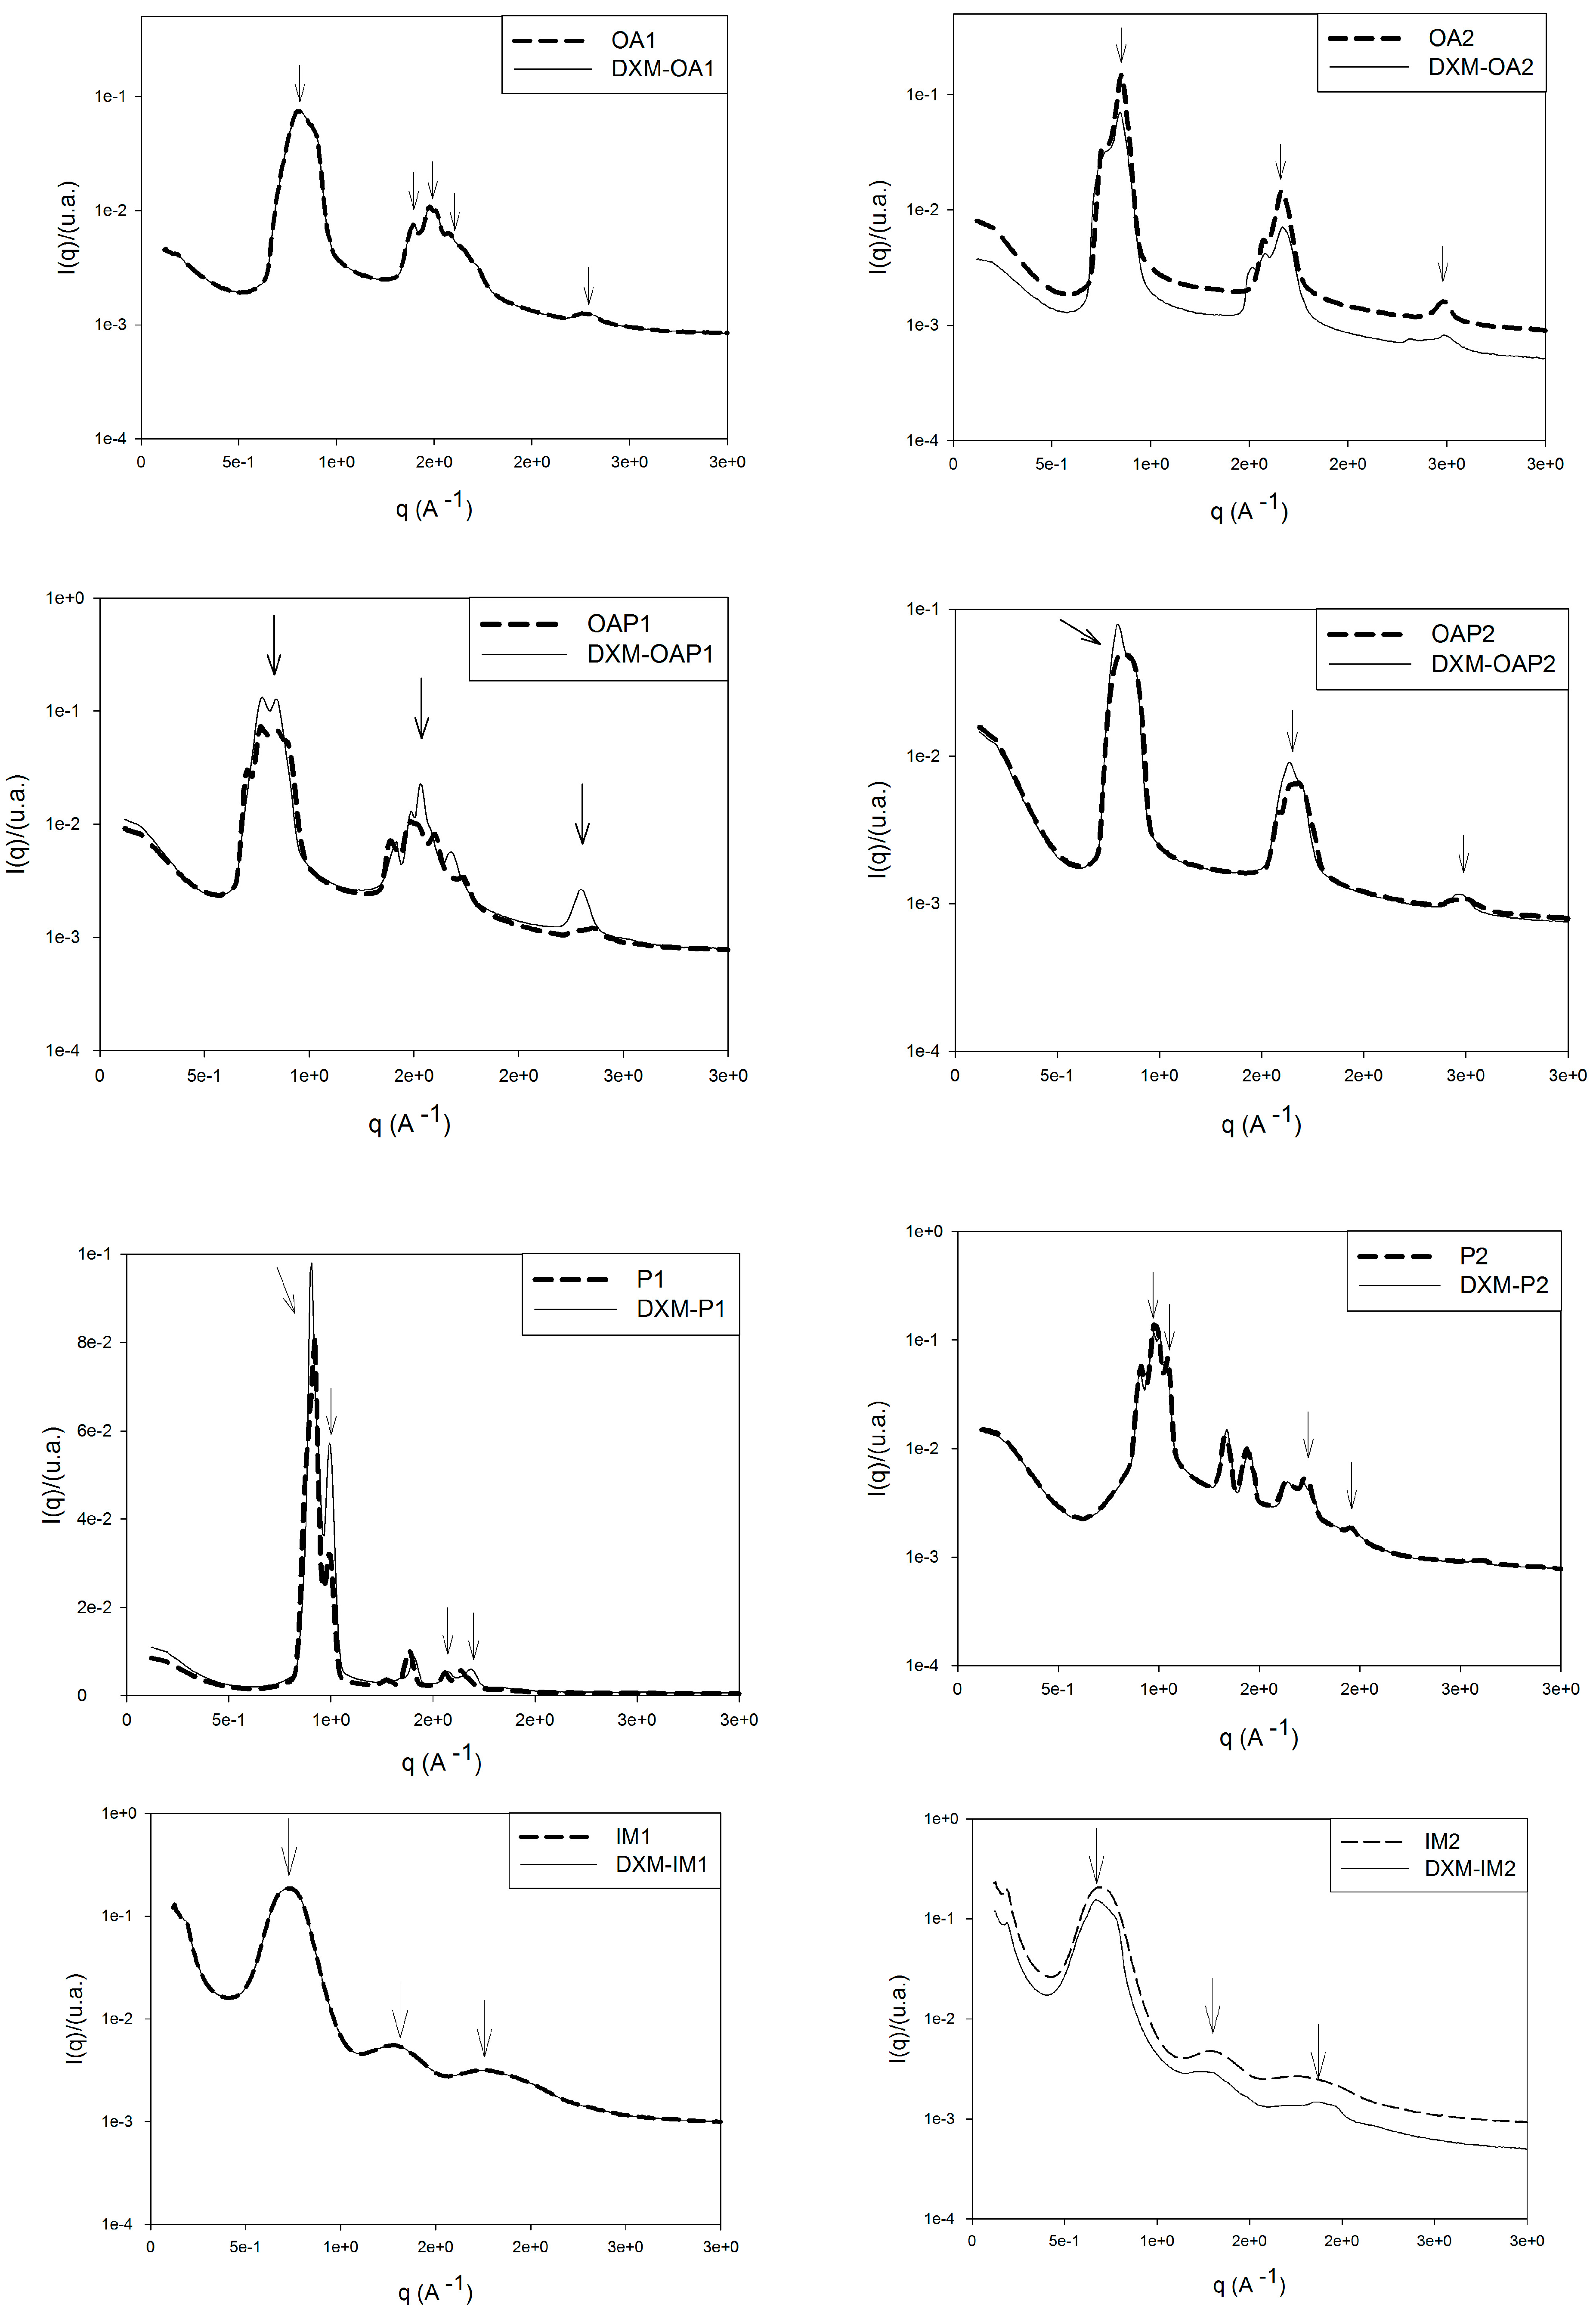
15]. To achieve this, the phase behavior of the liquid crystals was also evaluated by SAXS. The curves obtained from the plot of intensity, I, versus the scattering vector module,
q (Å
−1), are shown in
Figure 4. Structures formed by lyotropic liquid crystals can be interpreted from the peak positions on the scattering vector axis.
As seen in
Table 2, the ratio between the first and second peaks of formulations OA2, OAP1, and OAP2 is 2:1, which is characteristic of lamellar phases [
16]. These results confirm the Malta crosses visualized by PLM for these lamellar phases. For hexagonal liquid crystals, the relative peak positions (compared to the most intense peak) should adhere to 1:√3:2:√7 [
16] as observed in the scattering sample profiles of IM1, IM2, P1, and P2 (
Figure 4). The texture of the hexagonal phase that was visualized by PLM was confirmed for the P and IM formulations; however, Maltese crosses for OA1 were also observed. In addition, the oscillatory rheological profile of this sample (
Figure 5) also confirms the phase behavior. Since the SAXS curve of OA1 presented an overlap of the second peaks, a mesophase classification was considered for the PLM and rheological measurements of this sample.
The correlation distance between the scattering objects was calculated as d = 2π/
qmax, where
qmax is the
q value at the intensity peak I (
q), and d is the lattice parameter. For lamellar phases,
d is the spacing between two adjacent layers. For hexagonal phases,
d is the distance between adjacent rows of cylinders in the hexagonal structure [
17].
Table 2 lists the calculated
d values for the formulations. The results indicate that the distances,
d, between the scattering objects are in a nanoscale range since 1 Å = 0.1 nm. Therefore, the liquid-crystalline systems present a nanostructured organization.
Data are shown for DXM loaded formulations as well, and demonstrate that the drug did not alter the structure of samples, except for loaded DXM-IM2, in which the correlation peaks of the hexagonal phase was loosened (
d1/
d2 = 1.94:
Table 2). This correlation value was not reported in the literature to allow for a mesophase classification.
The hexagonal phase is formed by cylindrical micelles. The cross section of the micelles can be round or oval. The lamellar phase is formed by the bilayers of two planes with non-penetrating or mutually penetrating hydrocarbon chains. The length of the planes is limited by the size of the container [
15].
In addition to transparency, rheology was also utilized for the liquid crystal investigation. Visually, the viscosity of the hexagonal phases may be so high that the liquid does not flow. A decrease in viscosity compared with the hexagonal phases is a characteristic feature of the presence of the lamellar phase. The viscosity drop is caused by the layer structure of the phase, which results in easy slip planes [
15]. The oscillatory rheological data confirm these properties.
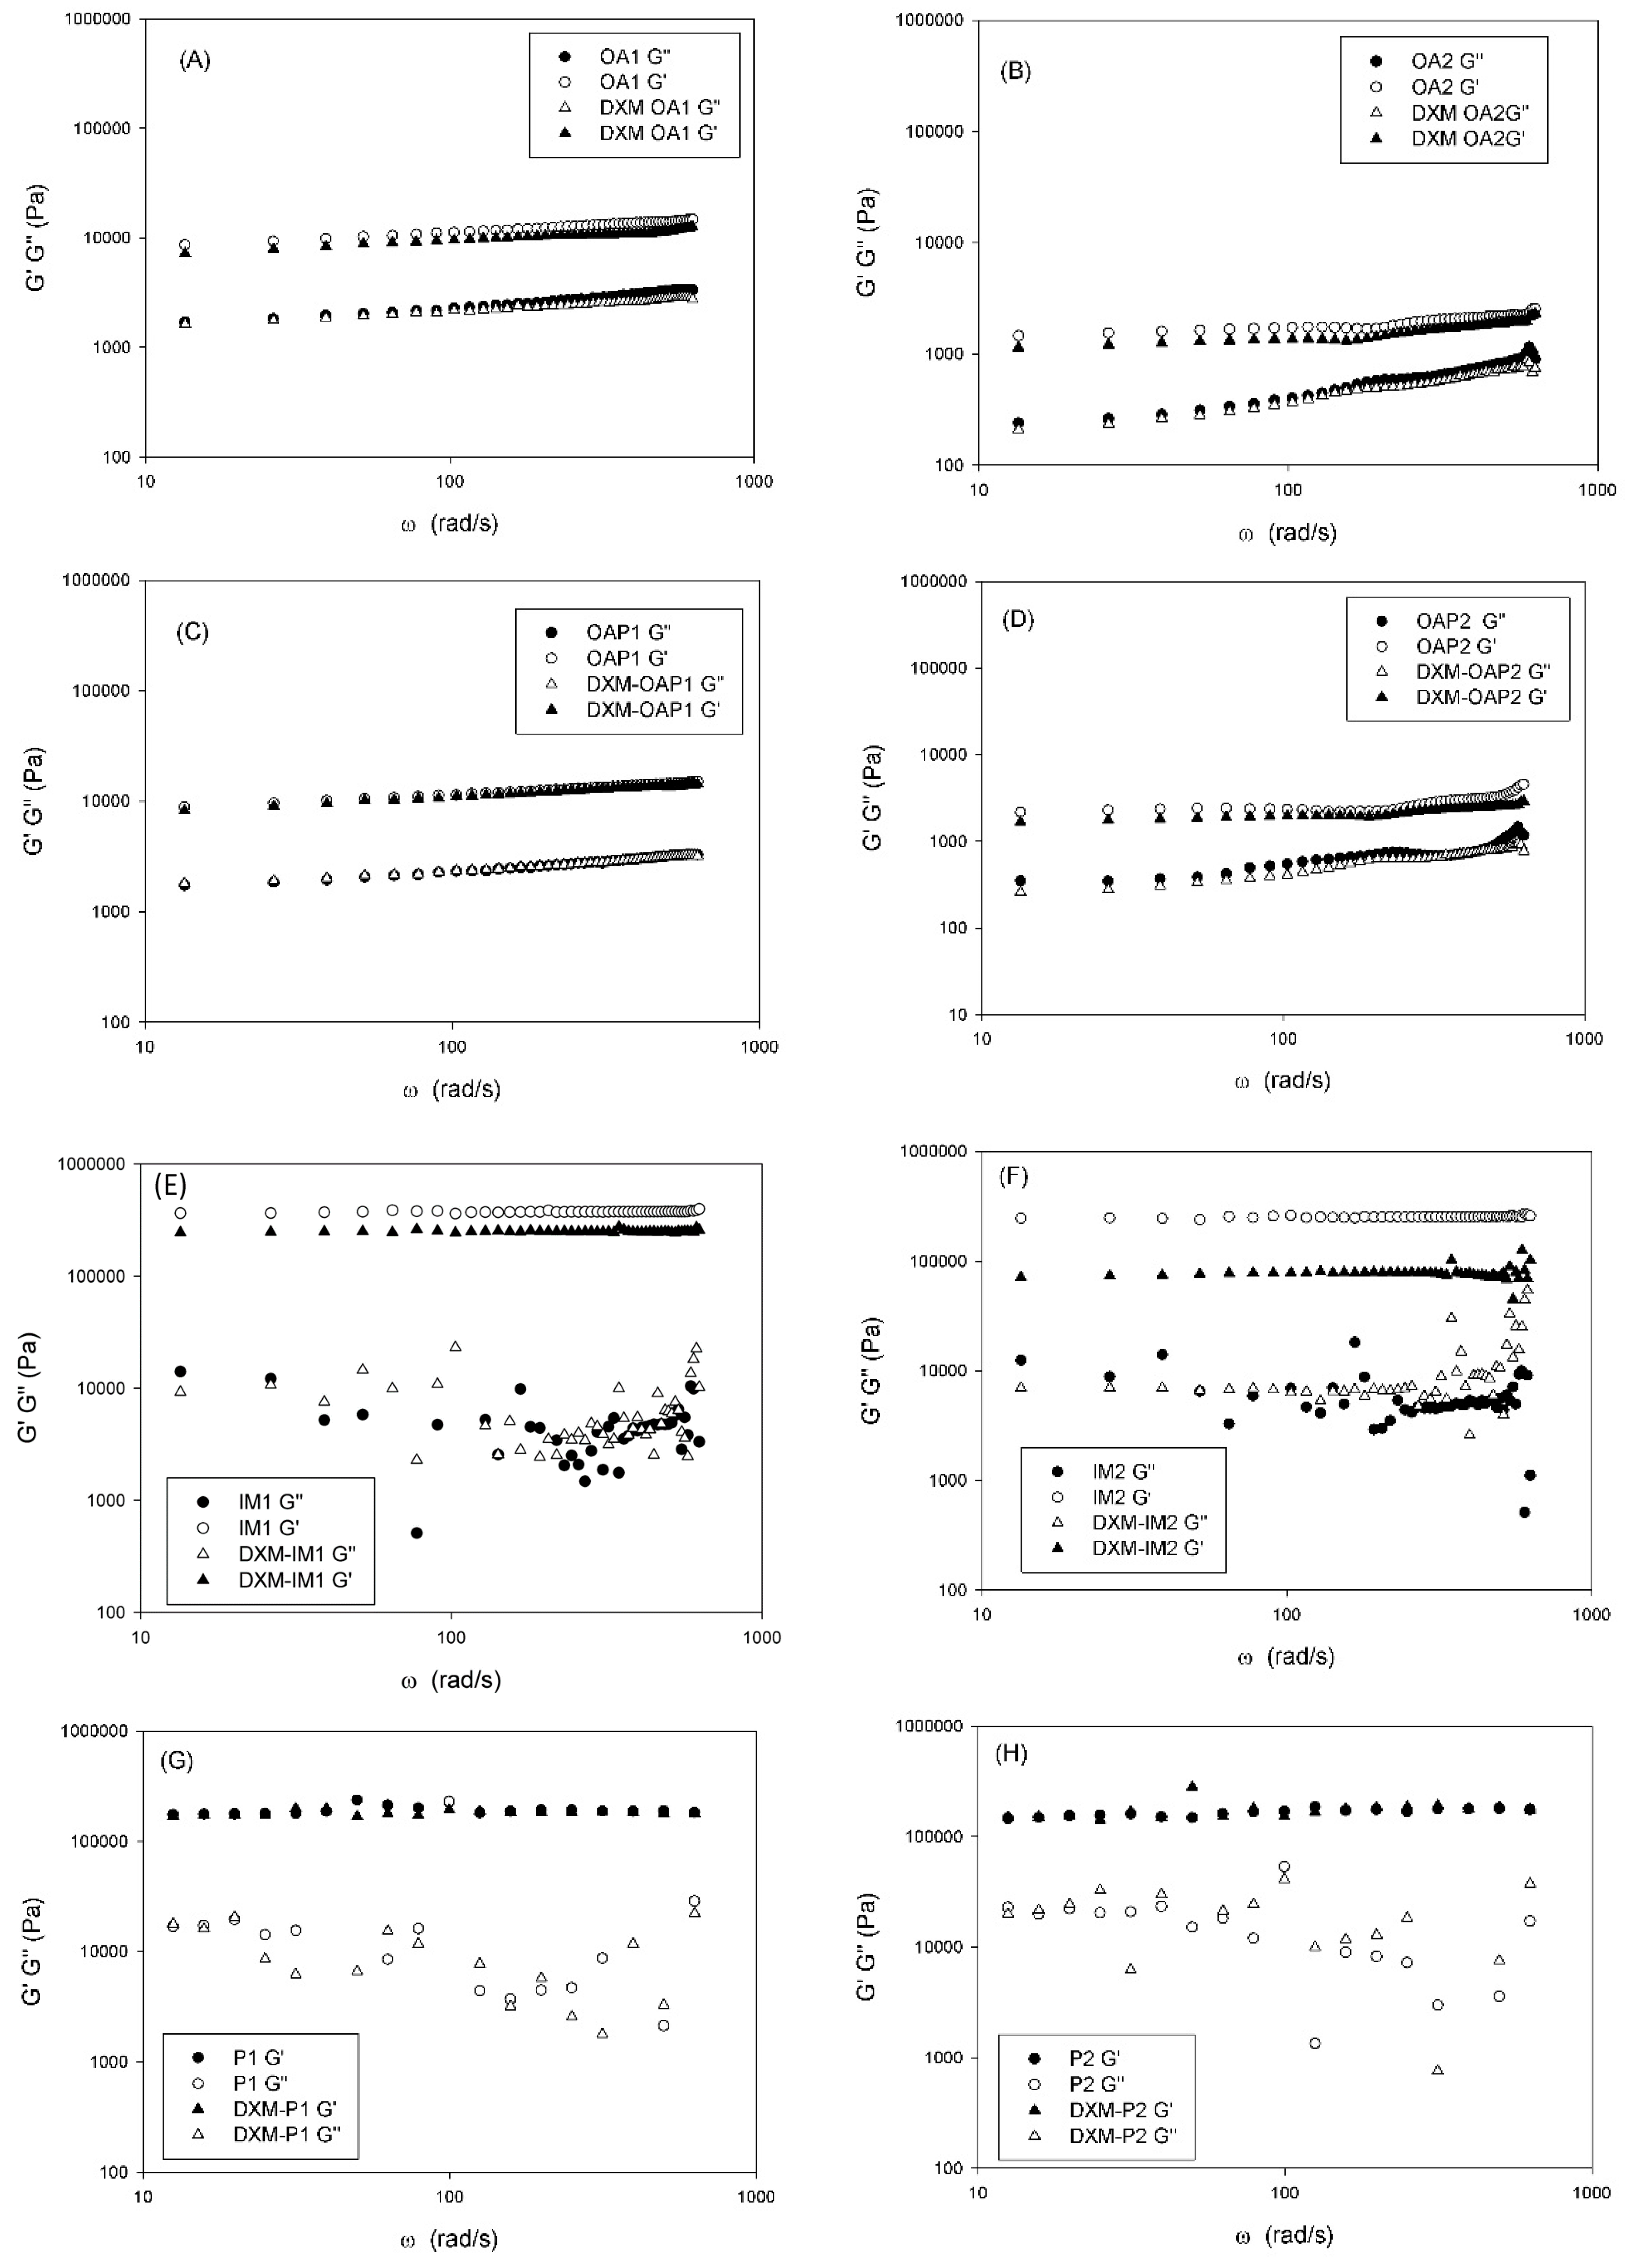
Figure 5 shows the rheograms of the storage (G′) and loss moduli (G′′) as a function of the oscillatory frequency.
The storage modulus represents the solid-like component of a viscoelastic material. The loss represents the liquid-like element [
13,
18]. The frequency sweep analyses suggest that OA and OAP samples are more elastic and less viscous at the selected frequency because G′ > G′′. Furthermore, both moduli are frequency dependent, since a small slope can be observed on the rheological curves. Independent of the frequency, the G′ values were approximately 100× higher for the P and IM samples than for the OA and OAP samples. This indicates a highly structured character.
Although OA1 samples have been classified as hexagonal phases by SAXS, the Maltese crosses characteristic of lamellar phases was visualized by PLM, and the rheological profile follows the same pattern of the lamellar phases of OA2, OAP1, and OAP2 suggesting that OA1 is a lamellar liquid crystal.
Oscillatory rheology performed in the linear viscoelastic region can give information about the microstructure of the system at rest. In low-frequency ranges, an entangled network can disentangle according to time, while a network of secondary bonds is fixed independent of the time. For dispersions of high molecular weight, G′ > G′′ represents a network consisting of secondary bonds and G′ ≤ G′′ for physically entangled systems. The curve of viscoelastic moduli versus frequency of an entangled system shows a slope, while for a network of secondary bonds constant values of moduli are observed all over the frequency range [
18]. According to the rheological curves shown in
Figure 5, OA and OAP samples present a slight slope, while P and IM samples present a frequency independent value of G′ and complete loss of the viscous component. In addition, it can be seen that the loss modulus G′′ of the lamellar phases OA and OAP present a linear trend, while this trend was lost for the hexagonal phases P and IM. The high values of G′ and the plateau region presented by P and IM samples are related to the formation of an elastic structural network due to the interactions between the liquid-crystalline domains, which is stronger for hexagonal than lamellar phases. This phenomenon is traduced macroscopically by the flowability of the lamellar phases and the extremely high stiffness of the hexagonal phases.
In the lamellar phases, OA1 and OAP1 exhibited higher G′ values than the OA2 and OAP2 systems. The main difference between group 1 and 2 is the balance between the proportions of aqueous and oily phases. Lamellar phases with higher water content (group 1: OA1 and OAP1) resulted in stronger interactions between the bilayers than lamellar phases with the same amount of surfactant, but a lower proportion of water (group 2: OA2 and OAP2). It can be suggested that the increase in the oily phase results in weaker interactions between the bilayers and the H-bonds between surfactant and water and may improve the strength of the bilayer network.
The difference between the proportions of the components of the formulations did not alter the elastic behavior of the hexagonal samples and the G′ values were of the same magnitude. However, for loaded IM2, the drug may have interfered in the network, since there was a pronounced decrease in G′. This points to structural changes and is consistent with the SAXS results since the DXM-loaded IM2 lost its hexagonal SAXS pattern. However, the magnitude of G′ is still higher than in the lamellar phases. Therefore, both hexagonal and lamellar phases were found to be more elastic than viscous in the range of frequency considered, and the storage modulus was higher than the loss modulus. Moreover, the elastic properties of the hexagonal phase were higher than that of the lamellar phase.
The hexagonal phase presented the strongest network and the most stable internal structure as it presented higher G′ values. This corresponds to high-density connection points of the cylindrical micelles and strong interactions developed within and among the monodomains [
19].
The PLM, SAXS, and rheological measurements show that DXM did not alter the structure of the liquid crystals in general. Since it is a lipophilic drug, it may be stabilized and protected in the oily phases.
4.2. Textural Analysis and Skin Bioadhesion Strength
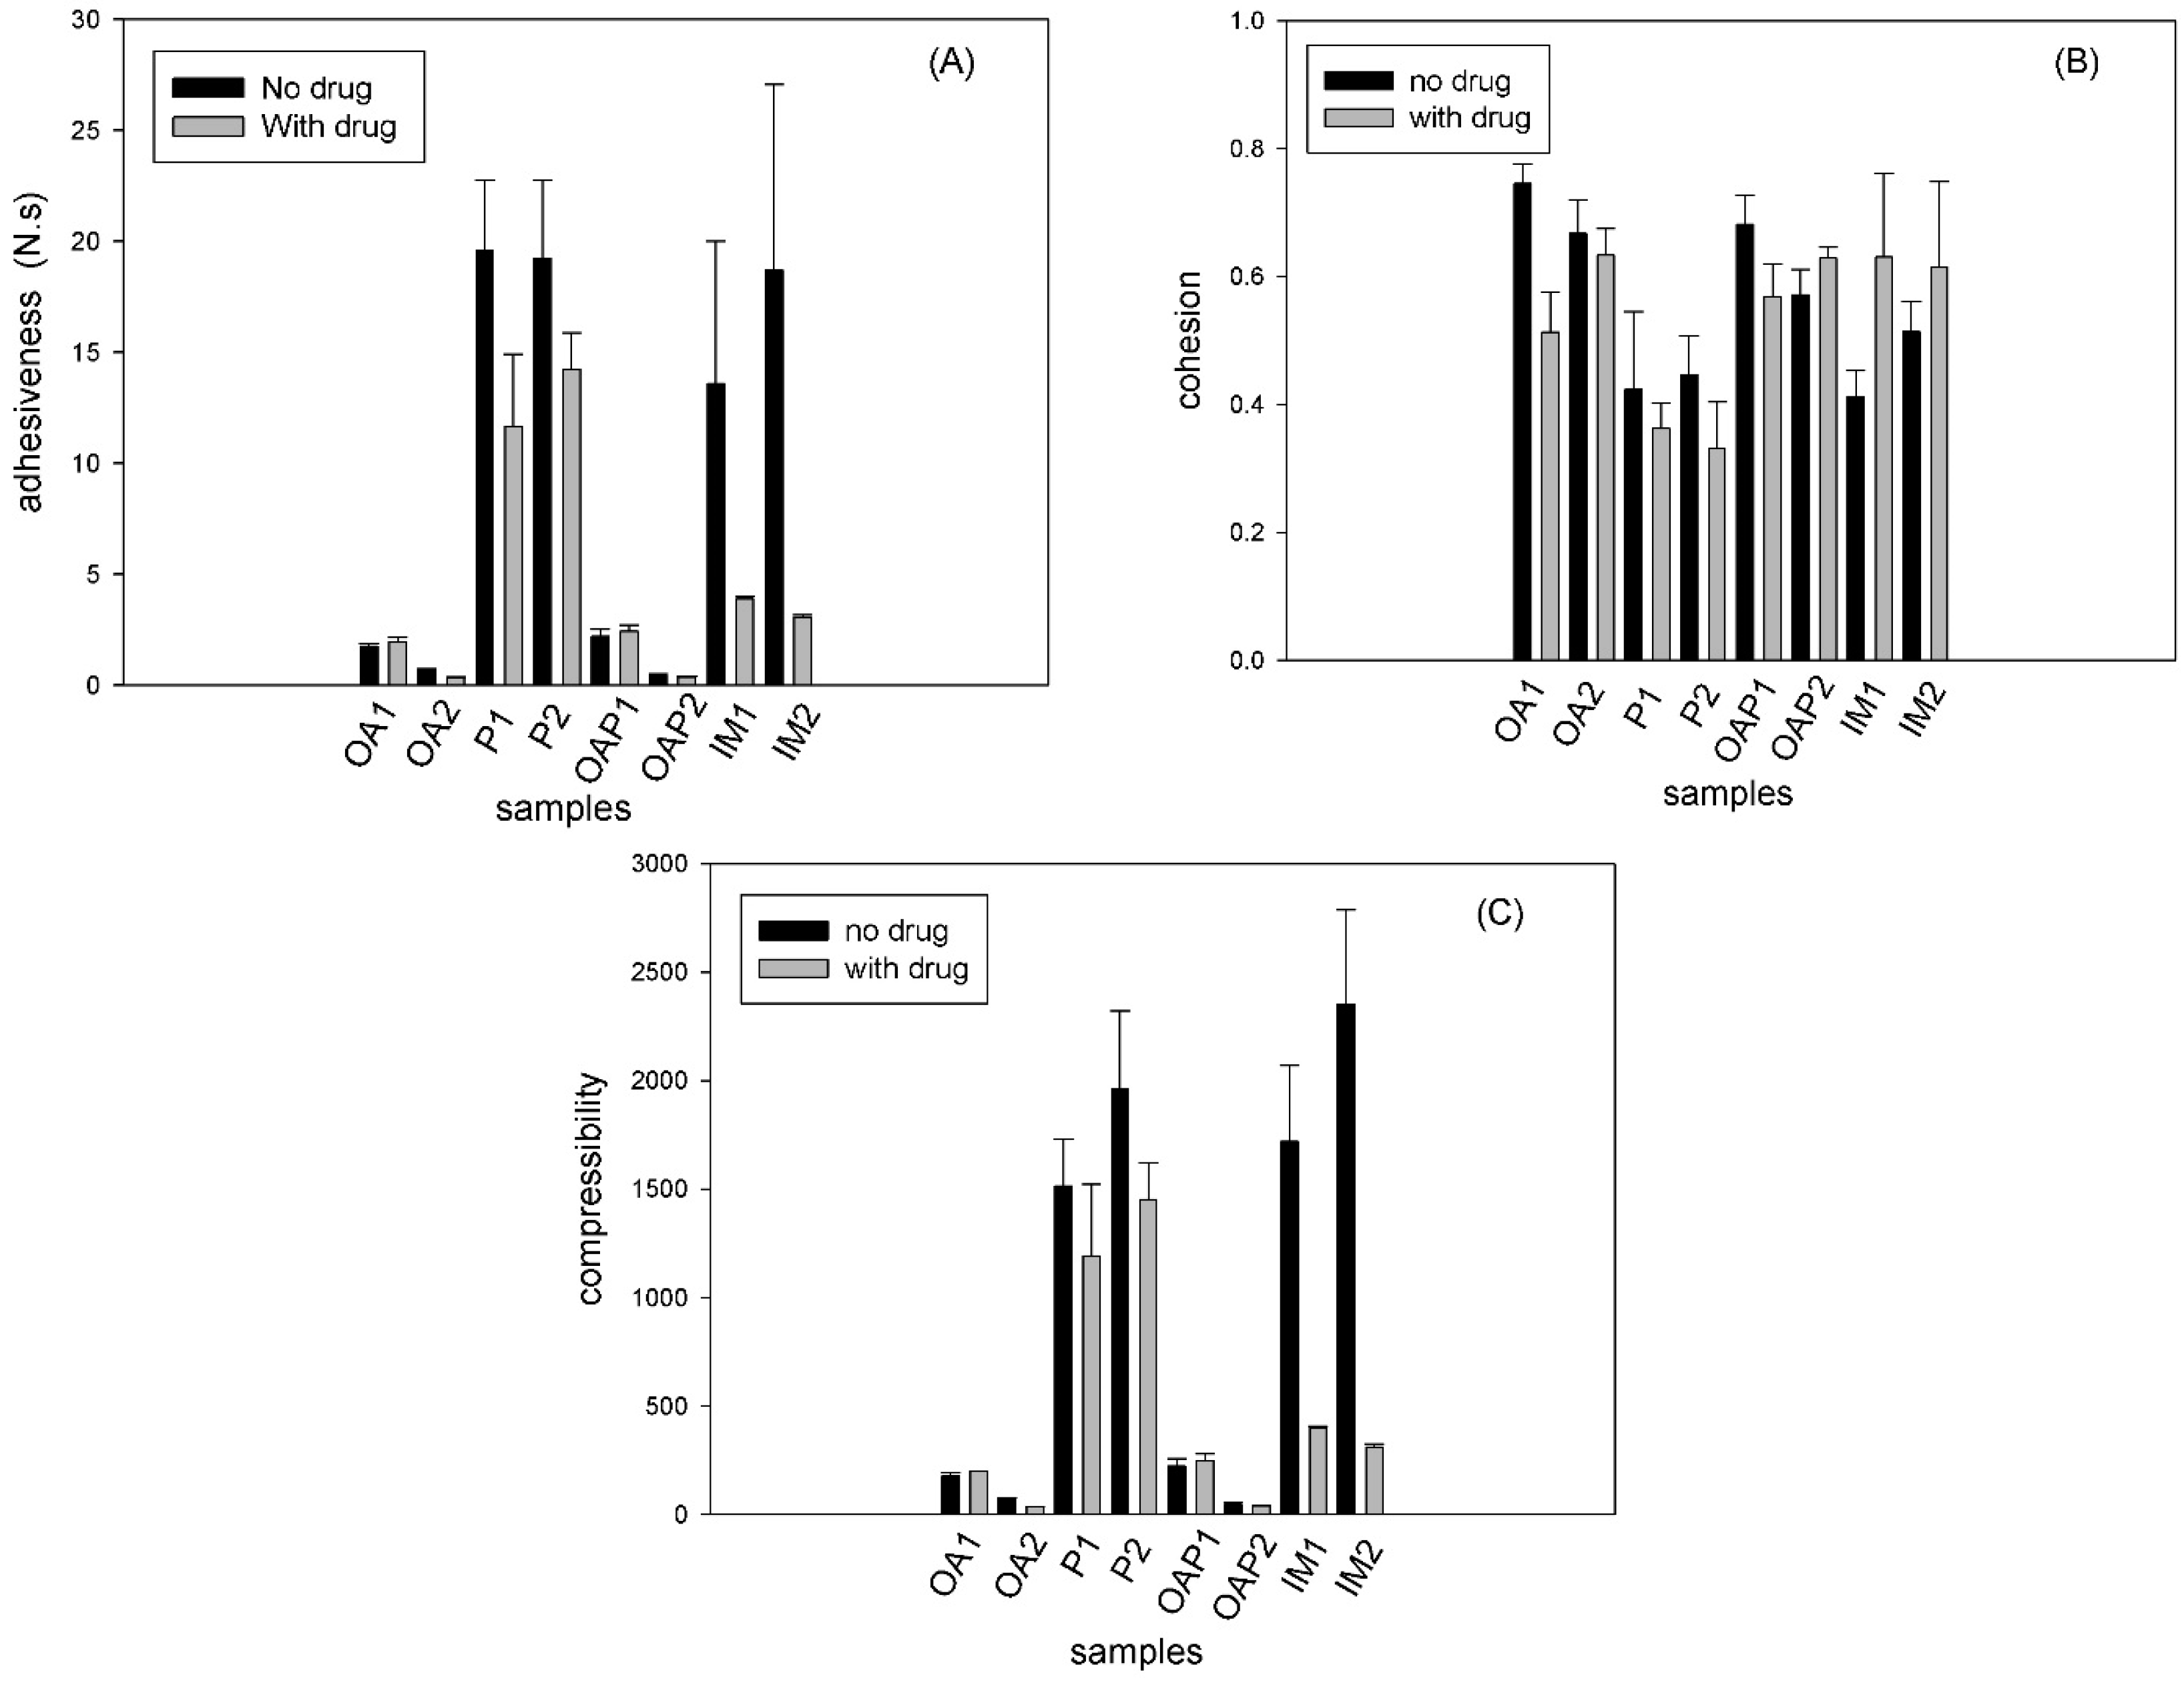
The mechanical properties of the formulations, such as hardness, compressive resistance, cohesion, and adhesion were measured using a texture analyzer. The parameters obtained were calculated from force time curves. The results are shown in
Figure 6.
Compressibility is the total force area obtained during the first compression cycle in the TPA test (Stable Micro Systems). The compressibility results (
Figure 6C) exhibited the same trend as the adhesion parameter (
Figure 6A). Adhesion was calculated from the negative area of the force-time curve, which was generated during the first compression of the TPA test. Adhesion is the work required to overcome the attractive forces between the probe and sample.
Figure 6A,C show that the hexagonal phases (P and IM samples) were found to be harder and more adhesive than the lamellar phases (OA and OAP samples). These data correlate with the rheological analysis in
Figure 5, where the elastic modulus of the hexagonal phases was higher than in the lamellar phases.
The drug did not significantly interfere in the textural behavior of all OA, OAP, and P samples, which correlates with the SAXS and rheology results that show that the network integrity is maintained for loaded samples. However, the mechanical parameters decreased for the loaded IM1 and IM2. Moreover, this result correlates with the SAXS result, where the lattice parameters calculated for the loaded IM2 show a loss of hexagonal pattern (
Table 2). Furthermore, the rheology result of the loaded IM1 and IM2 shows a decrease in the elastic modulus in
Figure 5E,F.
Cohesion is the rate at which the sample disintegrates under mechanical action. Cohesion occurs due to the ratio between the positive area of the second compression and the area measured in the first compression. The results in
Figure 6B show that there was a loss of sample structure and this behavior is an indication of shear thinning, which is desirable for topical pharmaceutical dispersions because the decrease in stiffness (shear thinning) facilitates topical application.
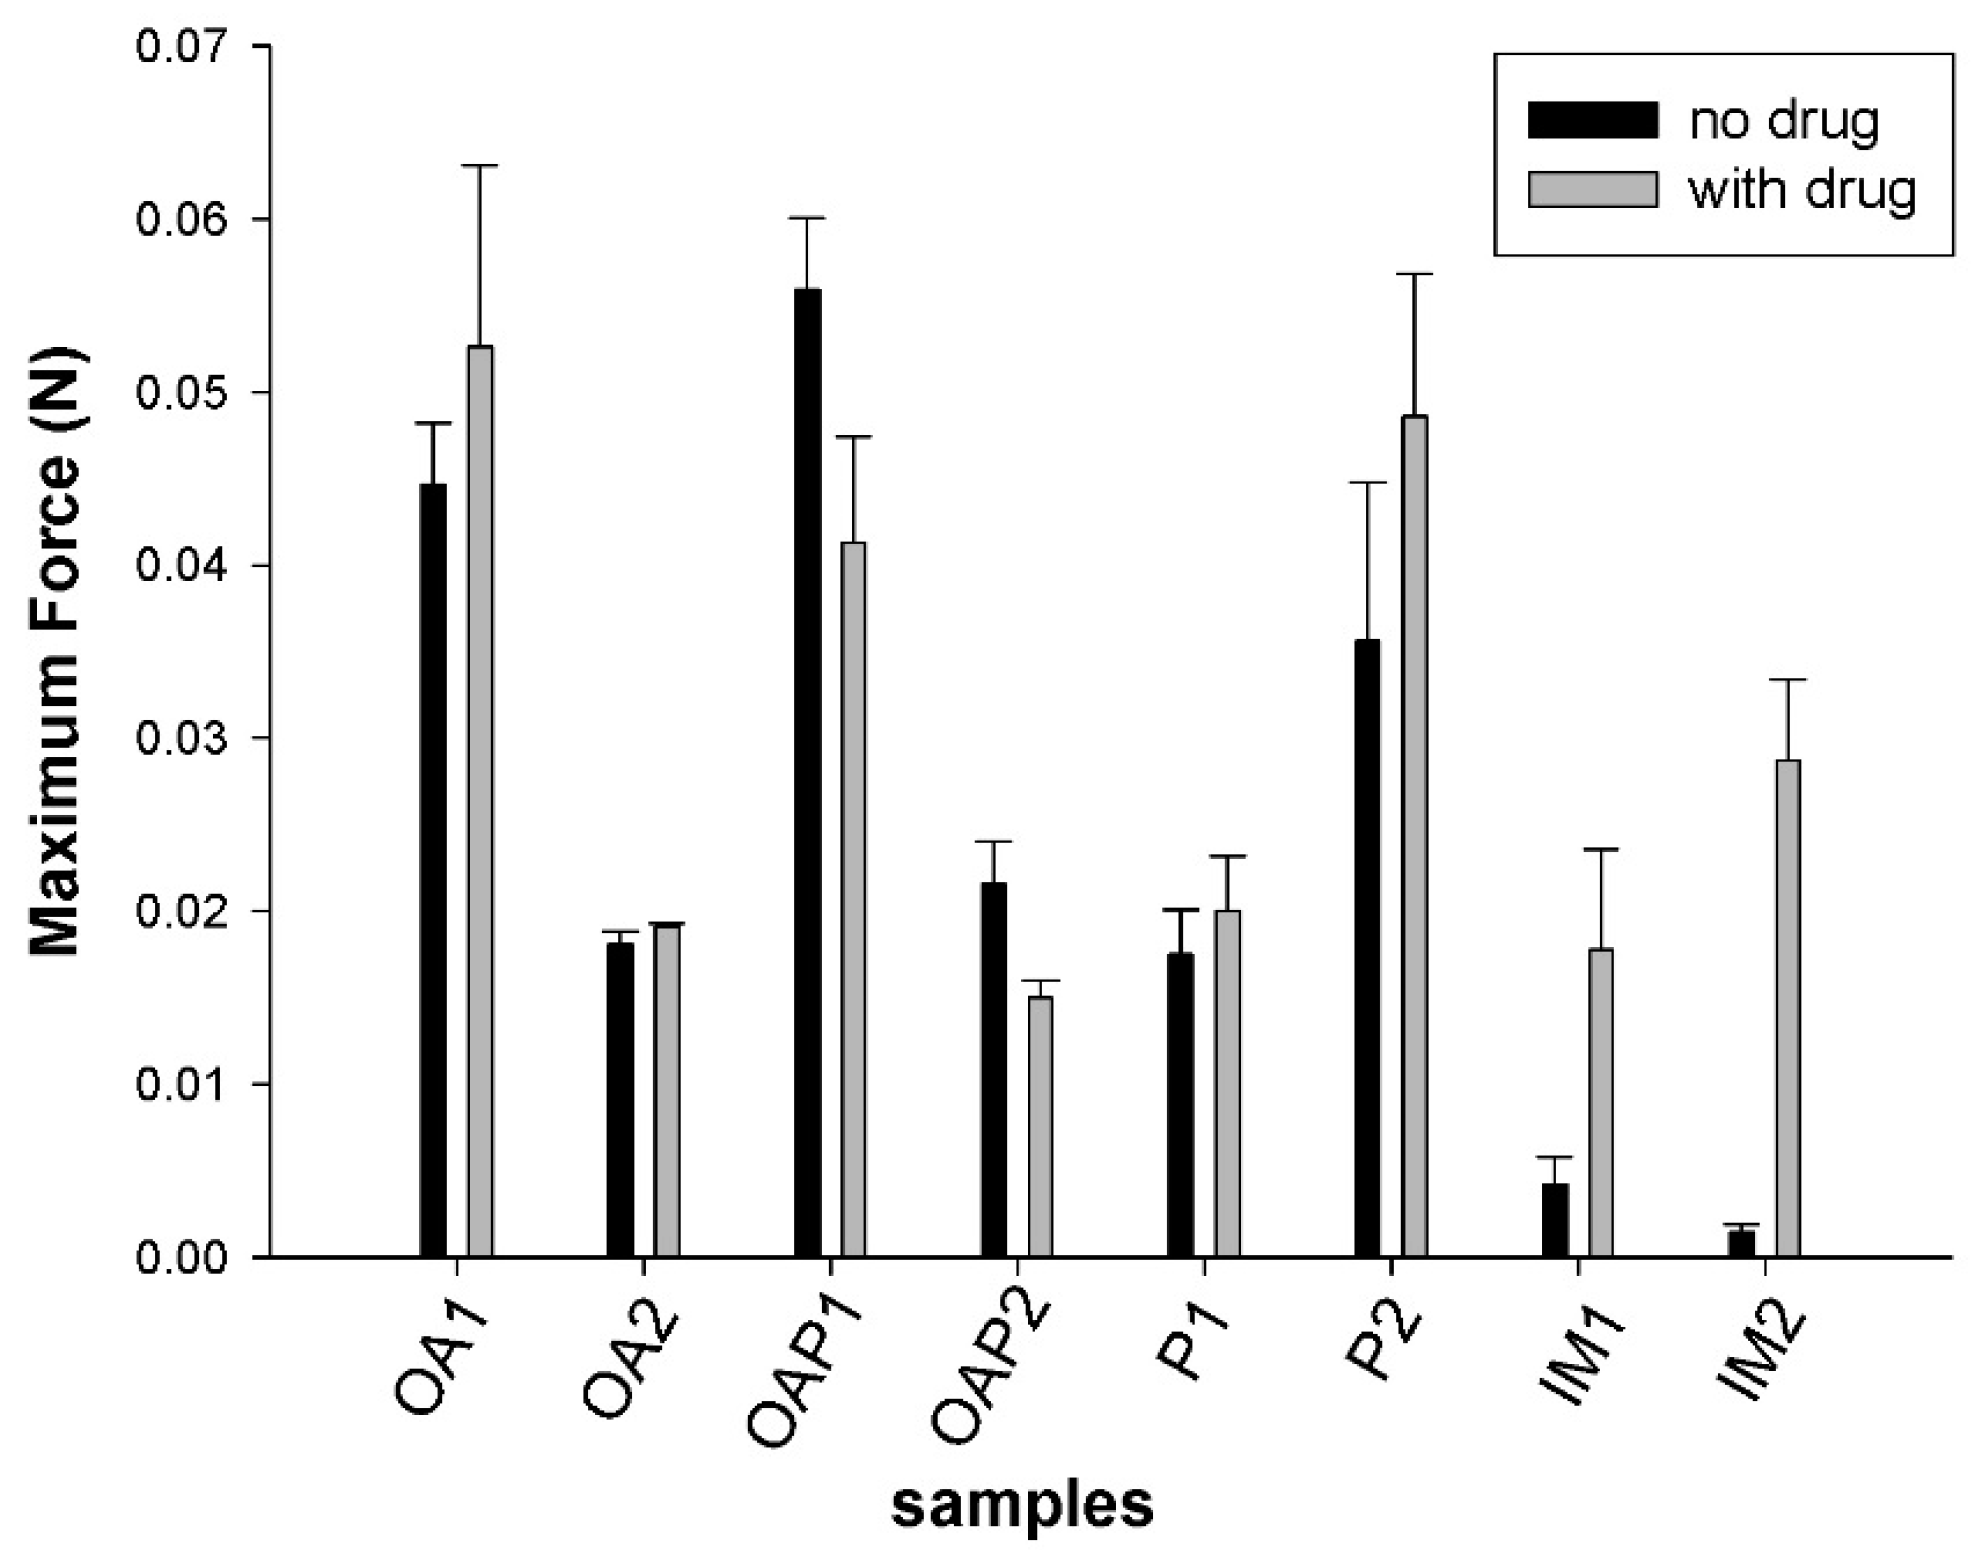
The measurements of the skin bioadhesion strength are shown in
Figure 7. Although the mean work of the bioadhesion values of DXM loaded formulations was higher than in unloaded samples the differences were not statistically significant.
Unexpectedly, the skin bioadhesion behavior did not follow the rheological and textural behavior. There was no relationship between the mesophase and force of bioadhesion. It is suggested that the bioadhesive force is more dependent on the composition of the systems than the mesophase network. Samples containing OA in the oily phase (OA and OAP) were less adhesive when a lower amount of oil was present (OA1 = OAP1 > OA2 = OAP2). In this case, it can be suggested that the oil conferred a lubricant property that decreases the interaction with the skin. Samples composed of IM presented low values of bioadhesion that can be a result of their position in the ternary phase diagram (
Figure 2), which is localized close to the phase transition line. The conditions in which the test was performed offer additional external parameters, such as the composition of the skin and elevation of temperatures to 32 °C, which may interfere with the stability of these samples and can result in phase transitions. Moreover, weakness to preserve the stability of the samples was revealed in the TPA test since the cohesion values were the lowest in the IM samples. Finally, for formulations where the oily phase was substituted by P, a dipolar aqueous and permeation enhancer agent [
20], the bioadhesion was higher for formulations containing more of the component. This test was critical to show how in vivo conditions may influence the performance of the formulation. It can be suggested that oils may decrease bioadhesion while hydrophilic permeation enhancer agents increase this property. It was also shown that even a stiff formulation could lose its bioadhesion if it is not stable enough.
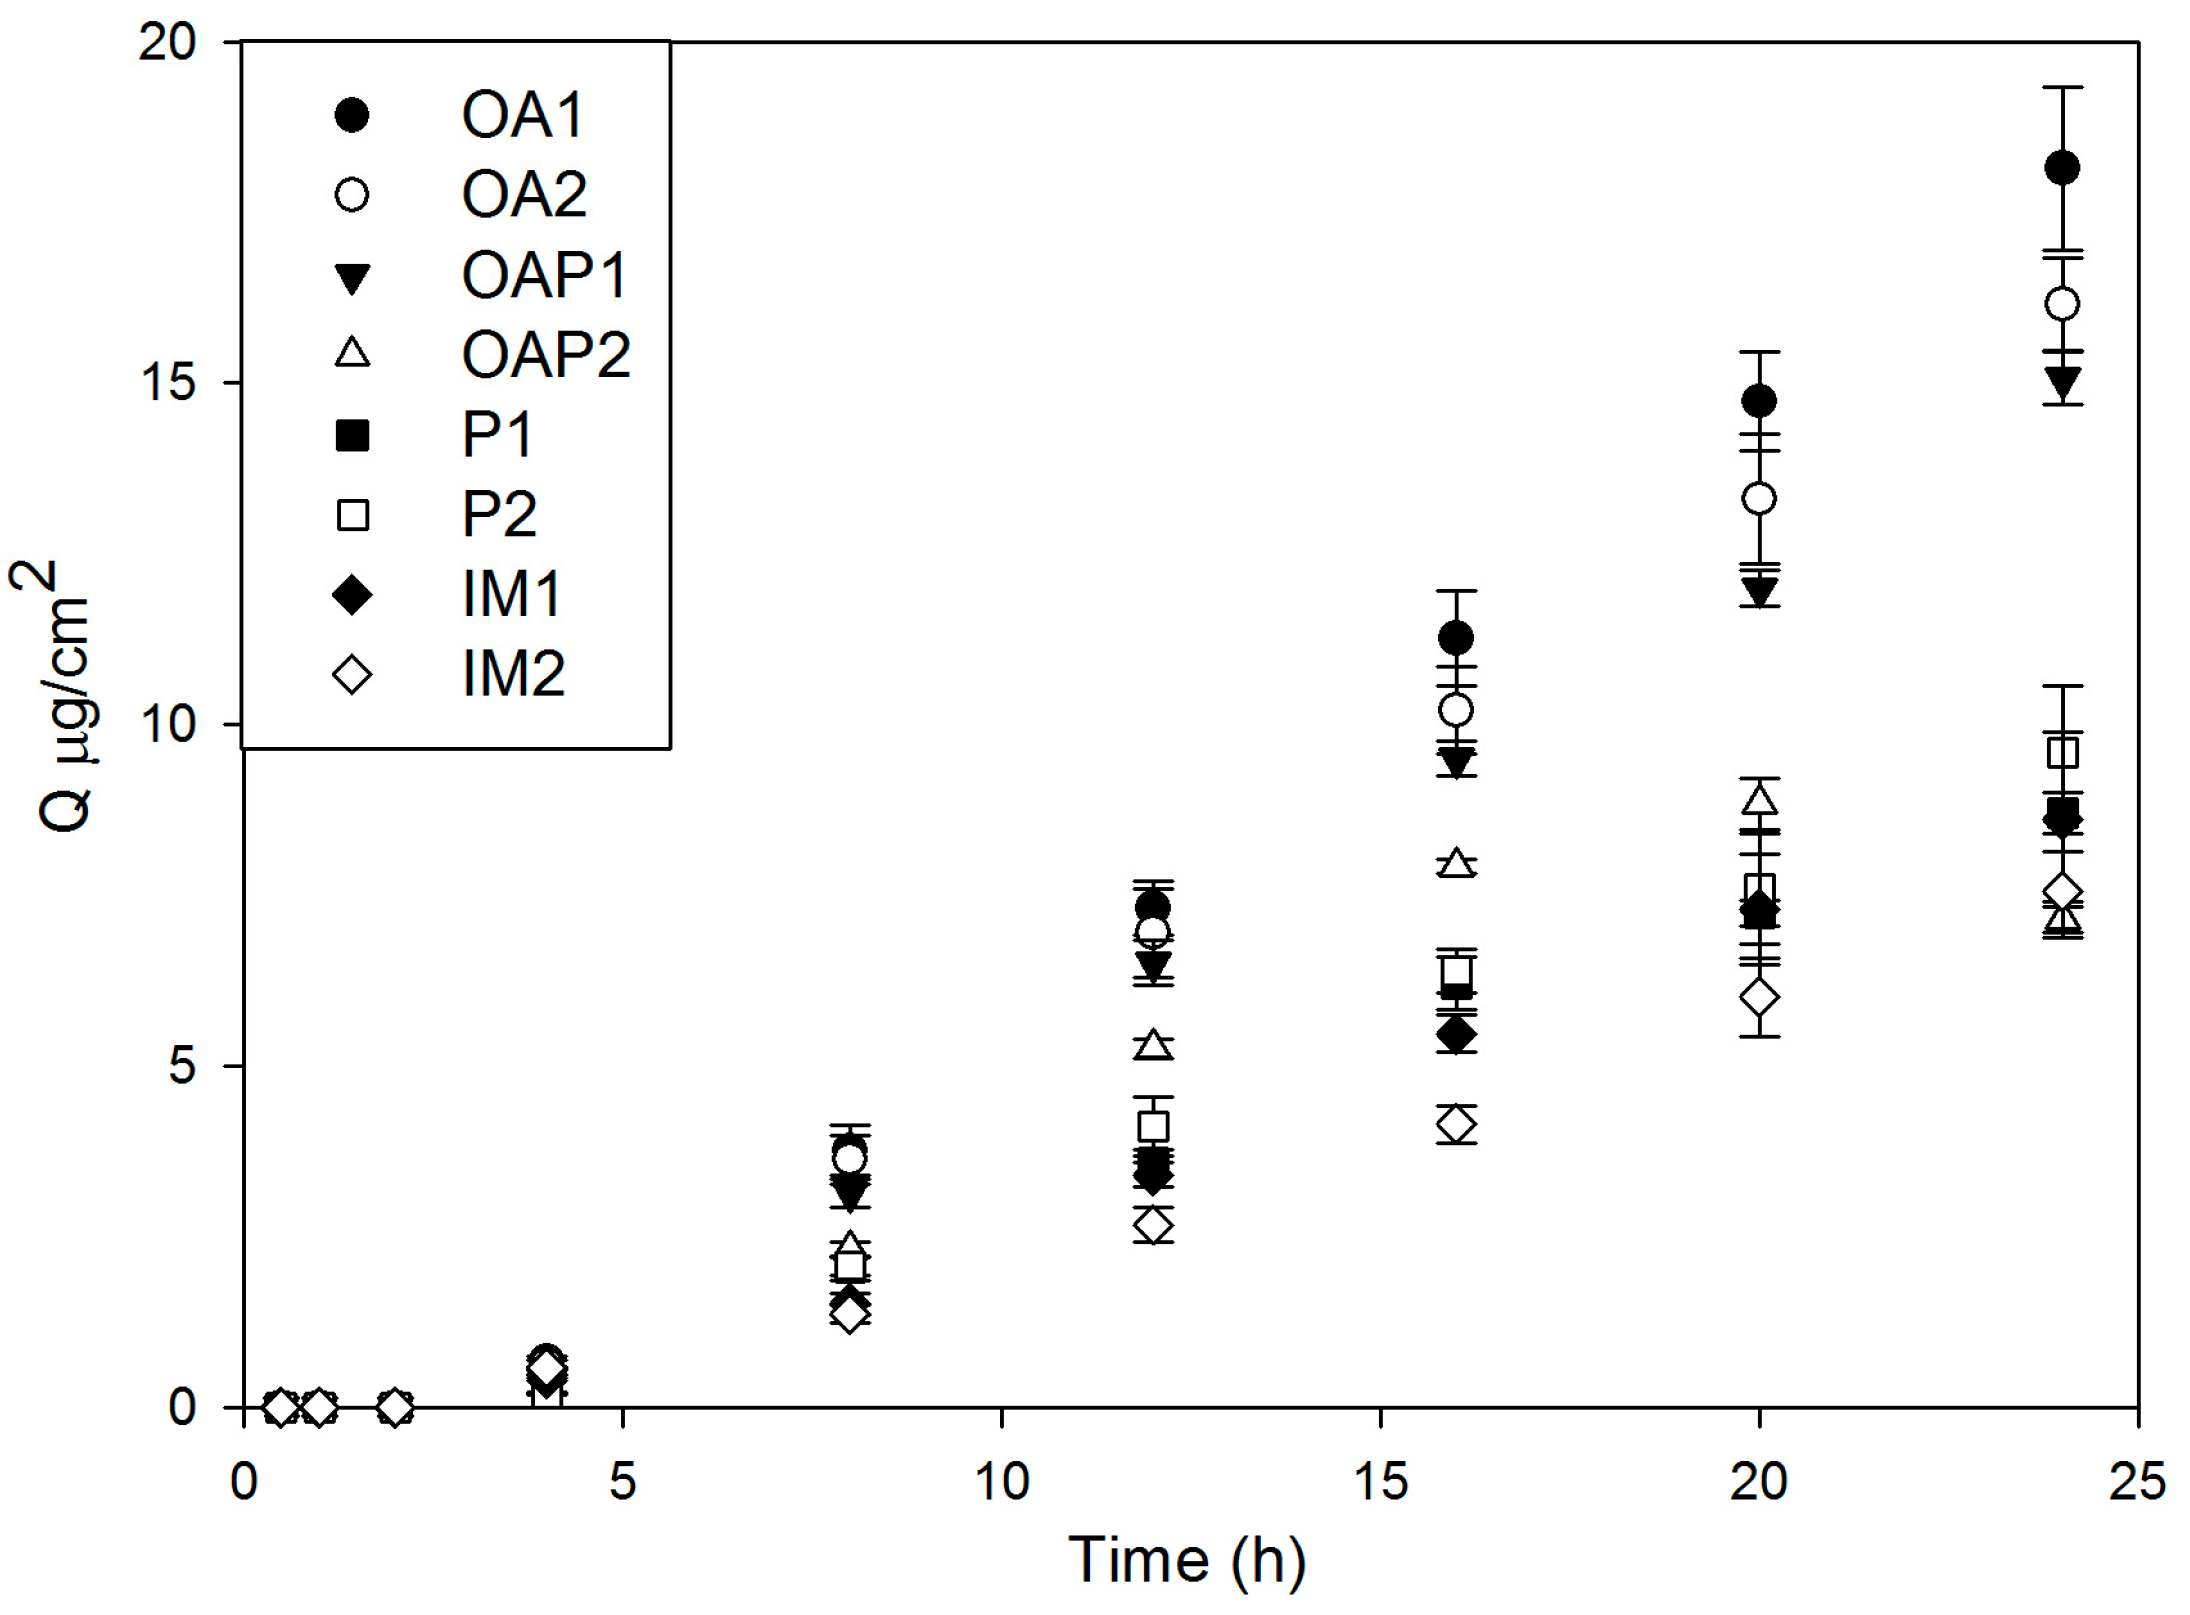
4.3. Drug Release Assay and Mathematical Modelling
The DXM released was expressed as μg/cm
2, which was plotted against time in
Figure 8. As demonstrated, the curve is convex to the time axis at the early stage and then becomes linear. This early stage is a non-steady state condition. Later, the rate of diffusion is constant, the curve is essentially linear, and the systems are at a steady state [
21].
The drug release profiles exhibited a lag time, which is a measure of the time it takes for the permeant concentration gradient to become stabilized across the membrane. It can be obtained by the intercept of the steady-state line [
21,
22]. The results of the calculated lag time formulations are in
Table 3. It takes approximately 3 h for all formulations to reach the steady state condition, which is a good indication of prolonged drug release.
Kinetic evaluations were performed by plotting the results as the mean cumulative amount of the drug against time.
Table 3 shows the adjusted coefficient of determination (R
2) resulting from the fitted curves using the drug release mathematical models described by Hixson-Crowell, Weibull, Higuchi, Baker-Lonsdale, Korsmeyer-Peppas, and Hopfenberg [
23]. The higher the R
2 is, the better the model can be applied to interpret the drug release profile.
Table 3 shows that the mathematical models that best fit the drug release curves are the Korsmeyer-Peppas and Weibull, as they resulted in R
2 > 0.99.
The Korsmeyer-Peppas model is represented by the Equation (2):
where
Mt/
M∞ is a fraction of the drug released over time,
t (h). The release exponent is represented by
n, and
K is the release rate constant. The
n exponent is characteristic of the release mechanism. Normal Fickian diffusion is characterized by
n = 0.5 and case II diffusion by
n = 1.0. A value of
n between 0.5 and 1.0 indicates a mixture of Fickian and case II diffusion, which is usually called non-Fickian, or anomalous diffusion. The values of all liquid crystalline samples were
n > 1, which means both erosion and diffusion may control the drug release [
23].
The Weibull equation expresses the accumulated fraction of the drug, m, in the solution at time, t, by:
In this equation, the scale parameter, a, defines the time scale of the process. The location parameter, Ti, represents the time lag before the onset of the dissolution or release process and in most cases will be zero. The shape parameter, b, characterizes the curve as exponential, sigmoid, S-shaped (with upward curvature followed by a turning point), or parabolic (with a higher initial slope and after that consistent with the exponential curve) [
23].
Table 3 shows the b values derived from the fitting of Equation (3) to the 60% drug release curve data. It can be observed that all samples presented b > 1, which is because of the sigmoid shape of the Weibull function and indicates that a complex mechanism governs the release process [
24]. The release rate initially increases nonlinearly up to the inflection point and after that increases linearly.
The analyses of both the Korsmeyer-Peppas and Weibull models indicate that the liquid crystals do not follow simple diffusion or erosion, and a combination of mechanisms is involved.
The liquid crystalline matrix is a two-phase system, with the oily and aqueous phases stabilized by the surfactant, forming regions with different dielectric constants, which interfere with drug diffusion and erosion of the matrix. Since PLM, SAXS, and rheology results showed the drug did not alter the structure of the systems in general, it was suggested that lipophilic DXM is solubilized and protected in the oily phase of the systems. The drug has to overcome the hydrophilic domains of liquid crystalline structures to be released, which may explain the lag time of drug release curves. The lamellar phases (OA and OAP samples) allowed a higher amount of drug release than the hexagonal phases (P and IM samples) because of their lower network crosslink. The mobility of the molecules may be lower in the hexagonal phases than the lamellar phases. On the contrary, both the lamellar and hexagonal phases prolonged the drug release.
These findings are correlated with other results from our group that determined the drug kinetics in liquid crystalline matrices composed of PPG-5-CETETH-20, OA, and water [
14,
25]. Carvalho et al. (2009) determined that the zidovudine kinetics in the lamellar phase decrease the drug release considerably when compared with a microemulsion made of the same components [
25]. The lamellar and cubic phases of those components also controlled and extended the delivery of fluconazole [
14]. The lamellar phases promoted the retention of fluconazole in the skin, while the cubic phases promoted transdermal transportation through the skin. It has been reported that the concentration of antifungal drugs attained in the skin is an important factor in the treatment of dermatomycosis and that the presence of the therapeutically active form in the skin is closely related to the efficacy of the drug [
14]. This study showed that it is possible to promote drug permeation or skin retention by changing only the composition of the components in the formulations. It is important to point out that both DXM and fluconazole are lipophilic and zidovudine is hydrophilic, showing the versatility of lyotropic liquid crystals in controlling the release of drugs with different solubilities.
These findings have led the way to consider CETETH-20-based lyotropic liquid crystals for skin delivery. Typically, transdermal systems do not have a lag time, since the drug may not be released over a significant time during use, and keeping track of the blood levels may be almost impossible [
22]. According to our results, the formulations presented an average of 3 h of lag time, which may discourage the transdermal application of these systems. On the contrary, it presents great potential for oral, mucosal, and wound healing applications and can be considered as a scaffold for osteogenic differentiation. The stiffness of liquid crystals may improve the mucoadhesion and fixation of formulations at the site of action. In this case, the prolonged release of the drug is desired for depot systems.
CETETH-20 systems can be considered promising drug delivery systems for DXM incorporation, because they can be developed in a gel-like form with different viscosities by varying the amount of each component. Moreover, the various ways presented individual control release profiles. This property is advantageous for designing new preparations for various routes of administration, such as oral and mucosal, since they also present bioadhesive properties.
Therefore, lyotropic liquid crystals composed of CETETH-20, OA, P, IM, and water are thermodynamically stable and form spontaneously. Such properties represent great appeal for scaling up since their low-cost production requires no specific equipment for preparation. In this way, this work represents a starting point for future development of formulations for controlled delivery systems for DXM.

 ,
, 


