1. Introduction
Sugarcane is an economically important crop in Louisiana [
1]. To increase profitability, sugarcane varieties are constantly being improved by the United States Department of Agriculture–Agricultural Research Service’s (USDA–ARS) Louisiana sugarcane variety development program, located in Houma, LA. Sugarcane variety development is costly, requiring approximately 12 years of testing to release a cultivar. Due to this, methods are constantly being evaluated to increase efficiency. An important part of this program is the selection of sugarcane seedlings, which requires the evaluation of 70–80 thousand seedlings over a short period of time by brief visual inspection, which requires significant time and labor. As these seedlings are individually un-replicated, selection is potentially biased due to spatial arrangement and microenvironments. Family selection, which involves the selection of seedling families instead of individuals, is based on data from replicated family plots. This procedure is more efficient because fewer poor performing individuals with low heritability traits are introduced into the program [
2], but family selection requires gathering data such as weighed plot yields from seedling plots. Family selection in sugarcane at the seedling stage is widely practiced around the world in places, such as Australia [
3,
4,
5,
6,
7] and the United States [
8,
9,
10,
11].
Spectral imaging has been used in several crop species, including sugarcane, to evaluate yield, nutritional status, and crop health [
12,
13,
14,
15,
16], and can be used to identify spectral traits linked to yield for selection [
17]. If the image is acquired aerially, this method also has the advantage of covering large areas easily. These spectral techniques could be used as a tool for evaluating sugarcane seedlings by identifying soil and environmental patterns that may affect selection, and, since spectral analysis can be linked to genetic yield traits, it may also be used for selection. This could give breeders another tool to examine yield parameters quickly without harvest data. Due to land and resource constraints, later ratoon crops (second and later) are not grown, and data are not measured in the Houma seedling stage. If we could predict second ratoon family performance and yield parameters from plant cane and first ratoon images, then the efficiency and speed of this breeding program could be increased.
Remote sensing utilizing specialized sensors has become an important component of crop monitoring and high throughput phenotyping [
18,
19]. Several indices have been developed that successfully utilize data from both multispectral and RBG imagery as a low-cost alternative to predict biomass [
19,
20]. The RBG image indices derived from models of Hue–Intensity–Saturation (HIS), International Commission on Illumination L*a*b* (CIELab), and L*u*v* (CIELuv) cylindrical coordinate representations of colors [
18,
21,
22,
23] have been useful in predicting crop yield and, in some cases, have been more accurate than multispectral methods [
22,
24,
25]. RGB indices have been correlated with the sugarcane biomass in other crops [
19,
20]; therefore, if similar results are obtained with sugarcane seedlings, then this procedure may be used to identify sugarcane seedlings with high biomass. The objective of this study was to (1) determine if remote sensing imagery acquired by UAS could accurately and efficiently evaluate the seedling family performance of cane yield in Houma and (2) determine if second ratoon cane yield could be estimated from plant cane and first ratoon images. To the author’s knowledge this is the first use of RGB remote imagery to estimate yield for seedling selection in Louisiana.
2. Materials and Methods
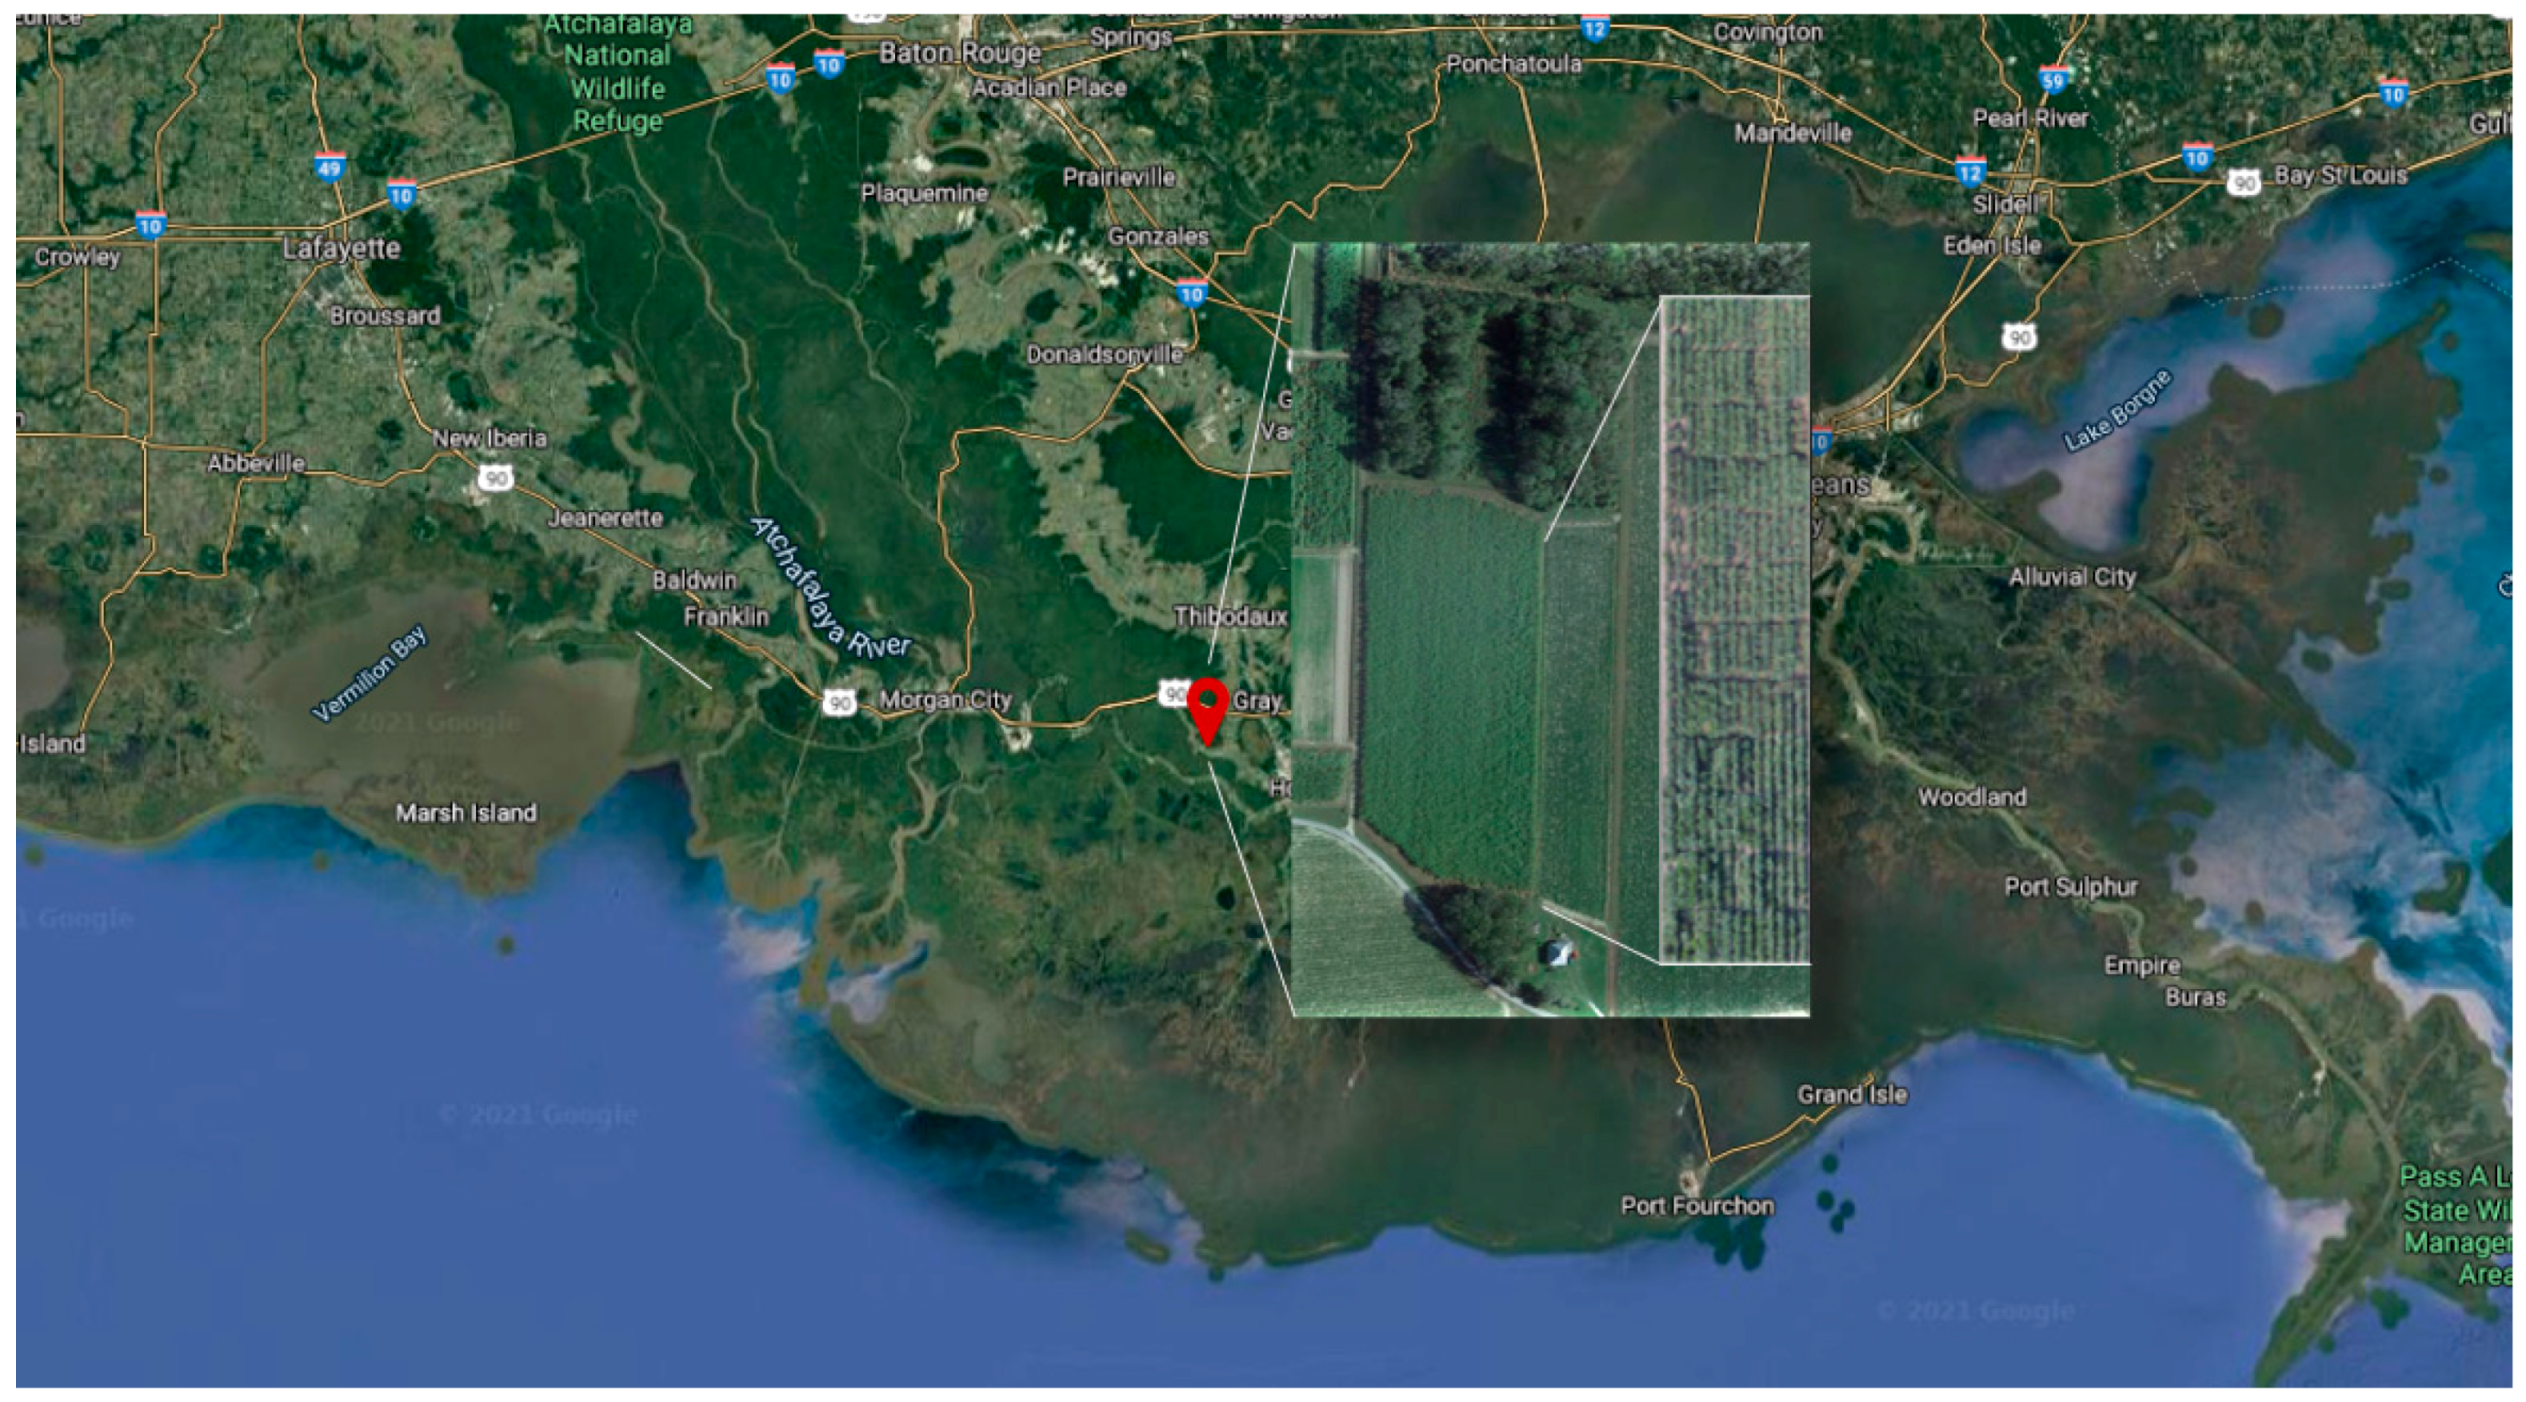
Experiments were conducted on land near Houma, LA (29°38′33.2″ N 90°51′34.5″ W) (
Figure 1). This area is classified as humid subtropical with a Köppen classification of Cfa. The soil at this site is classified as a Cancienne silt loam (fine-silty, mixed, superactive, nonacid, hyperthermic Fluvaquentic Epiaquepts). This land has been used to grow sugarcane for more than 50 years. Seedlings from 23 diverse crosses (families) including 26 unique parents and the check cultivar HoCP 96-540 [
26] were selected and planted in a randomized complete block design with three replications (
Table 1). This procedure is similar to test plots used to evaluate seedling performance at the Louisiana State University sugarcane breeding program [
27]. Each family had two rows spaced 1.8 m apart in raised beds planted, with 19 plants, each spaced 40 cm apart, with each family spaced 1.2 m apart. Fields were fertilized and kept weed free using the standard herbicide and cultivation methods of the area [
28]. Red–Green–Blue (RGB) images were taken with a Phantom 4 drone equipped with a 1/2.3″ CMOS 12.5 MP camera (SZ DJI Technology Co., Ltd., Nanshan, China) in plant cane at a distance of 91.4 m (3.52 cm/px) on 2 September 2016, and first and second ratoon at 45.7 m (1.76 cm/px) on 25 September 2017 and 2 July 2018, respectively.
Cane was harvested in 2016 and 2018 using a chopper harvester and plot weights were taken utilizing a single-axle, high-dump wagon equipped with electronic load cells [
29]. Each family plot had two rows per replication and each row was weighed separately. The data were analyzed using a mixed model in SAS Proc Mixed [
30], where plot weight was considered the dependent variable, and family, year harvested, and their interaction as fixed effects. Replication and row harvested were treated as random effects. Significant differences between families within each year were estimated by calculating significant differences between means (
Table 1).
The Breedpix program [
31] measures various color indices using the CIELab color space model [
32], from low cost RGB (red–green–blue) remote sensing imagery that can be used to correlate and predict various yield and agronomic traits such as biomass. The indices utilized in this study included the green area (GA), which is the proportion of green pixels in an image [
31]. The greener area (GGA) excludes yellow pixels that correlate with senescent leaves [
31]. These indices generally correlate to green biomass and are used to calculate the Crop Senescence Index (CSI), which is the scaled ratio between yellow and green vegetation pixels calculated using the following formula: CSI = (GA − GGA)/GA∗100 [
21]. This index is correlated with leaf senescence. The Normalized Green–Red Difference Index (NGRDI) [
33] and the Triangular Greenness Index (TGI) [
34], with their standard deviations, were also calculated using the Breedpix program to evaluate their usefulness in predicting yield. The NGRDI was developed to estimate the vegetation fraction, or the area covered with vegetation. The TGI is affected only by the chlorophyll content in the leaves and can be used to estimate N requirements. NGRDI is calculated as follows:
TGI is calculated as follows:
where Rg and Rr represent the reflectances of green and red bands, respectively, and λr, λb, and λg represent the center wavelengths for the red, blue, and green bands, respectively.
Other more general CIELab values calculated include lightness, which represents the range from black to white with pure black having a value of zero and pure white having a value of ten [
35]. The range from green to red is represented by the a* index, and the range from blue to yellow is represented by the b* index. The v* component is the scale from blue to green. The u* index is the scale from blue to red [
19,
32]. Hue is a description of color in the form of hue angles in the a*b* plane of the CIELab color space and vary from 0 to 360°, where 0° is red, 60° is yellow, 120° is green, and 180° is cyan [
19].
Plots in the acquired imagery were manually identified and cropped individually into 72 × 408 pixel segments using the GIMP image editor [
36]. These images were run through the Breedpix Maize scanner program [
31] in ImageJ [
37]. The means for each variable were calculated. Raw data were run through SAS [
30] using the Meta Macro [
38]. This was used to calculate heritability, defined as the proportion of the phenotypic or trait variability that is due to genetic causes [
39], and the trait phenotypic correlations between years. The arithmetic means by family of these variables were then entered into PAST (PAleontological STatistics) software [
40] for Pearson correlations. SAS Proc GLMSELECT [
30] was used to identify the best multiple regression model for plant weight estimation using stepwise regression with Schwartz’s Bayesian Criterion (SBC) selection and an adjusted R
2 as a stopping criterion. For plant cane and first ratoon models, the number of selected variables were manually modified to add spectral variables that contributed the most to the regression model and drop variables with high cross correlation and a Variance Inflation Factor (VIF) greater than ten that were estimated using Proc Reg [
30]. A VIF greater than 10 is an indicator that multicollinearity is high [
30].


