Article

Hybrid Bermudagrass and Tall Fescue Turfgrass Irrigation in Central California: I. Assessment of Visual Quality, Soil Moisture and Performance of an ET-Based Smart Controller

1
Environmental Sciences Department, University of California Riverside, Riverside, CA 92521, USA
2
University of California Division of Agriculture and Natural Resources, Cooperative Extension, Fresno, CA 93710, USA
3
Department of Horticultural Science, University of Minnesota, MN 55108, USA
*
Author to whom correspondence should be addressed.
Agronomy 2021, 11(8), 1666; https://doi.org/10.3390/agronomy11081666
Submission received: 10 August 2021 / Revised: 16 August 2021 / Accepted: 19 August 2021 / Published: 21 August 2021
(This article belongs to the Special Issue Agricultural Water Conservation: Tools, Strategies, and Practices)

Abstract

:
Research-based information regarding the accuracy and reliability of smart irrigation controllers for autonomous landscape irrigation water conservation is limited in central California. A two-year irrigation research trial (2018–2019) was conducted in Parlier, California, to study the response of hybrid bermudagrass and tall fescue to varying irrigation scenarios (irrigation levels and irrigation frequency) autonomously applied using a Weathermatic ET-based smart controller. The response of turfgrass species to the irrigation treatments was visually assessed and rated. In addition, turfgrass water response functions (TWRFs) were developed to estimate the impact of irrigation scenarios on the turfgrass species based on long-term mean reference evapotranspiration (ETo) data. The Weathermatic controller overestimated ETo between 5% and 7% in 2018 and between 5% and 8% in 2019 compared with California Irrigation Management Information System values. The controller closely followed programmed watering-days restrictions across treatments in 2018 and 2019 and adjusted the watering-days based on ETo demand when no restriction was applied. The low half distribution uniformity and precipitation rate of the irrigation system were 0.78 and 28 mm h−1, respectively. The catch-cans method substantially underestimated the precipitation rate of the irrigation system and caused over-irrigation by the smart controller. No water-saving and turfgrass quality improvement was observed owing to restricting irrigation frequency (watering days). For the hybrid bermudagrass, the visual rating (VR) for 101% ETo treatment stayed above the minimum acceptable value of six during the trial. For tall fescue, the 108% ETo level with 3 d wk−1 frequency kept the VR values in the acceptable range in 2018 except for a short period in mid-trial. The TWRF provided a good fit to experimental data with r values of 0.79 and 0.75 for tall fescue and hybrid bermudagrass, respectively. The estimated VR values by TWRF suggested 70–80% ETo as the minimum irrigation application to maintain the acceptable hybrid bermudagrass quality in central California during the high water demand months (i.e., May to August) based on long-term mean ETo data. The TWRF estimations suggest that 100% ETo would be sufficient to maintain the tall fescue quality for only 55 days. This might be an overestimation impacted by the relatively small tall fescue VR data in 2019 owing to minimal fertilizer applications and should be further investigated in the future.

1. Introduction

The state of California, and in general the U.S. west, has some of the largest cities across the nation, making urban water demand a vital component of any integrated water resources management plan. Statistics indicate California’s population rose to nearly 40 million in 2016 and projections by the California Department of Finance show an increase to more than 45 million by 2060 [1]. It is expected that, in the future, competition for water and land resources among urban, environmental, and agricultural uses will intensify as a result of increased population, coupled with changes in land use and climate [2]. In addition, climate change is altering precipitation and temperature patterns, making drought severity likely to increase in the American Southwest [3].
Irrigation demand is a significant component of total water use in the urban sector in California [4]; therefore, improving irrigation water use efficiency is a crucial water conservation strategy. Considerable water savings have been reported as a result of implementing emerging technologies for landscape irrigation management [5,6,7]. Soil moisture sensor-based and evapotranspiration (ET)-based smart irrigation controllers can help increase irrigation water use efficiency by maintaining the root zone soil moisture status within a programmed desired range and scheduling irrigation based on crop coefficient and reference ET (ETo) data, respectively.
Water agencies in California often incentivize the adoption of smart irrigation controllers in residential areas. According to Singh et al. [8], in 2018–2019, approximately half of the major water agencies across the state provided rebates, ranging from $45 to $300, for installing ET-based smart irrigation controllers. However, the scientific research on the efficacy of smart irrigation controllers for autonomous irrigation scheduling and water conservation is limited in the region. Most scientific work on smart irrigation controllers has focused on avoiding over-irrigation in humid areas with abundant precipitation [9]. Davis et al. [6] compared ET-based smart controllers with a time-based treatment in Florida and reported, on average, a 43% reduction in applied water. Compared with timer-based fixed irrigation, the water-saving potential of ET-based controllers was also reported in other case studies in Florida and Nevada [10,11]. Recently, we [7] used an ET-based smart irrigation controller for autonomous irrigation scheduling of ‘Tifgreen’ hybrid bermudagrass in southern California and obtained promising results. In another study conducted in Southern California, Bijoor et al. [12] investigated the water budgets of lawns under three management scenarios, including the use of a smart soil moisture sensor-based controller. They concluded that the implementation of smart sensors was a more significant option than the choice of turfgrass species in irrigation efficiency.
An urban feature for potential water conservation is the turfgrass landscape, as it is a large component of urbanized land area. Turf has become an important crop based on the acreage planted, including residential, commercial, and institutional lawns, parks, golf courses, and athletic fields. Beyond recreational use, turf provides valuable ecosystem services that are in high demand by society, like capturing runoff, contributing to the abatement of the heat island, reducing dust and noise, and fostering biodiversity [13]. However, the turfgrass irrigation water requirement could be more significant than some alternative landscape species [14]. Consequently, it is crucial to precisely identify the minimum water requirement of commonly planted turfgrass species and study the water use of alternative warm-season turfgrass species that are more resistant to heat, drought, and salinity.
In a recently published study [7], we introduced the turfgrass water response function (TWRF) as an empirical statistical model to estimate the response of turfgrass species (based on the aesthetic values) to varying irrigation scenarios and ETo demand. We used NDVI as the response variable owing to its overall high correlation to turfgrass health and growth. We estimated the response of hybrid bermudagrass to varying irrigation and water conservation scenarios in inland Southern California using long-term ETo data.
This study was carried out to (i) determine the response of hybrid bermudagrass and tall fescue to varying irrigation scenarios (level and frequency) in central California, (ii) evaluate the use of an ET-based smart irrigation controller for autonomous irrigation scheduling, (iii) monitor and assess the dynamics of near-surface soil moisture over time under the imposed irrigation scenarios, and (iv) develop regression-based TWRFs and use them to estimate the response of turfgrass species to irrigation scenarios based on long term mean ETo demand in the study region. Part two of this study focuses on applying ground-based remote sensing for turfgrass irrigation management [15].

2. Materials and Methods

2.1. Study Area

A two-year turfgrass irrigation research project (2018–2019) was conducted at the University of California Agricultural and Natural Resources Kearney Research and Extension Center (36°36′02.2″ N 119°30′38.8″ W) in Parlier, California. Figure 1 depicts the long-term mean (1983–2021) ETo and precipitation data for the study site obtained from a nearby California Irrigation Management Information System (CIMIS) weather station (station number 39). The long-term mean annual ETo and precipitation for the region were 1367 and 273 mm yr−1, respectively. ETo demand exceeds the natural precipitation, indicating the need to irrigate urban landscape species, particularly over the summer. The long-term data show that peak ETo of 7 mm per day occurred in early July (Figure 1). The annual precipitation was 192 mm and ETo was 1452 mm in 2018. The annual precipitation was 268 mm and ETo was 1462 mm in 2019.
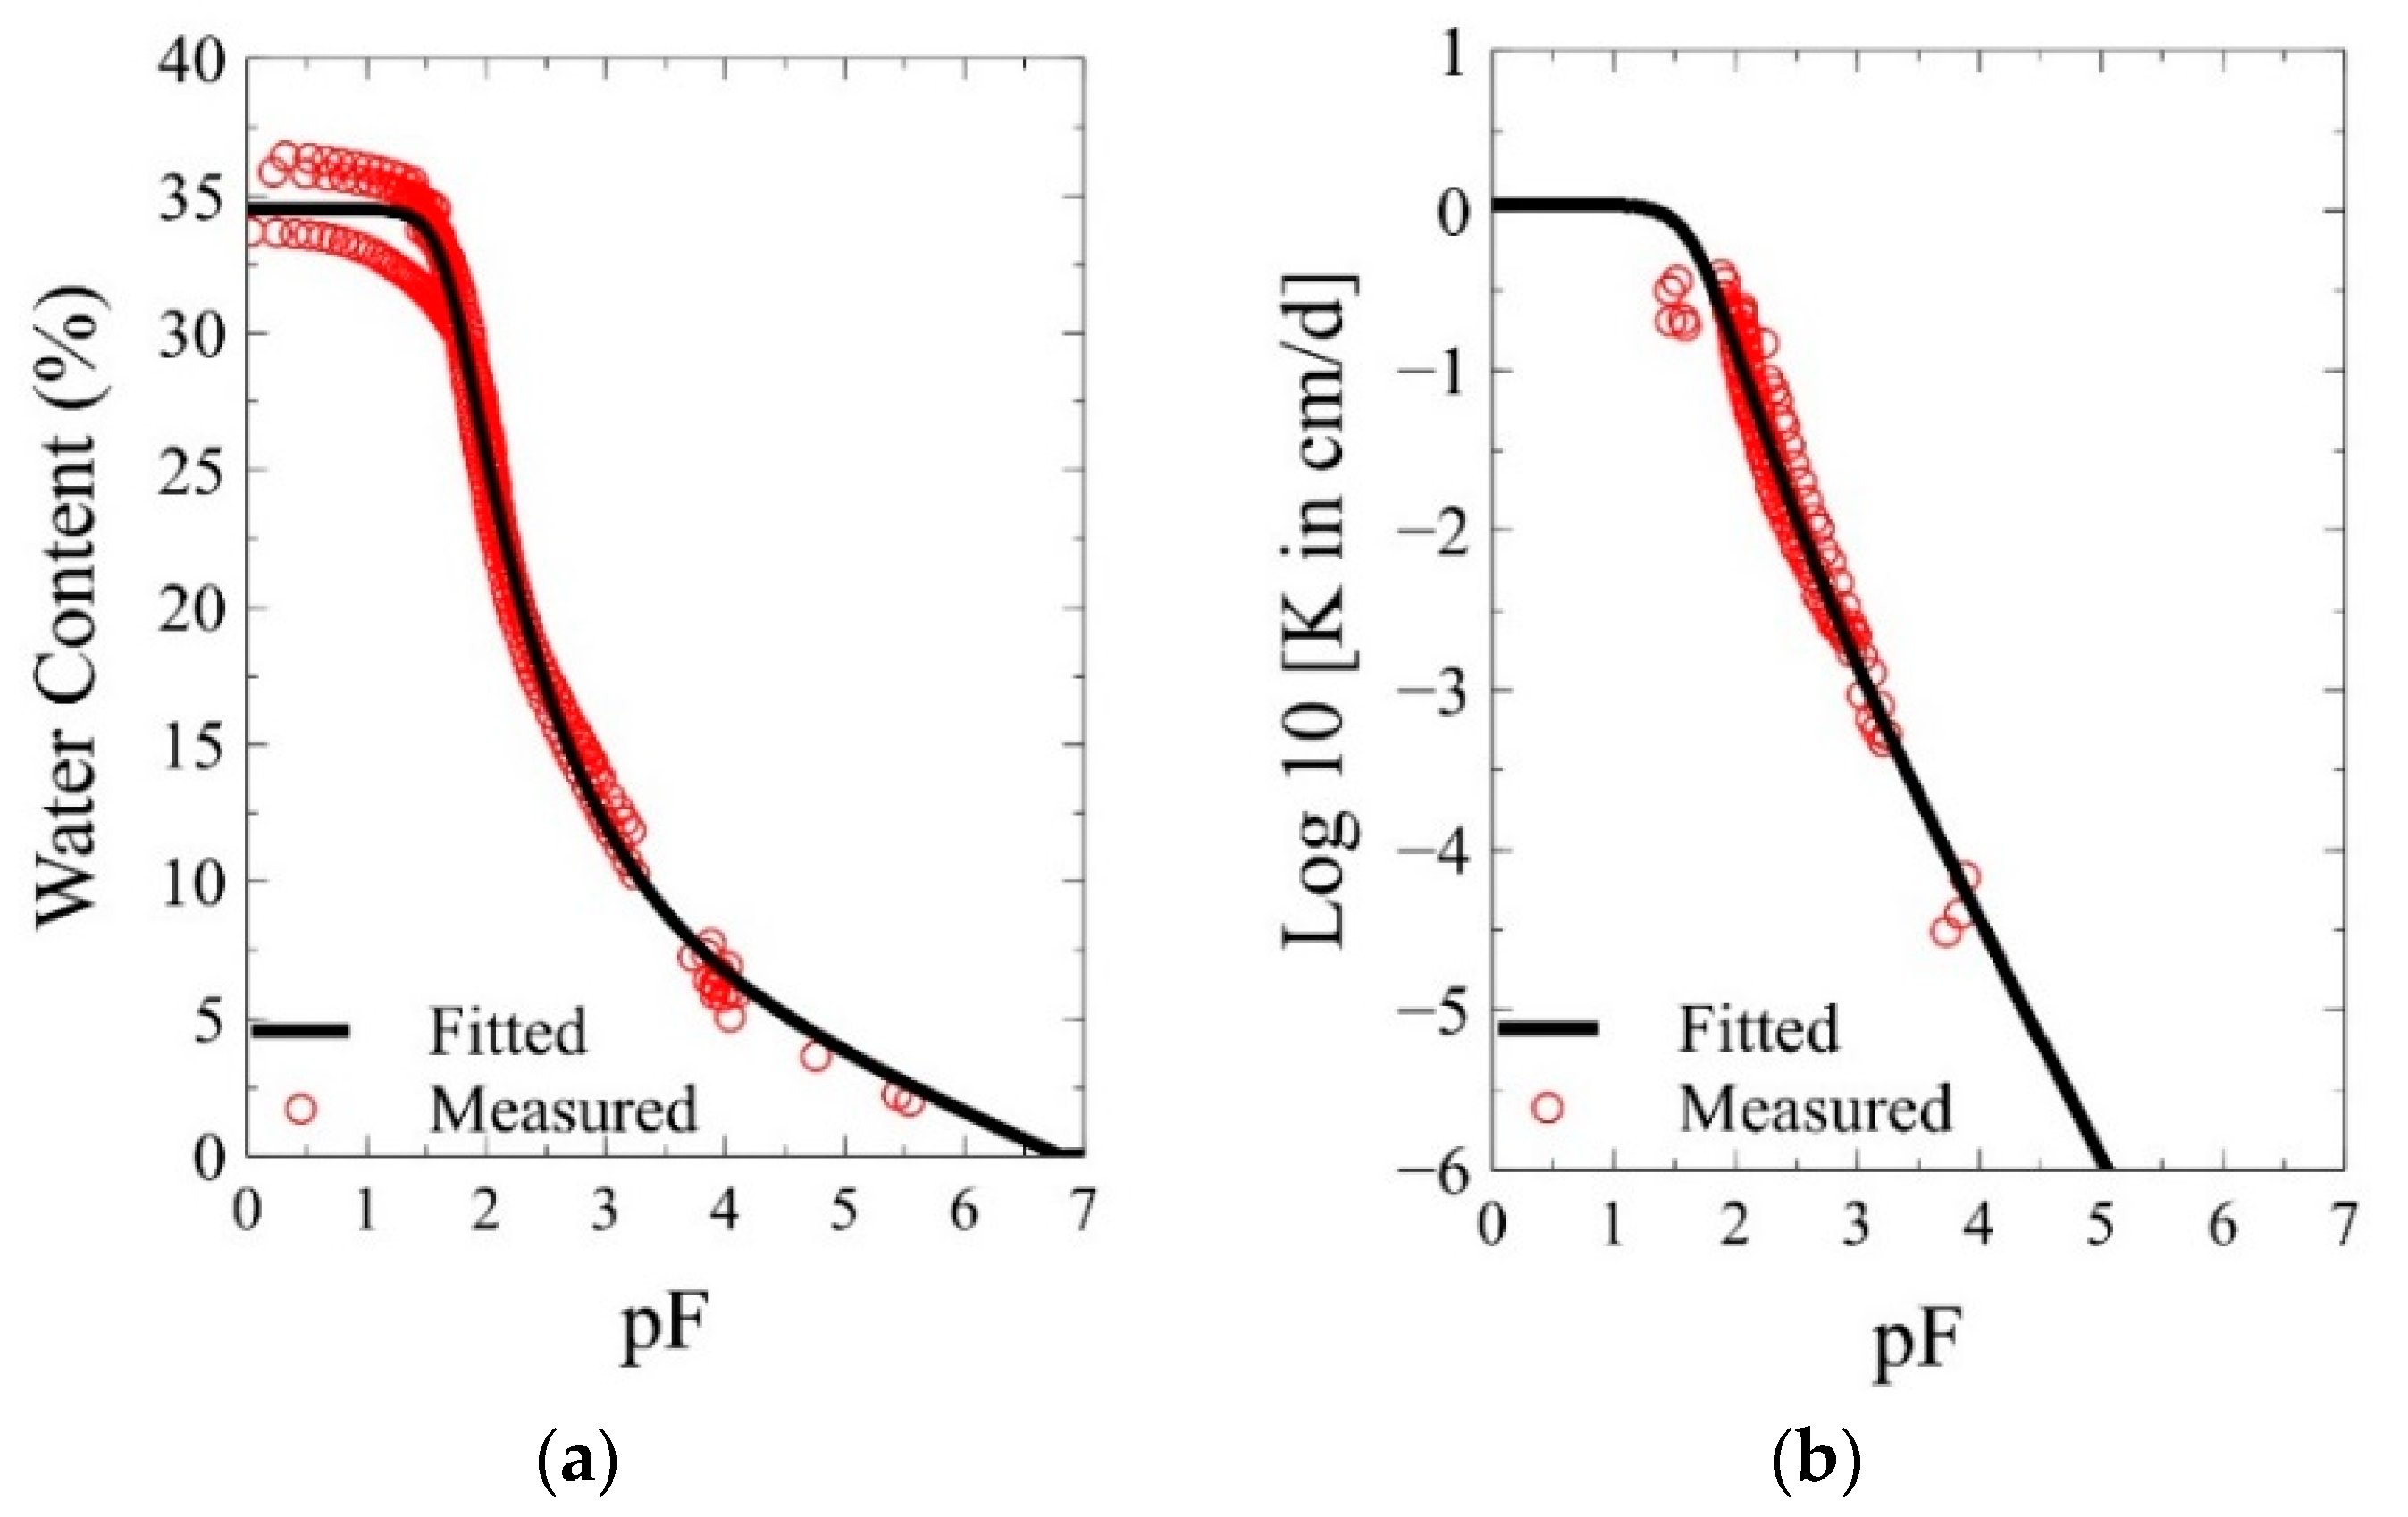
The soil at the research site is classified as Hanford fine sandy loam (websoilsurvey.sc.egov.usda.gov; accessed on 18 August 2021). Figure 2 shows the laboratory-determined soil water retention and hydraulic conductivity curves for the experimental site. Four undisturbed soil samples were taken from approximately the top 20 cm layer at the beginning of the trial. The samples were analyzed to determine the soil water retention and hydraulic conductivity curves using HYPROP and WP4C laboratory instruments [16]. The soil water retention (based on the composite data) at soil tensions of 10, 33, and 1500 kPa was 0.25 m3 m−3, 0.17 m3 m−3, and 0.06 m3 m−3, respectively. The saturated hydraulic conductivity was 11 mm day−1.

2.2. Irrigation Trials

The responses of hybrid bermudagrass [‘Latitude 36’ Cynodon dactylon (L.) Pers. × C. transvaalensis Burtt-Davy] and tall fescue [a blend of ‘PennRK4’, ‘Rebel XLR’, + ‘Firecracker SLS’ Schedonorus arundinaceus (Schreb.) Dumort.] to six irrigation treatments (3 irrigation levels × 2 irrigation frequency restrictions) were studied. A total of 36 plots (3.7 m × 3.7 m) formed two adjacent trials organized in a factorial randomized complete block design with repeated measures over time. Table 1 summarizes the irrigation treatments. The irrigation system was installed and the plots were prepared in early 2017. The turfgrass plots were established with sod in late July 2017. For several months afterward, the plots were under non-limiting irrigation for root development and grass establishment. A uniformity test was conducted using catch-can devices on 5 August 2017 with wind speed less than 0.9 m s−1 on eight randomly selected plots. The low half distribution uniformity (DUlh) was 0.78 and the estimated precipitation rate was 23 mm h−1.
The target ETo levels varied from 40 to 80%. Considering DUlh equal to 0.78 as the irrigation efficiency, the programmed irrigation levels (i.e., target ETo levels divided by irrigation efficiency) ranged from 51% to 103%. The watering days were restricted to two (Sunday, Thursday) and three (Monday, Wednesday, and Saturday) days per week in 2018. In 2019, the watering days were changed to 3 (Sunday, Wednesday, and Friday) and 7 days per week. The 7-day treatment represented a no watering restriction scenario when the smart controller could irrigate as needed based on ETo demand. To avoid light irrigation applications, the controller was programmed to use the default deficit threshold of approximately 4 mm as the lower deficit limit before any irrigation occurs.
The standard cultural practices were followed to maintain the plots throughout the study, including mowing the plots once a week (mowing heights for tall fescue and hybrid bermudagrass were set to 76 mm and 44 mm, respectively), applying fertilizer two times per year in spring and fall for tall fescue and once a year in the early summer for bermudagrass at a typical rate of 49 kg ha−1 nitrogen each application, and spraying the borders as needed with herbicides to control the weeds. The study was started on 4 May and data collection ended on 11 September in 2018. All plots were switched back to the uniform non-limiting irrigation for recovery before starting the second year of the experiment on 22 June 2019. On 26 August 2019, the main irrigation pipe broke and flooded the field, forcing the research team to terminate the trial.
A Weathermatic Smartline (SL) 4800 controller (Telsco Industries, Inc., Garland, TX, USA) was used to autonomously schedule irrigation. A Weathermatic SLFSI-T10 flow sensor (Telsco Industries, Inc., Garland, TX, USA) was installed and connected to the controller in 2019 to monitor the flow across treatments and detect leaks automatically. The controller used an onsite temperature sensor and latitude-based solar radiation information to calculate ETo using the Hargreaves and Samani equation [17]. The controller used the user-defined “plant type” values and irrigation precipitation rate to calculate irrigation application for each treatment as fractions of ETo and convert it to equivalent run times. The plant type for each treatment was calculated as the target ETo level divided by the efficiency of the irrigation system.
Irrigation was done overnight and early morning to avoid evaporative loss and minimize wind drift. The smart controller performed a run/soak schedule to eliminate runoff and provide enough soak time. All three replications for each treatment were wired to the same zone on the controller to receive irrigation at the same time. Each plot was equipped with a TORO 252 Series solenoid valve (Toro Co., Bloomington, MN, USA). The solenoid valve supplied water to four Toro O-T-12-QP corner-pop-up 6” sprinkler heads (152 mm tall) with an operating pressure range and flow rate of 276–517 kPa and 0.02–9.08 l min−1, respectively. The sprinklers had factory-installed, pressure-compensating discs to ensure steady water application (Toro Co., Bloomington, MN, USA).

2.3. Data Collection and Statistical Analysis

The National Turfgrass Evaluation Program (NTEP) standard [18] was used as the guideline to visually assess and rate the turfgrass plots. The NTEP standard ranges from 1 to 9 representing dead and ideal turfgrass, respectively. The visual rating (VR) of six in this study was considered the minimum acceptable quality for residential areas. The visual assessment was done continuously approximately once a week during the trial for a total of 19 times in 2018 and 9 times in 2019. Visual ratings were taken from digital images of each plot. Figure 1 shows the enclosed lightbox used to collect digital images for visual rating. There were borders between the adjacent plots approximately 60 cm wide to avoid interference between them. The data were collected from the center of each plot to eliminate the plot edge effect. A total of 15 soil moisture readings were collected per treatment (5 readings per plot × 3 replications) from the top 12 cm soil layer using a handheld FieldScout TDR 300 Meter (Spectrum Technologies, Inc., Aurora, IL, USA).
The VR and soil moisture data were statistically analyzed using PROC GLIMMIX in SAS 9.4 software package [19]. Each year and species were independently analyzed for the treatment effects as the frequency restrictions and duration of the experiment differed across the years and species. For all the response variables, the fixed effects were the irrigation levels, irrigation frequencies, and the date of data collection. The random effects were block and its interaction with irrigation levels and irrigation frequencies. The treatment effects were considered significant at p-values ≤ 0.05. All graphs were created using the plotting software package Veusz 3.3.1 [20].
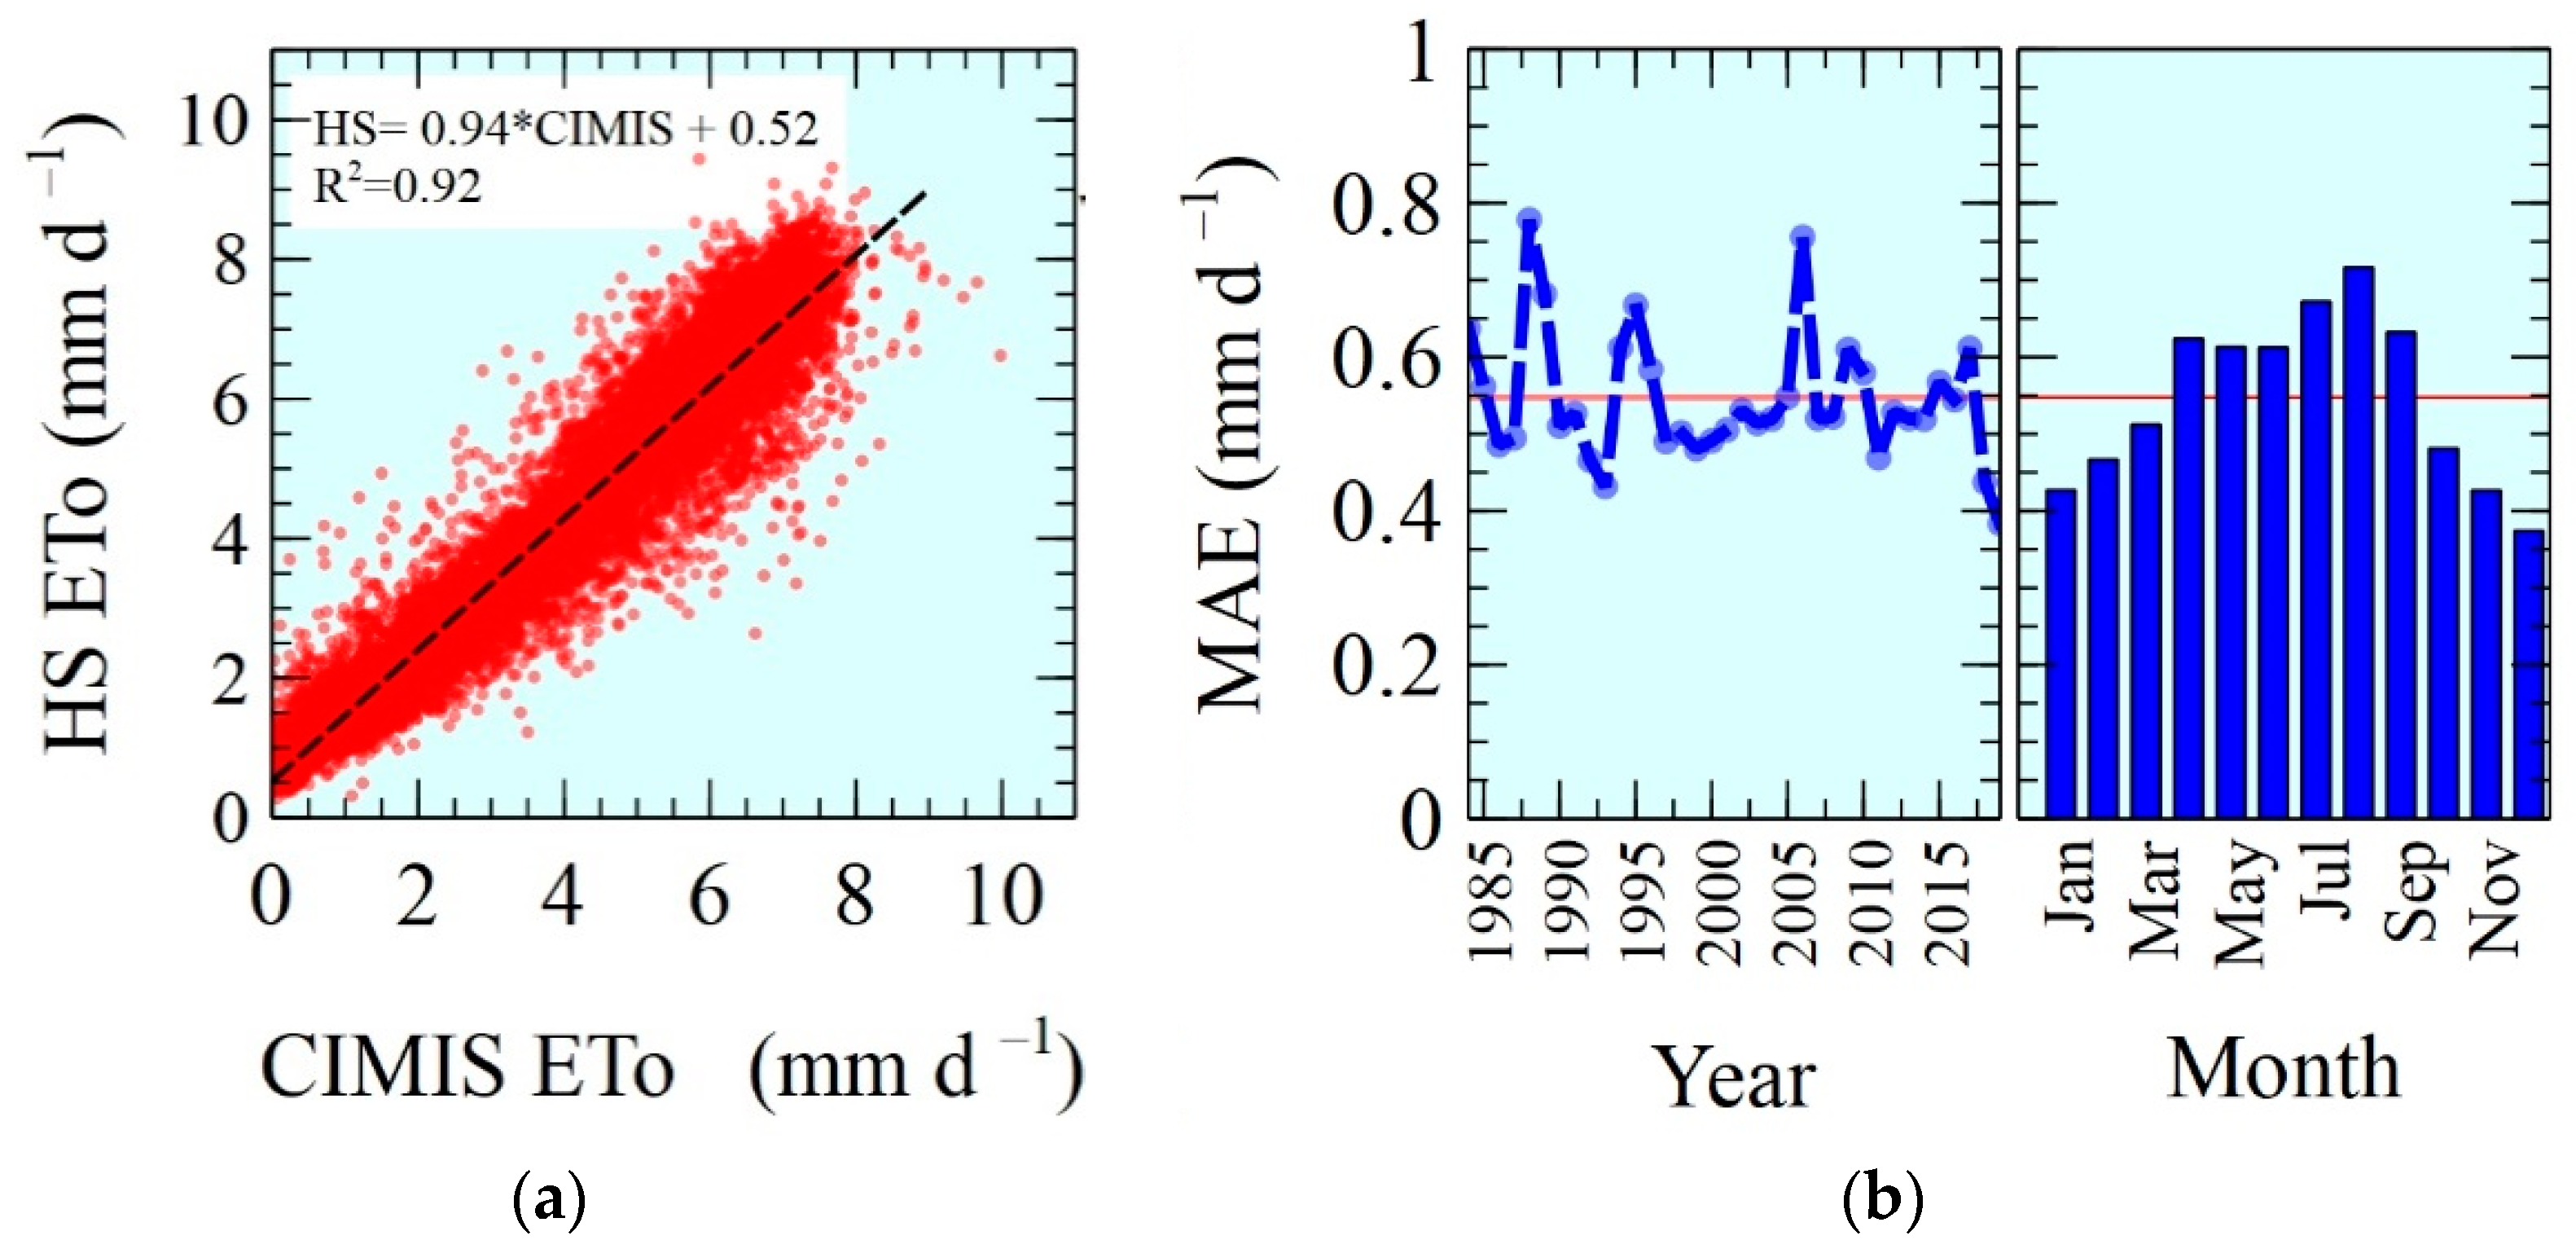
The daily ETo data were collected from CIMIS station #39, located approximately 170 m away from the experimental site in an adjacent field. The CIMIS ETo data were compared to the estimated ETo data by the smart controller. In addition, the Hargreaves and Samani equation [17] was used to calculate long-term daily ETo for the study site (via the PyETo software package: https://pyeto.readthedocs.io/en/latest/license.html; accessed on 18 August 2021) and compared against CIMIS ETo.
E T o = 0.0023 R a ( T + 17.8 ) T R
where Ra is the extraterrestrial radiation (mm day−1), TR is the difference between the daily maximum and minimum air temperatures (°C), and T is the mean air temperature (°C).

2.4. Turfgrass Water Response Function (TWRF)

A multiple linear regression model (with interactions and quadratic terms included) was used to develop TWRFs for hybrid bermudagrass and tall fescue species. The data for both years were combined. The primary input variables were the applied irrigation levels (%ETo), irrigation frequency restrictions, and cumulative ETo (since the beginning of the experiment for each particular year). The mean VR values for treatments were used as the output variable. The SAS 9.4 software (SAS Institute Inc., Cary, NC, USA) was used to develop and rank all possible regression equations based on correlation coefficients (with 0.7 as the minimum acceptable value). Multiple regression diagnostics, including the Shapiro–Wilk W statistic (to check the normality of the residuals), the condition index (to monitor the collinearity between the variables), and the first and second moment specification test (to check the equal residual variance) were used to finalize the list of input variables of the top model. The long-term mean daily ETo values were obtained from the CIMIS station #39 and used to estimate the response of tall fescue and hybrid bermudagrass to varying ET-based irrigation scenarios (60–100% ETo). The simulation was done for four months, from May to August, using the TWRFs.
The root mean square error (RMSE), mean absolute error (MAE), mean bias error (MBE), and correlation coefficient (r) were calculated to evaluate the TWRFs.
R M S E = 1 n i = 1 n ( E i M i ) 2
M A E = i = 1 n | E i M i | n
M B E = i = 1 n ( E i M i ) n
r = i = 1 n ( E i E ¯ ) ( M i M ¯ ) i = 1 n ( E i E ¯ ) 2 i = 1 n ( M i M ¯ ) 2
where E and M are estimated and measured visual rating values, respectively. M ¯ and E ¯ are the mean-measured and the mean-estimated visual rating values, respectively, and n is the total number of measured data points for the entire experiment (n = 162 for each species).

3. Results

3.1. Performance of the Smart ET-Based Controller

The Weathermatic controller overestimated ETo by 5–7% in 2018 and by 5–8% in 2019 compared with CIMIS ETo values. On average, across all treatments, MAE was 2.8 mm day −1 (4% ETo) and 2.9 mm day −1 (5% ETo) in 2018 and 2019, respectively. We ran a flow test at the end of the trial, which revealed that the actual precipitation rate of the irrigation system was 28 mm h−1, 21% higher than the 23 mm h−1 precipitation rate initially estimated using the catch-cans. Consequently, the applied irrigation was recalculated using the irrigation run time data recorded by the controller for the duration of the experiment, as listed in Table 2. The adjusted irrigation levels varied between 83% and 129% of ETo for the tall fescue plots and between 65% and 101% of ETo for the hybrid bermudagrass treatments.
The controller closely followed programmed watering days restrictions across treatments in 2018 and 2019. For the 7 d wk−1 treatment (no frequency restriction scenario) in 2019, the controller adjusted the actual irrigation days based on the evaporative demand and minimum allowed water deficit. For example, on average, plots were irrigated five days per week for 65% ETo irrigation treatment with no frequency restriction.
Figure 3 depicts the performance of the Hargreaves and Samani equation [17] against CIMIS ETo based on the long-term data (1983–2019) obtained from the CIMIS station #39. Overall, there was a strong agreement between the ETo values obtained using the Hargreaves and Samani [17] and CIMIS methods, as depicted by high correlation (r = 0.96) and well-scattered data points around the identity line (1:1). The MAE between Hargreaves and Samani and CIMIS ETo varied between 0 and 3.98 mm day−1 with an average value of 0.55 mm day−1. The mean annual MAE values fluctuated over the years between 0.4 mm day−1 and 0.8 mm day−1. The MAE values were relatively higher in peak ETo months (i.e., May to September) than during the rest of the year.

3.2. Impact of Irrigation Levels and Frequency on Turfgrass Visual Ratings

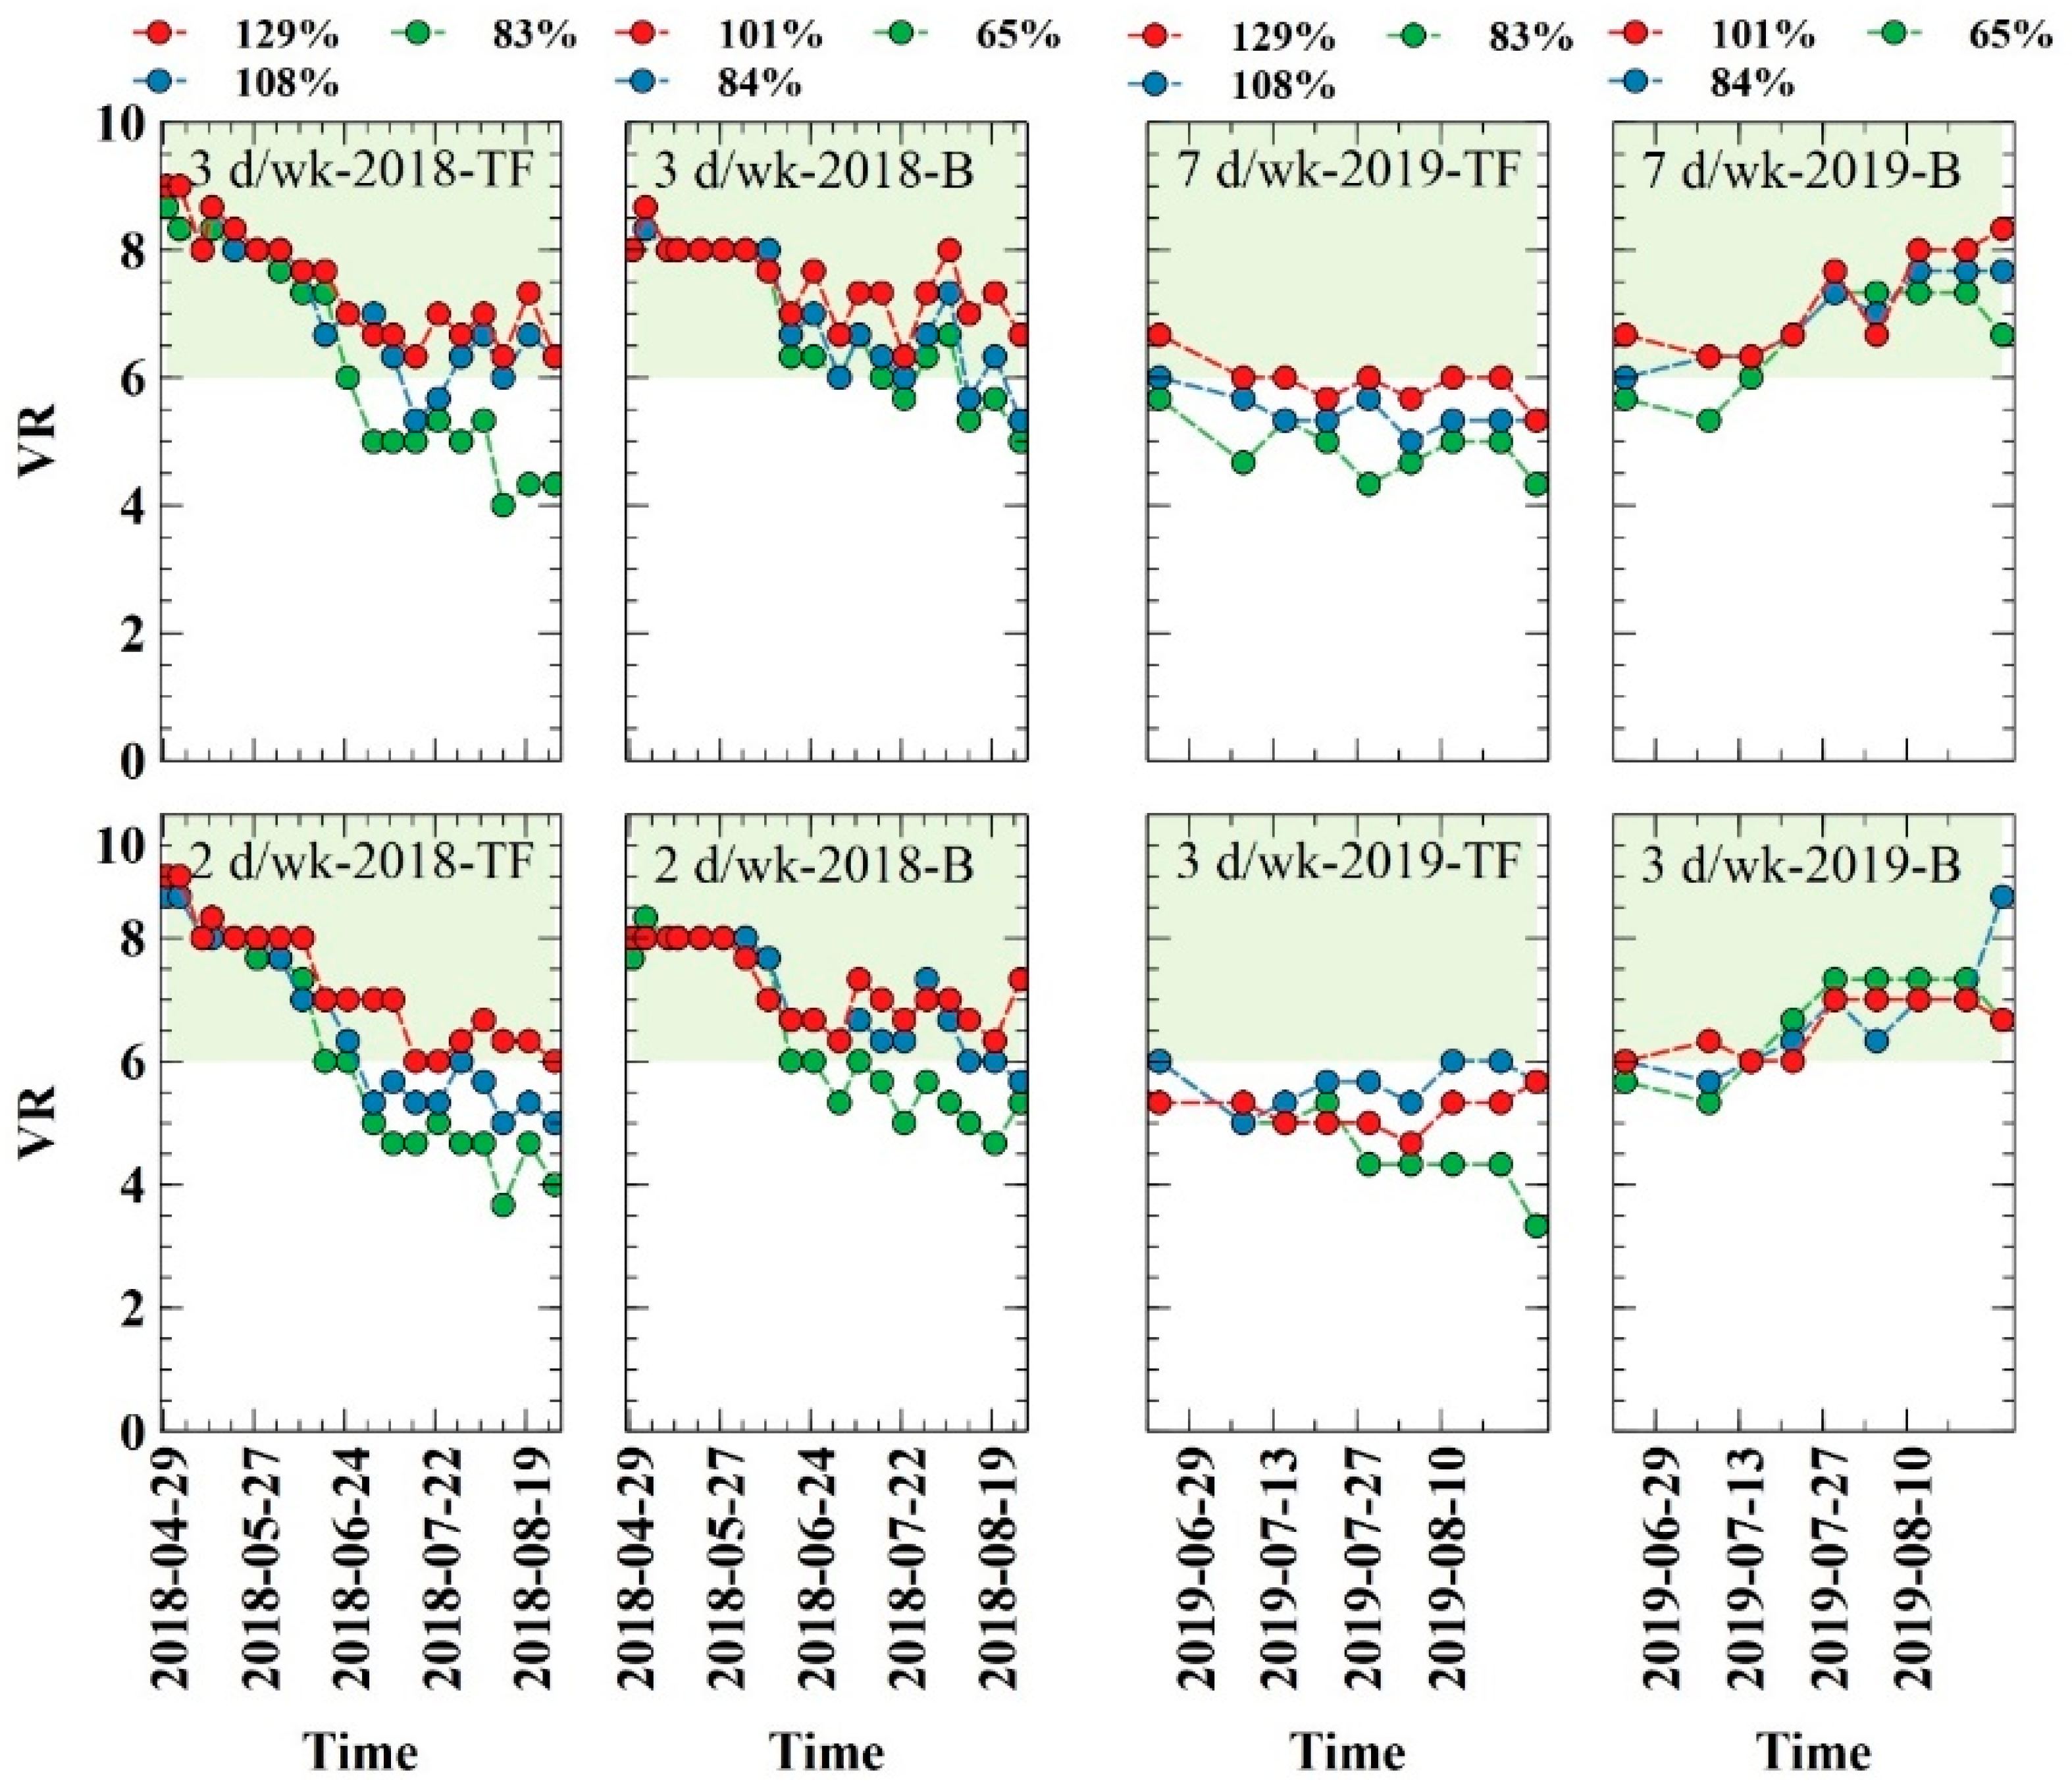
Table 3 summarizes the statistical analysis of the VR data for both species in 2018 and 2019. Figure 4 illustrated the dynamics of VR values over time for tall fescue and hybrid bermudagrass species across the imposed irrigation treatments. The VR values greater than six were considered acceptable for residential areas and are highlighted in green.
For hybrid bermudagrass, in 2018 and 2019, the VR values ranged from 5 to 9. The effect of irrigation levels was only significant in 2018 (p < 0.05). Irrigation frequency restriction showed no significant impact on either of the years. The interaction of irrigation levels and frequency restrictions was not statistically significant in either of the years. In 2018 and for the 3 d wk−1 frequency restriction, the VR values started to fluctuate noticeably beginning in June, yet stayed above or very close to the minimum threshold for most of the trial (Figure 4). Toward the end of the experiment, VR values fell below 6 for the 65% ETo and 84% ETo treatments. The VRs for 101% ETo treatment stayed in the acceptable range during the trial. The trend was very similar for the 2 d wk−1 frequency restriction treatment. In 2019, the VRs were similar for both 7 and 3 d wk−1 frequency restrictions. It showed a gradual and constant increase from VR values close to 6 up to 7–8 at the end of the trial. The dynamics of VR values over time were very similar across the irrigation levels in 2019.
For tall fescue in 2018, the VR values ranged from 4 to 9. In 2019, the VR values ranged from 3 to 8. The irrigation level (p < 0.001) and frequency restriction (p < 0.05) significantly impacted the VR values in 2018, but not in 2019. The interaction of irrigation levels and frequency restrictions was not statistically significant in either of the years. In 2018, the tall fescue VR values were higher than the minimum threshold (VR = 6) for the 129% ETo treatment and 108% ETo, except for the early July period. For the 83% ETo treatment, the VR values decreased as the trial progressed and eventually fell below the minimum accepted values of 6. The trends were similar for the 2 d wk−1 and 3 d wk−1 irrigation frequency restrictions. In 2019, the VR fluctuated less for the 7 d wk−1 treatments (no frequency restriction), yet only stayed above the threshold for the highest irrigation treatments of 129% ETo for most of the experiment. The lowest quality ratings were observed for the irrigation level of 83%. For the 3 d wk−1 restriction, all treatments had VR values below the acceptable threshold, and the 109% treatment had slightly higher VR values than the 129% treatment.

3.3. Impact of Irrigation Treatments on Near-Surface Soil Moisture Dynamics

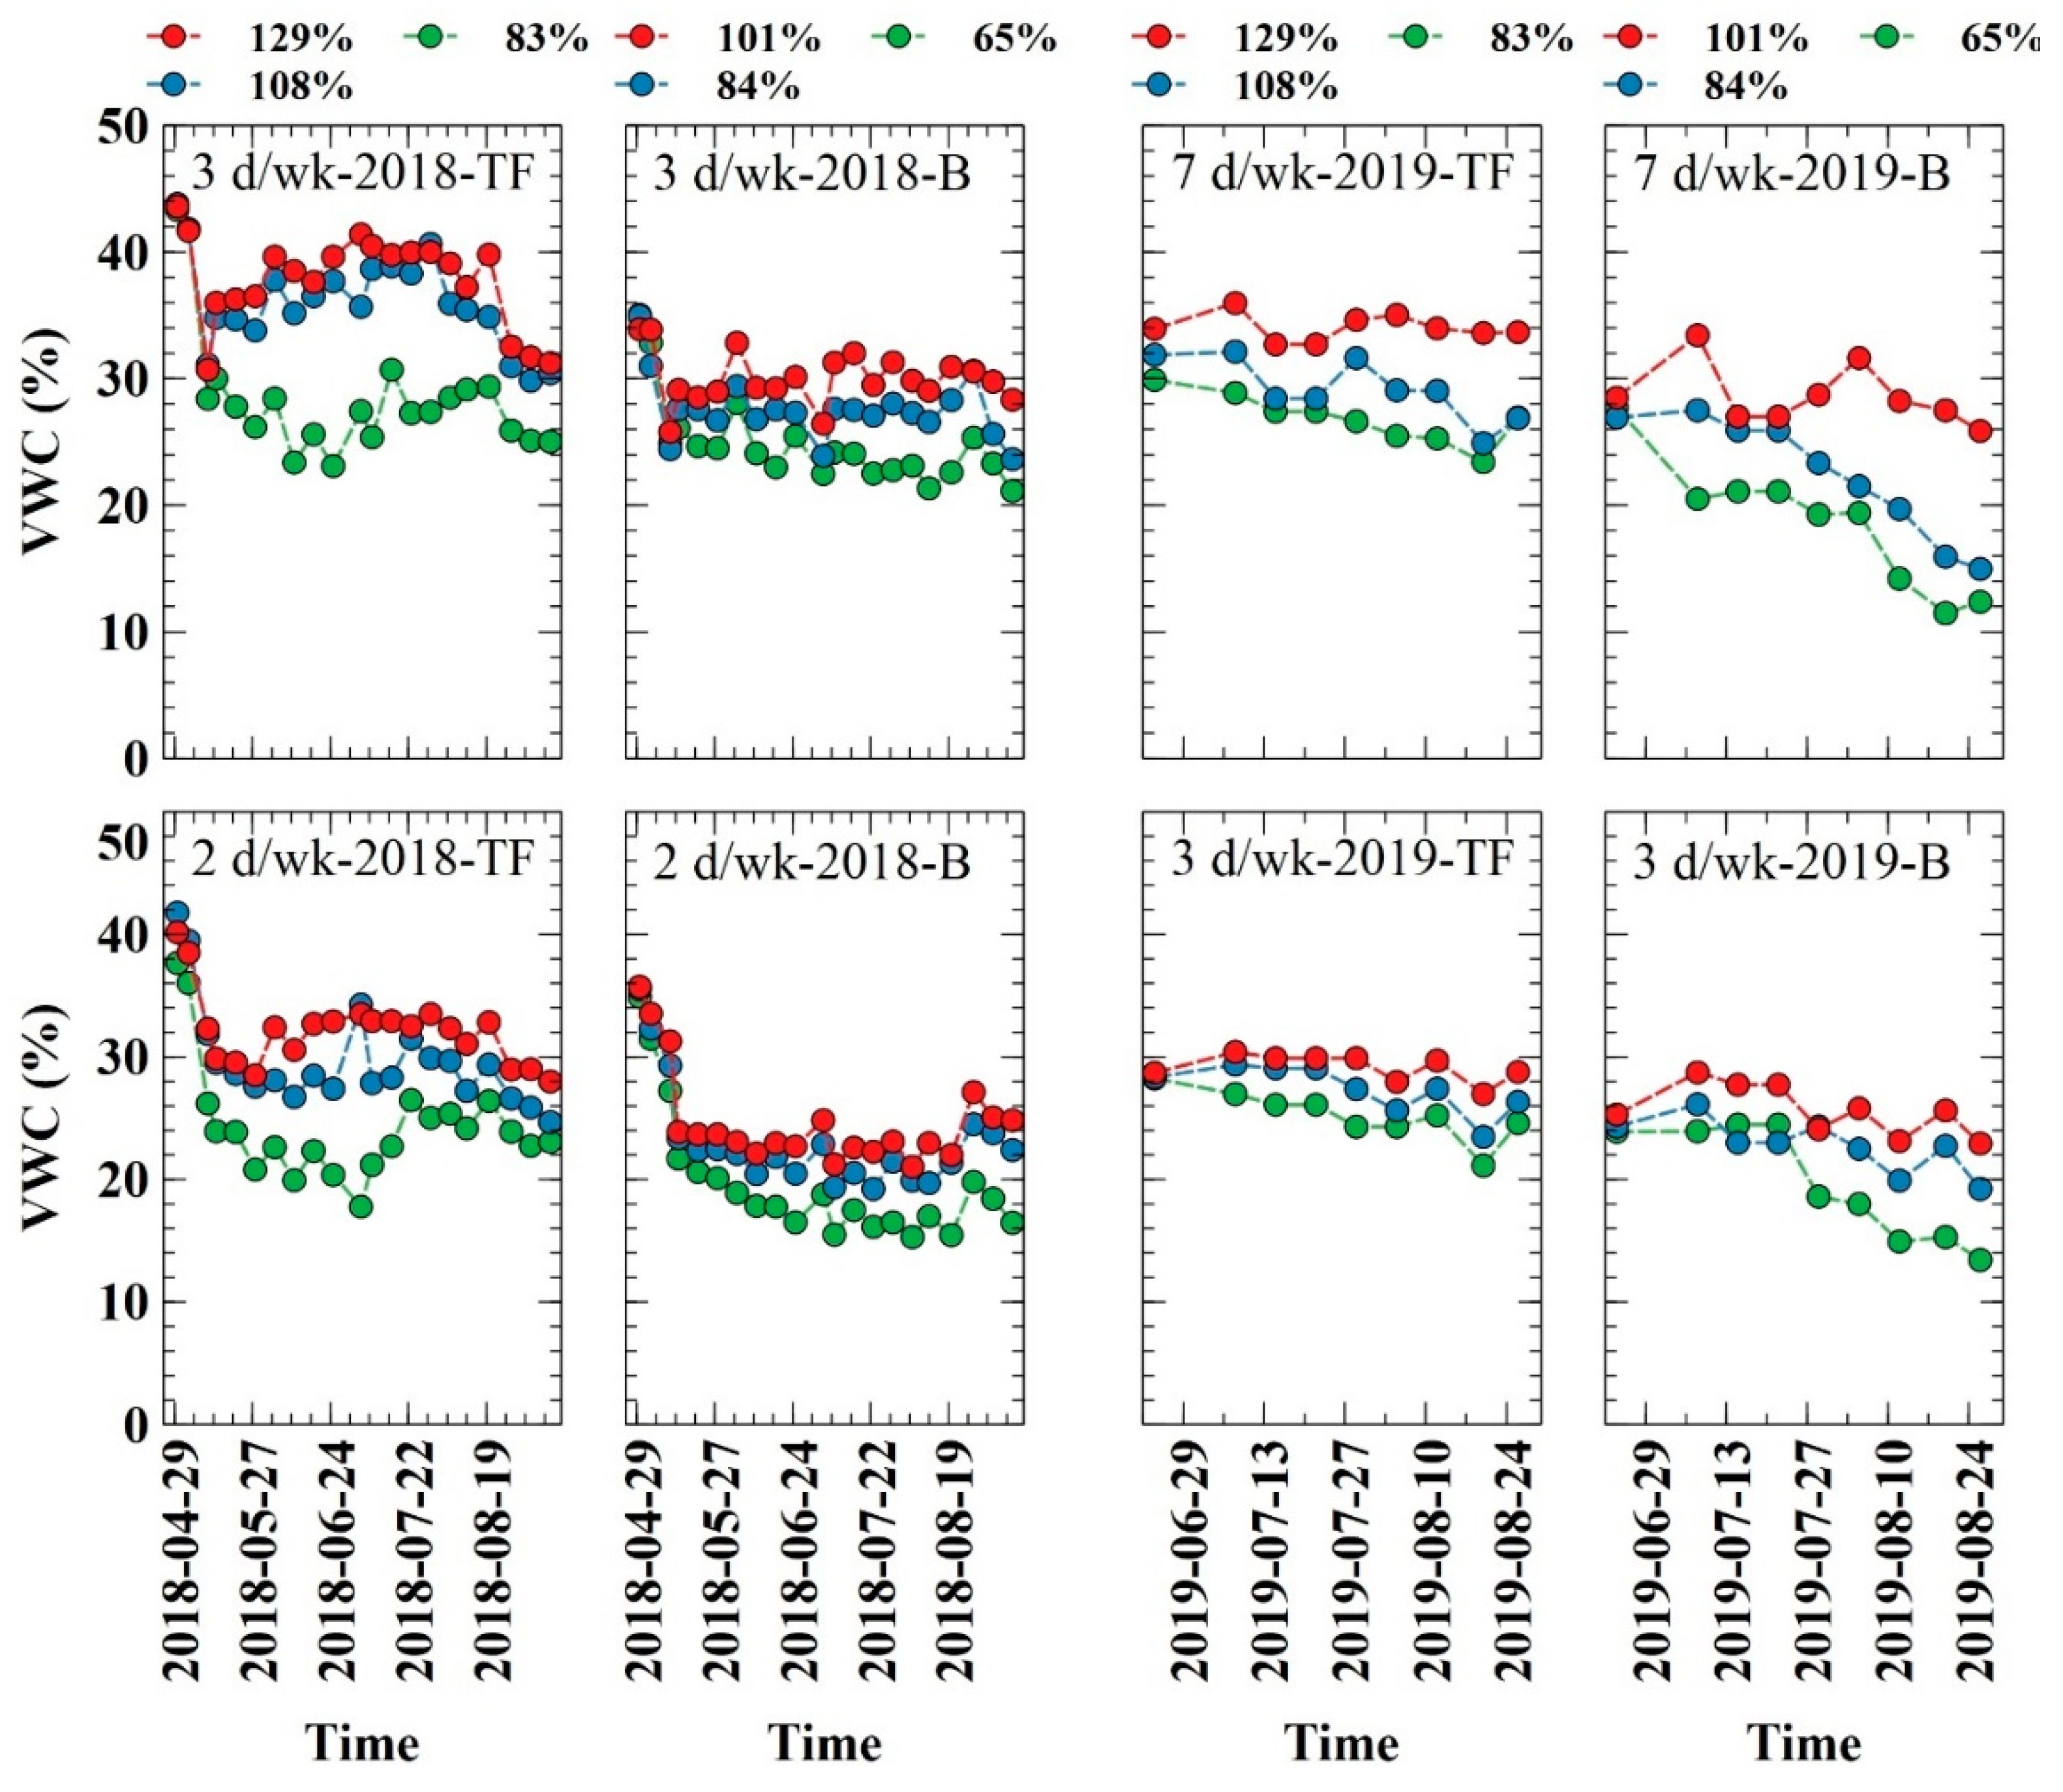
The near-surface soil volumetric water content dynamics across the irrigation treatments for both turfgrass species are shown in Figure 5. For tall fescue in 2018, the minimum and maximum moisture values were 17.8% and 43.8%, respectively. In 2019, the minimum and maximum moisture values were 21.1% and 36.0%, respectively. In 2018, the soil moisture values showed some reduction at the beginning of the trial across treatments. The soil moisture for the 83% ETo was noticeably lower than the other treatments. This difference was more pronounced for the 3 d wk−1 treatments compared with the 2 d wk−1 treatments. However, the soil moisture trends for the 129% ETo and 108% ETo treatments were similar; they increased (more pronounced for the 3 d wk−1 frequency restriction) early in the trial and then stabilized with some decline toward the end of the experiment. In 2019, the greatest and smallest soil moisture values belonged to the highest and lowest irrigation treatments, respectively, for both frequency restrictions scenarios, as expected. The two lesser irrigation levels caused a gradual decline in soil moisture over time, which was more pronounced for the 7 d wk−1 treatment (no frequency restriction).
For hybrid bermudagrass in 2018, the minimum and maximum moisture values were 15.3% and 35.7%, respectively. In 2019, the minimum and maximum moisture values were 11.5% and 33.4%, respectively. In 2018, soil moisture showed no substantial fluctuations over time, except for an initial decrease in all treatments at the beginning of the trial (more pronounced for the 3 d wk−1 irrigation restriction treatment). After that, the soil moisture showed minor fluctuations across treatments. In 2019, the soil moisture showed a gradual decrease over time for both watering restriction scenarios. The greatest and smallest irrigation levels caused the highest and lowest near-surface soil moisture, respectively, as expected.

3.4. Turfgrass Water Response Function (TWRF)

The TWRFs developed using the combined two years of data for tall fescue (Equation (6)) and hybrid bermudagrass (Equation (7)) species are as follows:
V R = 9.81 0.02 ( C E T o ) 0.56 ( F ) + 7.08 × 10 6 ( C E T o 2 ) + 0.01 ( I × C E T o ) + 1.06 × 10 3 ( I × F )
V R = 9.11 0.01 ( C E T o ) 0.46 ( F ) + 2.23 × 10 6 ( C E T o 2 ) + 0.01 ( I × C E T o ) + 1.57 × 10 3 ( I × F )
where VR is the visual rating, CETo is the cumulative ETo over time (mm), F is the irrigation frequency restriction (days wk−1), and I is the irrigation level (ETo percentages).
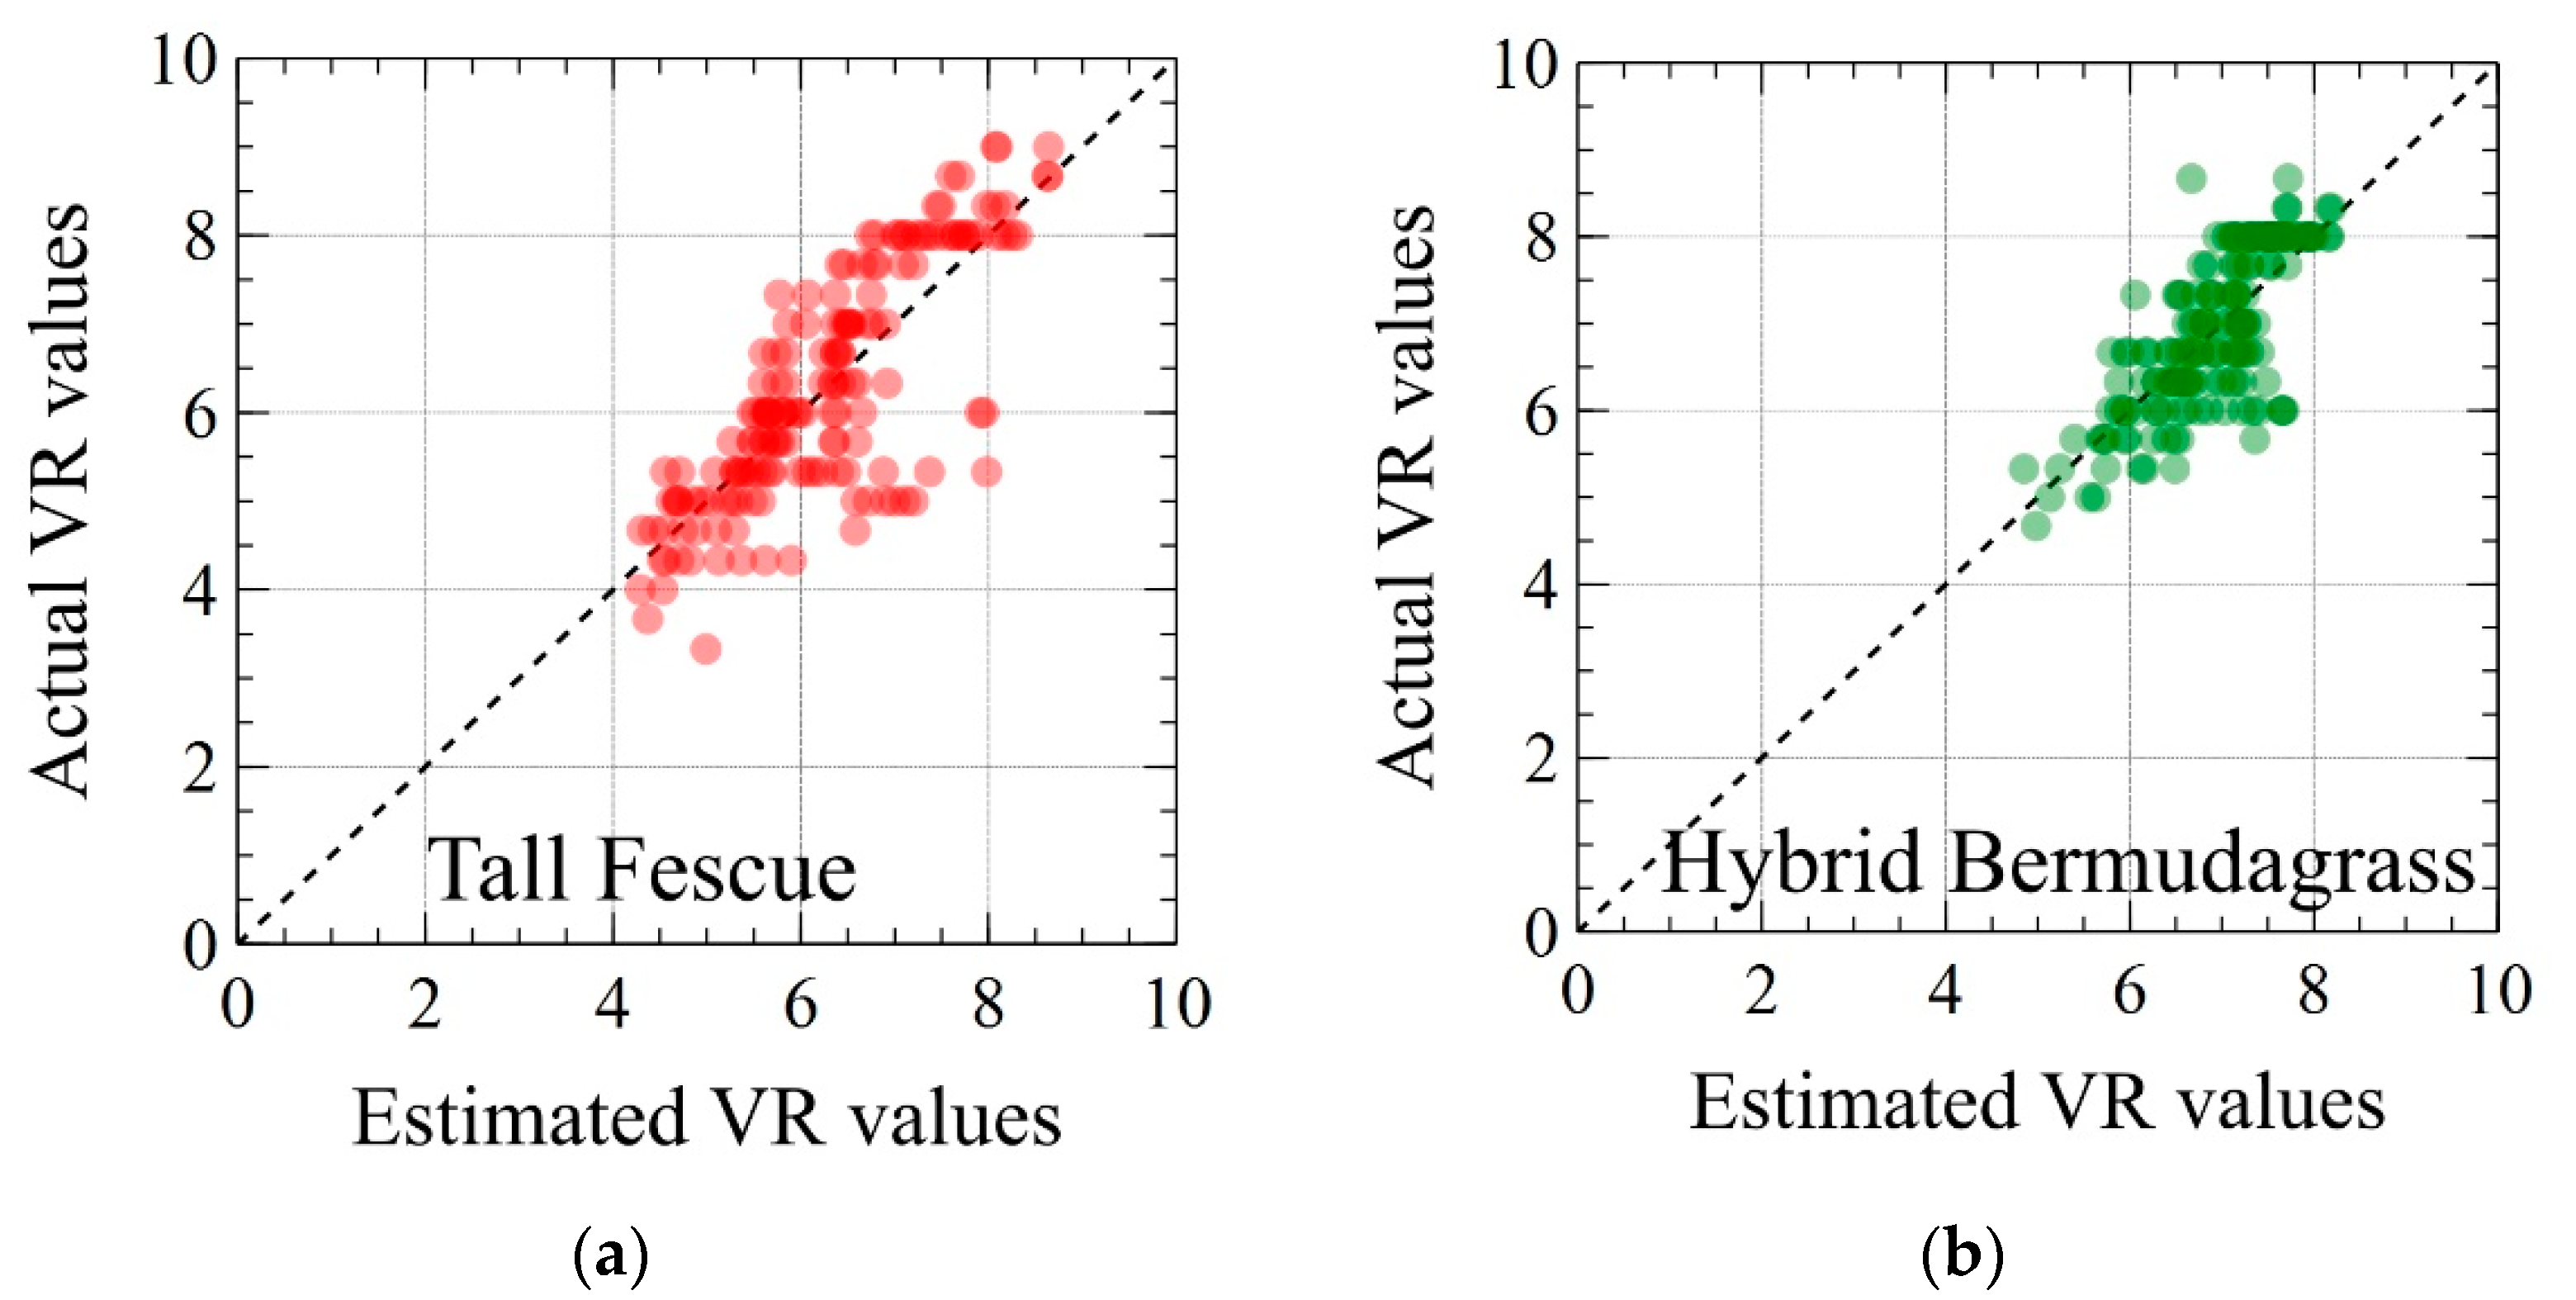
Figure 6 shows the performance of the fitted TWRFs developed for tall fescue and hybrid bermudagrass species. Table 4 summarizes the performance statistics for the fitted TWRFs.
The TWRFs estimated VR with acceptable accuracy for both species, as illustrated by well-scattered data points around the 1:1 line (Figure 6). The RMSE, MAE, and r values were equal to 0.64, 0.59, and 0.79, respectively, for tall fescue and 0.37, 0.47, and 0.75, respectively, for hybrid bermudagrass species. No systematic bias was observed for any of the TWRFs, given the negligible MBE values of 0.0005 and −0.0032 for tall fescue and hybrid bermudagrass species, respectively.
Figure 7 illustrates the estimated impact of multiple irrigation scenarios ranging from 50% to 100% ETo on turfgrass (VR) using TWRF. The long-term mean ETo data were obtained from the CIMIS station #39. The estimated period is from May to August. Hybrid bermudagrass maintained its quality above minimum acceptable value for irrigation levels more than 70% ETo. Tall fescue held its rate above the threshold for approximately 40 and 55 days for the 60% and 100% ETo irrigation scenarios, respectively.

4. Discussion

4.1. Performance of the Smart ET-Based Controller

It is crucial to evaluate the manufacturer programmed and user-defined settings of the available ET-based commercial controllers and investigate the reliability of their algorithms for efficient autonomous irrigation scheduling [11,21]. The actual water applied by the irrigation controller in this study in both years was substantially higher than the initial target irrigation levels across the treatments. The main reason for overirrigation was the initial underestimation of the irrigation precipitation rate using the catch-cans method. We [7] also reported the same issue about underestimating the irrigation precipitation rate using the catch-cans test. The inadequacy of the catch-cans method might be attributed to spatial variation in water applied within each plot and limited sampling areas represented by the catch devices. Moreover, a substantial fraction of applied water may not get into catch devices because of water hitting the cans at an angle and thus splashing out. Accurate estimation of irrigation precipitation rate and proper selection of minimum plant factors are the most critical factors for reliable autonomous irrigation scheduling using a Weathermatic ET-based controller [7].
The second reason for the overirrigation was the overestimation of ETo by the controller compared with CIMIS ETo. We [7] obtained on average 5.7% overestimation compared with CIMIS ETo for the same Weathermatic controller equipped with an on-site temperature sensor and latitude-based solar radiation estimations in inland Southern California. This error range is very close to the 4–5% ETo differences observed in this study, indicating an acceptable estimation of ETo by the controller. Hargreaves and Samani [17] performed even better when long-term weather data were used. Further studies are needed to determine the performance of temperature-based ETo models in different climate regions across the state. Both this study and our recently published study in Southern California [7] focused on the summer months with the highest irrigation demand when no rainfall is typically received, and therefore, water conservation is essential in Central and Southern California. The higher reported overirrigation values of 10% in North Carolina [22] and 32% in Florida [23] suggest that considerable precipitation may negatively impact the efficiency of ET-based controllers as the incorporation of rain into irrigation scheduling by these controllers is often very simplistic.

4.2. Turfgrass Irrigation Management

In their review paper, Colmer and Barton [24] gathered 29 bermudagrass crop coefficient values ranging from 0.40 to 1.27 in well-watered conditions and from 0.52 to 0.94 under deficit irrigation. Variation in water requirements reported for warm-season grass species shows that local crop coefficient and irrigation recommendations information should be developed, and utilizing a nominal value for all cultivars and locations is not optimal. The TWRF estimated VR values based on long-term mean ETo demand suggested 70–80% ETo as the minimum irrigation application to maintain the acceptable hybrid bermudagrass quality in central California during the high water demand months (i.e., May to August). Reducing the irrigation level to 60% ETo only maintains the turf quality for approximately 75 days before it falls below the minimum acceptable value of 6. We [7] conducted a similar analysis using TWRF developed based on three years of experimental data in inland southern California. In that study, we reported 75% ETo as the minimum requirement to maintain the ‘Tifgreen’ hybrid bermudagrass quality in peak summer months, which agrees with the findings of this study. Wherley et al. [25] also reported that a commonly used crop coefficient of 0.6 for warm-season grass underestimated water requirement for ‘Tifway’ hybrid bermudagrass in Florida.
Richie et al. [26] conducted a two-year tall fescue field irrigation trial in Riverside, California. They reported visual qualities between 4 and 6 for most of the experimental periods (~mid-June to mid-November) for irrigation application of 79–85% ETo. Brown et al. [27] conducted a research project to evaluate the response of ‘Monarch’ tall fescue to different irrigation regimes in Las Vegas, NV, USA. They reported 80% ETo as the optimum irrigation level to maintain color and coverage of tall fescue turfgrass at an acceptable condition. Ervin and Koski [28] conducted a study near Fort Collins, CO, USA and reported 75% ETo as the safe irrigation level to maintain an acceptable quality for tall fescue turfgrass (a blend of ‘Rebel Jr.’, ‘Crewcut’, and ‘Monarch’). In our study, the 83% ETo irrigation level only maintained the visual rating above the minimum threshold for two months in 2018. The 108% ETo level with 3 d wk−1 frequency kept the VR values in the acceptable range in 2018, except for a short period in mid-trial. Both Brown et al. [27] and Ervin and Koski [28] estimated the irrigation volumes applied by measuring the volume of water collected in catch-can devices. If we use the precipitation rate estimated by the catch-cans test, the 108% ETo treatment (which maintained the turf quality for much of the trial in 2018) will be reduced to 89% ETo. However, the catch-cans-based precipitation rate estimations were proved to be inaccurate in our study. The same issue regarding the inadequacy of the catch-cans method to estimate the precipitation rate of landscape irrigation systems was also reported in our recently published study conducted in Southern California [7]. Therefore, we recommend the water savings and crop coefficients reported in the literature based on the catch-cans-estimated precipitation rates be re-evaluated and used cautiously.
In 2019, the VR values of tall fescue plots were relatively low across all irrigation treatments. This might be related to the minimal fertilizer application rates, diminishing growth and greenness of tall fescue in 2019. The positive impact of higher nitrogen fertilization treatment on color ratings was also reported by [27,29]. The TWRF estimations suggest that 60% ETo would be sufficient to maintain the tall fescue quality within the acceptable range for approximately 40 days. Hong et al. [30] conducted a two-year dry down study in Kansas and reported 50% ETo irrigation held ‘Seed Research 8650’ tall fescue quality above minimum acceptable rating (VR = 6) for 45 and 82 days in two years of their study. The TWRF estimations suggest that 100% ETo would be only sufficient to maintain the tall fescue quality for approximately 55 days. This might be an underestimation impacted by the low VR data in 2019 and, therefore, should be further investigated in the future.
Limiting irrigation watering days to specific days per week is a common strategy that is particularly popular and imposed by water agencies and municipalities in California during droughts to help conserve water in urban areas. We, however, observed no substantial water saving associated with restricting irrigation frequency (watering days). In fact, for both species and in both years, less restrictive watering days improved the VR values. We [7] also found no turfgrass quality improvement or water conservation associated with restricting the watering days in Southern California. This finding is attributed partly to sandy soils with low water holding capacity at both sites and the fact that most of the turfgrass roots are expected to be in the topsoil layer. Su et al. [31] reported that 86% of all root length of ‘Dynasty’ tall fescue in the field was in the upper 30 cm under well-watered condition and silt loam soil in Kansas, USA. Sinclair et al. [32] reported low amounts of root mass in the deepest soil layer during sod establishment for ‘Tifway 419’ hybrid bermudagrass grown in tubes filled with loamy sand soil in Florida, USA. The Weathermatic smart controller can dynamically adjust the irrigation frequency based on the actual ETo demand, so restricting irrigation frequency is unnecessary. When irrigation frequency is not restricted, programming a minimum deficit threshold is crucial to avoid light irrigation applications and prevent excessive evaporative loss.
The irrigation scenarios directly impacted the dynamics of near-surface soil moisture. However, the near-surface soil moisture fluctuation over time was not always adequate to explain the variation in turfgrass quality. For example, in 2019, the visual quality of tall fescue for the 83% ETo treatment decreased over time, but the soil moisture showed minimum fluctuations. Moreover, in 2019, the continuous late green-up of hybrid bermudagrass through June and a fertilizer application in mid-July caused the quality ratings to improve as the trial progressed despite a constant decrease in the near-surface soil moisture of the hybrid bermudagrass plots. Consequently, the near-surface soil moisture data should be interpreted carefully and in conjunction with other parameters such as turfgrass physiology and fertilizer applications. The in situ soil moisture values were higher than the laboratory-measured water retention data (Figure 2). This could be related to differences between laboratory and field sensors and the small size of the laboratory samples. Note that the reported results in this study are for a pop-up sprinkler system with autonomous irrigation scheduling using the Weathermatic ET-based smart irrigation controller. Further studies are needed to determine whether lower irrigation amounts might be sufficient when irrigation scheduling is done based on actual root zone soil water holding capacity information and for irrigation systems with higher potential efficiency, such as underground drip irrigation systems.

5. Conclusions

Our results suggest that applying typically recommended values of 60% ETo for hybrid bermudagrass and 80% ETo for tall fescue is insufficient to maintain the acceptable quality over high ETo demand months in Central California. The TWRFs fitted to the experimental data suggested 80% ETo as the minimum requirement to maintain the quality of hybrid bermudagrass above the minimum acceptable VR value of 6 for four months (May to August). The TWRFs estimations suggested that applying 100% ETo was sufficient to maintain the tall fescue quality above the threshold for only 50 days. This finding might be an overestimation as tall fescue ratings were negatively affected by minimal fertilizer application in 2019. The Weathermatic controller showed promising results by providing acceptable ETo estimations (5–8% higher than CIMIS ETo) only using onsite temperature measurements. The controller also closely followed programmed watering days restrictions and adjusted the watering days based on ETo demand when no watering restriction was applied. The efficient irrigation scheduling by the smart controller also depends on the accurate calculation of the precipitation rate of the irrigation system, which was substantially underestimated in our study using the widely used catch-cans method. Therefore, researchers should be cautious when using this approach to estimate the precipitation of the irrigation systems.

Author Contributions

Conceptualization, A.H.; methodology, A.H.; software, A.H., A.S. (Anish Sapkota), and A.S. (Amninder Singh); validation, A.H., A.S. (Anish Sapkota), and A.S. (Amninder Singh); formal analysis, A.H., M.R., A.S. (Anish Sapkota), and A.S. (Amninder Singh); investigation, A.H., M.R., A.S. (Anish Sapkota), and A.S. (Amninder Singh); resources, A.H. and M.R; data curation, A.H., M.R., A.S. (Anish Sapkota), and A.S. (Amninder Singh); writing—original draft preparation, A.H.; writing—review and editing, A.H., M.R., A.S. (Anish Sapkota), and A.S. (Amninder Singh); visualization, A.H.; supervision, A.H.; project administration, A.H. and M.R.; funding acquisition, A.H. and M.R. All authors have read and agreed to the published version of the manuscript.

Funding

This study was supported by the University of California Division of Agriculture and Natural Resources competitive grant (ID#: 17-5021) and the United States Geological Survey (ID#: 2017CA371B).

Institutional Review Board Statement

Not applicable.

Informed Consent Statement

Not applicable.

Conflicts of Interest

The authors declare no conflict of interest.

References

  1. CSDO. Population Projections Methodology (2019 Baseline); 2020. Available online: https://www.dof.ca.gov/forecasting/demographics/projections (accessed on 20 August 2021).
  2. UCANR. STRATEGIC VISION 2025: University of California Division of Agriculture and Natural Resources. 2019. Available online: https://ucanr.edu/files/906.pdf (accessed on 20 August 2021).
  3. Cook, B.I.; Ault, T.R.; Smerdon, J.E. Unprecedented 21st century drought risk in the American Southwest and Central Plains. Sci. Adv. 2015, 1, e1400082. [Google Scholar] [CrossRef] [Green Version]
  4. Cooley, H. Urban and Agricultural Water Use in California, 1960–2015; Pacific Institute: Oakland, CA, USA, 2020. [Google Scholar]
  5. Cardenas, B.; Dukes, M.D. Soil moisture sensor irrigation controllers and reclaimed water; Part I: Field-plot study. Appl. Eng. Agric. 2016, 32, 217–224. [Google Scholar]
  6. Davis, S.; Dukes, M.D.; Miller, G. Landscape irrigation by evapotranspiration-based irrigation controllers under dry conditions in Southwest Florida. Agric. Water Manag. 2009, 96, 1828–1836. [Google Scholar] [CrossRef]
  7. Haghverdi, A.; Singh, A.; Sapkota, A.; Reiter, M.; Ghodsi, S. Developing irrigation water conservation strategies for hybrid bermudagrass using an evapotranspiration-based smart irrigation controller in inland southern California. Agric. Water Manag. 2021, 245, 106586. [Google Scholar] [CrossRef]
  8. Singh, A.; Haghverdi, A.; Nemati, M.; Hartin, J. Efficient Urban Water Management: Smart Weather-Based Irrigation Controllers; UCANR Publication, 2020; p. 8674. Available online: https://anrcatalog.ucanr.edu/pdf/8674.pdf (accessed on 20 August 2021).
  9. Dukes, M. Water conservation potential of landscape irrigation smart controllers. Trans. ASABE 2012, 55, 563–569. [Google Scholar] [CrossRef]
  10. Devitt, D.; Carstensen, K.; Morris, R. Residential water savings associated with satellite-based ET irrigation controllers. J. Irrig. Drain. Eng. 2008, 134, 74–82. [Google Scholar] [CrossRef]
  11. Davis, S.L.; Dukes, M.D. Importance of ET controller program settings on water conservation potential. Appl. Eng. Agric. 2016, 32, 251–262. [Google Scholar]
  12. Bijoor, N.S.; Pataki, D.E.; Haver, D.; Famiglietti, J.S. A comparative study of the water budgets of lawns under three management scenarios. Urban Ecosyst. 2014, 17, 1095–1117. [Google Scholar] [CrossRef] [Green Version]
  13. Service, N.P. Benefits of Turf Grass. In Turf Management; 2018. Available online: https://www.nps.gov/subjects/turfmanagement/benefits.htm (accessed on 20 August 2021).
  14. Hartin, J.; Oki, L.; Fujino, D.; Reid, K.; Ingels, C.; Haver, D.; Baker, W. UC ANR research and education influences landscape water conservation and public policy. Calif. Agric. 2019, 73, 25–32. [Google Scholar] [CrossRef]
  15. Haghverdi, A.; Reiter, M.; Singh, A.; Sapkota, A. Hybrid Bermudagrass and Tall fescue Irrigation in Central California: II. Assessment of NDVI, CWSI and Canopy Temperature Dynamics. Agronomy 2021. submit. [Google Scholar]
  16. Haghverdi, A.; Najarchi, M.; Öztürk, H.S.; Durner, W. Studying Unimodal, Bimodal, PDI and Bimodal-PDI Variants of Multiple Soil Water Retention Models: I. Direct Model Fit Using the Extended Evaporation and Dewpoint Methods. Water 2020, 12, 900. [Google Scholar] [CrossRef] [Green Version]
  17. Hargreaves, G.H.; Samani, Z.A. Reference crop evapotranspiration from temperature. Appl. Eng. Agric. 1985, 1, 96–99. [Google Scholar] [CrossRef]
  18. Morris, K.N.; Shearman, R.C. NTEP turfgrass evaluation guidelines. In Proceedings of the NTEP Turfgrass Evaluation Workshop, Beltsville, MD, USA, 17 October 1998; pp. 1–5. [Google Scholar]
  19. SAS Institute. Base SAS 9.4 Procedures Guide; SAS Institute, 2015. Available online: https://documentation.sas.com/doc/en/pgmsascdc/9.4_3.5/procstat/titlepage.htm (accessed on 20 August 2021).
  20. Sanders, J. Veusz-a Scientific Plotting Package. 2008. Available online: https://veusz.github.io/ (accessed on 20 August 2021).
  21. Davis, S.; Dukes, M. Irrigation scheduling performance by evapotranspiration-based controllers. Agric. Water Manag. 2010, 98, 19–28. [Google Scholar] [CrossRef]
  22. Grabow, G.; Ghali, I.; Huffman, R.; Miller, G.; Bowman, D.; Vasanth, A. Water application efficiency and adequacy of ET-based and soil moisture–based irrigation controllers for turfgrass irrigation. J. Irrig. Drain. Eng. 2013, 139, 113–123. [Google Scholar] [CrossRef]
  23. Davis, S.; Dukes, M.D.; Vyapari, S.; Miller, G.L. Evaluation and demonstration of evapotranspiration-based irrigation controllers. In Proceedings of the World Environmental and Water Resources Congress 2007: Restoring Our Natural Habitat, Tampa, FL, USA, 15–19 May 2007; pp. 1–18. [Google Scholar]
  24. Colmer, T.D.; Barton, L. A review of warm-season turfgrass evapotranspiration, responses to deficit irrigation, and drought resistance. Crop Sci. 2017, 57, S-98–S-110. [Google Scholar] [CrossRef]
  25. Wherley, B.; Dukes, M.; Cathey, S.; Miller, G.; Sinclair, T. Consumptive water use and crop coefficients for warm-season turfgrass species in the Southeastern United States. Agric. Water Manag. 2015, 156, 10–18. [Google Scholar] [CrossRef]
  26. Richie, W.; Green, R.; Klein, G.; Hartin, J. Tall fescue performance influenced by irrigation scheduling, cultivar, and mowing height. Crop Sci. 2002, 42, 2011–2017. [Google Scholar] [CrossRef] [Green Version]
  27. Brown, C.; Devitt, D.; Morris, R. Water use and physiological response of tall fescue turf to water deficit irrigation in an arid environment. HortScience 2004, 39, 388–393. [Google Scholar] [CrossRef] [Green Version]
  28. Ervin, E.H.; Koski, A.J. Drought avoidance aspects and crop coefficients of Kentucky bluegrass and tall fescue turfs in the semiarid west. Crop Sci. 1998, 38, 788–795. [Google Scholar] [CrossRef]
  29. Schiavon, M.; Pornaro, C.; Macolino, S. Tall Fescue (Schedonorus arundinaceus (Schreb.) Dumort.) Turfgrass Cultivars Performance under Reduced N Fertilization. Agronomy 2021, 11, 193. [Google Scholar] [CrossRef]
  30. Hong, M.; Bremer, D.; Keeley, S. Minimum water requirements of cool-season turfgrasses for survival and recovery after prolonged drought. Crop Sci. 2020, 5. [Google Scholar] [CrossRef]
  31. Su, K.; Bremer, D.J.; Keeley, S.J.; Fry, J.D. Rooting characteristics and canopy responses to drought of turfgrasses including hybrid bluegrasses. Agron. J. 2008, 100, 949–956. [Google Scholar] [CrossRef]
  32. Sinclair, T.R.; Schreffler, A.; Wherley, B.; Dukes, M.D. Irrigation frequency and amount effect on root extension during sod establishment of warm-season grasses. HortScience 2011, 46, 1202–1205. [Google Scholar] [CrossRef] [Green Version]
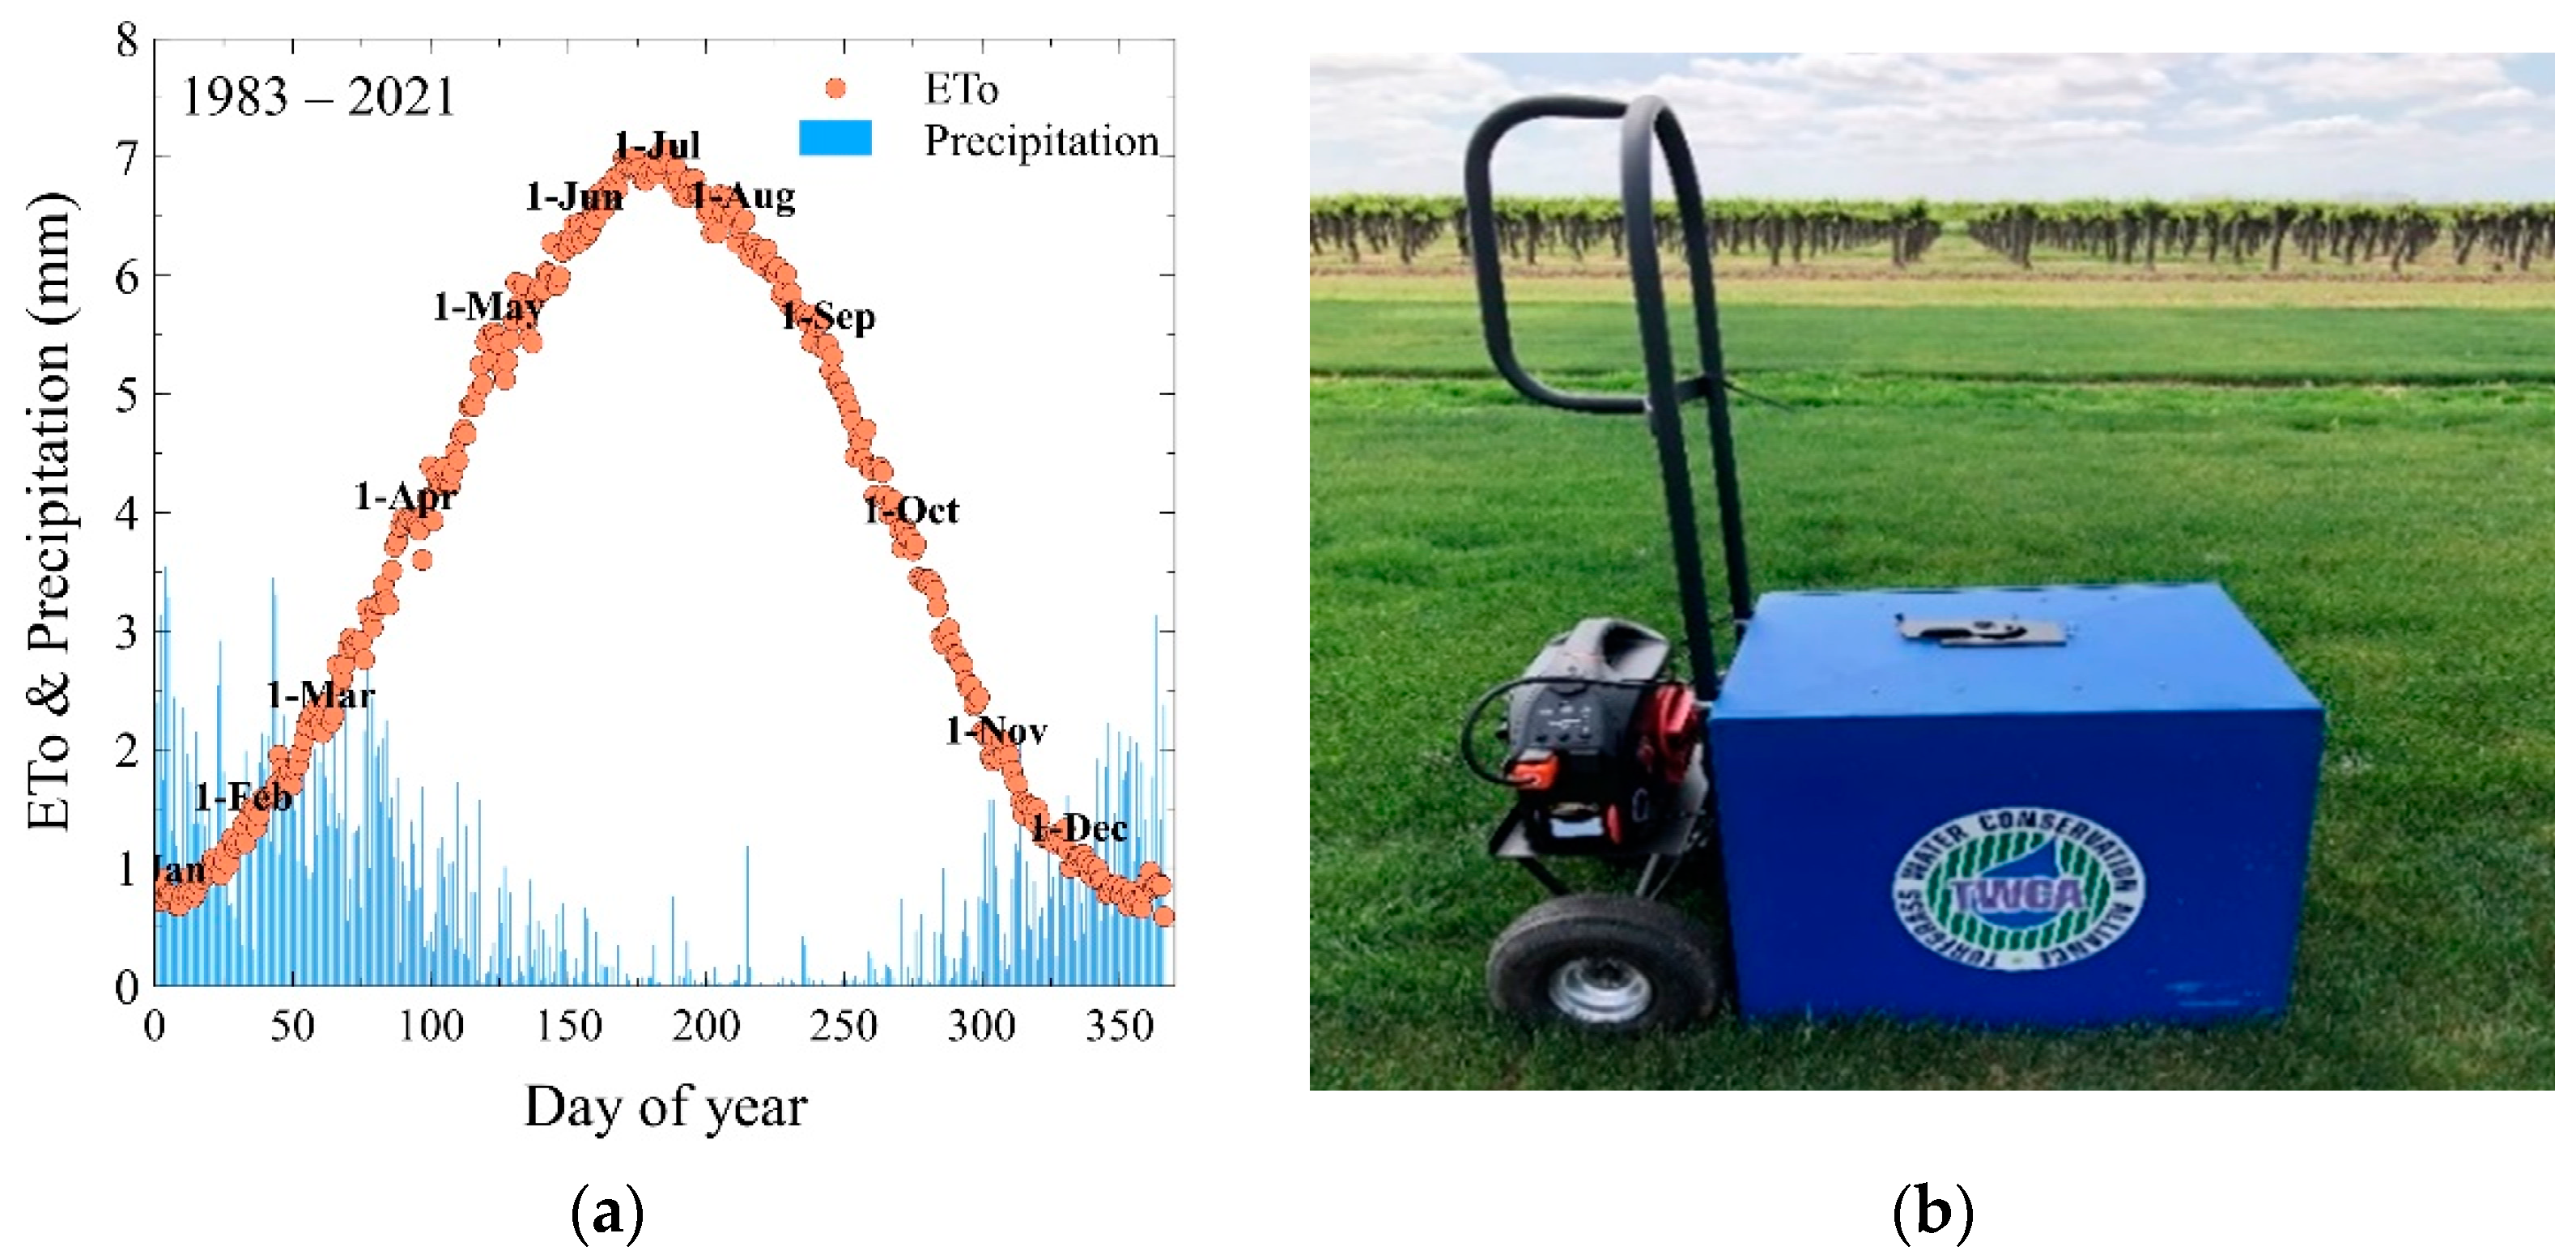
Figure 1. The long-term mean reference evapotranspiration (ETo) and precipitation trends at the study site obtained from a nearby CIMIS weather station (a). The lightbox used in this study to collect digital images for the visual rating (b).
Agronomy 11 01666 g001
Figure 2. The soil water retention (a) and hydraulic conductivity (b) curves of the surface soil (0–20 cm) at the study site.
Agronomy 11 01666 g002
Figure 3. Scatter plot of ETo estimated using the Hargreaves and Samani (HS) [17] versus CIMIS values (a) and variation in long-term annual and seasonal mean absolute error (MAE) values (b). MAE shows the difference between the HS and CIMIS models and the red horizontal line in figure (b) represents the mean MAE.
Agronomy 11 01666 g003
Figure 4. The dynamics of visual rating (VR) values over time showing the response of hybrid bermudagrass (B) and tall fescue (TF) turfgrass to varying irrigation treatments (percentages of ETo) imposed in 2018 and 2019. d/wk: days per week.
Agronomy 11 01666 g004
Figure 5. The near-surface (12 cm) volumetric soil water content (VWC) dynamics in 2018 and 2019 across the irrigation treatments (percentages of ETo). TF: tall fescue; B: hybrid bermudagrass; d/wk: days per week.
Agronomy 11 01666 g005
Figure 6. Performance of turfgrass water response functions developed for tall fescue (a) and hybrid bermudagrass (b) species using a combination of 2018 and 2019 experimental data. VR: visual rating values.
Agronomy 11 01666 g006
Figure 7. Response of tall fescue and hybrid bermudagrass to multiple irrigation levels based on long-term mean ETo data obtained from a weather station located nearby the experimental site. VR: visual rating values, DAI: days after initiation.
Agronomy 11 01666 g007
Table 1. Irrigation treatments imposed throughout the 2-year tall fescue and hybrid bermudagrass irrigation research experiments conducted at the University of California Kearney Research and Extension Center.
2018 Trial, Start: 4 May 2018; End: 11 September 2018
Target Irrigation Levels (% ETo): Tall Fescue: 50%, 65%, 80%; Hybrid Bermudagrass: 40%, 50%, 60%
Irrigation Efficiency: 78%
Watering Days: 2 days per week, 3 days per week
2019 Trial, Start: 22 June 2019; End: 26 August 2019
Target Irrigation Levels (% ETo): Tall Fescue: 50%, 65%, 80%; Hybrid Bermudagrass: 40%, 50%, 60%
Irrigation Efficiency: 78%
Watering Days: 3 days per week, 7 days per week (no restriction)
The controller used the user-defined “plant type” information to convert ETo to irrigation application (irrigation application = plant type × ETo). For each treatment, the plant type was calculated as the irrigation levels (% ETo) divided by the irrigation efficiency of the system.
Table 2. Target irrigation treatments (T1–T3) versus programmed and applied irrigation levels for tall fescue and hybrid bermudagrass irrigation research experiments.
Tall FescueHybrid Bermudagrass
IrrigationT1T2T3T1T2T3
Treatment50%65%80%40%50%60%
Programmed64%83%103%51%64%77%
Applied83%108%129%65%84%101%
Programmed irrigation levels are equal to target treatment levels divided by the irrigation efficiency of 0.78 (i.e., the low half distribution uniformity of the irrigation system). Applied irrigation levels were recalculated based on the irrigation run time data retrieved from the controller and precipitation rate of 28 mm day−1 measured for the system at the end of the trial.
Table 3. Statistical analysis of the hybrid bermudagrass and tall fescue response (visual rating) to irrigation treatments imposed in 2018 and 2019 (each year and species were analyzed separately).
Tall FescueHybrid Bermudagrass
Treatment20182019Treatment20182019
Level Level
129% ETo7.4 a5.6 a101% ETo7.4 a6.8 a
108% ETo6.9 b5.6 ab84% ETo7.1 ab6.8 a
83% ETo6.3 c4.9 b65% ETo6.7 b6.3 a
Frequency Frequency
2 d wk−16.7 b 2 d wk−16.9 a
3 d wk−17.0 a5.2 a3 d wk−17.1 a6.4 a
7 d wk−1 5.5 a7 d wk−1 6.8 a
Model effect20182019Model effect20182019
I***NSI*NS
F*NSFNSNS
I × FNSNSI × FNSNS
T******T******
I × T****I × T***NS
F × TNSNSF × TNSNS
I × F × TNSNSI × F × TNSNS
NS, *** and * are non-significant or significant at p ≤ 0.001 and 0.05, respectively. Means sharing a similar letter are not significantly different, based on Turkey’s test at α = 0.05. I, F, and T in the table refer to irrigation levels, irrigation frequency restrictions, and time (i.e., repeated measures of visual rating each year over time), respectively.
Table 4. Performance statistics for the turfgrass water response functions developed for tall fescue and hybrid bermudagrass species.
r1RMSEMBEMAE
Tall Fescue 0.790.640.00050.59
Hybrid Bermudagrass0.750.37−0.00320.47
1r = correlation coefficient; RMSE: root means square error; MBE: mean bias error; MAE: mean absolute error.
Publisher’s Note: MDPI stays neutral with regard to jurisdictional claims in published maps and institutional affiliations.