Article

Association Mapping for Common Bunt Resistance in Wheat Landraces and Cultivars

by
Philipp Matthias Steffan
1,
Anders Borgen
2,
Anna Maria Torp
1,
Gunter Backes
3 and
Søren K. Rasmussen
1,*
1
Department of Plant and Environmental Sciences, University of Copenhagen, 1871 Copenhagen, Denmark
2
Agrologica, Houvej 55, 9550 Mariager, Denmark
3
Department of Organic Agricultural Sciences, University of Kassel, Nordbahnhofstraße 1a, 37213 Witzenhausen, Germany
*
Author to whom correspondence should be addressed.
Agronomy 2022, 12(3), 642; https://doi.org/10.3390/agronomy12030642
Submission received: 28 January 2022 / Revised: 24 February 2022 / Accepted: 2 March 2022 / Published: 5 March 2022
(This article belongs to the Section Crop Breeding and Genetics)

Abstract

:
Common bunt is a seed borne disease of wheat whose importance is likely to increase due to the growing organic seed market, which, in addition to seed phytosanitary measures, relies on genetic resistances towards the disease. Genome wide association studies in wheat have been proven to be a useful tool in the detection of genetic polymorphisms underlying phenotypic trait variation in wheat. Here 248 wheat landraces and cultivars representing 130 years of breeding history were screened for two years in the field for their resistance reactions towards common bunt. The majority of lines exhibited high levels of susceptibility towards common bunt, while 25 accessions had less than 10% infection. Using Diversity Array Technology (DArT) markers for genotyping and correcting for population stratification by using a compressed mixed linear model, we identified two significant marker trait associations (MTA) for common bunt resistance, designated QCbt.cph-2B and QCbt.cph-7A, located on wheat chromosomes 2B and 7A, respectively. This shows that genome wide association studies (GWAS) are applicable in the search for genetic polymorphisms for resistance towards less studied plant diseases such as common bunt in the context of an under representation of resistant lines.

1. Introduction

Common bunt is a seed borne disease of wheat (Triticum aestivum L. subsp. aestivum) worldwide [1,2,3,4,5] and yield losses due to this pathogen have actually been estimated to be equal to the percent infection [6]. The disease is caused by two closely related basidomycete fungi, Tilletia caries (DC.) Tul. & C. Tul (syn. T. tritici (Bjerk.) G. Winter in Rabenh.) and T. foetida (Wallr.) Liro (syn. T. laevis Khn in Rabenh.). Germination of seed transmitted spores coincides with wheat germination and fungal infection hyphae penetrate the emerging wheat coleoptile and reach the apical meristematic tissue in susceptible wheat cultivars within 50–60 days [7]. Fungal hyphae are carried upwards with the elongating culm and will eventually replace the ovuliferous tissue of the emerging wheat spikes with their own reproductive organs, so called bunt balls, oblong spherical tissues, sori, containing masses of dark teliospores with a smell resembling that of rotting fish [7,8]. At wheat maturity sori tissue becomes brittle, and disrupts during threshing and thereby releasing spores onto healthy wheat seeds. If these seeds remain untreated, the spores attached to them are a likely cause of infection in the next generation of wheat production.
The area of organic wheat production is growing, giving a constant and increasing demand for organic seed free from seed borne diseases such as common bunt as recently reviewed [9]. Exploring existing resistance to common bunt in breeding nurseries is an attractive way of controlling the disease in new cultivars. Triticale has a relatively short breeding history and in spite of its combination of rye and wheat genomes it was reported to have superior resistance to wheat diseases including common bunt [10]. Triticale cultivars are regularly tested for susceptibility to common bunt and still cultivars seem resistant to common bunt but may show some susceptibility to dwarf bunt [11].
To date, 16 common bunt race specific resistance genes [12], referred to as Bt genes, and 23 quantitative trait loci (QTL) for common bunt resistance in wheat have been described. QTLs have been mapped to all three genomes of hexaploid wheat: 7, 12 and 4 QTLs on the A-, B- and D-genomes, respectively by using biparential mapping populations of hexaploid wheat. There are 8 QTLs mapped to chromosome 1: QBt.ifa-1AL on the long arm of 1A [13]; QCbt.crc-1B.1 and QCbt.crc-1B.2 both on the short and long arm of chromosome 1B [14]; QBt.ifa-1BS on the short arm of 1B [13]; Xgwm 374a on 1BS [15]; QCbt.spa-1B on 1B [16]; Xgwm273a on 1B [17]; QCbt.dms-1B.2 on 1B [18]; one on wheat chromosome 3: QCbt.dms-3A [18]; two on chromosome 4: QCbt.spa-4B on 4B and QCbt.spa-4D on 4D [16]; three on chromosome 5: QCbt.spa-5A on 5A [19], Xgwm408a on 5B [19], QCbt.spa-5B on 5B [16] and one on chromosome 6: QCbt.spa-6D on 6D [16]. Eight QTLs are mapped to chromosome 7: QCbt.crc-7A on 7AL [14], Xpsp3050a on 7A [17], QCbt.spa-7A on 7A [19], QBt.ifa-7AL on 7AL [13], Xgwm43a on 7B [17], QCbt.spa-7B.1 on 7B [20], QCbt.spa-7D on 7D [16] and QBt.ifa-7DS on 7DS [21]. In addition, a less stable QTL was mapped to chromosome 2A [19], which means genes spread out on the entire hexaploid wheat genome contributes to the resistance towards common bunt, but most QTLs are from the B genome and located either on chromosome 1 or 7.
For QTL mapping of resistance to common bunt, an alternative to the above use of bi-parental cross is a genome-wide association study (GWAS) of a large collection of genotyped wheat lines. Here we present the results of screening and scoring for common bunt resistance in a collection of 248 wheat accessions of landraces and cultivars with a release year from 1883 to 2010, more than 100 years of wheat breeding and production. The identification by a mixed model association study of two QTLs for common bunt resistance is also reported. As for other plant pathogens, replacing phenotyping in the field with molecular markers for selection would be of enormous benefit.

2. Materials and Methods

2.1. Plant Materials

A population of 248 wheat accessions (Table S1) consisting of 32 spring wheats, 191 winter wheats and 25 wheats with unknown vernalization requirements were tested for their resistance reaction towards common bunt under field conditions during two years (2011 and 2012) in Mariager (56°39′ N 10°01′ E), Denmark. Wheat accessions were mostly Triticum aestivum of Central (101 accessions), Northern (62 accessions) and Western European (31 accessions) origin. Furthermore, 35 wheat accessions from the National Small Grains Gene Bank (Aberdeen, ID, USA) carrying common bunt resistance genes Bt1–Bt13 [22] were included. The origin of 19 wheat accessions was not known. The collection comprised 41 landraces, as well as 189 commercial varieties with release dates ranging from years 1886 to 2010. Part of the collection has been described elsewhere [23].

2.2. Phenotyping Reaction to Common Bunt

Common bunt teliospores were originally received from Bent J. Nielsen (Aarhus University, Flakkebjerg, Denmark) as a bulk collected from various sites in Denmark, representing the virulence spectrum present in the country. Spores was multiplied on susceptible varieties for two years prior to the experiment. Fifty to 80 seeds of each accession were sown in 1 m rows in two replications each year. Seeds were inoculated by dusting them with common bunt teliospores and shaking off excess spores prior to sowing. This is estimated to equal about 500,000 spores/gram seed. Winter wheat accessions and wheat accessions with unknown vernalization requirements were sown in early October. Sowing of spring wheat accessions was carried out in early spring. Resistance was scored in the early summer after the heading stage as the percentage of wheat spikes with at least one bunt sorus. Common bunt scores per line were averaged across replications for each year. Prior to association analysis, data were log transformed to two different scales (Table S2). For one scale, the percentage scores were log transformed onto a scale ranging from 1–9 (corresponding to 0–100% infection) using the formula; loginfec = ln(Perc_infect + 1.6718) ∗ 1.94731. For the other scale (log1–2 scale), percent infections scores of 0 or 1 were transformed into 1, while all other scores were transformed to 2 (Table S2). Log transformations were chosen because they effectively compress high, and expand low infection scores, a property that reflects our higher interest to differentiate between low common bunt infections. When searching for resistance polymorphisms, there is a higher interest to differentiate between, e.g., 10% and 5% infection, and a lesser interest to differentiate between higher infection levels, e.g., 70% and 65% infection.

2.3. Statistical Analysis

In order to test for the genetic influence of the 248 wheat accessions and the environmental impact on common bunt resistance reactions, the following model was used for the estimation of variances:
µi,j = µ + Gi + Yj + (GY)ij + ε
where µi,j represents the common bunt disease score of accession i in year j, and Y, G and GY represent the random year effect, the random genotype effect, and their interaction, respectively. The vector of residuals is denoted ε. A model reduction step based on the Bayesian information criterion (BIC) was used to ensure the significance of model terms. A correlation test was performed for the disease scores in the years of 2011 and 2012.

2.4. Genotyping and Genome-Wide Association Analysis

Plant DNA was extracted as described by Orabi et al. 2014 [23]. Genotyping of wheat accessions with ~7000 DArT markers [24] was performed by Triticarte Pty. Ltd. (Canberra, Australia), who also provided a genetic map indicating marker locations for the majority of markers (https:/www.diversityarrays.com/technology-and-resources/genetic-maps) accessed on 25 February 2022 and marker sequences obtained from https://www.diversityarrays.com/seq2download/DArT_Wheat.fasta accessed on 25 February 2022 and used to search wheat genome sequence. Markers with minor allele frequencies of less than 5% were excluded from analysis, and missing alleles were imputed using the R statistical software [25] (R Core Team 2013) package scrime [26] by using the five genetically closest accessions as a reference. The level of population stratification present in the 248 wheat accessions was estimated via principal component analysis [27] using the R package Gapit [28], and via Bayesian inference using the program Structure [29]. Structure was run with 9999 burn-ins and 50,000 repeats under the no admixture assumption testing for 1–10 sub-populations. Runs were repeated 10 times and the number of sup-populations was inferred according to Evanno et al. 2005 [30]. Multidimensional scaling of the inverse of an EMMA [31] kinship matrix was used to visualize population stratification.
Marker trait associations were investigated for each year independently as well as for the average scores over the two years using the R package Gapit [28], which employs compressed mixed linear models [32]:
y= Wv + Xβ + Zu +ε
where y is a vector containing common bunt resistance scores, v and β are fixed effects for marker and population effects, respectively, and u is a random effect representing wheat accessions. W, X and Z are the design matrices for v, β and u, respectively, and ε is a vector of the residual error. Fitting the wheat accessions as random effects allows the fit of their kinship matrix as the variance-covariance matrix G as 22, where K is the kinship matrix calculated from genetic markers, and σ2 is an unknown genetic variance. The fixed effects β may be derived from principal component analysis or from Structure. Gapit employs two approaches to ease the computationally demanding task of solving mixed models: compression of genotypes into groups and a two-step approach to reduce variance estimation [32]. The final model was chosen based on the BIC for the inclusion of fixed effects β for population stratification (Model 2) and a likelihood ratio test for the optimum compression level. Model validity was visually assessed by quantile-quantile plots (QQ-plots), plotting the observed −log10 transformed p-values of marker trait associations against expected values of a −log10 transformed uniform distribution ranging from 0 to 1. The strength of marker trait associations was given as a p-value of the probability of observing a similar value under the hypothesis of no marker trait association. Permutation tests [33] and false discovery rate [34] adjusted q-values [35] were used to derive thresholds for the declaration of significant marker trait associations. The final model was permutated 20,000 times using the R sample algorithm to shuffle the phenotypic data. Marker trait associations were considered significant if their p-value exceeded the 95 percentile of the p-values obtained by permutations and had q-values of less than 0.05. For graphical display p-values were −log10 transformed. The allelic effect of the marker alleles were given as best linear unbiased estimates (BLUEs) extracted from Model (2). The R package genetics [36] was used to estimate the linkage disequilibrium parameter r2. Linkage disequilibrium was calculated separately for markers on the same chromosomes and for markers on different chromosomes (syntenic and unlinked r2, respectively). The 95 percentile of the unlinked r2 values was taken as a critical value above which syntenic r2 values were considered to be truly due to physical linkage. Syntenic linkage disequilibrium was plotted against map distance, and a smoothing curve was fitted with a generalized additive model using the geom_smooth method of the R package ggplot2 [37]. The intersection of the smoothing curve with a horizontal line drawn at the 95 percentile of the unlinked r2 values was used to estimate the extent of linkage disequilibrium for selected chromosomes [38].

3. Results

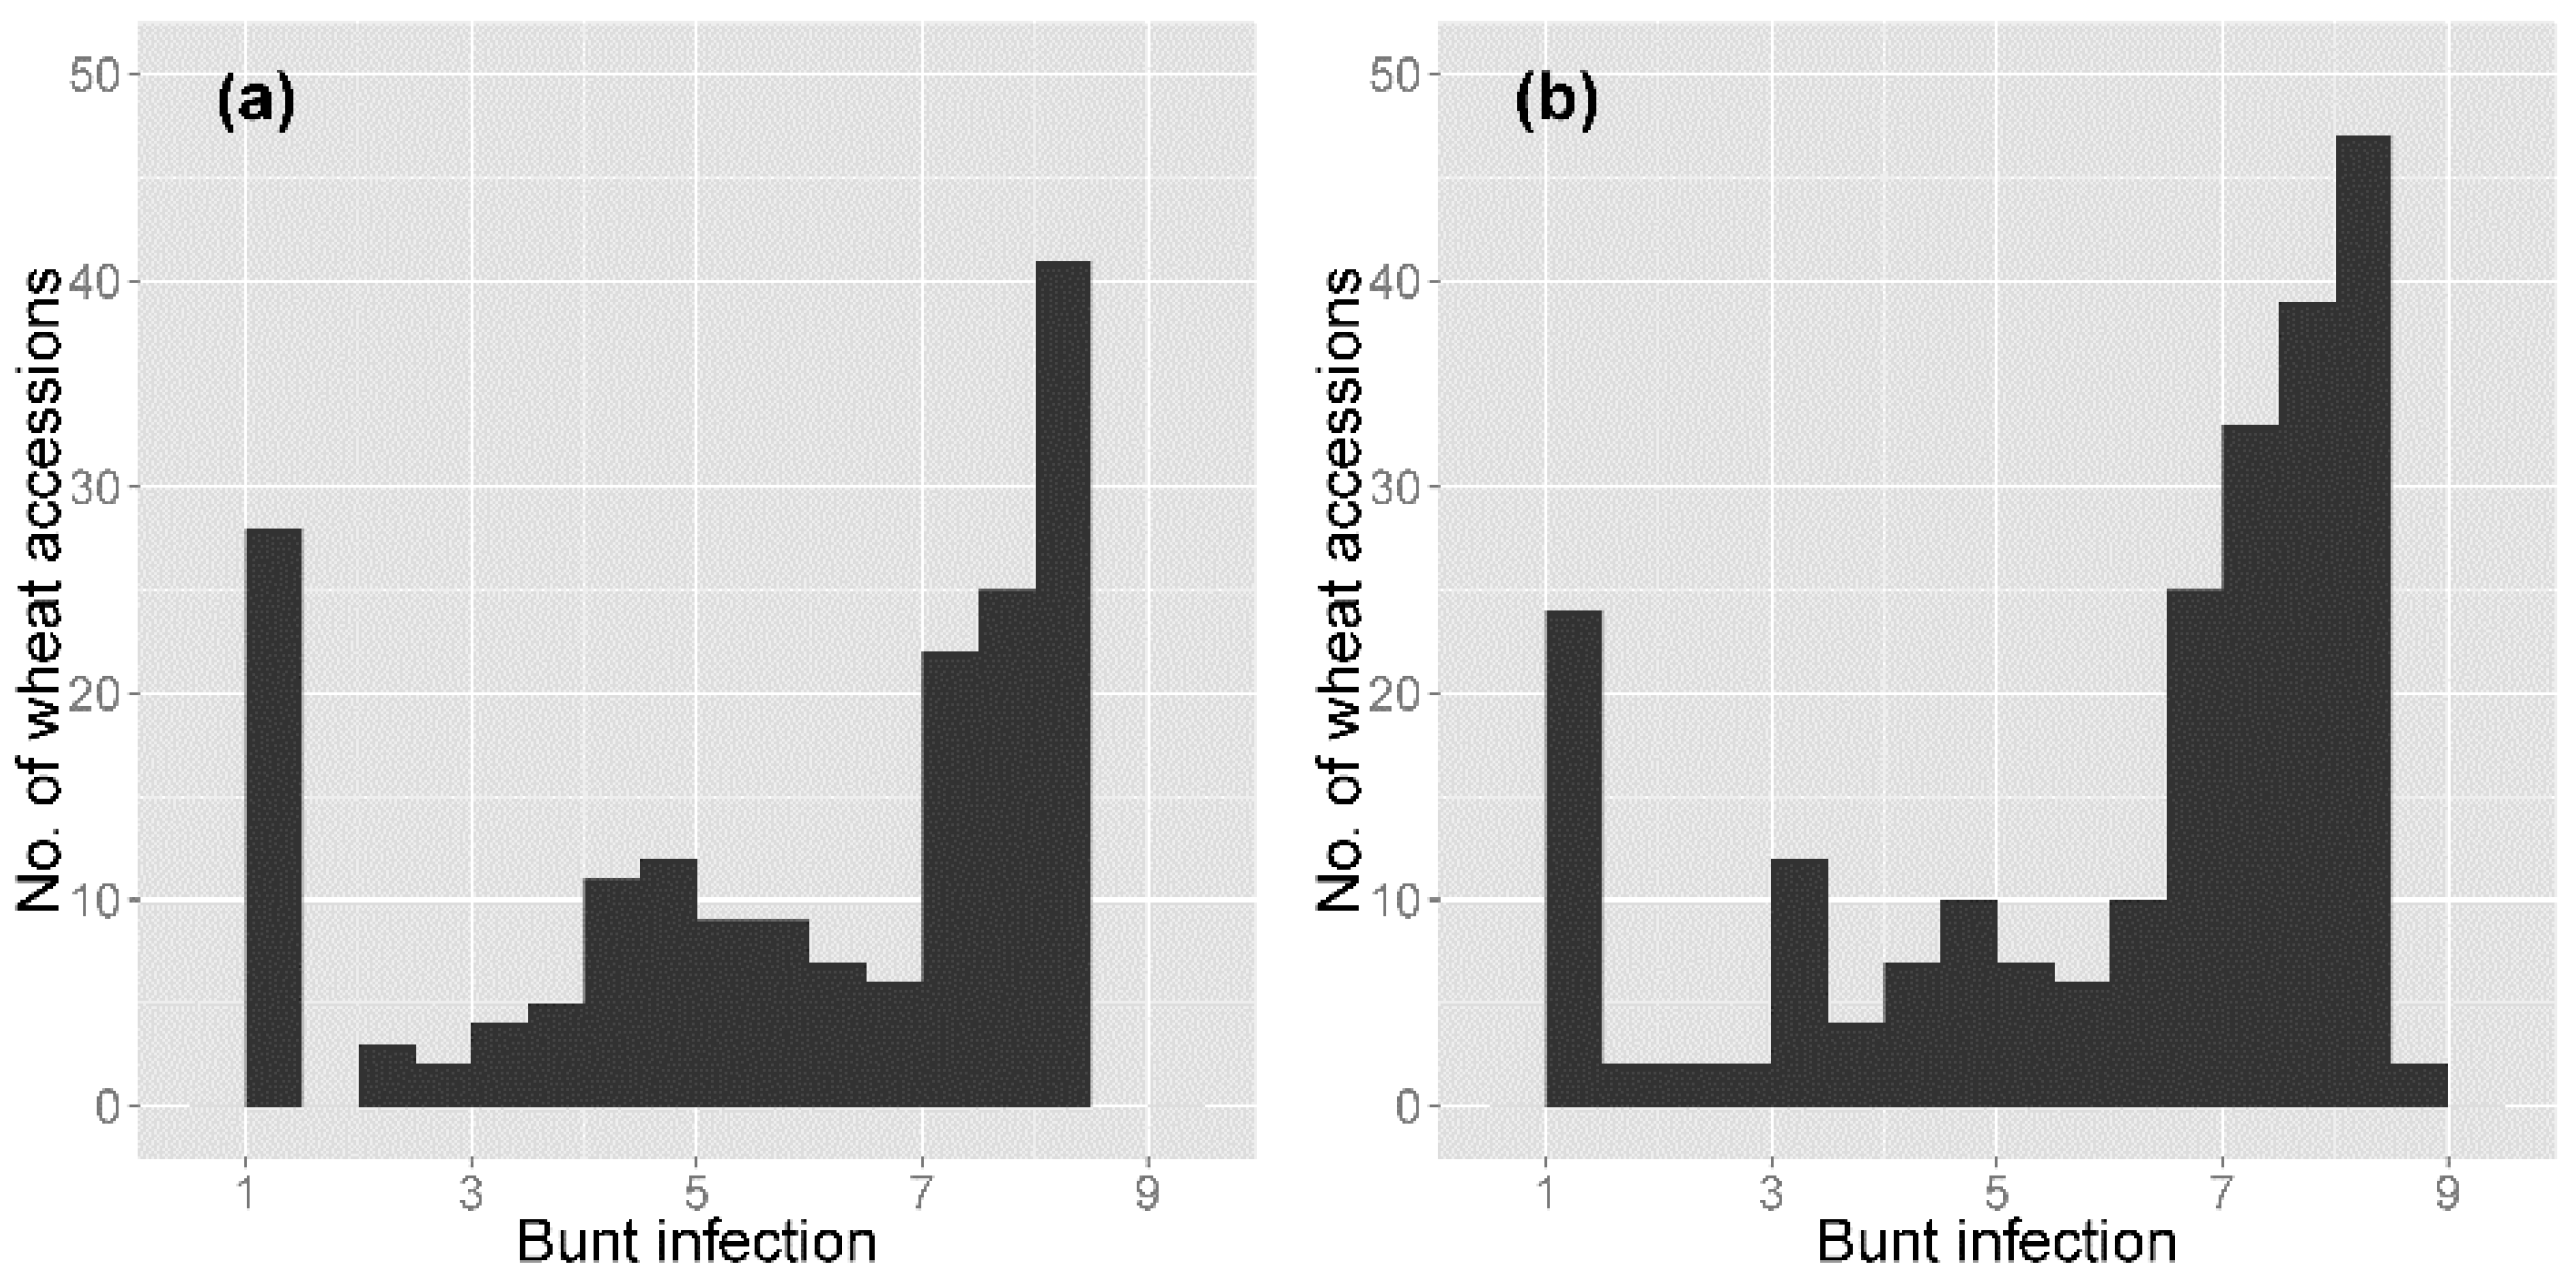
3.1. Common Bunt Infection Scoring

Bunt resistance assessments were successful in 2011 and 2012, with a higher bunt incidence in 2011 (Table 1 and Figure 1). From a total of 248 accessions, 229 were scored for bunt infection both years and 234 and 243 accessions could be scored in 2011 and 2012, respectively. The majority of wheat accessions were highly susceptible to common bunt, with 25 out of 248 wheat accessions having less than 10% infection across the two years (Figure 1). The correlation between bunt scores from the years 2011 and 2012 was high and significant (r2 = 0.64, p ≤ 0.001). Formula (1) estimated that 70% of the phenotypic variation could be attributed to genotype effects. Genotype by year interactions was estimated to explain 11% of the phenotypic variation. The effect of the year was weak, explaining only 4% of the observed phenotypic variation, leaving a residual variation of 14%. Average temperatures during the two months after fall sowing were lower in 2010 than in 2011, with average temperatures for the months October and November being 8.6 and 2.3 in 2010 and 9.7 and 6.9 in 2011, respectively [39] (Danmarks Meteorologisk Institut 2014).

3.2. Genome-Wide Analysis of Common Bunt Resistance

Genotyping of 248 wheat accessions with ∼7000 DArT markers yielded 1825 polymorphic markers. Marker density varied considerably across chromosomes, and ranged from 2 markers on wheat chromosome 5D to 132 markers on chromosome 3B (Table 2). Out of the 1825 markers, 1452 had been mapped by Triticarte Pty. Ltd., 250 were not mapped, and 123 were mapped to more than one chromosome. The frequency of missing marker alleles prior to imputation was 1.9%. Bayesian clustering suggested the presence of either 2 or 5 sub-populations (Figure S1). However, likelihood ratio tests between models incorporating population effects β and models without fixed effects other than molecular markers, were in favor of the latter, simpler models. Thus, the final model only used a kinship matrix to correct for population stratification. Based on kinship, lines were assigned to 62 groups (Table S3) prior to association analysis. QQ-plots indicated a good fit of the final models (Figure S2).
A genome wide association analysis identified 2 QTLs for common bunt resistance in 248 wheat accessions (Figure 2; Table 3), located on chromosomes 2B (QCbt.cph-2B at 9.1 Mb and 8.6 Mb) and 7A (QCbt.cph-7A at 444.4 Mb). Table 3 gives detailed information about locations, significance thresholds and effects of the QTL. QCbt.cph-2B was identified by two linked markers (r2 = 0.75) and was identified in the year 2011 using the log1–9 disease scoring scale. However, it could not be detected in either the analysis for the year 2012 or in the scores averaged across the years 2011 and 2012. QCbt.cph-7A could only be identified when analyzing the mean common bunt score for the years 2011 and 2012 on the log1–2 scale, neither in 2011 nor in 2012 alone. The 95th percentile of linkage disequilibrium between markers on different chromosomes was estimated as r2 = 0.05 and linkage disequilibrium was estimated to extend for 8 cM on chromosome 2B, and for 4 cM on chromosome 7A (Figure S3).

4. Discussion

4.1. Reaction to Common Bunt in the Field

We successfully determined and quantified common bunt resistance reactions in 248 wheat accessions during two years and identified two QTLs for common bunt resistance using a mixed model association mapping approach. Our common bunt infection method yielded consistent results for two consecutive years under field conditions. Wheat accessions explained the majority of the observed phenotypic variation, the effect of the years was estimated to be low, and the correlation between the common bunt assessment values in 2011 and 2012 was high. However, we observed significant differences between the two years in our power to detect marker trait associations. The reason for our inability to detect any association in 2012 might be two-fold: low levels of resistance in our populations and disease escape due to unfavorable weather conditions. The general level of resistance to common bunt in our populations of 248 wheat accessions was low. Less than 10% of the germplasm used in this study exhibited good levels of resistance, and the majority of lines seemed to possess no resistance to common bunt at all. Concerning the weather conditions, the relatively milder winter preceding the common bunt assessment in 2012 might be the cause of the lower level of common bunt infection observed in 2012. It is known that the temperature at sowing time and shortly after influences the infection rate of common bunt in wheat (Swinburne 1963), and we suspect that some accessions might have escaped infection by winning the time race between seedling development and growth of fungal hyphae. Fungal establishment at the meristematic tissue of the seedling is a crucial step in the wheat common bunt pathosystem [7], and warmer weather conditions might allow a fast establishment of the juvenile seedling, and prevent fungal establishment at the seedlings’ growing points. We thus suspect that the combination of low number of resistant accessions together with the presence of disease escape amongst some wheat accessions prevented us from the discovery of any significant marker trait associations in 2012.

4.2. Distribution of Polymorphic Markers

Out of ~7000 DArT markers we found 1825 marker alleles to be polymorphic amongst our 248 wheat accessions. It has been shown that DArT markers may be clustered in close proximity [41], and do not cover the wheat chromosomes evenly. However, potentially promising in our search for a QTL for common bunt resistance is that DArT marker sequence analysis could show that DArT markers may be linked to plant resistance genes as indicated by leucine-rich repeat domains [42]. Although we observed differences in marker coverage amongst the chromosomes of the A and B genome, the number and spacing of DArT markers on those genomes was considerably better than on the chromosomes of the D genome. Here, the number of polymorphic loci and their spacing on the chromosomes was too poor to claim that we fully covered the wheat D genome. Clearly, the DArT marker coverage of the D genome, harboring two Bt genes, needs to be improved.

4.3. Genome Wide Association Analysis

It is known that population stratification may cause spurious MTA, and if not accounting for population structure in GWAS may lead to an increased number of false positive marker trait associations [31,43,44]. We believe that the effect of population stratification might differ in its influence from trait to trait and that model selection steps are necessary for each trait separately in order to determine proper model parameters. Having conducted model selection steps based on likelihood tests and the BIC, and after assessing model fits, we are confident that the incorporation of a kinship matrix successfully captured population stratification in our collection of wheat accessions. The relatively low extent of intra chromosomal linkage disequilibrium observed in our study was taken as another indicator of low levels of population stratification.
It should not be forgotten though that the price to pay for eliminating most if not all false positive associations by correcting for population stratification might be a loss of power to detect true associations, if such true associations are strongly correlated with sub-population membership of plants [44]. However, it was shown that in the presence of a weak correlation between MTA and population stratification, the use of a compressed mixed linear model can improve statistical power to detect true marker trait associations [45].
Various thresholds for the declaration of significant marker trait associations have been reported. We used two methods to derive thresholds: permutation tests [33], and false discovery rate correction [35], which both led to the same conclusions. The conceptual beauty of using permutation tests lies in the fact that conclusions drawn from them will be solely based on the data without assumption about their underlying structure, and it is not so much their computational burden, running the final models 20,000 times with permutated data took about 24 h, which might give rise to question their use, as it is a concern about the validity of permuting data in the presence of structured populations [46]. Since our final model did not include fixed population effects, we considered permutation tests appropriate in the context of our study. Yet, we do not advocate the general use of permutation tests in association studies.

4.4. QTLs Identified for Common Bunt Resistance

The fact that QCbt.cph-7A could only be detected on the log1–2 scale and at low minor allele frequency made us hypothesize that it might be connected to a Bt gene. Amongst the lines carrying its favorable allele are gene bank accessions carrying genes Bt8, Bt9, Bt10 and Bt13 (data not shown). Resistance genes Bt9 and Bt10 are located on wheat chromosome 6D [47,48], and Bt8 close to Bt10 [49] leaving us to speculate that QCbt.cph-7A might correspond to common bunt resistance gene Bt13. Four QTLs for common bunt resistance on wheat chromosome 7A were previously reported [12,13,14,19]. A comparison of marker locations on physical maps of the wheat genome led us to believe that QCbt.cph-7A is a novel QTL. DArT markers flanking QCbt.cph-7A have been mapped to the short arm of chromosome 7A in deletion bin 7AS5-0.59-0.89 [50], while the four previously described QTL, QCbt.crc-7A, “Xpsp3050a”, QCbt.spa-7A and QBt.ifa-7AL are located on the long arm of chromosome 7A [12,13,14,19]. We thus concluded that QCbt.cph-7A is a different resistance factor.
The QCbt.cph-2B was mapped to chromosome 2 on the B-genome and is to our knowledge the first QTL for common bunt mapped to 2B, while Q.DB.ui-2B also detected on 2B is for dwarf bunt [51]. However, the DArT markers flanking this dwarf bunt QTL were separated by more than 100 cM from the QCbt.cph-2B peak, at the map used in our study indicating that they are different resistance factors for bunt. No Bt gene or QTL have been mapped to 2B. A less stable QTL was mapped to chromosome 2 on the A-genome by [19] and one of the 16 Bt resistance genes Bt1 was associated to chromosome 2B as early as 1960 using nullilisomic lines [52], substantiating that group 2 chromosomes may also contribute more than one resistance factor towards common bunt.
Association studies have also been carried out using 125 synthetic hexaploid lines originating from crosses of tetraploid wheats with 25 different Ae. tauschii accessions [53] and identified 15 SNPs, some of which were on 2B and 7A. In another study, a dedicated collection of 344 genotypes from breeding nurseries assembled based on pre-knowledge of presence of resistance genes Bt1 to Bt15 and Btp identified in addition to the known genes many new SNPs associations, some of which may be associated with the known Bt genes [54]. In a bread wheat collection, associations to dwarf bunt resistance were identified [55]. Taken together with the present GWAS of cultivars release over the last 130 years shows that many resistance factors to common bunt exist and that exploring those molecular markers for marker assisted selection may be used in the future to reduce or replace field or greenhouse evaluation.

Supplementary Materials

The following supporting information can be downloaded at: https://www.mdpi.com/article/10.3390/agronomy12030642/s1, Figure S1: Multidimensional scaling of a collection of 248 wheat accessions genotyped with 1825 DArT markers. Data points highlighted according to Bayesian clustering (Structure) inferred membership of wheat accessions in (a): 2 and (b): 5 sub-populations. Wheat accessions assigned with less than 50% membership to any cluster are indicated as “n.a”. Figure S2: QQ-plots indicating model fit in an association study utilizing compressed mixed linear models for common bunt resistance data from (a): the year 2011 (log1–9 scale) and (b): the mean of the years 2011 and 2012 (log1–2 scale). Figure S3: Linkage disequilibrium plotted against distance for chromosomes (a): 2B, and (b): 7A. The horizontal line indicates the 95 percentile of linkage disequilibrium observed between marker residing on different chromosomes. The smoothing line is derived from a generalized additive model [37]. Their intersection is as an indicator for the extend of linkage disequilibrium. Table S1: Wheat accessions, origin, release year, growth type (winter-, spring- or intermediate-type). Table S2: Relationship between percent infection with common bunt and log transformed scales log1–9 and log1–2, respectively. Table S3: Genomic breeding value for common bunt resistance of 248 wheat lines genotyped with 1824 DArT markers. The column designated “Group” indicates the grouping that was done by the compression step in Gapit. The column “BLUP” indicates the genomic breeding value, while “PEV” indicates the predicted error variance.

Author Contributions

The experiment was conceived by P.M.S., G.B., A.B. and S.K.R.; P.M.S. and A.B. carried out the phenotypic evaluation. Genotyping with SSR markers as well as analysis of phenotypic data, map construction and QTL analysis was carried out by P.M.S. and A.M.T. The manuscript was drafted by P.M.S., A.M.T. and S.K.R., and corrected and approved by all authors. All authors have read and agreed to the published version of the manuscript.

Funding

This research was funded by NaturErhvervstyrelsen: Bioteknologisk hvedeforædling til økologisk jordbrug (BioBreed), Grant Number 3304-FVFP-09-B-017-1.

Data Availability Statement

Data is available in supplementary files and by request to the authors.

Conflicts of Interest

The authors declare no conflict of interest.

References

  1. Blazkova, V.; Bartos, P. Virulence pattern of European bunt samples (Tilletia tritici and T-laevis) and sources of resistance. Cereal Res. Commun. 2002, 30, 335–342. [Google Scholar] [CrossRef]
  2. Martynov, S.P.; Dobrotvorskaya, T.V.; Sorokin, O.D. Comparative genealogical analysis of the resistance of winter wheat to common bunt. Russ. J. Genet. 2004, 4, 410–424. [Google Scholar] [CrossRef]
  3. Váñová, M.; Matusinsky, P.; Benada, J. Survey of incidence of bunts (Tilletia caries and Tilletia controversa) in the Czech Republic and susceptibility of winter wheat cultivars. Plant Prot. Sci. 2006, 42, 21–25. [Google Scholar] [CrossRef] [Green Version]
  4. Waldow, F.; Jahn, M. Investigations in the regulation of common bunt (Tilletia tritici) of winter wheat with regard to threshold values, cultivar susceptibility and non-chemical protection measures. J. Plant Dis. Prot. 2007, 114, 269–275. [Google Scholar] [CrossRef]
  5. Ciuca, M.; Saulescu, N.N. Screening Romanian Winter Wheat Germplasm for Presence of Bt10 Bunt Resistance Gene, Using Molecular Markers. Rom. Agric. Res. 2008, 25, 1–5. [Google Scholar]
  6. Slinkard, A.E.; Elliott, F.C. The Effect of Bunt Incidence on the Yield of Wheat in Eastern Washington. Agron. J. 1954, 46, 439–441. [Google Scholar] [CrossRef]
  7. Swinburne, T.R. Infection of wheat by Tilletia caries (DC.) TUL.; the causal organism of bunt. Trans. Br. Mycol. Soc. 1963, 46, 145-IN12. [Google Scholar] [CrossRef]
  8. Fernandez, J.A.; Duran, R.; Schafer, J.F. Histological Aspects of Dwarf Bunt Resistance in Wheat. Phytopathology 1978, 68, 1417–1421. [Google Scholar] [CrossRef]
  9. Padel, S.; Orsini, S.; Solfanelli, F.; Zanoli, R. Can the Market Deliver 100% Organic Seed and Varieties in Europe? Sustainability 2021, 13, 10305. [Google Scholar] [CrossRef]
  10. Skovmand, B.; Fox, P.N.; Villareal, R.L. Triticale in Commercial Agriculture: Progress and Promise. In Advances in Agronomy; Brady, N.C., Ed.; Academic Press: Cambridge, MA, USA, 1984; Volume 37, pp. 1–45. [Google Scholar] [CrossRef]
  11. Dumalasova, V.; Bartos, P. Reaction of wheat, alternative wheat and triticale cultivars to common bunt. Czech J. Genet. Plant Breed. 2010, 46, 14–20. [Google Scholar] [CrossRef] [Green Version]
  12. Goates, B.J. Identification of New Pathogenic Races of Common Bunt and Dwarf Bunt Fungi, and Evaluation of Known Races Using an Expanded Set of Differential Wheat Lines. Plant Dis. 2012, 96, 361–369. [Google Scholar] [CrossRef] [PubMed] [Green Version]
  13. Muellner, A.E.; Buerstmayr, M.; Eshonkulov, B.; Hole, D.; Michel, S.; Hagenguth, J.F.; Pachler, B.; Pernold, R.; Buerstmayr, H. Comparative mapping and validation of multiple disease resistance QTL for simultaneously controlling common and dwarf bunt in bread wheat. Theor. Appl. Genet. 2021, 134, 489–503. [Google Scholar] [CrossRef] [PubMed]
  14. Fofana, B.; Humphreys, D.G.; Cloutier, S.; McCartney, C.A.; Somers, D.J. Mapping quantitative trait loci controlling common bunt resistance in a doubled haploid population derived from the spring wheat cross RL4452 x AC Domain. Mol. Breed. 2008, 21, 317–325. [Google Scholar] [CrossRef]
  15. Wang, S.; Knox, R.E.; DePauw, R.M.; Clarke, F.R.; Clarke, J.M.; Thomas, J.B. Markers to a common bunt resistance gene derived from ‘Blizzard’ wheat (Triticum aestivum L.) and mapped to chromosome arm 1BS. Theor. Appl. Genet. 2009, 119, 541–553. [Google Scholar] [CrossRef]
  16. Singh, A.; Knox, R.E.; DePauw, R.M.; Singh, A.K.; Cuthbert, R.D.; Kumar, S.; Campbell, H.L. Genetic mapping of common bunt resistance and plant height QTL in wheat. Theor. Appl. Genet. 2016, 129, 243–256. [Google Scholar] [CrossRef]
  17. Dumalasova, V.; Simmonds, J.; Bartos, P.; Snape, J. Location of genes for common bunt resistance in the European winter wheat cv. Trintella. Euphytica 2012, 186, 257–264. [Google Scholar] [CrossRef]
  18. Zou, J.; Semagn, K.; Chen, H.; Iqbal, M.; Asif, M.; N’Diaye, A.; Navabi, A.; Perez-Lara, E.; Pozniak, C.; Yang, R.C.; et al. Mapping of QTLs associated with resistance to common bunt, tan spot, leaf rust, and stripe rust in a spring wheat population. Mol. Breed. 2017, 37, 144. [Google Scholar] [CrossRef]
  19. Bokore, F.E.; Cuthbert, R.D.; Knox, R.E.; Singh, A.; Campbell, H.L.; Pozniak, C.; N’Diaye, A.; Sharpe, A.G.; Ruan, Y. Mapping quantitative trait loci associated with common bunt resistance in a spring wheat (Triticum aestivum L.) variety Lillian. Theor. Appl. Genet. 2019, 132, 3023–3033. [Google Scholar] [CrossRef] [Green Version]
  20. Knox, R.E.; Campbell, H.L.; Depauw, R.M.; Gaudet, D.; Puchalski, B.; Clarke, F.C. DNA markers for resistance to common bunt in ‘McKenzie’ wheat. Can. J. Plant Pathol. 2013, 35, 328–337. [Google Scholar] [CrossRef]
  21. Muellner, A.E.; Eshonkulov, B.; Hagenguth, J.; Pachler, B.; Michel, S.; Buerstmayr, M.; Hole, D.; Buerstmayr, H. Genetic mapping of the common and dwarf bunt resistance gene Bt12 descending from the wheat landrace PI119333. Euphytica 2020, 216, 83. [Google Scholar] [CrossRef]
  22. Goates, B.J. Bunt and Smut Disease of Wheat. In Bunt and Smut Disease of Wheat: Concepts and Methods of Disease Management; Wilcoxson, R.D., Saari, E.E., Eds.; CIMMYT: El Batán, Mexico, 1996; pp. 12–25. [Google Scholar]
  23. Orabi, J.; Jahoor, A.; Backes, G. Changes in allelic frequency over time in European bread wheat (Triticum aestivum L.) varieties revealed using DArT and SSR markers. Euphytica 2014, 197, 447–462. [Google Scholar] [CrossRef]
  24. Akbari, M.; Wenzl, P.; Caig, V.; Carling, J.; Xia, L.; Yang, S.Y.; Uszynski, G.; Mohler, V.; Lehmensiek, A.; Kuchel, H.; et al. Diversity arrays technology (DArT) for high-throughput profiling of the hexaploid wheat genome. Theor. Appl. Genet. 2006, 113, 1409–1420. [Google Scholar] [CrossRef] [PubMed]
  25. R Core Team. R: A Language and Environment for Statistical Computing. R Foundation for Statistical Computing. 2013. Available online: http://www.R-project.org/ (accessed on 16 December 2016).
  26. Schwender, H.; Fritsch, A. scrime: Analysis of High-Dimensional Categorical Data such as SNP Data. 2013. Available online: http://CRAN.R-project.org/package=scrime (accessed on 16 December 2016).
  27. Price, A.L.; Patterson, N.J.; Plenge, R.M.; Weinblatt, M.E.; Shadick, N.A.; Reich, D. Principal components analysis corrects for stratification in genome-wide association studies. Nat. Genet. 2006, 38, 904–909. [Google Scholar] [CrossRef] [PubMed]
  28. Lipka, A.E.; Tian, F.; Wang, Q.S.; Peiffer, J.; Li, M.; Bradbury, P.J.; Gore, M.A.; Buckler, E.S.; Zhang, Z.W. GAPIT: Genome association and prediction integrated tool. Bioinformatics 2012, 28, 2397–2399. [Google Scholar] [CrossRef] [PubMed] [Green Version]
  29. Pritchard, J.K.; Stephens, M.; Donnelly, P. Inference of population structure using multilocus genotype data. Genetics 2000, 155, 945–959. [Google Scholar] [CrossRef]
  30. Evanno, G.; Regnaut, S.; Goudet, J. Detecting the number of clusters of individuals using the software STRUCTURE: A simulation study. Mol. Ecol. 2005, 14, 2611–2620. [Google Scholar] [CrossRef] [Green Version]
  31. Kang, H.M.; Zaitlen, N.A.; Wade, C.M.; Kirby, A.; Heckerman, D.; Daly, M.J.; Eskin, E. Efficient control of population structure in model organism association mapping. Genetics 2008, 178, 1709–1723. [Google Scholar] [CrossRef] [Green Version]
  32. Zhang, Z.W.; Ersoz, E.; Lai, C.Q.; Todhunter, R.J.; Tiwari, H.K.; Gore, M.A.; Bradbury, P.J.; Yu, J.M.; Arnett, D.K.; Ordovas, J.M.; et al. Mixed linear model approach adapted for genome-wide association studies. Nat. Genet. 2010, 42, 355–360. [Google Scholar] [CrossRef] [Green Version]
  33. Churchill, G.A.; Doerge, R.W. Empirical Threshold Values for Quantitative Trait Mapping. Genetics 1994, 138, 963–971. [Google Scholar] [CrossRef]
  34. Benjamini, Y.; Hochberg, Y. Controlling the False Discovery Rate—A Practical and Powerful Approach to Multiple Testing. J. Roy. Stat. Soc. B Met. 1995, 57, 289–300. [Google Scholar] [CrossRef]
  35. Storey, J.D.; Tibshirani, R. Statistical significance for genomewide studies. Proc. Natl. Acad. Sci. USA 2003, 100, 9440–9445. [Google Scholar] [CrossRef] [Green Version]
  36. Warnes, G.; Gorjanc, G.; Leisch, F.; Man, M. Genetics: Population Genetics. 2013. Available online: http://CRAN.R-project.org/package=genetics (accessed on 16 December 2016).
  37. Wickham, H. ggplot2: Elegant Graphics for Data Analysis; Springer: New York, NY, USA, 2009. [Google Scholar] [CrossRef]
  38. Breseghello, F.; Sorrells, M.E. Association mapping of kernel size and milling quality in wheat (Triticum aestivum L.) cultivars. Genetics 2006, 172, 1165–1177. [Google Scholar] [CrossRef] [PubMed] [Green Version]
  39. Danmarks Meteorologisk Institut. 2014. Available online: http://www.dmi.dk/vejr/arkiver/vejrarkiv/ (accessed on 4 April 2014).
  40. McIntosh, R.; Hart, G.E.; Devos, K.M.; Gale, M.D.; Rogers, W.J. Catalogue of Gene Symbols for Wheat. 1998. Available online: http://wheat.pw.usda.gov/ggpages/wgc/98/ (accessed on 29 June 2014).
  41. Semagn, K.; Bjornstad, A.; Skinnes, H.; Maroy, A.G.; Tarkegne, Y.; William, M. Distribution of DArT, AFLP, and SSR markers in a genetic linkage map of a doubled-haploid hexaploid wheat population. Genome 2006, 49, 545–555. [Google Scholar] [CrossRef] [PubMed] [Green Version]
  42. Marone, D.; Panio, G.; Ficco, D.B.M.; Russo, M.A.; De Vita, P.; Papa, R.; Rubiales, D.; Cattivelli, L.; Mastrangelo, A.M. Characterization of wheat DArT markers: Genetic and functional features. Mol. Genet. Genom. 2012, 287, 741–753. [Google Scholar] [CrossRef] [PubMed] [Green Version]
  43. Price, A.L.; Zaitlen, N.A.; Reich, D.; Patterson, N. New approaches to population stratification in genome-wide association studies. Nat. Rev. Genet. 2010, 11, 459–463. [Google Scholar] [CrossRef] [PubMed] [Green Version]
  44. Zhao, K.Y.; Aranzana, M.J.; Kim, S.; Lister, C.; Shindo, C.; Tang, C.L.; Toomajian, C.; Zheng, H.G.; Dean, C.; Marjoram, P.; et al. An Arabidopsis example of association mapping in structured samples. PLoS Genet. 2007, 3, e4. [Google Scholar] [CrossRef] [PubMed] [Green Version]
  45. Yu, J.M.; Pressoir, G.; Briggs, W.H.; Bi, I.V.; Yamasaki, M.; Doebley, J.F.; McMullen, M.D.; Gaut, B.S.; Nielsen, D.M.; Holland, J.B.; et al. A unified mixed-model method for association mapping that accounts for multiple levels of relatedness. Nat. Genet. 2006, 38, 203–208. [Google Scholar] [CrossRef]
  46. Muller, B.U.; Stich, B.; Piepho, H.P. A general method for controlling the genome-wide type I error rate in linkage and association mapping experiments in plants. Heredity 2011, 106, 825–831. [Google Scholar] [CrossRef] [Green Version]
  47. Steffan, P.M.; Torp, A.M.; Borgen, A.; Backes, G.; Rasmussen, S.K. Mapping of common bunt resistance gene Bt9 in wheat. Theor. Appl. Genet. 2017, 130, 1031–1040. [Google Scholar] [CrossRef] [Green Version]
  48. Menzies, J.G.; Knox, R.E.; Popovic, Z.; Procunier, J.D. Common bunt resistance gene Bt10 located on wheat chromosome 6D. Can. J. Plant Sci. 2006, 86, 1409–1412. [Google Scholar] [CrossRef]
  49. Christensen, D.; Borgen, A. Is Bt8 located at chromosome 6D and closely linked to Bt10? Virtual Bunt and Smut Workshop 5–6 May 2021. p. 14. Available online: https://bunt.boku.ac.at (accessed on 11 January 2022).
  50. Pont, C.; Murat, F.; Guizard, S.; Flores, R.; Foucrier, S.; Bidet, Y.; Quraishi, U.M.; Alaux, M.; Dolezel, J.; Fahima, T.; et al. Wheat syntenome unveils new evidences of contrasted evolutionary plasticity between paleo- and neoduplicated subgenomes. Plant J. 2013, 76, 1030–1044. [Google Scholar] [CrossRef] [PubMed] [Green Version]
  51. Chen, J.; Guttieri, M.J.; Zhang, J.; Hole, D.; Souza, E.; Goates, B. A novel QTL associated with dwarf bunt resistance in Idaho 444 winter wheat. Theor. Appl. Genet. 2016, 129, 2313–2322. [Google Scholar] [CrossRef] [PubMed] [Green Version]
  52. Sears, E.R.; Schaller, C.W.; Briggs, F.N. Identification of the chromosome carrying the martin gene for resistance of wheat to bunT. Can. J. Genet. Cytol. 1960, 2, 262–267. [Google Scholar] [CrossRef]
  53. Bhatta, M.; Morgounov, A.; Belamkar, V.; Yorgancılar, A.; Baenziger, P.S. Genome-wide association study reveals favorable alleles associated with common bunt resistance in synthetic hexaploid wheat. Euphytica 2018, 214, 200. [Google Scholar] [CrossRef]
  54. Mourad, A.M.I.; Sallam, A.; Belamkar, V.; Mahdy, E.; Bakheit, B.; El-Wafaa, A.A.; Baenziger, P.S. Genetic architecture of common bunt resistance in winter wheat using genome-wide association study. BMC Plant Biol. 2018, 18, 280. [Google Scholar] [CrossRef]
  55. Gordon, T.; Wang, R.; Hole, D.; Bockelman, H.; Bonman, J.M.; Chen, J. Genetic characterization and genome-wide association mapping for dwarf bunt resistance in bread wheat accessions from the USDA National Small Grains Collection. Theor. Appl. Genet. 2020, 133, 1069–1080. [Google Scholar] [CrossRef] [Green Version]
Figure 1. Histograms showing common bunt incidence in a collection of 248 wheat accessions. (a) in the year 2011; (b) averaged over 2011 and 2012.
Agronomy 12 00642 g001
Figure 2. ”Manhattan” plot indicating the strength of marker trait associations between 1825 DArT markers and common bunt resistance data from (a) the year 2011 (log1–9 scale), (b) the mean of the years 2011 and 2012 (log1–2 scale) in a population of 248 wheat accessions. The y-axis shows −log10 transformed p-values of the association test. Markers are grouped by A, B and D genome, respectively. Markers which were not mapped (n.m) or not unique (n.u) in their chromosomal locations are indicated. The dashed horizontal line indicates the 95th percentile of p-values from 20,000 permutations.
Agronomy 12 00642 g002
Table 1. Minimum, maximum and mean percent infection with common bunt in a collection of 248 wheat accessions. Infections are given for the years 2011 and 2012, and the average of the two years.
InfectionType2011 (%)2012 (%)Average (%)
Minimumspring12419
winter000
Maximumspring925460
winter1007382
Meanspring492536
winter432735
all442735
Table 2. Distribution of 1452 polymorphic DArT markers ordered by chromosomes. The chromosome name, the number n of markers per chromosome, the average distance between markers and the maximum distance between two markers are indicated. Summaries for the A, B and D genomes are given at the bottom.
Chromo-SomenAverage Distance (cM)Maximum Distance (cM)
1A1301.219.6
2A631.915.1
3A613.529.5
4A601.854.5
5A255.060.9
6A1250.934.5
7A852.128.9
1B931.215.1
2B1241.19.2
3B1321.012.9
4B333.527.1
5B762.120.7
6B1041.320.0
7B663.569.6
1D362.614.6
2D412.827.8
3D463.595.4
4D324.30
5D280.976.4
6D206.794.1
7D1271.456.3
A genome5492.360.9
B genome6282.069.6
D genome27517.595.4
Table 3. QTL for common bunt in a population of 248 wheat accessions. Given are the QTL designation, the name of the linked DArT marker (with chromosome and position (Pos.), the minor allele frequency (MAF), the year the QTL was observed, the log scale used in the association analysis, the p-value of the association test, the respective q-value, the 95th percentile of 20,000 permutation tests. The variance explained by the marker is given as the r2 of the difference between the model fit with and without that marker. Marker effects are given as BLUEs from Model. QTLs were named following the recommendation in [40].
QTLMarkerChr.Pos.
cM
Pos. MbpMAFYearScalepqP perm.r2Effect
QCbt.cph-2BwPt.7440222B10.8815910.412011Log1–90.000010.0160.000110.070.76
QCbt.cph-2BwPt.01002B4.216550.492011Log1–90.000060.0420.000110.060.68
QCbt.cph-7AtPt.62217A55.1343690.05MeanLog1–20.0000040.0050.000030.080.23
Publisher’s Note: MDPI stays neutral with regard to jurisdictional claims in published maps and institutional affiliations.

