Article

How Much Phosphorus Uptake Is Required for Achieving Maximum Maize Grain Yield? Part 1: Luxury Consumption and Implications for Yield

by
Chad J. Penn
1,*,
James J. Camberato
2 and
Matthew A. Wiethorn
2
1
National Soil Erosion Research Laboratory, USDA Agricultural Research Service, 275 S. Russell St., West Lafayette, IN 47907, USA
2
Department of Agronomy, Purdue University, West Lafayette, IN 47907, USA
*
Author to whom correspondence should be addressed.
Agronomy 2023, 13(1), 95; https://doi.org/10.3390/agronomy13010095
Submission received: 3 December 2022 / Revised: 20 December 2022 / Accepted: 21 December 2022 / Published: 28 December 2022
(This article belongs to the Section Soil and Plant Nutrition)

Abstract

:
Development of a more precise and process-based tool for making phosphorus (P) recommendations requires detailed understanding of plant P uptake needs. Future adaptation of a nutrient uptake model for this purpose must utilize a mass-balance approach. The objectives of this study were to determine the minimum P uptake mass required for achieving maximum grain yield of maize and to evaluate plant P partitioning over a range of P uptake. Three maize hybrids were grown under optimal conditions using sand-culture hydroponics for precise control of the root environment. Plants were grown to maturity with six different P concentrations followed by biomass and nutrient partitioning analysis of various maize parts. Phosphorus uptake occurred in three phases with two steps of luxury consumption; (i) increased uptake with increased grain yield and total biomass until maximum grain yield was attained at 580 mg P uptake, (ii) further P uptake with increase in total biomass until 730 mg P uptake, but with decrease in grain yield; and (iii) additional P uptake with little to no increase in total biomass and continued decrease in grain yield. Luxury consumption of P implies that excess P fertility is an economic drag for grain production.

1. Introduction

Accurate phosphorus (P) fertilizer recommendations are important for achieving optimum economic and agronomic efficiency, as well as reducing non-point losses of P to surface waters. Current P fertilizer recommendations are based on a generalized relationship between soil extractable P (e.g., Mehlich-1, Mehlich-3, Bray-1, Olsen, etc.) and crop yield. From this relationship, a critical soil test level is determined where further P fertilizer application will not increase yield. However, the empirical relationships on which these recommendations are based will vary with soil type, soil properties, and management (e.g., mineralogy, pH, organic matter, texture, tillage, etc.) [1,2,3,4]. Therefore, current empirically-based P fertilizer recommendations are only an approximation of the critical soil test level needed to optimize yield.
As an alternative to traditional soil testing, the use of a mechanistic nutrient uptake model such as the Barber-Cushman model [5] could potentially be incorporated into a nutrient management tool. Such models consider nutrient uptake in three phases: (i) supply of nutrient to the soil solution (i.e., solubility), (ii) movement of dissolved nutrient to the root surface, and (iii) uptake of nutrient by the root. Before such a model and mass-balance approach could be used to create a nutrient management tool, one must know the minimum nutrient uptake mass required for achieving maximum yield. Knowing this target value, soil conditions (e.g., extractable P, pH, etc.) can be adjusted in order to provide that mass of soluble nutrient to the root surface for uptake as predicted by such a model.
Determination of the minimum P uptake mass required for maximum yield requires precise control over the growing environment and nutrient bioavailability. Since P movement to roots is dominated by diffusion, root architecture has a profound impact on P uptake [6,7]. Thus, in order to avoid confounding factors that could occur due to diffusion differences between soil types and P stratification in the soil profile, it is useful to eliminate the effect of root architecture on P uptake. Similarly, bioavailability is impossible to control in soils because solubility is dictated by the equilibrium between soil P pools and solution; these pools equilibrate with solution via adsorption, desorption, precipitation, and dissolution reactions (i.e., buffering). The only technique for eliminating the impact of plant root architecture and variability in P supply and transport to/in solution is through use of a hydroponics system. In that scenario, P uptake is controlled by mass flow instead of diffusion, thereby allowing for precise control and elimination of P “locational availability” [5]. For these reasons, Wiethorn et al. [8] further developed a sand-culture system for studying nutrient uptake to physiological maturity (R6), in which all applied nutrients are 100% bioavailable due to the inert nature of the growing media. The authors demonstrated the ability of this system in controlling P bioavailability and producing maize plants that were similar to field-grown maize. By applying several different P concentrations in fertigation, Wiethorn et al. [8] showed a clear response to P using sand-culture hydroponics.
The objective of this study was to determine the minimum P uptake mass required for achieving maximum grain yield of maize and evaluate plant P partitioning over a range of P uptake through use of sand-culture hydroponics.

2. Materials and Methods

Three maize hybrids (P1197CYXR, D57VP51, and DKC64-69) were selected to represent maize from diversified genotypic backgrounds. This was accomplished by selecting maize hybrids from three different seed companies. Diversity in germplasm was desired to observe the effects of varying P treatment rate on maize hybrids from different origins. The hybrids P1197 and D57VP51 were selected based on a known history of high yield potential when grown commercially, and DKC64-69 was selected because it is known to produce adequate yields in P limited environments—specifically in high Ca soils. Although this study did not include analysis on gene expression, some inferences can still be made about how maize hybrids of varying background will respond to varying P treatment levels (i.e., insufficient P, sufficient P, and surplus P) by observing phenotypic variation of plant physical characteristics, grain yield, biomass yield, and nutrient content.
Plants were grown to maturity (R6) in a semi-automated growth room utilizing sand-culture hydroponics. Details of the room and conditions are found in Wiethorn et al. [8]. Briefly, all light was supplied by LED fixtures to provide approximately 1800 to 2000 μmoles m−2 s−1 at the surface of uppermost leaves, with varying photoperiod to simulate changing daylength starting from 15 May in Central Indiana (40.4237° N, 86.9212° W). Lights were raised on pulleys as plants grew taller. Daily temperatures and humidity were maintained from 25 to 35 °C and 50%, respectively. Night temperatures and humidity were maintained from 18 to 22 °C and 35%, respectively. The air was continuously mixed in the room by free standing, 0.5–1.0 m diameter oscillating pedestal fans. Plants were grown in 28 L pots containing approximately 30 kg of silica sand previously shown to be inert with regard to nutrient adsorption and desorption. The purpose of the sand was simply to provide a physical medium for root growth and anchoring. The inert nature was desired since it allowed the solution concentration to be controlled with precision and eliminated the effect of root architecture by essentially making all nutrient uptake dependent on mass flow only.
Three maize seeds were planted in each pot evenly spaced apart at a depth of 3.2 cm with the sand media at field capacity moisture. Water, P concentration treatments, and all other essential plant nutrients were provided to each pot through a 2 gallon per hour (7.6 L h−1) barbed drip emitter, (RainBird, Azusa, CA, USA). Solution timing and volume was controlled by an Irritrol RD1200-EXT-R solenoid irrigation timer (The Toro Company, Bloomington, MN, USA). Fertigation was 4 times daily to provide a total of ~0.5 to 0.6 L day−1 from seedling emergence to V5 and 1 L day−1 from V5-VT. After VT, 1 L de-ionized (DI) water per day was added in addition to 1 L of the fertigation solution.
All essential plant nutrients, other than P, were supplied at “sufficient” levels through the drip tubing with a single nutrient injector (Dosatron D14MZ520; Dosatron International, Inc., Clearwater, FL, USA). Target concentrations for N, K, S, Mg, Ca, Fe, Zn, B, Mn, Cu, and Mo were 180, 120, 74, 35, 80, 2, 0.05, 0.25, 0.25, 0.02, and 0.01 mg L−1, respectively. Nutrient solutions were made using lab-grade chemicals and de-ionized water (DI). To deliver nutrient P concentration treatments, 4, 8, 12, 15, 20, and 22 mg P L−1, concentrated P (from K2HPO4) in DI was injected into the fertigation system using six nutrient injectors (Dosatron model D25F1, 1:100 fixed ratio injector). Final solution pH was 7.1. There were four replications of each treatment.
Plants were harvested 120 days after planting and separated into stem (including tassel and cob), leaf (including husk), grain, and root. Plant tissues were weighed after drying at 65 °C for 5 d. Dried plant tissues were then ground to pass a 0.50 mm screen using a Thomas Wiley Mill model ED-5 (Arthur H. Thomas Co., Philadelphia, PA, USA). Plant tissue (2 g for grain and 1 g for other tissue types) were digested with 15 mL of concentrated nitric acid on a BD40HT graphite heating block (Lachat Instruments, Milwaukee, WI, USA) by heating to 140 °C for 60 min, followed by addition of 2 mL of 30% hydrogen peroxide, then continued heating for another 60 min at 160 °C, followed by a final heating cycle at 180 °C for 60 min. Digested samples were brought to a final volume of 25 mL with nanopure DI water and P, and determined with inductively coupled plasma atomic emission spectroscopy (ICP-AES; Optima 8300, Thermo Fisher Scientific Inc., Waltham, MA, USA). Resulting digestates for macronutrient and micronutrient analysis were tested without dilution and 7-fold dilution, respectively, in order to ensure values fell within standard curves. Concentrations of elements in plant tissue samples from ICP-AES analysis were used with sample weights to calculate mass uptake of nutrients. Grain yield was adjusted to 15.5% moisture content; all other plant parts are presented on a dry basis. Nutrient concentrations in all plant parts are presented on a dry weight basis.
Pots were arranged in a randomized split-block design in which hybrids were the main block and P treatments were randomized within blocks. Analysis of Variance (ANOVA) was performed using statistical analysis software (SAS version 9.4, 2016) for determining whether there was a significant (p ≤ 0.05) interaction between hybrid and P treatment for biomass, plant tissue P concentrations, and total P uptake. Because there were no such interactions, simple statistics (mean and standard deviation) are presented across hybrids within each P treatment, and also across P treatments within each hybrid. The PROC NLIN (i.e., non-linear) procedure of SAS was additionally conducted to estimate the “breakpoint” total P uptake mass in which there was a significant change in the relationship between total P uptake and grain yield, and total biomass. This was executed in two ways: fitting data to a linear-plateau and to a linear-linear equation, which was evaluated based on p-value and R2 of each model.

3. Results and Discussion

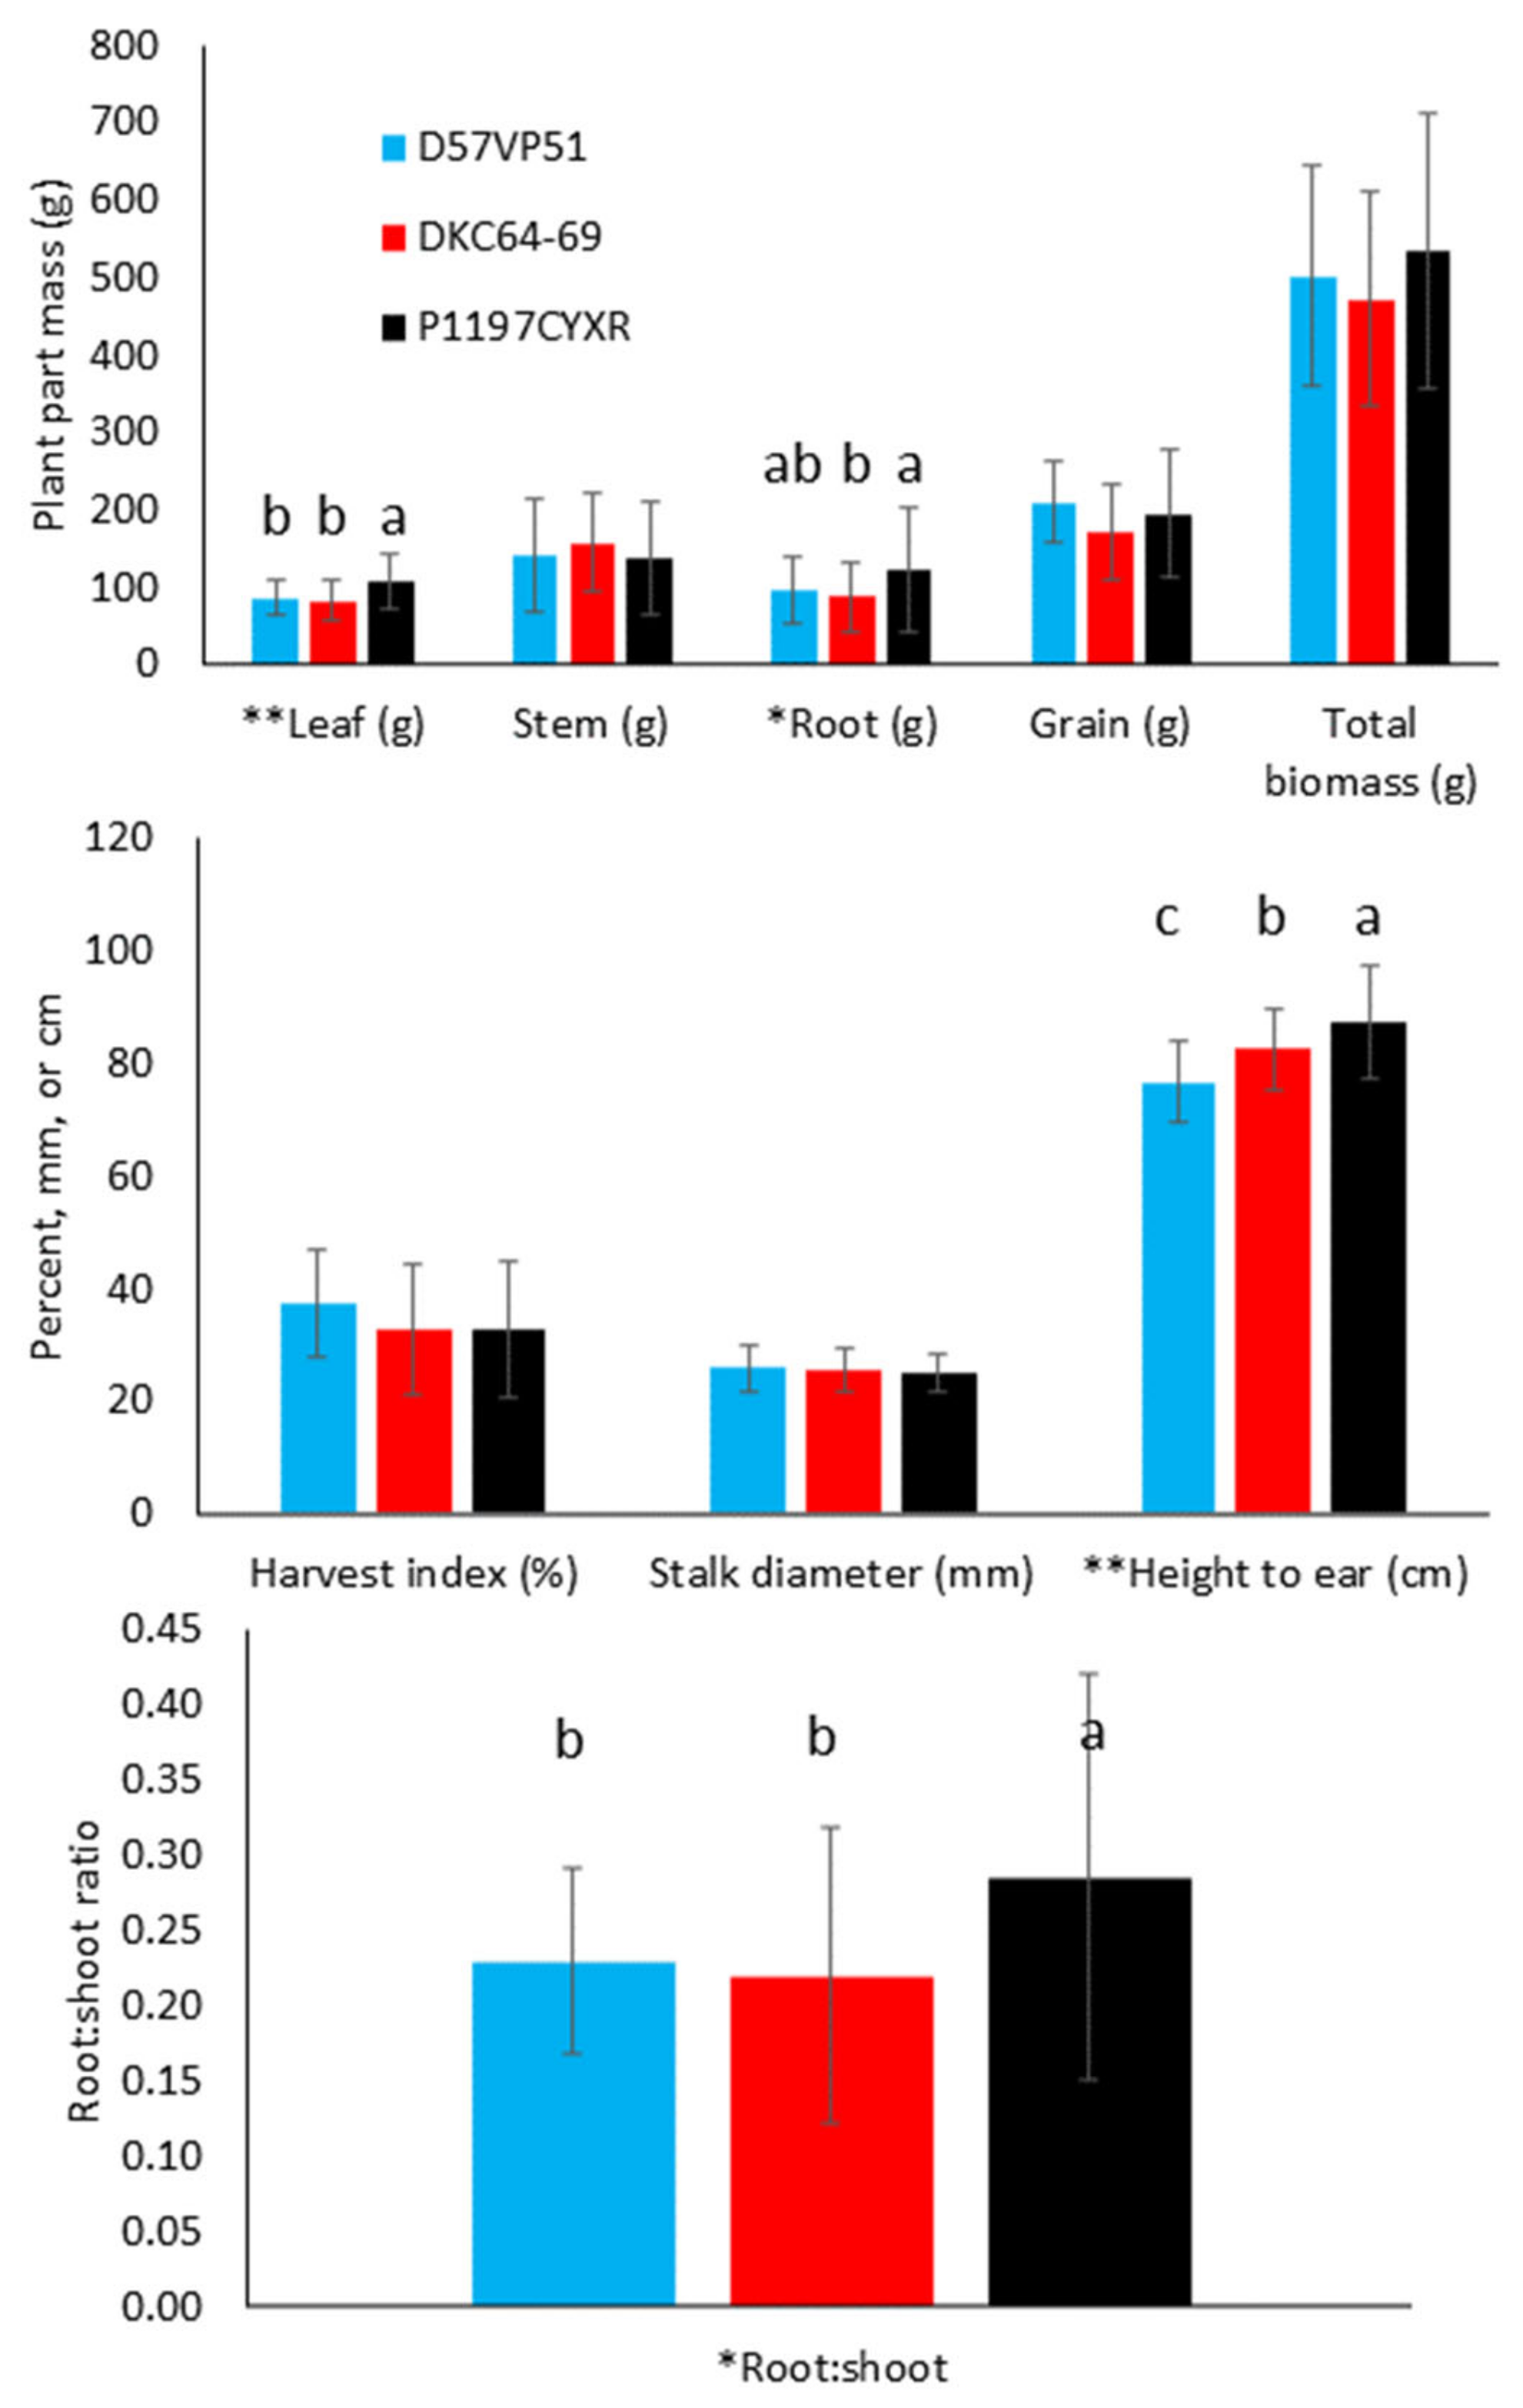
3.1. Effect of Hybrid

There were no significant interactions between P treatment and hybrid (p > 0.05) for plant part biomass (grain, stem, leaf, root, and total biomass), plant physical measurements (height, stem diameter), and P uptake. There were few significant differences among hybrids for plant part biomass (Figure 1). P1197CYXR was significantly greater in leaf components compared to the other two hybrids and for roots compared to DKC64-69. Height to ear was significantly different among hybrids: P1197CYXR > DKC64-69 > D57VP51. Wiethorn et al. [8] showed how this artificial growth system produced maize plants that were nearly identical (physically and chemically) to plants grown under ideal field conditions, with the exception of producing greater stem, leaves, and height, therefore producing slightly lower harvest index (HI) compared to the field.

3.2. Impact of Phosphorus Treatment

Regarding impact of P treatments, response variables (i.e., nutrient content and biomass for individual yield components) are mostly shown as a function of total P uptake rather than treatment solution P concentration. This is because treatment solution P concentrations in this sand-culture hydroponics system are meaningless in the context of soils due to the fact that the latter are well buffered and therefore require only a fraction of the solution P concentration to support adequate plant uptake [5]. Instead, examination of response variables as a function of total P uptake makes it universal across all soil types and systems. In addition, plotting response variables as a function of solution P concentration resulted in the exact same trend as for total P uptake and therefore does not change interpretation. Phosphorus treatments had a significant impact on the biomass of all maize plant parts (Table 1). Increased P addition via P concentrations in fertigation resulted in larger plants with more grain, until reaching a plateau (Table 1 and Figure 2); this is discussed in further detail below.

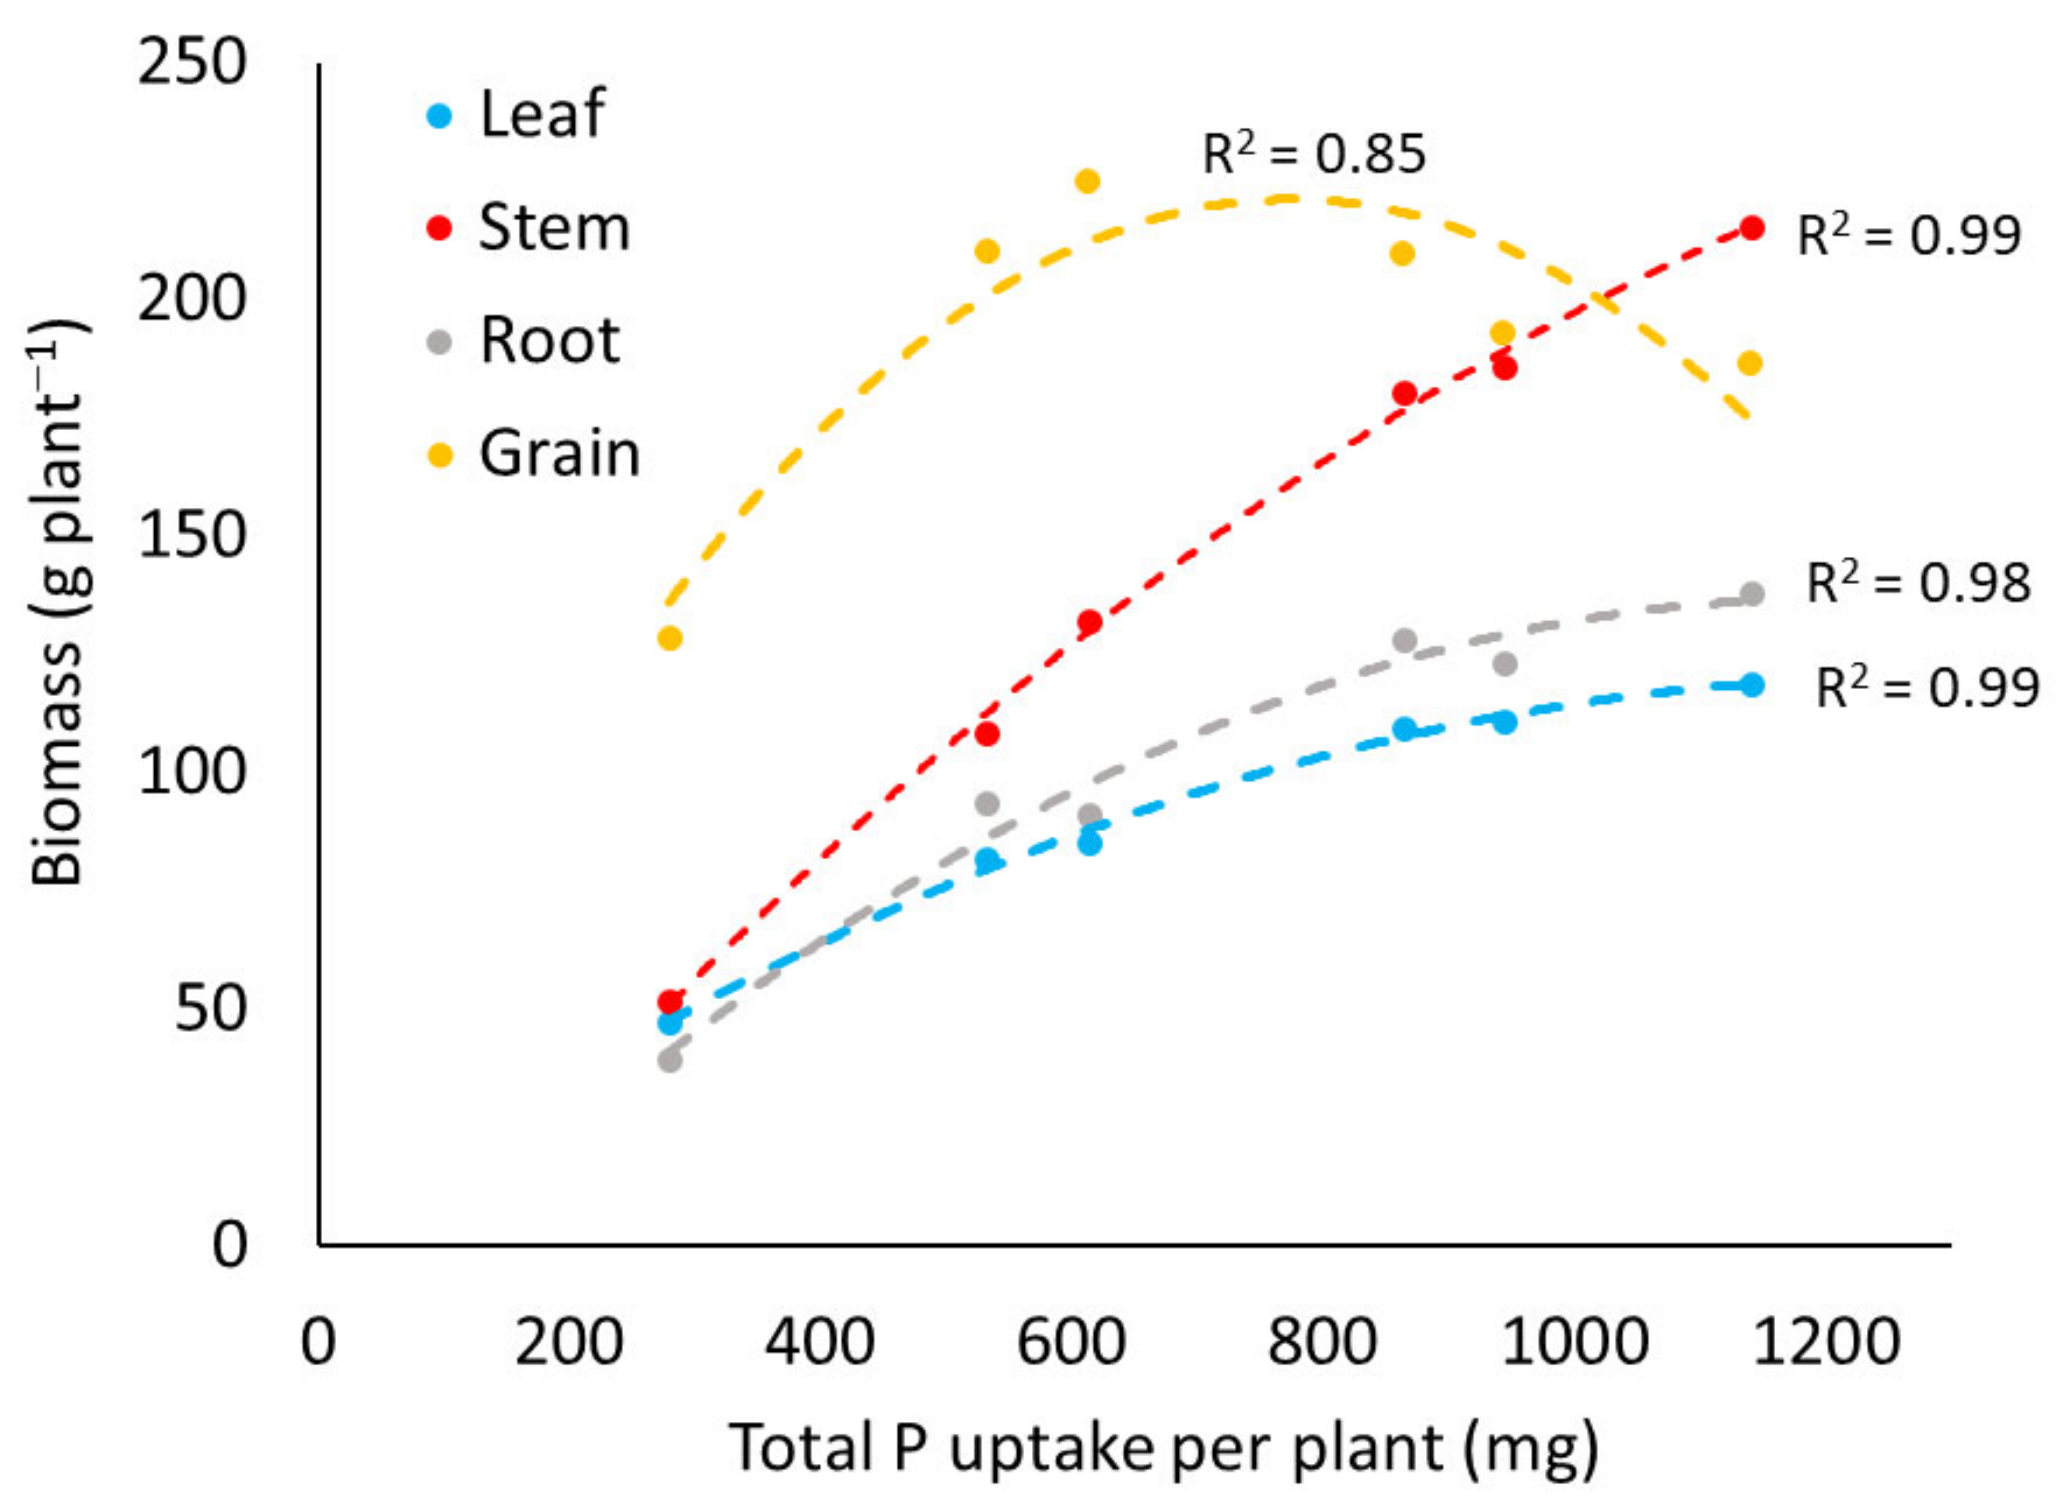
3.2.1. Biomass Production

Roots, leaf, and grain all appeared to approach a plateau with increased P uptake, but stem components did not. Stem, leaf, and root biomass were similar in magnitude at low P, but stem biomass increased more with increasing P than leaf or root biomass, which had similar biomass throughout the P concentrations examined. At 1140 mg P uptake, stem biomass (208 g plant−1) was 76 and 92 g plant−1 greater than root and leaf biomass, respectively.
Grain reached peak production at a much lower P uptake level than roots and leaves. Grain biomass increased with increased P until reaching a peak at around 600 mg P plant−1 (12 mg P L−1 treatment) and then decreased at greater P concentrations to the point where grain biomass was 58 g plant−1 less than stem biomass at 1140 mg P plant−1 (22 mg P L−1 treatment; Table 1 and Figure 2). Phosphorus concentration of all plant tissues increased with increased solution P concentration throughout the range of solution P concentrations examined (Figure 3).

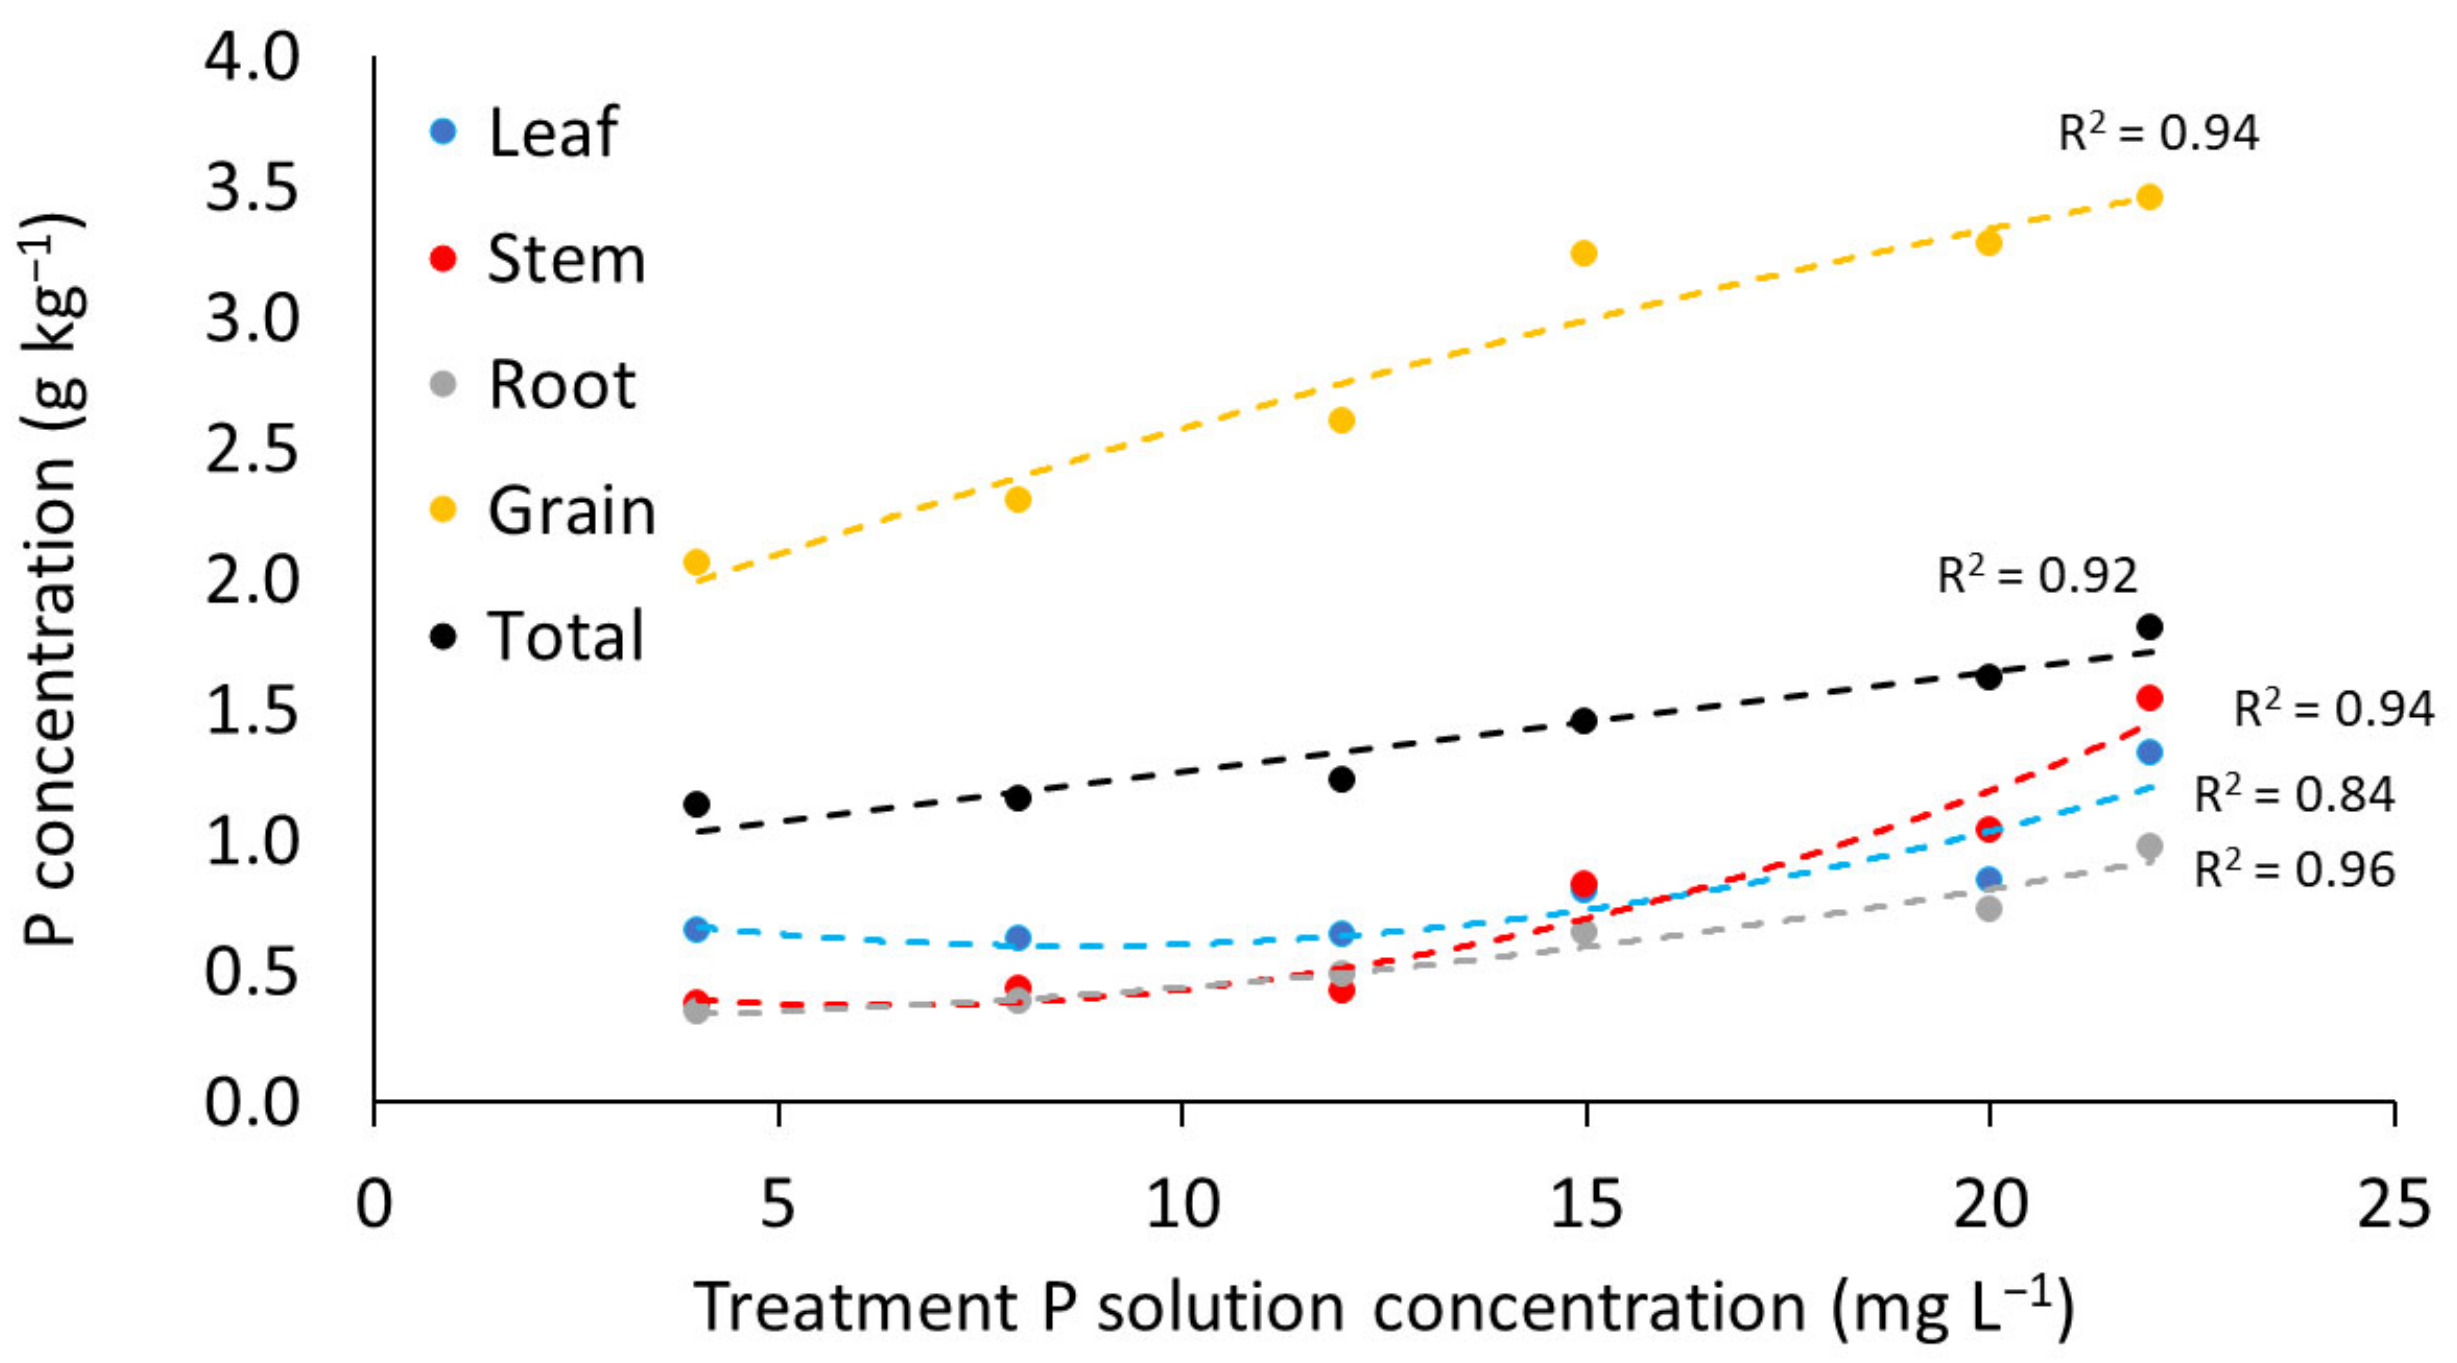
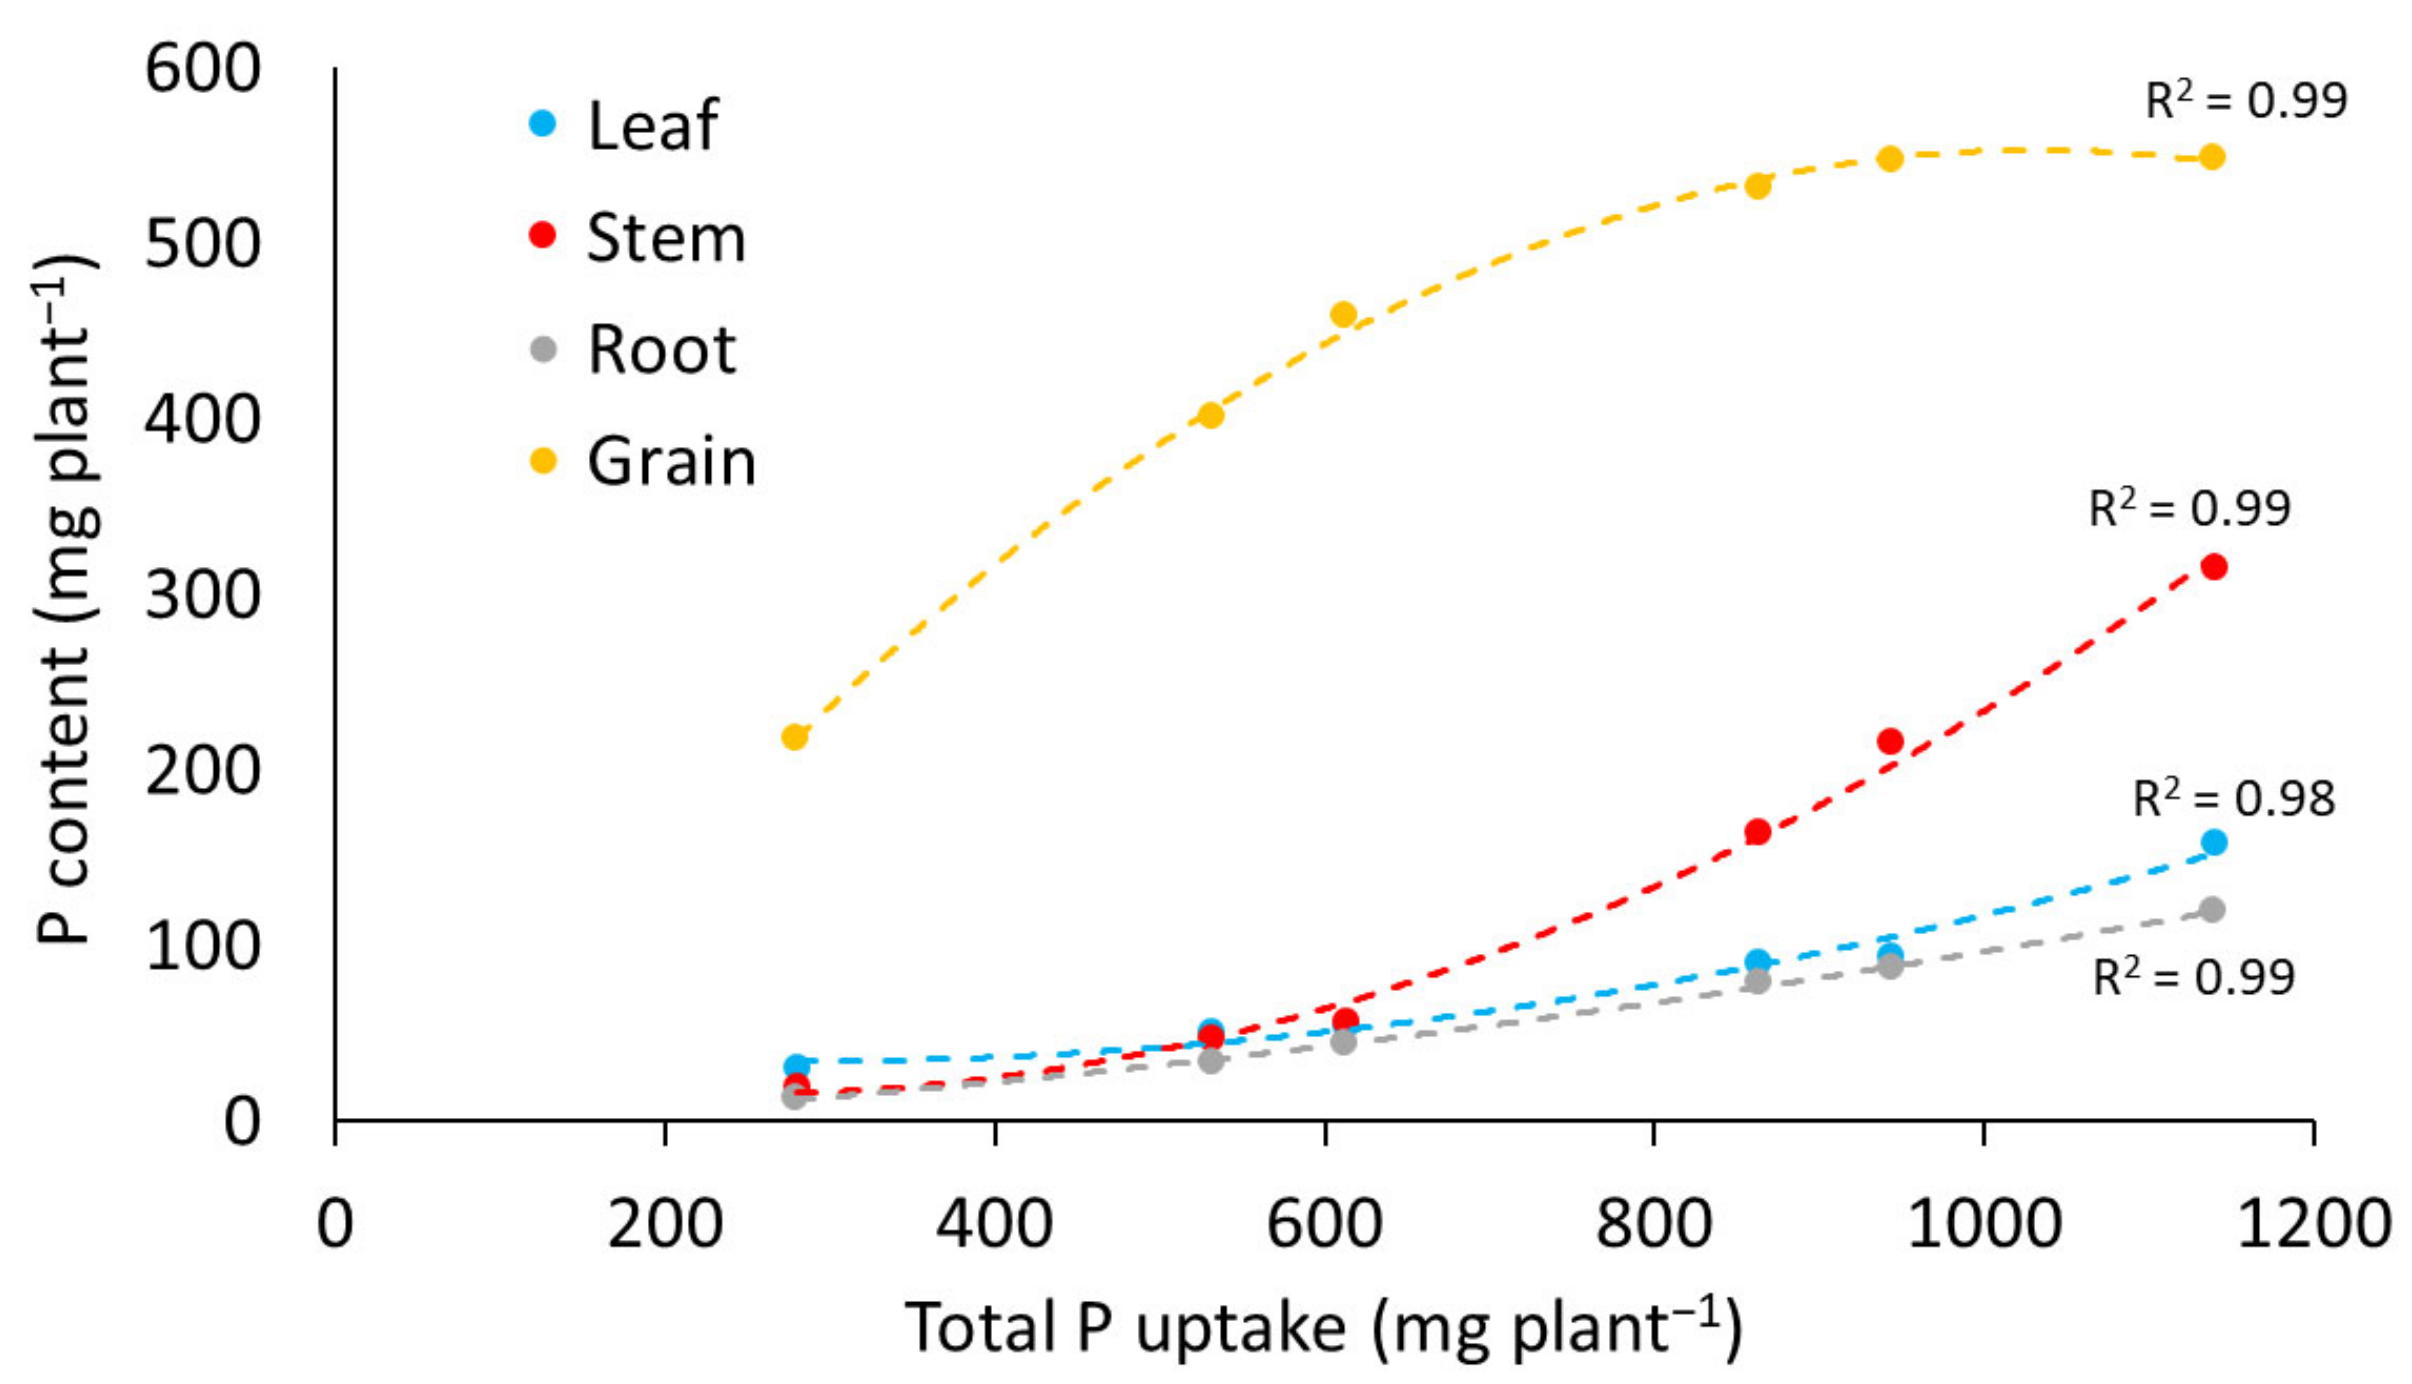
3.2.2. Phosphorus Content

Plant P content increased for leaf, stem, root, and grain (Figure 4) as a result of increases in both biomass and tissue P concentration. Leaf and root P content was similar across the range of solution P concentrations. Stem P content was similar to leaf and root P content at total P uptake of about 600 mg plant−1 or less, but was greater at increased total P uptake levels. In contrast to the continued increase in vegetative P content with increasing solution P, grain P content plateaued at total P uptake of ~900 mg P plant−1. Thus, the increase in grain P concentration with increased solution P treatment (Figure 3) compensated for the decrease in grain biomass at higher P uptake that occurred at high solution P treatment concentrations (Figure 2 and Table 1). The range in biomass P content was consistent with field studies and meta-analyses of maize nutrient uptake studies [9,10,11,12,13,14,15].

3.2.3. Breakpoint Analysis of Phosphorus Uptake and Yield

Grain yield and total biomass production with P uptake was examined in greater detail by conducting a “breakpoint” analysis in order to determine what P uptake level corresponded with peak production and whether or not grain yield decreased with further P uptake. Figure 5 and Table 2 show the results of the linear-linear and linear-plateau breakpoint analysis for the relationship between grain yield and total biomass production with P uptake. Both linear-linear and linear-plateau models were statistically significant in all cases (Table 2). However, for grain yield the R2 value for linear-linear was greater than linear-plateau. This suggested that grain yield decreased with further P uptake beyond the breakpoint level, which was about 580 mg P plant−1, regardless of whether values were averaged across hybrid or not (Table 2). The corresponding peak value of grain yield was 227 g plant−1, which is similar to that determined in meta-analyses of field studies under diverse conditions [11,14]. Ciampitti and Vyn [14] plotted values of P uptake per plant against grain yield (15.5% moisture) using data from 2300 field measurements. Although the authors inappropriately used a power model to describe this relationship, visual observation of the plotted data shows close agreement with peak grain yield and corresponding P uptake (around 600 mg P plant−1). A power model is inappropriate for describing this relationship because it implies that grain yield will increase infinitely with further P uptake, and therefore contradicts the fact that grain production is ultimately limited by genetic potential. Instead, closer observation of Ciampitti and Vyn [14] regarding peak grain yield at each P uptake level clearly shows that grain yield reached a plateau and perhaps decreased slightly with further P uptake after peak yield was achieved at ~250 g plant−1, similar to the current study.
On the other hand, total biomass production did not reach a plateau until uptake of much more P (Figure 5c,d), with statistical analysis showing that there was clearly no decrease in total biomass with further P uptake beyond grain yield breakpoints (Table 2). However, it is difficult to definitively know if total biomass production reached a plateau at the total biomass breakpoint, or if total biomass production per unit P uptake simply decreased. Regardless, the total biomass breakpoint occurred at around 730 mg P uptake plant−1. Our data illustrate that even after reaching peak grain yield, maize will continue to uptake P and produce biomass without the benefit of increased grain yield (Figure 2, Figure 4 and Figure 5). Examination of the data from Setiyono et al. [11] and Ciampitti and Vyn [14] also illustrate that further P uptake beyond the grain yield plateau does indeed occur in the field, producing no corresponding increase in grain. This suggests that maize is capable of luxury consumption of P, which has previously been mostly considered for K and N only [16,17,18].
Further, after maximum grain yield was attained at ~580 mg P plant−1, the additional P uptake was partitioned into all plant parts, including grain (Figure 4). Statistical breakpoint analysis (Table 2 and Figure 5) also showed that although biomass production continued with further P uptake beyond that point, total biomass produced per unit P uptake decreased after around 730 mg P plant−1 had been taken up. The impacts of excess P uptake on the uptake and partitioning of other nutrients is discussed in a companion paper [19].
Altogether, results of this study therefore show P uptake occurring in three phases. First, uptake occurred until maximum grain yield was achieved, up to ~580 mg P plant−1. Further P uptake beyond 580 mg P plant−1 in the second phase produced more biomass until ~730 mg P plant−1 with decreased grain yield. Beyond ~730 mg P plant−1 P uptake continued with little or no further increase in dry matter in the third phase. Several studies have also shown continued P uptake after maize yield either reached a plateau or decreased after reaching a peak [11,14,20,21,22,23]. For example, Zhang et al. [23] conducted a three-year field study in which nutrient uptake and maize yield were measured in response to several rates of P application; after grain yield reached a plateau at P uptake of ~520 mg plant−1 (not including roots), maize continued to uptake P with no increase in grain yield although grain P concentration increased. Although not directly reporting total P uptake, Heckman et al. [24] showed a linear relationship between soil Mehlich-3 P concentration and grain P concentration over 23 site-years among five Mid-Atlantic states. Beyond the agronomic optimum Mehlich-3 P level of 30 to 50 mg P kg−1 soil, increased Mehlich-3 soil test P continued to increase grain P concentration, suggesting that P luxury consumption was occurring. Takkar et al. [20] found that grain yield decreased after achieving maximum grain yield, yet further P uptake occurred beyond that point. Interestingly, Takkar et al. [20], Zhang et al. [23], and Singh et al. [22] attributed the negative impact of excess P uptake on grain yield to P interactions with Zn and Cu. Indeed, it has been hypothesized that excess soil P can potentially reduce Zn and Cu bioavailability either externally through precipitation of Zn- and Cu-phosphates, or internally via formation of Zn- and Cu-phytate. Effects of P uptake on partitioning and uptake of these and other nutrients are discussed in the companion paper [19].
The internal efficiency (IE; mass of grain per mass of total P uptake) for P uptake was calculated at the peak grain yield and corresponding P uptake level described in Table 2. The resulting value of 389 kg grain kg−1 P uptake was similar to values obtained in the meta-analysis of field studies conducted by Setiyono et al. [11]. However, Setiyono et al. [11] did not include root measurements and therefore their values are slightly higher than those reported in the current study. Excluding roots, IE was 455 in our study compared to 427 kg grain kg−1 P uptake determined by Setiyono [11].

4. Implications and Conclusions

In this study P uptake in maize occurred in three phases with two steps of luxury consumption; (i) increased uptake with increased grain yield and total biomass until maximum grain yield was attained, (ii) further P uptake with increase in total biomass, but with decrease in grain yield; and (iii) uptake with little to no increase in total biomass and continued decrease in grain yield. Thus, the two steps of P luxury consumption are defined in this case as continued uptake with decrease in grain yield, followed by uptake with little to no increase in total biomass and continued decrease in grain yield. From this, we can define the optimum P content for achieving maximum grain yield (Pgy) and biomass (Pbm) as approximately 580 and 730 mg P plant−1, or 1.23 and 1.35 g kg−1, respectively.
Perhaps the most striking agronomic implication of P luxury consumption is with regard to over-application of P and potential grain yield decrease. Although demonstrated in this study and in some field studies with excess soil P [20,22,23], yield decrease is likely only to occur under limited conditions. Instead, excess P uptake is more likely to produce a plateau in grain yield, which presents a major inefficiency with regard to P fertilizer use and economics. Ultimately, this excess P is used to build greater biomass with no grain yield benefit and suggests that a fertility program in which soil test P is built-up to values beyond critical levels will result in potential luxury consumption.
An implication of this two-step luxury consumption is that depending on intended use, targeted plant P uptake (and therefore target soil P levels) will vary. Simply put, more P will be required if the goal is to produce maximum biomass, such as for biofuel, silage production, or carbon sequestration, compared to maximizing grain production. Since P uptake into the grain continued beyond Pgy, it suggests that grain producers could additionally choose to employ soil fertility levels for achieving the minimum grain P content at maximum grain yield (quantity) or for attaining higher grain P content at the same yield (quality). If the end-user has no benefit from additional P content which is achieved with increased P uptake (and therefore greater soil P), then it would be more economical for the producer to employ lesser P fertility for simply achieving Pgy. From the perspective of high P soils that are major P sources to surface waters via non-point drainage, luxury consumption is a positive regarding soil P “draw-down”. The data produced in this study can help to estimate annual soil P removal with harvest of grain and total biomass.
Knowing the plant uptake values for optimum Pgy and Pbm, each can be used in developing less-empirical and more precise P fertility recommendations. Specifically, optimum Pgy and Pbm can serve as target P uptake values for mechanistic uptake models, such as the Barber-Cushman model, which could be incorporated into a nutrient recommendation tool. Such a tool would ultimately recommend soil-specific P application rates to achieve soil P levels that would result in maize uptake attaining optimum Pgy or Pbm. The results of this study cannot provide any recommendations for what the optimum soil levels would be for reaching optimum Pgy and Pbm due to the nature in which it was conducted, which was necessary for determining those values in the first place. That will require future soil-solution dynamics studies for quantifying quantity-intensity relationships as they vary with soil properties, including soil test P level. However, knowledge of optimum Pgy and Pbm is a critical first step.
Of great interest is the significant decrease in grain yield with excessive P uptake beyond Pgy. This was likely due to interactions between P and other nutrients. Detailed analysis of non-P partitioning and further exploration of the decrease in grain yield is presented in the companion paper [19].

Author Contributions

Conceptualization, C.J.P., J.J.C. and M.A.W.; methodology, C.J.P., M.A.W. and J.J.C.; formal analysis, C.J.P. and J.J.C.; investigation, C.J.P. and J.J.C.; original draft preparation, C.J.P.; writing—review and editing, J.J.C. and M.A.W.; project administration, C.J.P.; funding acquisition, C.J.P. All authors have read and agreed to the published version of the manuscript.

Funding

This research was a contribution from the Long-Term Agroecosystem Research (LTAR) network. LTAR is supported by the United States Department of Agriculture.

Data Availability Statement

Data is contained within the article.

Conflicts of Interest

The authors declare no conflict of interest. The funders had no role in the design of the study; in the collection, analyses, or interpretation of data; in the writing of the manuscript; or in the decision to publish the results.

References

  1. Kamprath, E.J. The role of soil chemistry in the diagnosis of nutrient disorders in tropical situations. In The Mineral Nutrition of Legumes in Tropical and Subtropical Soils, Proceedings of the Workshop Held at CSIRO Cunningham Laboratory, Brisbane, QLD, Australia, 16–21 January 1978; under the auspices of the US/Australia Co-operative Science Program; CSIRO: Victoria, Australia, 1978; pp. 313–327. [Google Scholar]
  2. Wendt, R.C.; Corey, R.B. Available P determination by equilibration with dilute SrCl2. Commun. Soil Sci. Plant Anal. 1981, 12, 557–568. [Google Scholar] [CrossRef]
  3. Cox, F.R.; Lins, I.D.G. A phosphorus soil test interpretation for corn grown on acid soils varying in crystalline clay content. Commun. Soil Sci. Plant Anal. 1984, 15, 1481–1491. [Google Scholar] [CrossRef]
  4. Cox, F.R. Current phosphorus availability indices: Characteristics and shortcomings. Soil Test. Prospect. Improv. Nutr. Recomm. 1994, 40, 101–113. [Google Scholar]
  5. Barber, S.A. Soil Nutrient Bioavailability: A Mechanistic Approach; John Wiley & Sons: Hoboken, NJ, USA, 1995; ISBN 0471587478. [Google Scholar]
  6. Baligar, V.C.; Barber, S.A. Genotypic Differences of Corn for Ion Uptake 1. Agron. J. 1979, 71, 870–873. [Google Scholar] [CrossRef]
  7. Lynch, J.P.; Brown, K.M. Root Strategies for Phosphorus acquisition. In TheEcophysiology of Plant-Phosphorus Interactions; Springer: Berlin/Heidelberg, Germany, 2008; pp. 83–116. [Google Scholar]
  8. Wiethorn, M.; Penn, C.; Camberato, J. A research method for semi-automated large-scale cultivation of maize to full maturity in an artificial environment. Agronomy 2021, 11, 1898. [Google Scholar] [CrossRef]
  9. Karlen, D.L.; Flannery, R.L.; Sadler, E.J. Aerial accumulation and partitioning of nutrients by corn. Agron. J. 1988, 80, 232–242. [Google Scholar] [CrossRef]
  10. Bruns, H.A.; Ebelhar, M.W. Nutrient uptake of maize affected by nitrogen and potassium fertility in a humid subtropical environment. Commun. Soil Sci. Plant Anal. 2006, 37, 275–293. [Google Scholar] [CrossRef]
  11. Setiyono, T.D.; Walters, D.T.; Cassman, K.G.; Witt, C.; Dobermann, A. Estimating maize nutrient uptake requirements. F. Crop. Res. 2010, 118, 158–168. [Google Scholar] [CrossRef]
  12. Gautam, P.; Gustafson, D.; Wicks III, Z. Study on nitrogen concentration of corn hybrids. Am. J. Agric. Biol. Sci. 2011, 6, 148–154. [Google Scholar] [CrossRef] [Green Version]
  13. Djaman, K.; Irmak, S.; Martin, D.L.; Ferguson, R.B.; Bernards, M.L. Plant nutrient uptake and soil nutrient dynamics under full and limited irrigation and rainfed maize production. Agron. J. 2013, 105, 527–538. [Google Scholar] [CrossRef]
  14. Ciampitti, I.A.; Vyn, T.J. Nutrient sufficiency concepts for modern corn hybrids: Impacts of management practices and yield levels. Crop Manag. 2014, 13, 1–7. [Google Scholar] [CrossRef]
  15. Woli, K.P.; Sawyer, J.E.; Boyer, M.J.; Abendroth, L.J.; Elmore, R.W. Corn era hybrid macronutrient and dry matter accumulation in plant components. Agron. J. 2018, 110, 1648–1658. [Google Scholar] [CrossRef] [Green Version]
  16. Bartholomew, R.P.; Janssen, G. Luxury consumption of potassium by plants and its significance. J. Am. Soc. Agron. 1929, 21, 751–765. [Google Scholar] [CrossRef]
  17. Koch, J.T.; Orchard, E.R.; Sumner, M.E. Leaf Composition and Yield Response of Corn in Relation to Quantity-Intensity Parameters for Potassium. Soil Sci. Soc. Am. J. 1970, 34, 94–98. [Google Scholar] [CrossRef]
  18. Binford, G.D.; Blackmer, A.M.; El-Hout, N.M. Tissue test for excess nitrogen during corn production. Agron. J. 1990, 82, 124–129. [Google Scholar] [CrossRef]
  19. Penn, C.J.; Camberato, J.J.; Wiethorn, M.W. How Much Phosphorus Uptake is Required for Achieving Maximum Maize Grain Yield? Part 2: Impact of phosphorus uptake on grain quality and partitioning of nutrients. Agronomy, 2023; accepted. [Google Scholar]
  20. Takkar, P.N.; Mann, M.S.; Bansal, R.L.; Randhawa, N.S.; Singh, H. Yield and Uptake Response of Corn to Zinc, as Influenced by Phosphorus Fertilization. Agron. J. 1976, 68, 942–946. [Google Scholar] [CrossRef]
  21. Barry, D.A.J.; Miller, M.H. Phosphorus nutritional requirement of maize seedlings for maximum yield. Agron. J. 1989, 81, 95–99. [Google Scholar] [CrossRef]
  22. Singh, J.; Dhaliwal, S.S.; Mavi, M.S. Zinc fractions and nutrition of maize (Zea mays L.) as affected by Olsen-P levels in soil. Nutr. Cycl. Agroecosyst. 2021, 120, 257–269. [Google Scholar] [CrossRef]
  23. Zhang, W.; Chen, X.-X.; Liu, Y.-M.; Liu, D.-Y.; Chen, X.-P.; Zou, C.-Q. Zinc uptake by roots and accumulation in maize plants as affected by phosphorus application and arbuscular mycorrhizal colonization. Plant Soil 2017, 413, 59–71. [Google Scholar] [CrossRef]
  24. Heckman, J.R.; Sims, J.T.; Beegle, D.B.; Coale, F.J.; Herbert, S.J.; Bruulsema, T.W.; Bamka, W.J. Nutrient removal by corn grain harvest. Agron. J. 2003, 95, 587–591. [Google Scholar] [CrossRef]
Figure 1. Biomass and plant measurements for each hybrid averaged across six phosphorus concentration treatments and four replications. “Stem” includes stem, cob, and tassel, and “Leaf” includes leaves and husk. * and ** indicate a significant hybrid effect at p-levels ≤ 0.05 and ≤ 0.01, respectively. Error bars indicate standard deviation. All mass presented on dry weight basis except for grain (15.5% moisture). Bars topped by the same letter did not differ as assessed by Least Significant Difference (p ≤ 0.05).
Agronomy 13 00095 g001
Figure 2. Relationship between total P uptake per plant and leaf, stem, root, and grain. “Stem” includes stem, cob, and tassel, and “Leaf” includes leaves and husk. Values averaged for each P treatment across hybrid. All mass presented on dry weight basis except for grain (15.5% moisture).
Agronomy 13 00095 g002
Figure 3. Plant tissue phosphorus (P) concentration for solution P concentration treatments averaged across three hybrids and four replications. “Stem” includes stem, cob, and tassel, and “Leaf” includes leaves and husk.
Agronomy 13 00095 g003
Figure 4. Phosphorus (P) partitioning into leaf, stem, root, and grain. “Stem” includes stem, cob, and tassel, and “Leaf” includes leaves and husk. Values averaged for each P treatment across hybrid.
Agronomy 13 00095 g004
Figure 5. Breakpoint analysis by linear-plateau and linear-linear modelling of the relationship between total phosphorus (P) uptake and grain yield (a,b) and total biomass (c,d), presented for values averaged across hybrid (a,c) and relative values for each hybrid (b,d). Breakpoints and associated p-values that describe how well each model fit the data are listed in Table 2. Plots (b,d) (relative yield and biomass) have more data points than (a,c) because it is not valid to average relative values across different hybrids.
Agronomy 13 00095 g005
Table 1. Plant part mean and standard deviation (Std) for phosphorus (P) concentration treatments (4 to 22 mg P L−1) averaged across three hybrids and four replications. “Stem biomass” includes stem, cob, and tassel, and “Leaf biomass” includes leaves and husk. ** indicates a significant P treatment effect at p-level of 0.01. All mass presented on dry weight basis except for grain (reported at 15.5% moisture).
Phosphorus Treatment (mg L−1)
4812152022
ParameterUnitsMeanStdMeanStdMeanStdMeanStdMeanStdMeanStd
Leaf biomass **g plant−14710.08210.9858.110923.311123.111924.5
Stem biomass **g plant−15215.710930.413240.018143.518659.621652.2
Root biomass **g plant−14022.09453.59130.212842.612345.013888.5
Grain yield **g plant−112822.221034.322531.621095.619383.318767.7
Total biomass **g plant−124843.146267.049961.359567.658395.3630153.5
Stalk diameter **mm18.41.8726.12.8726.41.9127.20.7627.22.0927.51.36
Height to ear **cm76.28.8580.78.3381.35.1581.910.0384.89.3387.87.68
Table 2. Total phosphorus (P) uptake breakpoints indicating a significant change in slope for the relationships between total P uptake and grain yield and total biomass shown in Figure 5. Data fit to both linear-plateau and linear-linear models for yield and total biomass averaged across hybrids; relative yield and total biomass were not averaged across hybrid.
DescriptionModelP-Uptake BreakpointCorresponding Biomass Breakpointp-ValueR2
(mg plant−1)(g plant−1 or Relative Value)
Grain yield averaged across hybridLinear-plateau5192050.050.84
Linear-linear5842270.010.99
Relative grain yieldLinear-plateau5180.85<0.010.60
Linear-linear5830.95<0.010.67
Total biomass averaged across hybridLinear-plateau7316030.010.98
Linear-linear6735580.010.99
Relative total biomassLinear-plateau7980.95<0.010.93
Linear-linear7360.88<0.010.94
Disclaimer/Publisher’s Note: The statements, opinions and data contained in all publications are solely those of the individual author(s) and contributor(s) and not of MDPI and/or the editor(s). MDPI and/or the editor(s) disclaim responsibility for any injury to people or property resulting from any ideas, methods, instructions or products referred to in the content.

