Article

Changes in the Soil Phosphorus Supply with Rice Straw Return in Cold Region

1
School of Agriculture, Northeast Agricultural University, Harbin 150030, China
2
Institute of Forage and Grassland Sciences, Heilongjiang Academy of Agricultural Science, Harbin 150086, China
3
School of Water Conservancy and Civil Engineering, Northeast Agricultural University, Harbin 150030, China
*
Author to whom correspondence should be addressed.
Agronomy 2023, 13(9), 2214; https://doi.org/10.3390/agronomy13092214
Submission received: 30 July 2023 / Revised: 20 August 2023 / Accepted: 22 August 2023 / Published: 24 August 2023
(This article belongs to the Special Issue Effects of Tillage, Cover Crop and Crop Rotation on Soil)

Abstract

:
Most phosphorus (P) in soil exists in nonlabile forms, leading to poor soil P supply capacity and limiting crop growth. This study evaluated the effect of 10 years of rice straw return on rice yield, soil P budget, P fractions, and phosphatase activity to establish the relationship between soil P fractions and related microbial communities. Four treatments, i.e., no rice straw return (S0), low amount of rice straw return (S1), high amount of rice straw return (S2), and abandoned farmland (AL), were used in the evaluation. The results showed that rice straw return had no effect on the rice yield and P uptake, and the P budget was positive in the S2 treatment. Rice straw return increased the phosphatase activity and content of soil Olsen-P, total P, NaHCO3-, and NaOH-extractable P, and the phosphatase activity and P fractions were both increased with the amount of straw returned. There was a positive correlation between most soil P fractions and active organic carbon fractions. Rice straw return changed the composition and abundance of soil phosphate-solubilizing bacteria (PSB). The findings showed that straw return decreased the proportion of soil nonlabile P, enhancing the soil P supply capacity, and they further showed that the abundance of PSB was not consistent with soil P content.

1. Introduction

Phosphorus (P) plays an important role in plant growth and sustaining soil fertility, particularly under intensive agricultural systems. The P absorbed by crops primarily enters the plants through soil solution in the form of phosphate ions [1]. Organic phosphate, coming from the organic matter of animal and plant decay, is an important fraction of P in the soil [2]. Once P is removed from the soil by crops, it can be replenished only by external sources [3]. To guarantee crop yield, the application of P fertilization is the most common practice. Rice straw return improves soil fertility and productivity [4]. Compared with inorganic fertilizer application alone, rice straw return improves soil P availability, changes the soil P fractions, and increases the P uptake of rice [5]. In an agricultural ecosystem, a balance of soil P is essential for both high yield and a healthy environment.
Due to the re-translocation of a large of straw P into grain, the concentration of P in cereal residues is usually low [6]. The amount and P concentration of straw returned affect the contribution of crop straw to P availability [7]. Continuous straw return combined with chemical fertilizer application increases the soil available P content and total organic P (Po) content [8]; the increase in soil Po pool is beneficial to the transformation of Pi to the labile form in paddy soil [9]. Straw return increases soil Olsen-P, Pi, Po, and P release, and straw return combined with chemical P fertilizer maintains a positive soil P balance [10]. Other research shows that crop straw with low P concentration, such as cereal stubble, has no significant contribution to soil P availability [7]. The P budget is calculated as the P input minus the output [11], and long-term fertilizer and organic matter applications affect the P budget, contents of P fractions, and crop yields [12,13]. Straw return is an effective measure for sustaining crop productivity in large parts of China, but the geographical locations should be considered [14]. Compared with chemical fertilizer, long-term rice straw return with chemical fertilizer increased the crop yield in southeastern China [8]. In the Huang-Huai-Hai Plain of China, long-term maize straw return has no significant effect on crop yield [15]. There is no unified result on the effect of straw return on yield.
Straw return may provide a long-term sustained release of P source for plants and soil organisms [16,17]. Microorganisms play an important role in the mobilization of soil P into the forms available to plants [18]. The return of organic materials stimulated microbial biomass and soil P dynamics [19]; straw return increased phosphatase activity, the diversity and abundance of soil microbes, and significantly changed the bacterial community composition [14,19]; and increased the population size of PSB [20].
Heilongjiang Province is an important japonica rice production area in a cold region of China, and rice straw is mostly burned in situ after rice harvest, decreasing soil organic matter and essential nutrients, and reducing the activity of microbes [21]. Based on a 10-year field experiment, we studied the effect of rice straw return on soil P fractions and phosphatase activities, and the results were combined with the results of a previous experiment [22] to establish the relationship between the soil P fractions and related microbes, providing a basis for analyzing the improvement in the soil P supply by straw return. We hypothesized that (i) rice straw return would increase the soil P content and improve the soil P supply, and (ii) rice straw return would increase the abundance of PSB.

2. Materials and Methods

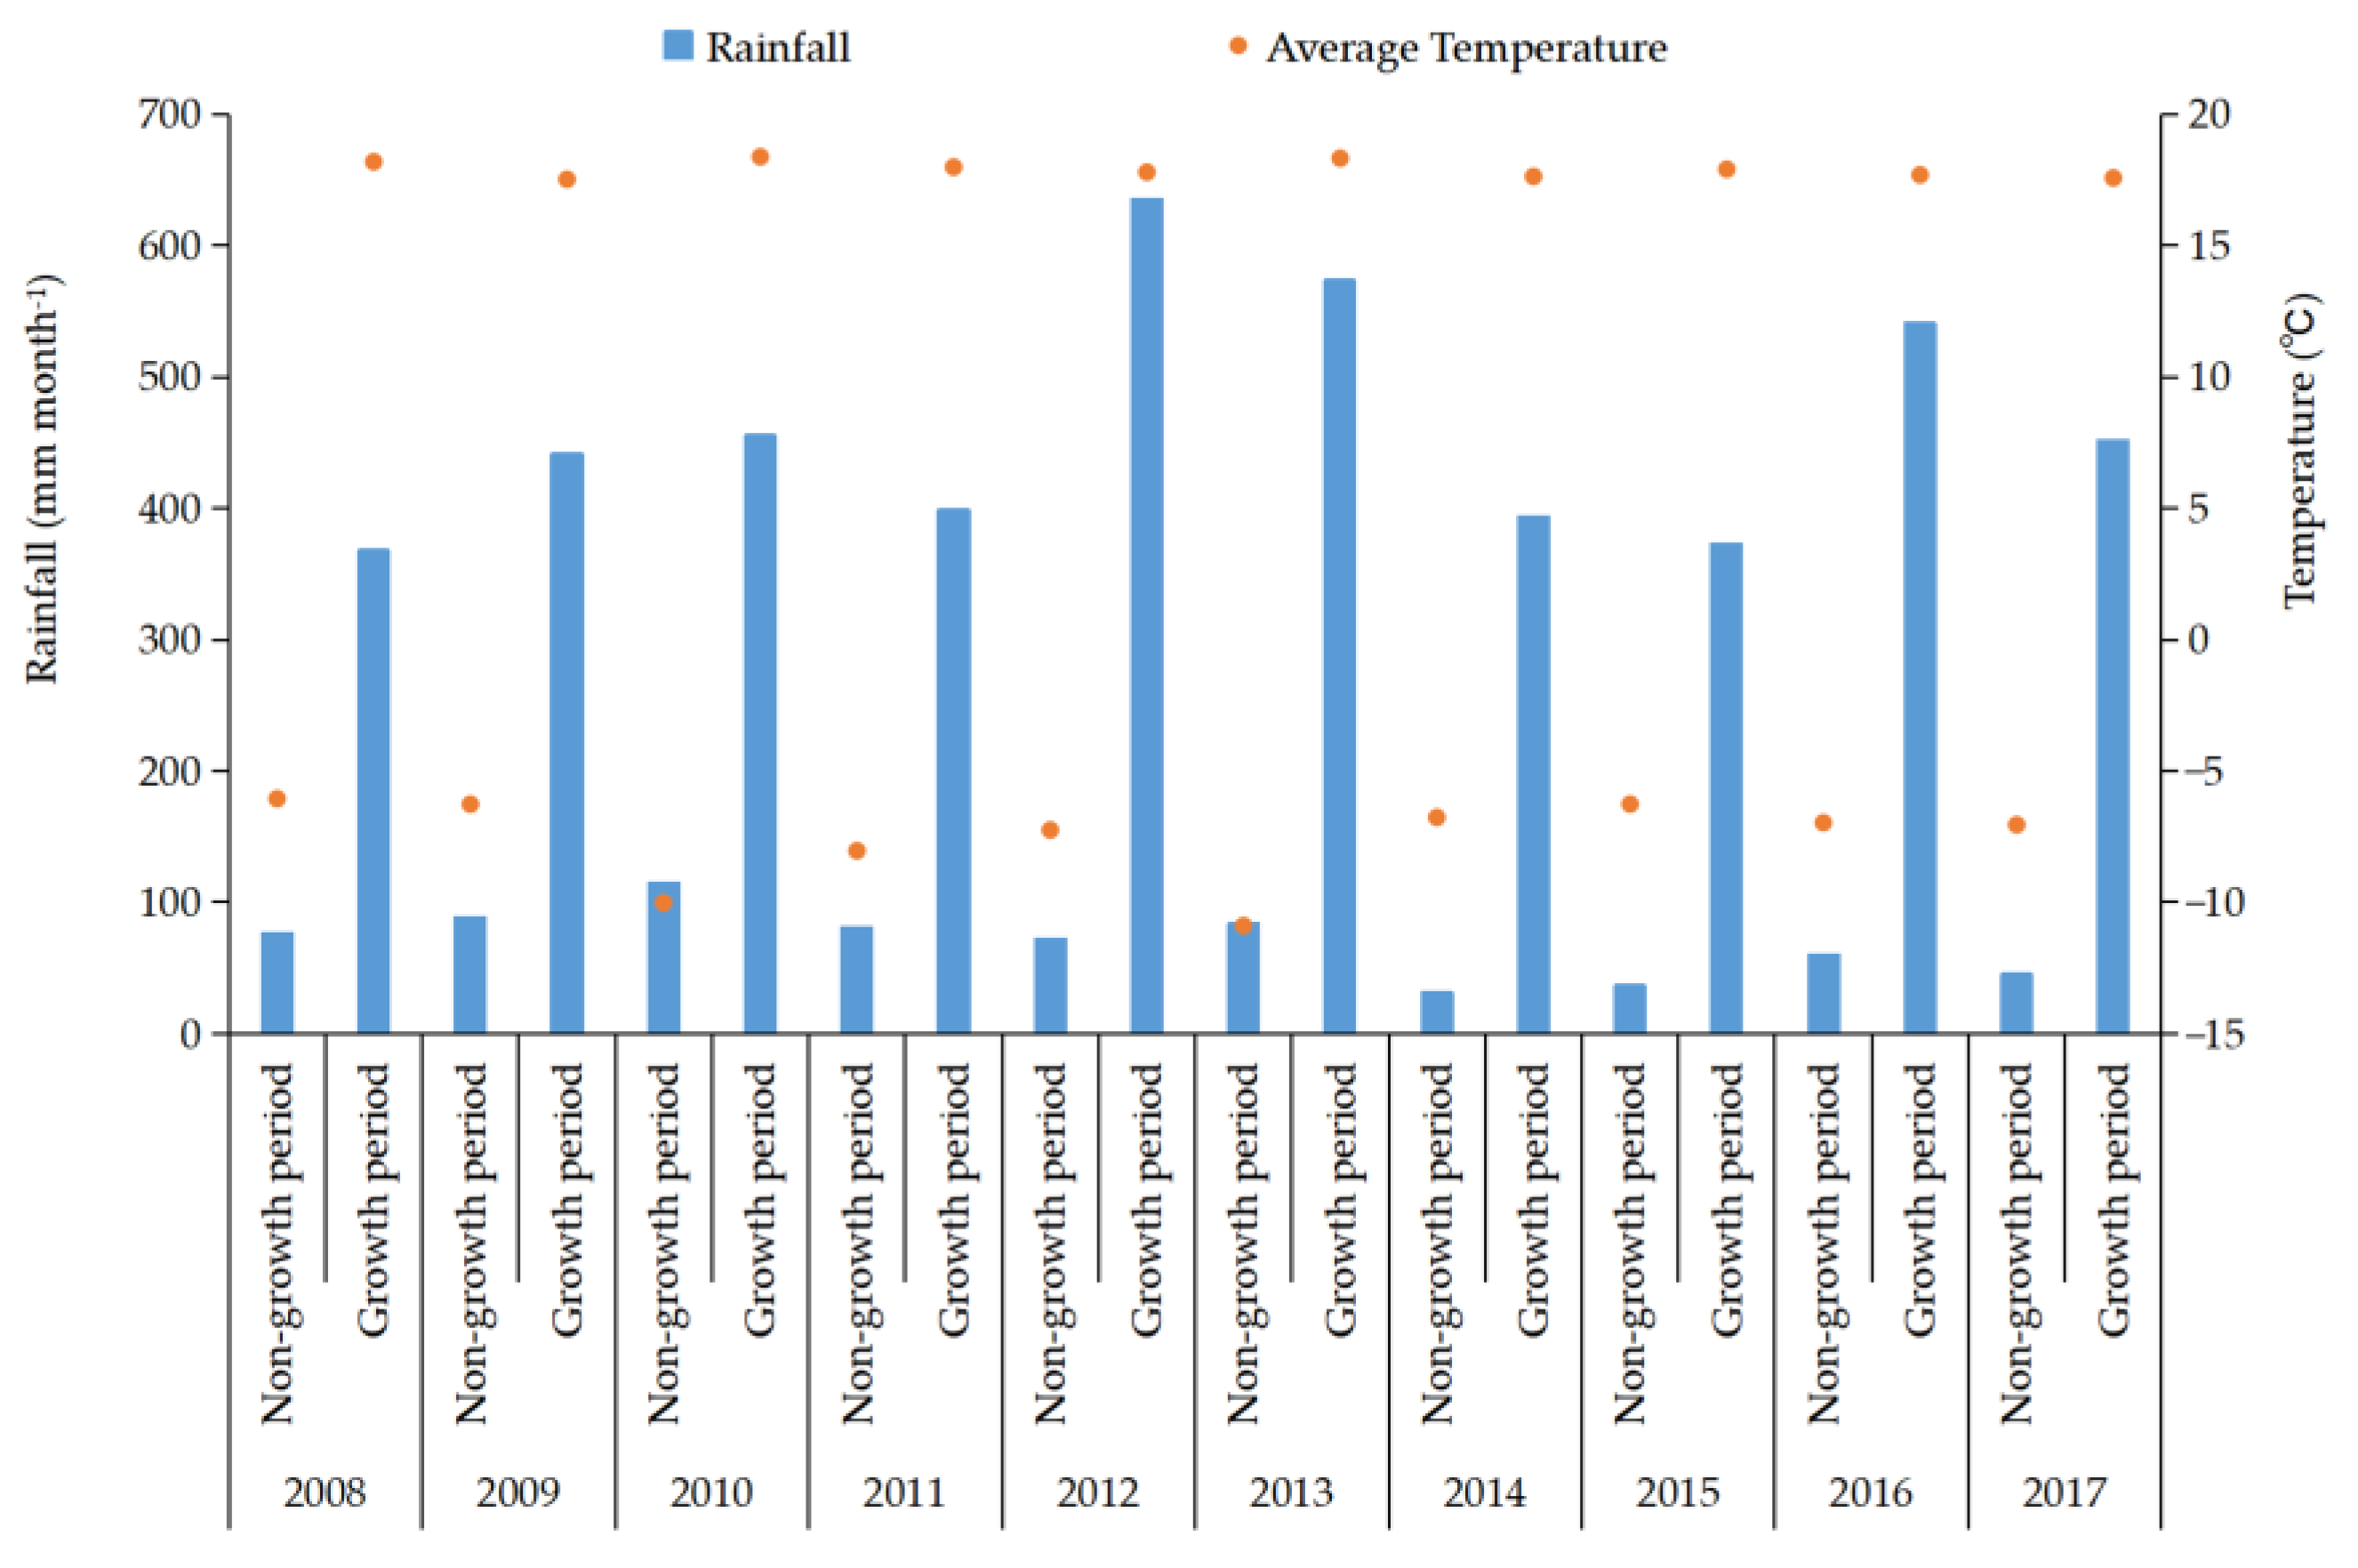
2.1. Overview of the Experimental Site

A 10-year experiment was conducted at the experimental and practice base of Northeast Agricultural University located in Harbin, Heilongjiang Province, Northeast China (45°34′–45°46′ N, 126°22′–126°50′ E). During the experimental period, the annual average temperature was 5.2 °C, with annual accumulated temperature (≥10 °C) of 3165.5 °C. Annual average rainfall was 524.4 mm (meteorological data from the China Meteorological Data Service Center, provided by the Climate Change Center of the China Meteorological Administration). In the rice field, only one crop is grown per year, and continuous cropping is used. Figure 1 shows the annual accumulated temperature and rainfall in the growth season (May–October) and the nongrowing season (November–April of the following year) from 2008 to 2017.

2.2. Experimental Design

The experiment started in 2008 under a continuous rice-cropping system. The plot area was 2 m × 2 m, filled with testing soil to a depth of 0.5 m, and the soil was a Haplic Phaeozem. The basic soil chemical properties were as follows: SOC 19.11 g kg−1, total nitrogen 1.48 g kg−1, available nitrogen 44.91 mg kg−1, total potassium 21.91 g kg−1, available potassium 130.17 mg kg−1, total phosphorus 0.83 g kg−1, Olsen P 41.95 mg kg−1.
Four treatments were established: no straw return as control (S0), rice straw return at rates of 6250 kg ha−1 (S1) and 12,500 kg ha−1 (S2), and abandoned farmland (AL). The plots were arranged in completely random distribution, and each treatment had 3 replicates. The average C, N, P, and K contents of the straw returned were 419.34 g kg−1, 11.13 g kg−1, 1.16 g kg−1, and 15.40 g kg−1, respectively. The rice variety planted was Longdao 21. Each plot received basal fertilizer application at a rate of 96 kg N ha−1, 67 kg P2O5 ha−1, and 30 kg K2O ha−1, and 67 kg N ha−1 was applied at the tillering stage. N, P, and K fertilizers were applied as urea, diammonium phosphate, and potassium sulfate, respectively. The other management measures were the same as the local rice production. Typha angustifolia was the main weed species in the abandoned farmland, where no tillage or fertilization was performed, with the same water management as the rice-growing plots. During the growing season, no pesticides were applied, and weeds were controlled manually.
On 20 May every year, tillage was performed, and the air-dried rice straw was evenly mixed into the soil. Field flooding was performed on 25 May, and seedlings were transplanted on 30 May. Rice (30-day-old seedlings) was transplanted manually at a spacing of 30 cm × 13 cm, with 3 plants per hole. The plots were flooded to a depth of 5–7 cm during the rice growing period and dried for 2 weeks before rice harvest. On 30 September, rice was harvested manually.

2.3. Plant and Soil Sample Collection

Plant samples were collected from each plot at maturity every year, roots and stubble were left in the field, and the stubble height was 5 cm. The grain and straw were separated manually, dried at 80 °C to constant weight, and determined their total P concentration.
After rice was harvested, soil samples were collected on 2 October 2017. The soil was sampled to a depth of 15 cm, 6 points for each plot, and then mixed thoroughly into a composite sample. Impurities such as root fragments in the samples were removed. The soil samples were air-dried to determine the soil P content.

2.4. Measurement Indicators and Methods

The grain and straw samples were digested with H2SO4-H2O2, and the molybdenum blue colorimetric method was used to measure the P concentrations of grain and straw [23]. The sodium bicarbonate method was used to determine the soil Olsen-P content [24]. Based on the method of Tabatabai and Bremner, the soil phosphatase activities were determined [25].
For determination of soil P fractions, the corrected P fractionation scheme was used [26]. ① For H2O-P, the deionized (DI) water extraction-molybdenum antimony colorimetric method was used on air-dried soil samples. ② For NaHCO3-Pi, the sodium bicarbonate (c(NaHCO3) = 0.5 mol L−1) extraction-molybdenum antimony colorimetric method was used on the residual soil sample from the H2O-P measurement. ③ For NaHCO3-P, the potassium persulfate (K2S2O8) high-pressure digestion-molybdenum antimony colorimetric method was used on the NaHCO3-Pi extraction solution, and the NaHCO3-Po content was calculated as the difference between the NaHCO3-P content and NaHCO3-Pi content. ④ For NaOH-Pi, the sodium hydroxide (c(NaOH) = 0.1 mol L−1) extraction-molybdenum antimony colorimetric method was used on the residual soil sample from the NaHCO3-Pi measurement. ⑤ For NaOH-P, the K2S2O8 high-pressure digestion-molybdenum antimony colorimetric method was used on the NaOH-Pi extraction solution, and the NaOH-Po content was calculated as the difference between the NaOH-P content and NaOH-Pi content. ⑥ For HCl-P, the hydrochloric acid (c(HCl) = 1.0 mol L−1) extraction-molybdenum antimony colorimetric method was used on the residual soil sample from the NaOH-Pi measurement. ⑦ For residual P, the K2S2O8 high-pressure digestion-molybdenum antimony colorimetric method was used on the residual soil sample from the NaOH-P measurement. ⑧ For total P (TP), the K2S2O8 high-pressure digestion-molybdenum antimony colorimetric method was used on the air-dried soil samples.
The soil C fractions and microbial data were from Yan et al. [22].

2.5. P Uptake and P Budget

The P budget was calculated as the P fertilizer applied (kg P ha−1)—the annual P uptake by rice (grain + straw) (kg P ha−1). The rice P uptake was calculated as the grain yield (kg ha−1) × grain P concentration (g kg−1) + straw biomass (kg ha−1) × straw P concentration (g kg−1). The annual P budgets were calculated at the plot level as the P input by fertilization (kg P ha−1) + P input by rice straw (kg P ha−1)—the annual P uptake by rice (grain + straw) (kg P ha−1). The cumulative P budget (kg P ha−1) was calculated by summing the annual P budget [27].

2.6. Data Processing and Analysis

SPSS 21.0 (SPSS Inc., Chicago, IL, USA) was used for data processing and statistical analysis. One-way analysis of variance (ANOVA) and multiple comparison analysis (LSD) were used to analyze the significant differences at significance level of p = 0.05. Graphs were drawn with Origin 9.0 software (Origin Lab Inc., Guangzhou, China).

3. Results

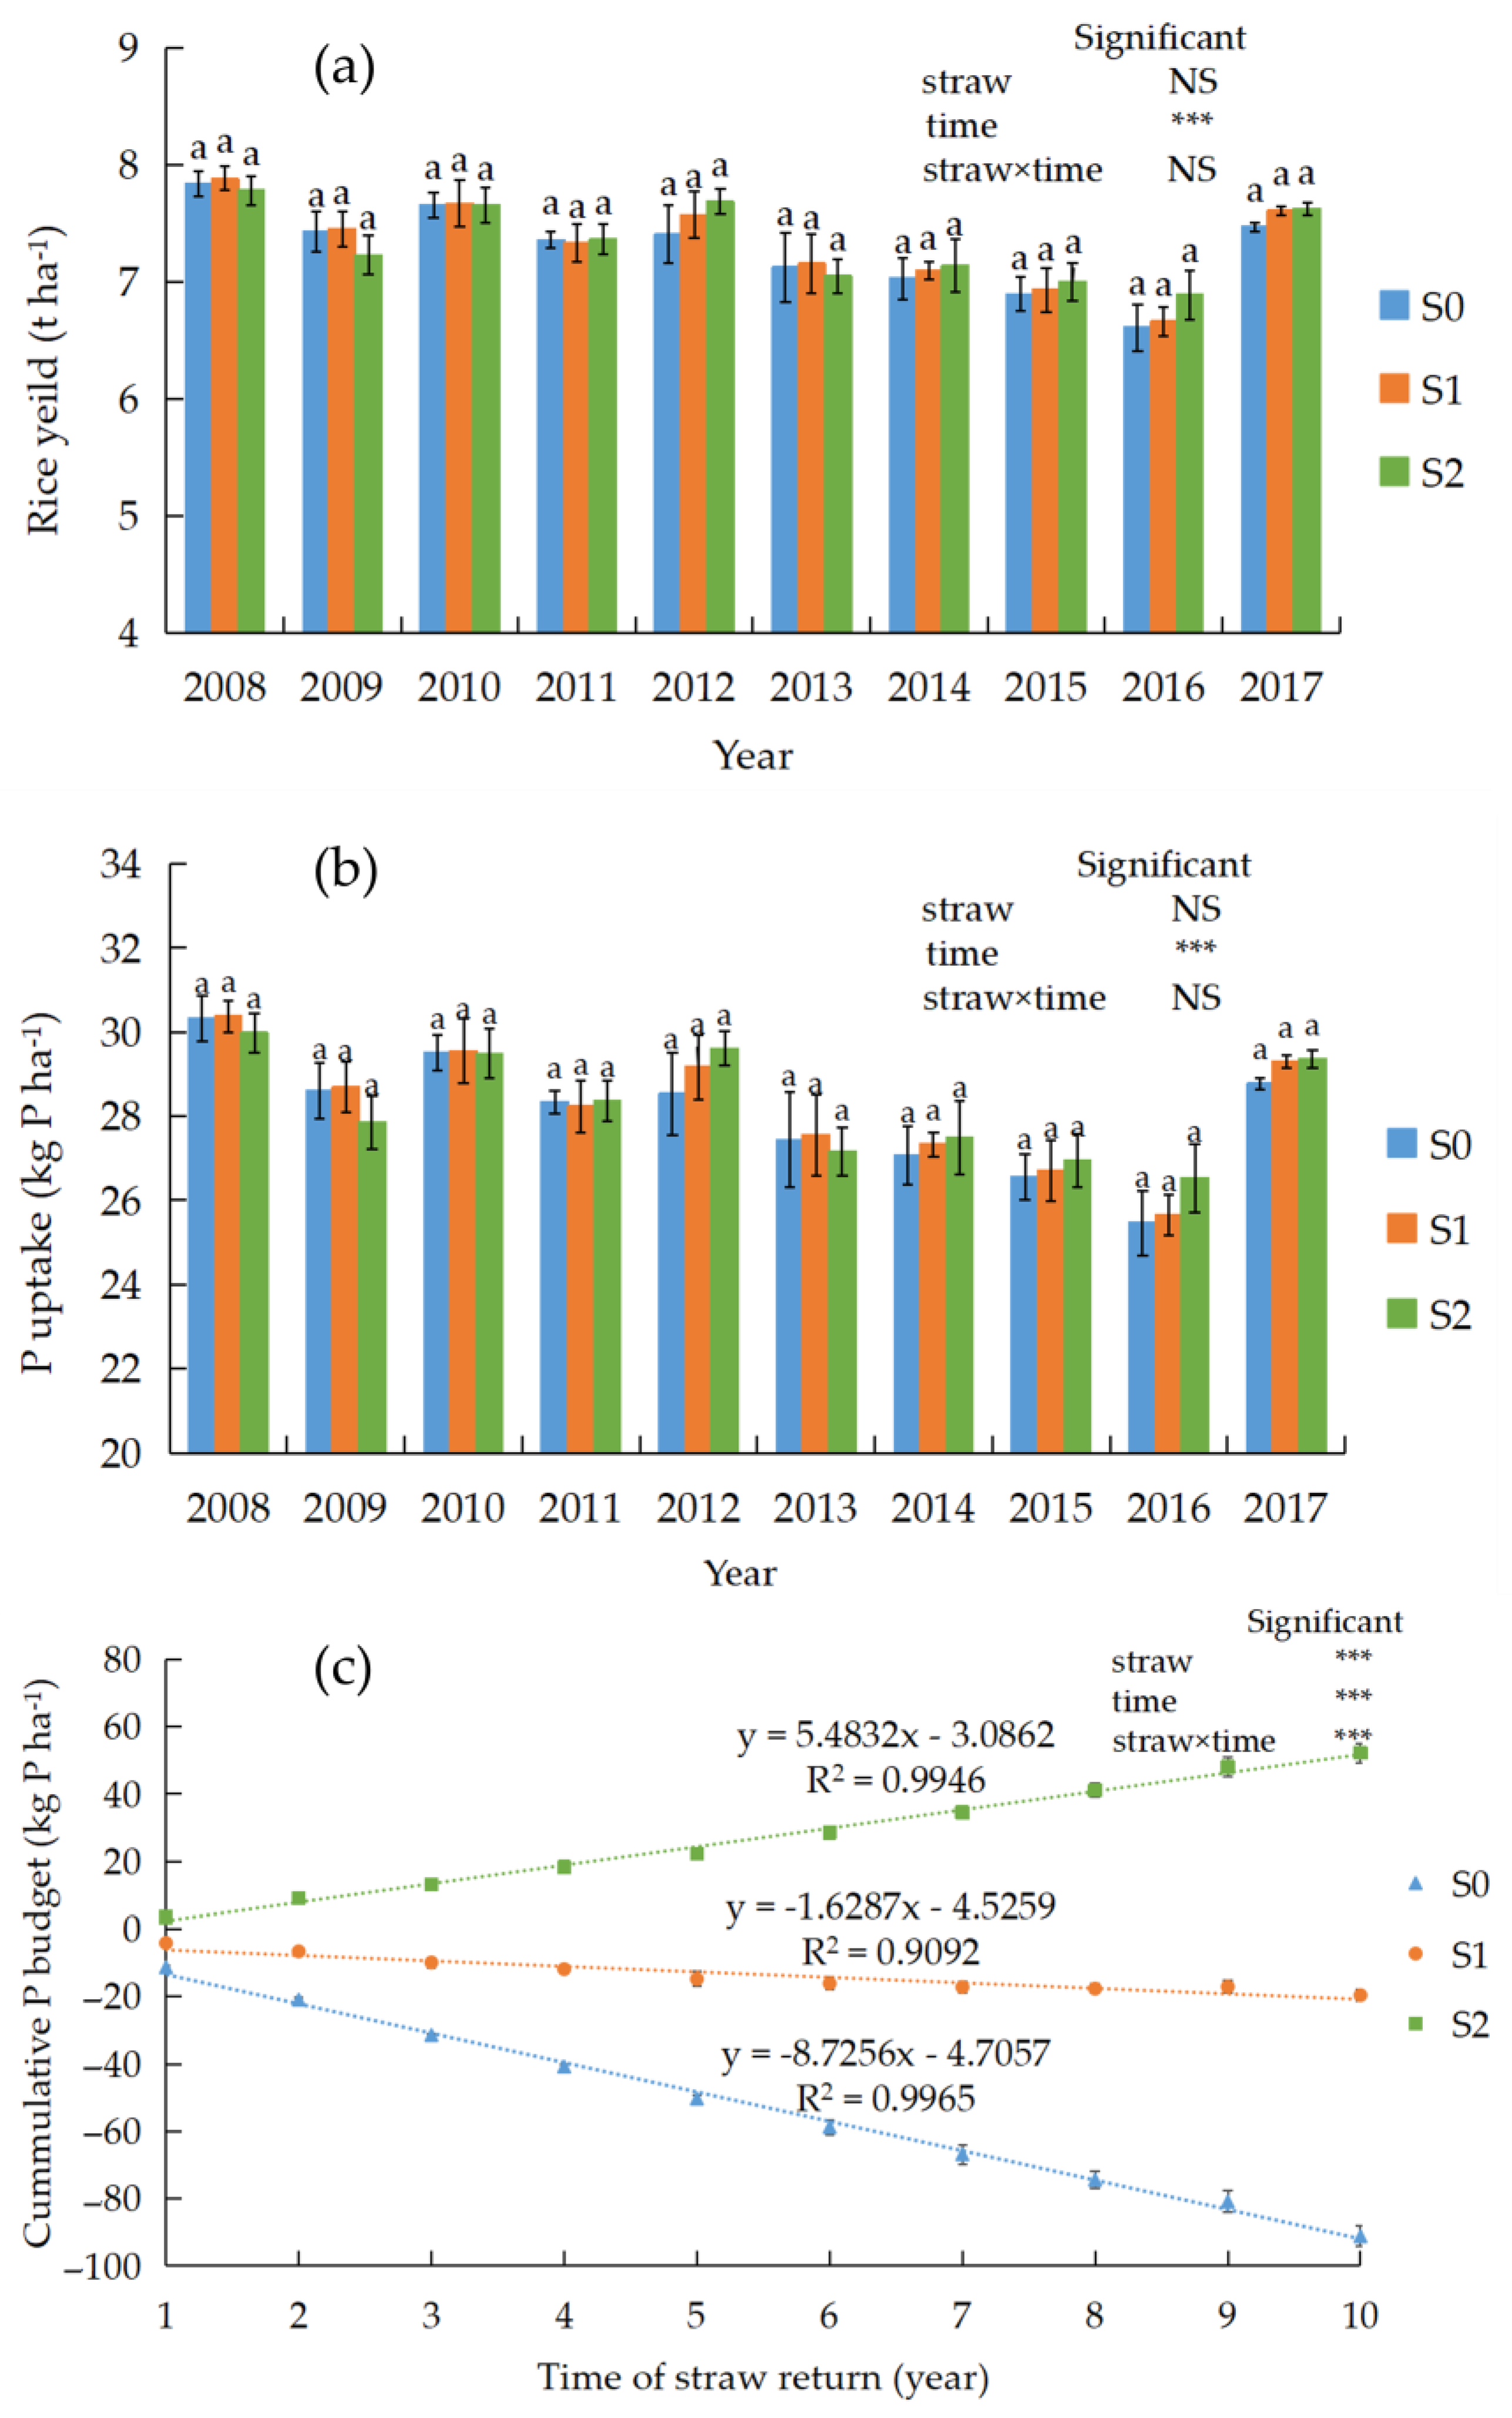
3.1. Grain Yield, P Uptake, and P Budget

The grain yield of rice (at 14% moisture) of rice straw return varied among the treatments and over time. There was no significant difference in grain yield and P uptake amounts of rice among the treatments (Figure 2a,b) during the 10 years. The grain yield and P uptake amounts of rice were not significantly affected by rice straw return amount, but were highly significantly affected by time of straw return. There was no interaction between rice straw return amount and straw return time. Under the S0 and S1 treatments, the cumulative P budgets were negative and decreased over the 10 years, while the cumulative P budget was positive in the S2 treatment (Figure 2c). The amount and time of rice straw return had a highly significant effect on the cumulative P budgets, and their interaction reached significant level (p < 0.001). The fitting equation between straw return time and accumulative P budgets was established, and all regression models indicated good fitting results with all R2 more than 0.9. The fitting equation can be used to analyze the cumulative P budgets changing after long-term rice straw return.

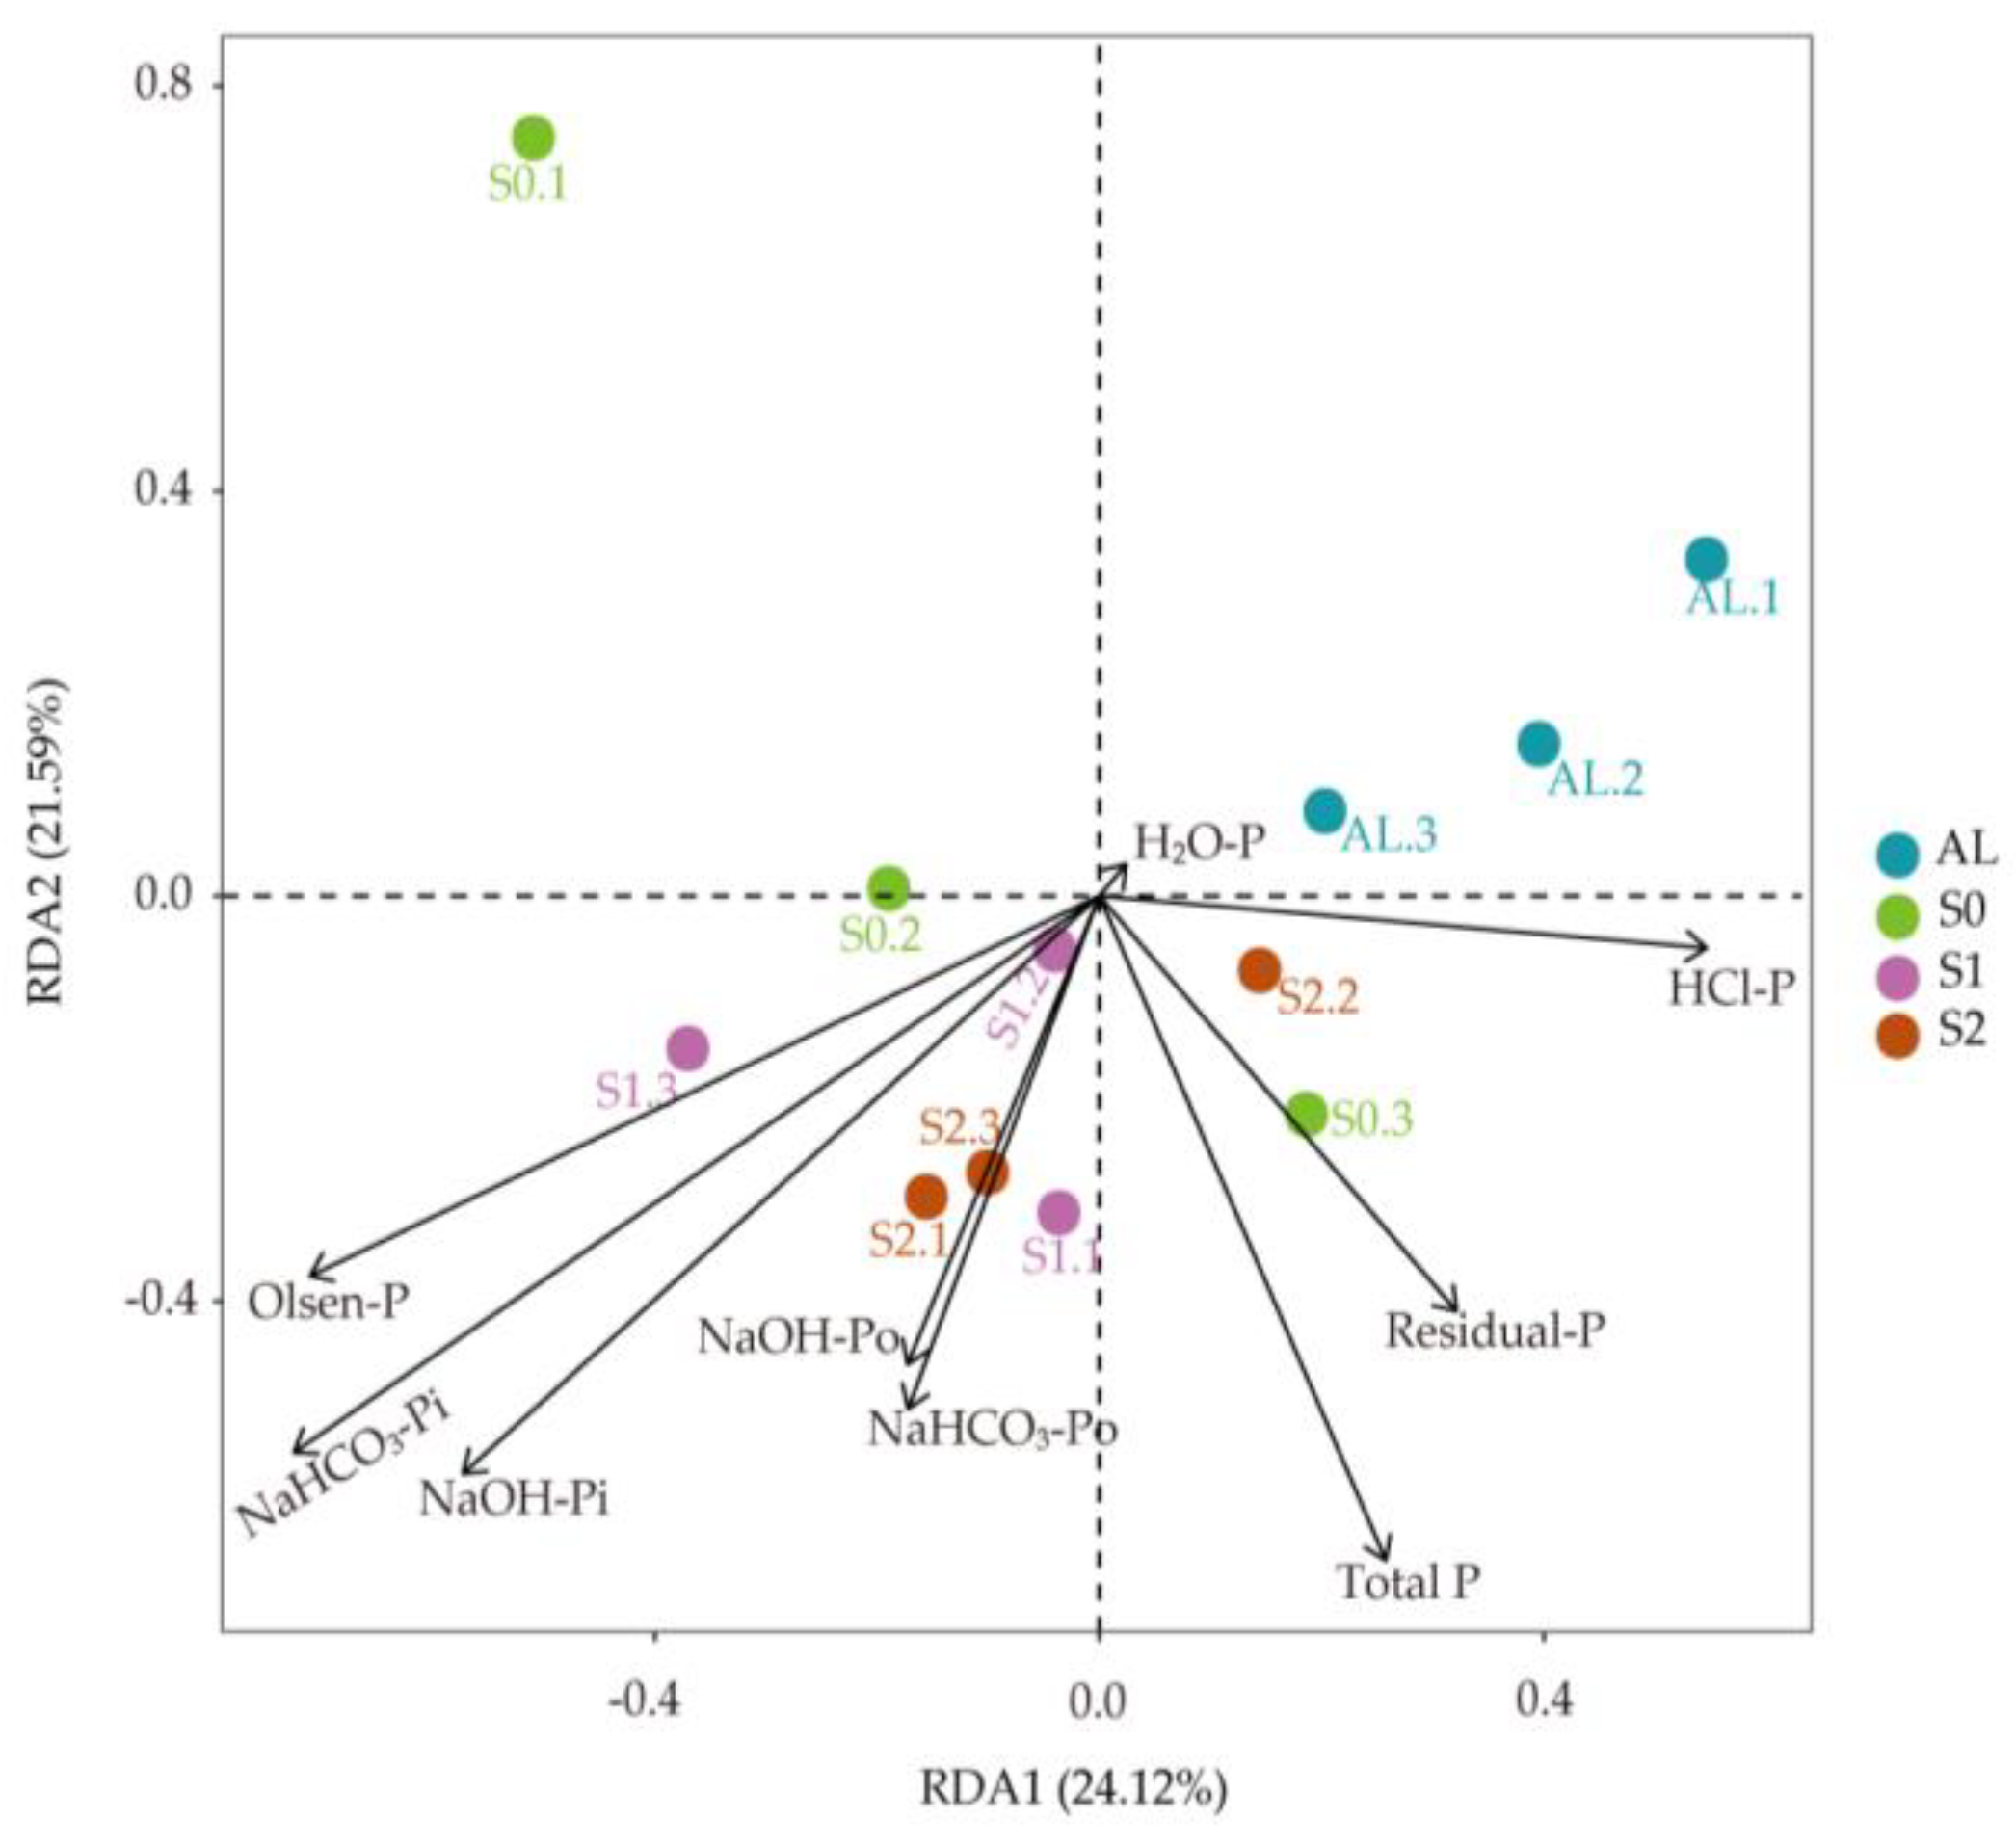
3.2. Soil P Fractions

The results in Table 1 show the change in soil P content after straw return for 10 years. Compared with the S0 treatment, the soil Olsen-P content in the S2 treatment increased by 3.27 mg kg−1. The soil Olsen-P content in the AL treatment was significantly lower than that in the other three treatments. The soil total P (TP) content in the S1 and S2 treatments was significantly higher than that in the S0 treatment, with increases of 16.70% and 19.78%, respectively, indicating that the high straw return was most conducive to the accumulation of soil TP. The soil TP content in the AL treatment was significantly higher compared with the S0 treatment, and significantly lower than that in the S2 treatment.
Straw return and land use had different effects on the size of the P fractions (Table 1). In general, the soil Pi content was significantly higher than the Po content across the four treatments. No significant differences were observed among these four treatments for H2O-P and residual P. When compared to the S0 treatment, the S1 and S2 treatments significantly increased NaHCO3-Pi, NaHCO3-Po, NaOH-Pi, NaOH-Po, and HCl-P, and NaHCO3-P and NaOH-P increased with increasing rice straw return amount. The NaHCO3-Po and NaOH-Pi in the S2 treatment were significantly higher than those in the S1 treatment. Compared to those of treatments with rice planting, the NaHCO3-Po and NaOH-Pi in the AL treatment were significantly lower, but the HCl-P was significantly higher. The AL treatment resulted in increases of 28.15% NaHCO3-Po and 7.36% HCl-P and decreases of 15.80% NaHCO3-Pi and 19.97% NaOH-Pi compared with the S0 treatment. The labile P, moderately labile P, and nonlabile P in the S1 and S2 treatments were significantly higher than those in the S0 treatment. Compared to the S0, S1, and S2 treatments, the AL treatment significantly decreased the labile P and moderately labile P and significantly increased the nonlabile P. Straw return significantly increased the Pi and Po when compared with the S0 treatment, and the Po increased more than the Pi. Compared with the S0 treatment, the AL treatment significantly decreased the Pi but increased the Po.
On average, as a percentage of total P, 24.50% of P was present as labile P, 23.41% as moderately labile P, and 52.09% as nonlabile P in the four treatments, and nonlabile P was the main P pool in the soil (Figure 3). Compared to the S0 treatment, the S1 and S2 treatments significantly increased the percentage of labile P and moderately labile P and significantly decreased the percentage of nonlabile P. The AL treatment significantly decreased the percentage of labile P and moderately labile P and significantly increased the percentage of nonlabile P. Straw return and the AL treatment significantly increased the percentage of Po compared with the S0 treatment.

3.3. Soil Phosphatase Activity

Soil phosphatase is a key indicator for measuring the soil P transformation ability. Ten years of straw return affected the soil phosphatase activity (Table 2). Treatments with straw return increased the activities of soil acid phosphatase (S-ACP) and soil neutral phosphatase (S-NP) to varying degrees, while the soil alkaline phosphatase (S-AKP) activity did not change significantly. The S-ACP activity in the S1 and S2 treatments was higher than that in the S0 treatment, and the S-ACP activity in the S2 treatment increased significantly by 24.45%. The S-ACP activity in the S2 treatment was significantly higher than that in the S1 treatment. Compared with the S0 treatment, the S-NP activity in the S1 and S2 treatments increased by 23.84% and 59.85%, respectively. The differences in S-AKP activity among the treatments were not significant. The activities of S-ACP, S-NP, and S-AKP in the AL treatment were significantly lower than those in the S0, S1, and S2 treatments. Compared with the treatments under rice planting, the AL treatment exhibited significantly lower soil phosphatase activity.

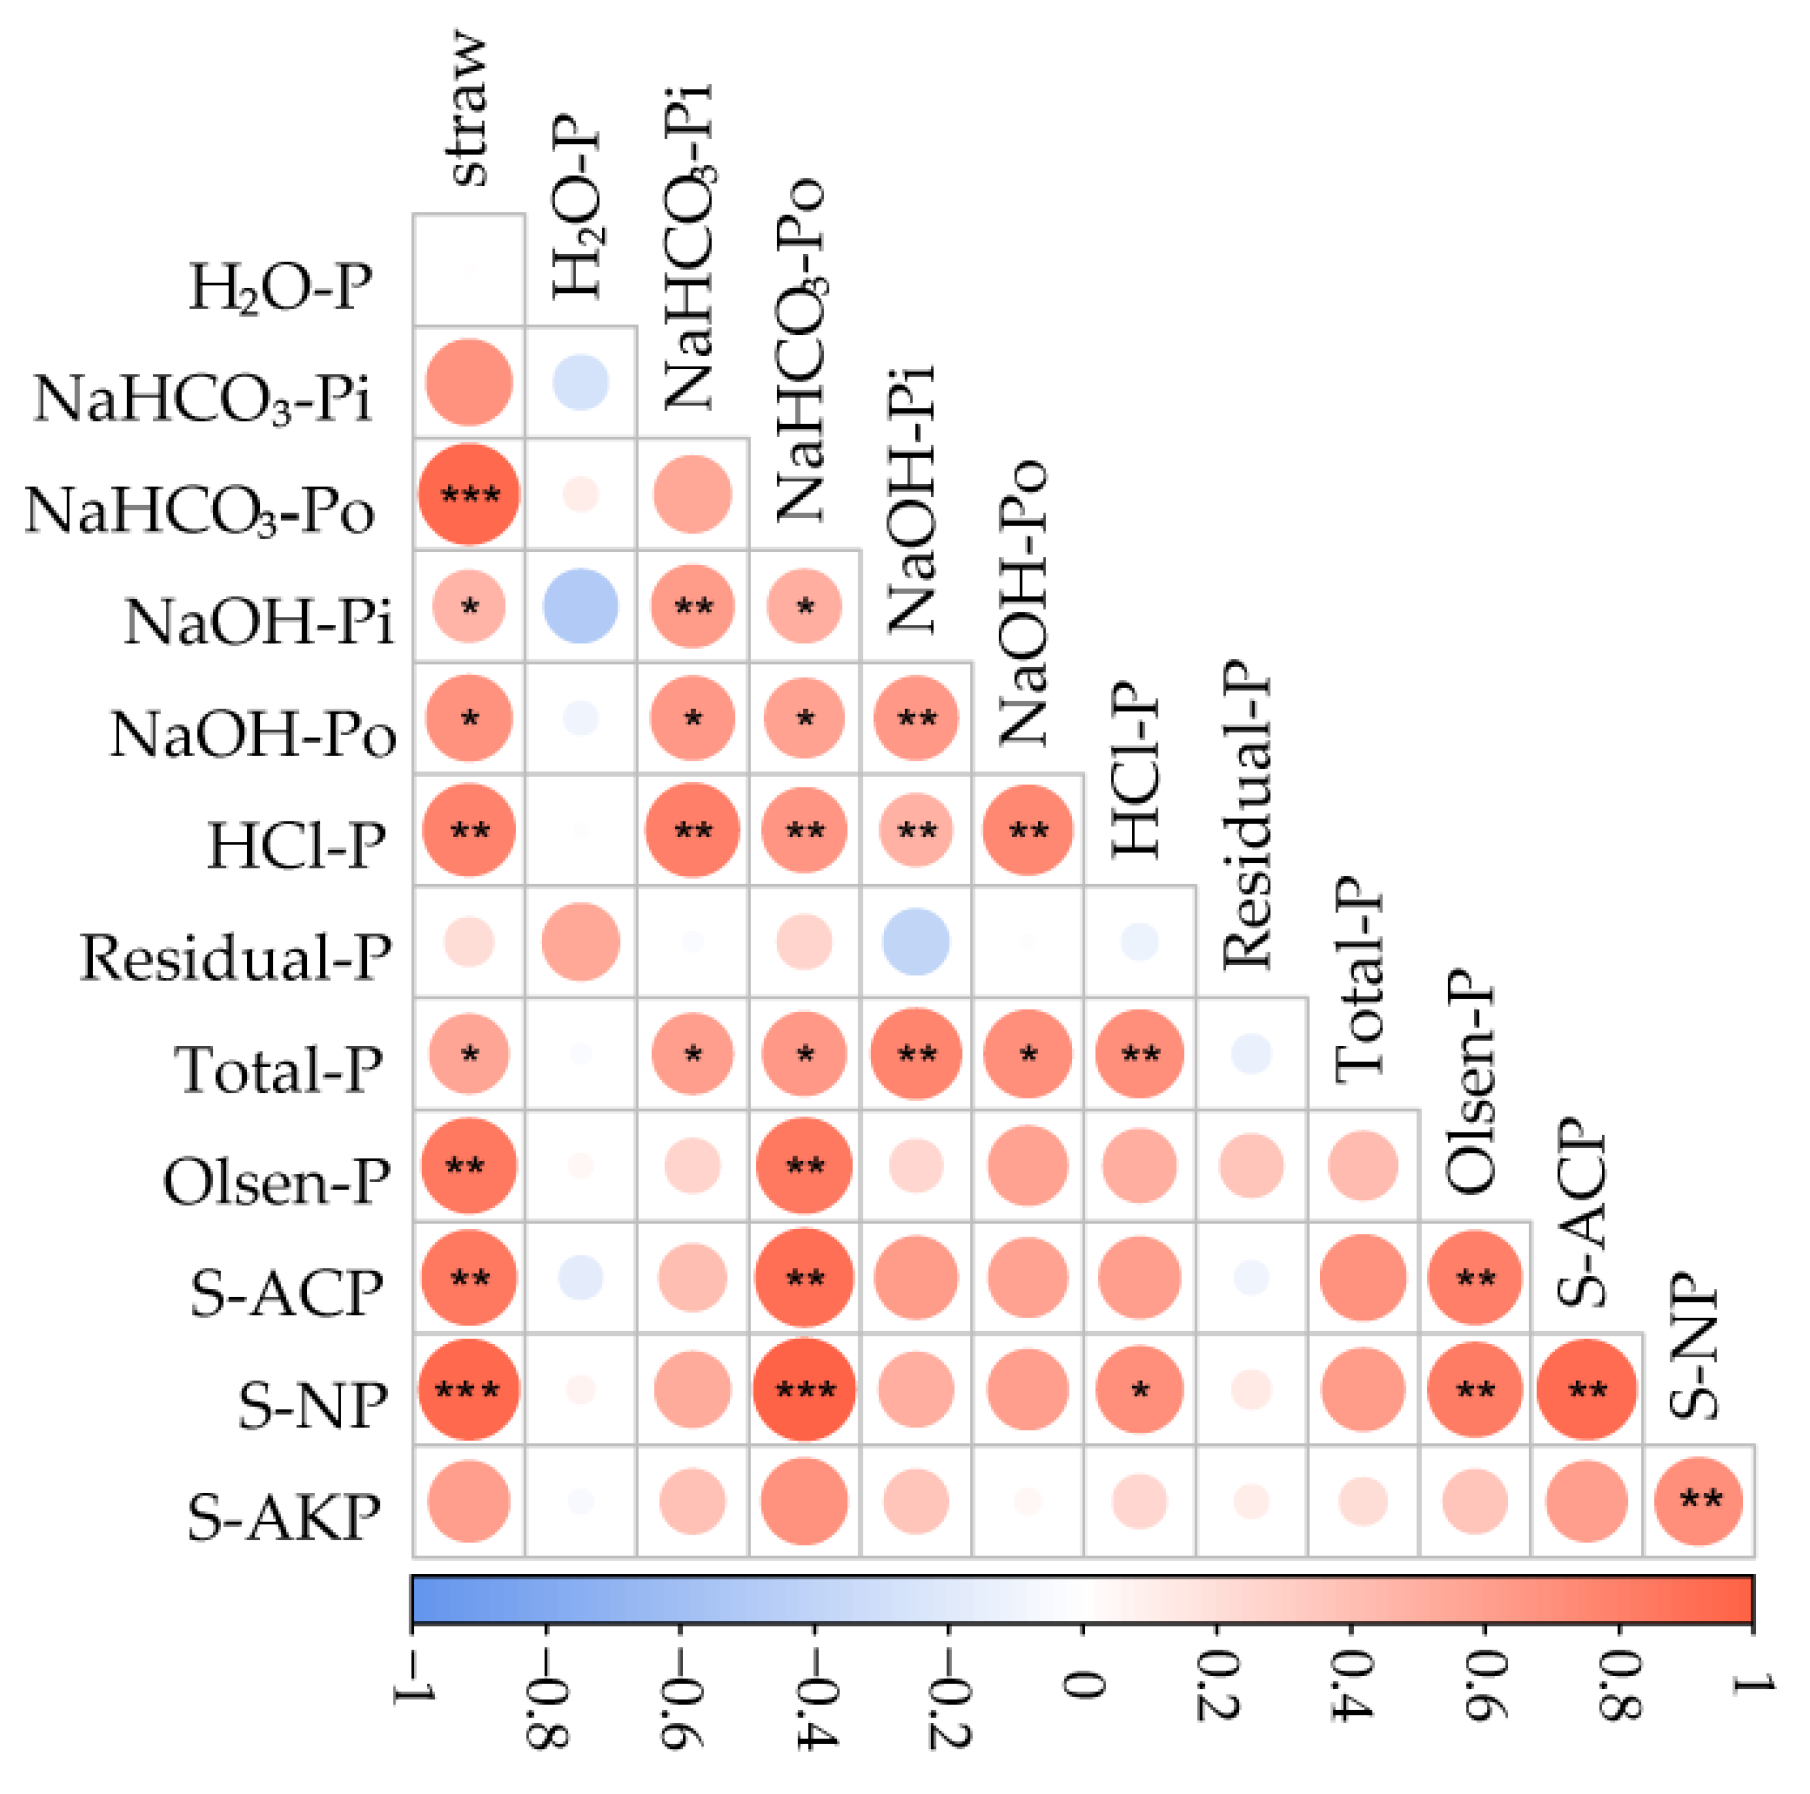
3.4. Correlation between Straw Amount, Soil P Fractions, and Phosphatase Activity

Correlation analysis was used to study the degree of association between and among the straw amount, soil P fractions, and soil phosphatase activity, and the results are shown in Figure 4. The amount of straw was positively correlated with soil P fractions and phosphatase activity. NaHCO3-Pi and NaHCO3-Po were positively correlated with NaOH-Pi, NaOH-Po, HCl-P, and TP. NaOH-Pi and HCl-P were positively correlated with NaHCO3-Pi, NaHCO3-Po, NaOH-Po, and TP. S-ACP and S-NP were positively correlated with Olsen-P and NaHCO3-Po.

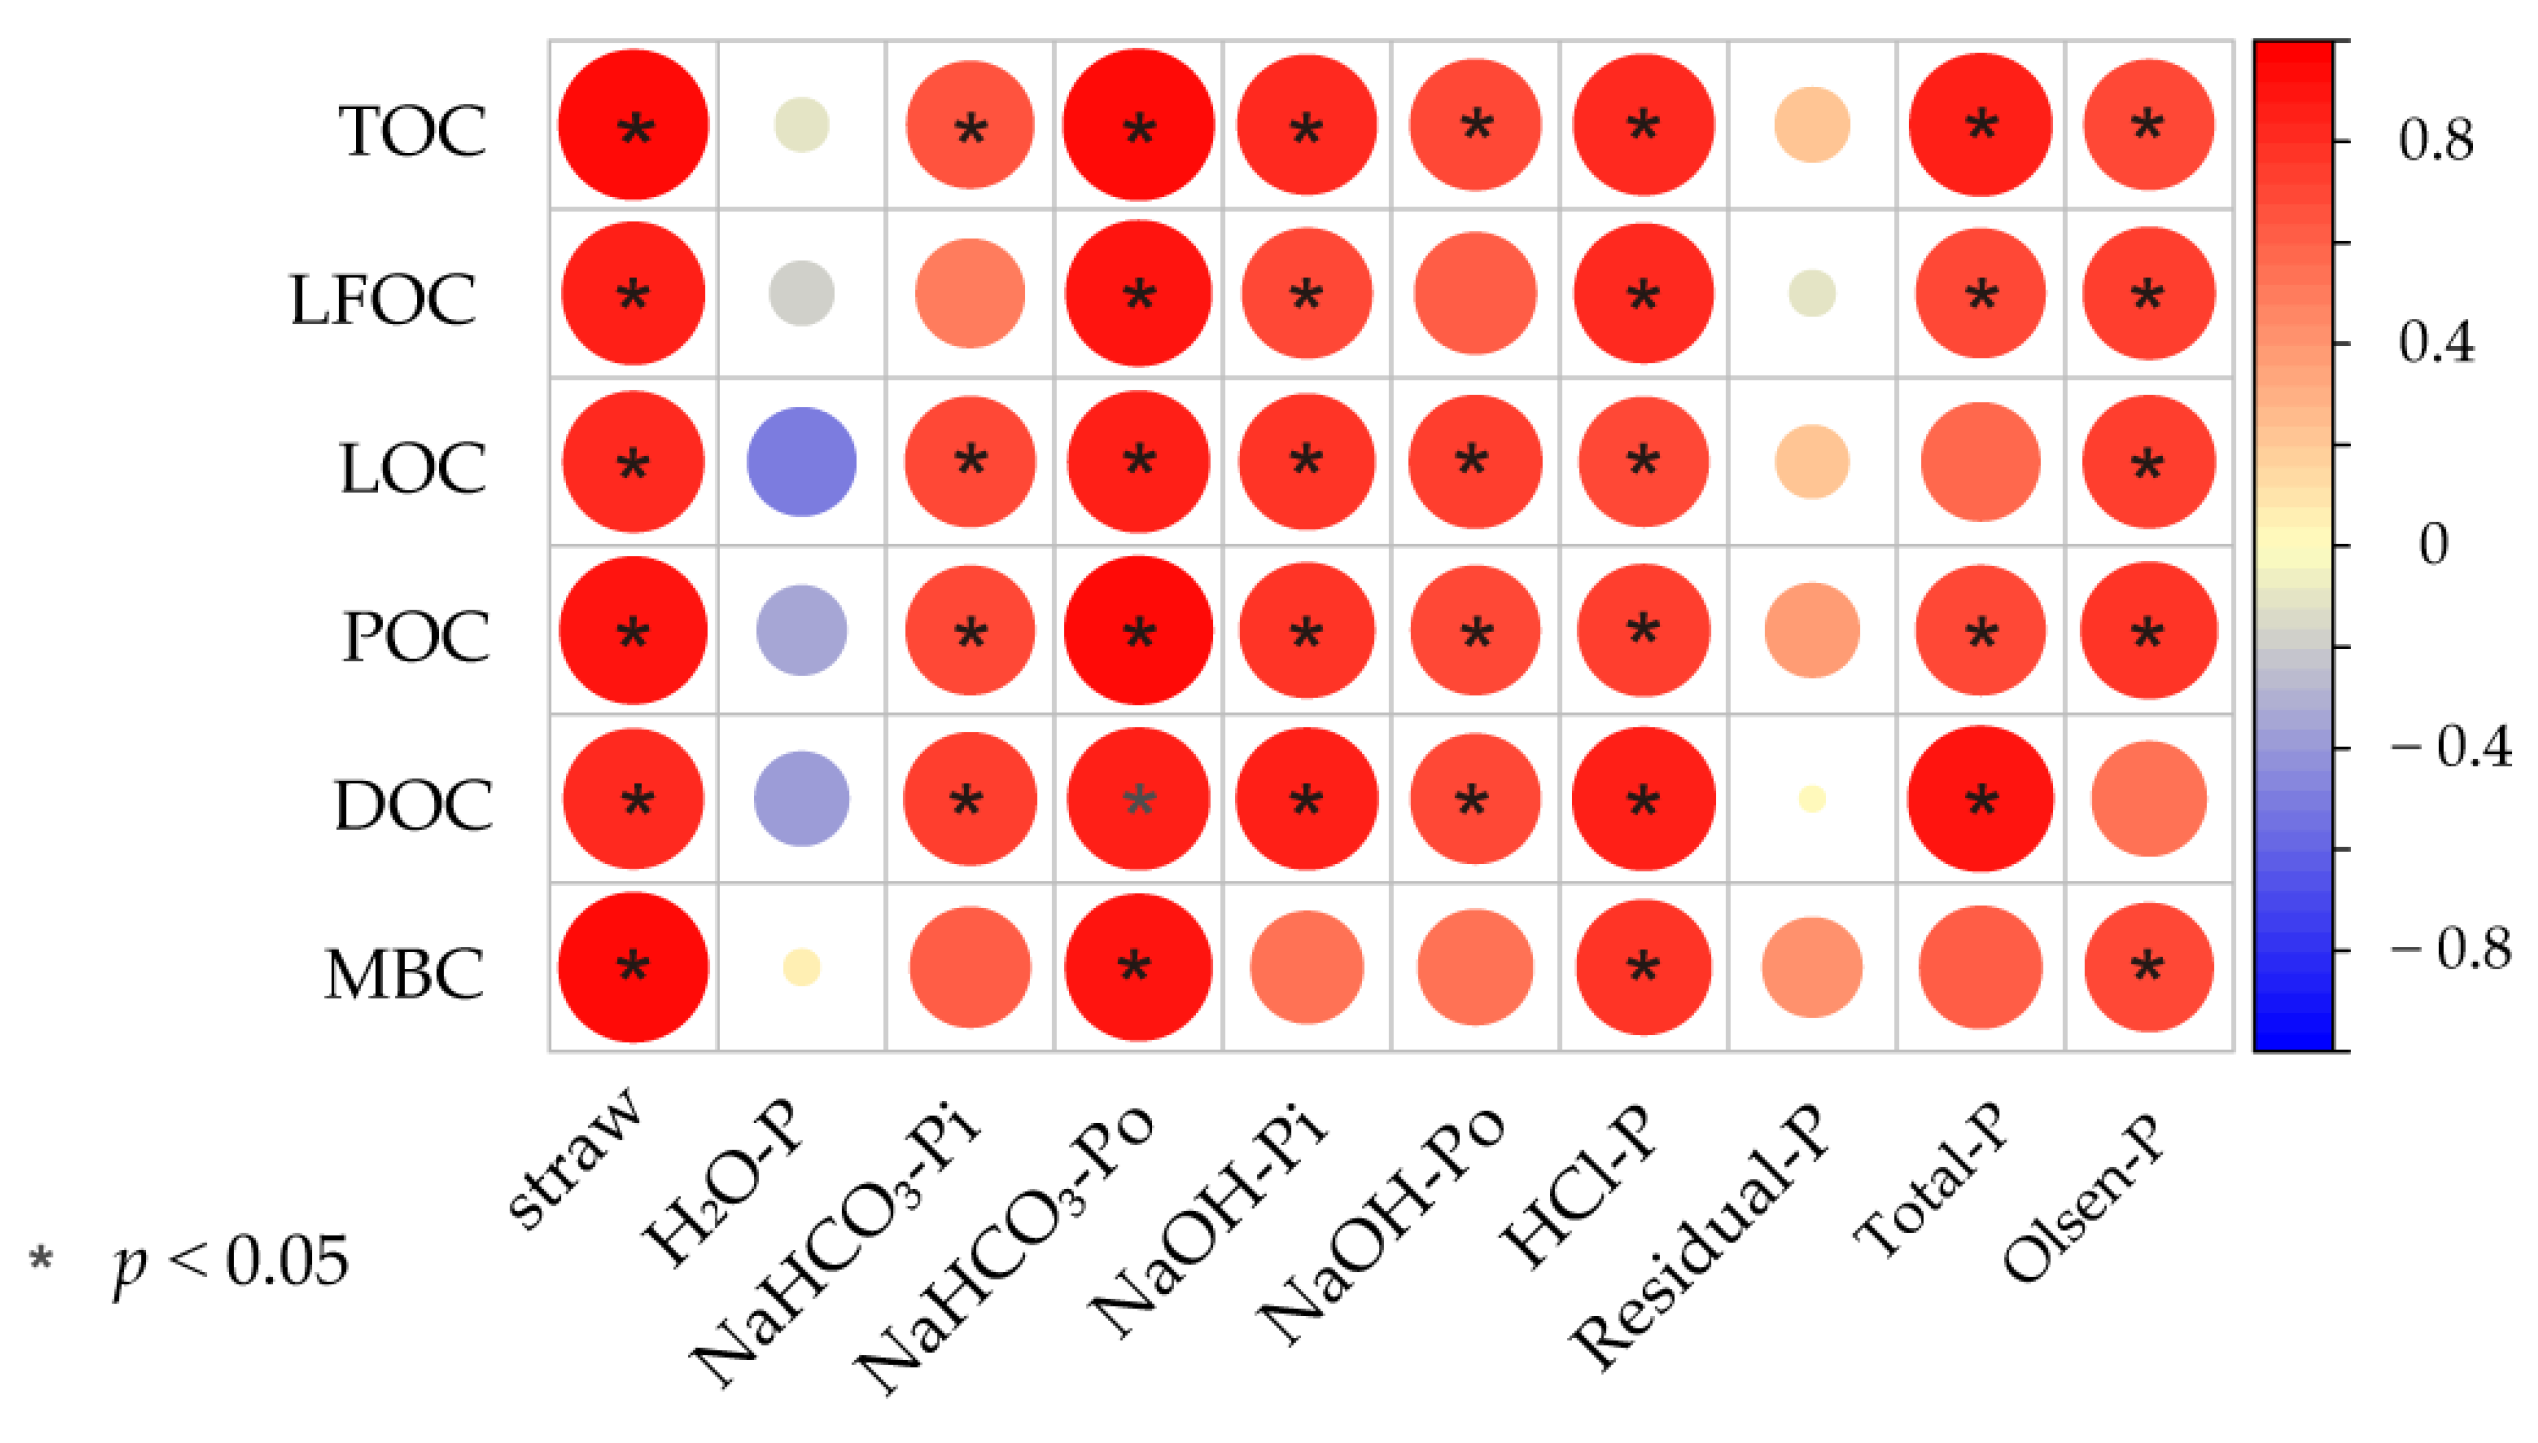
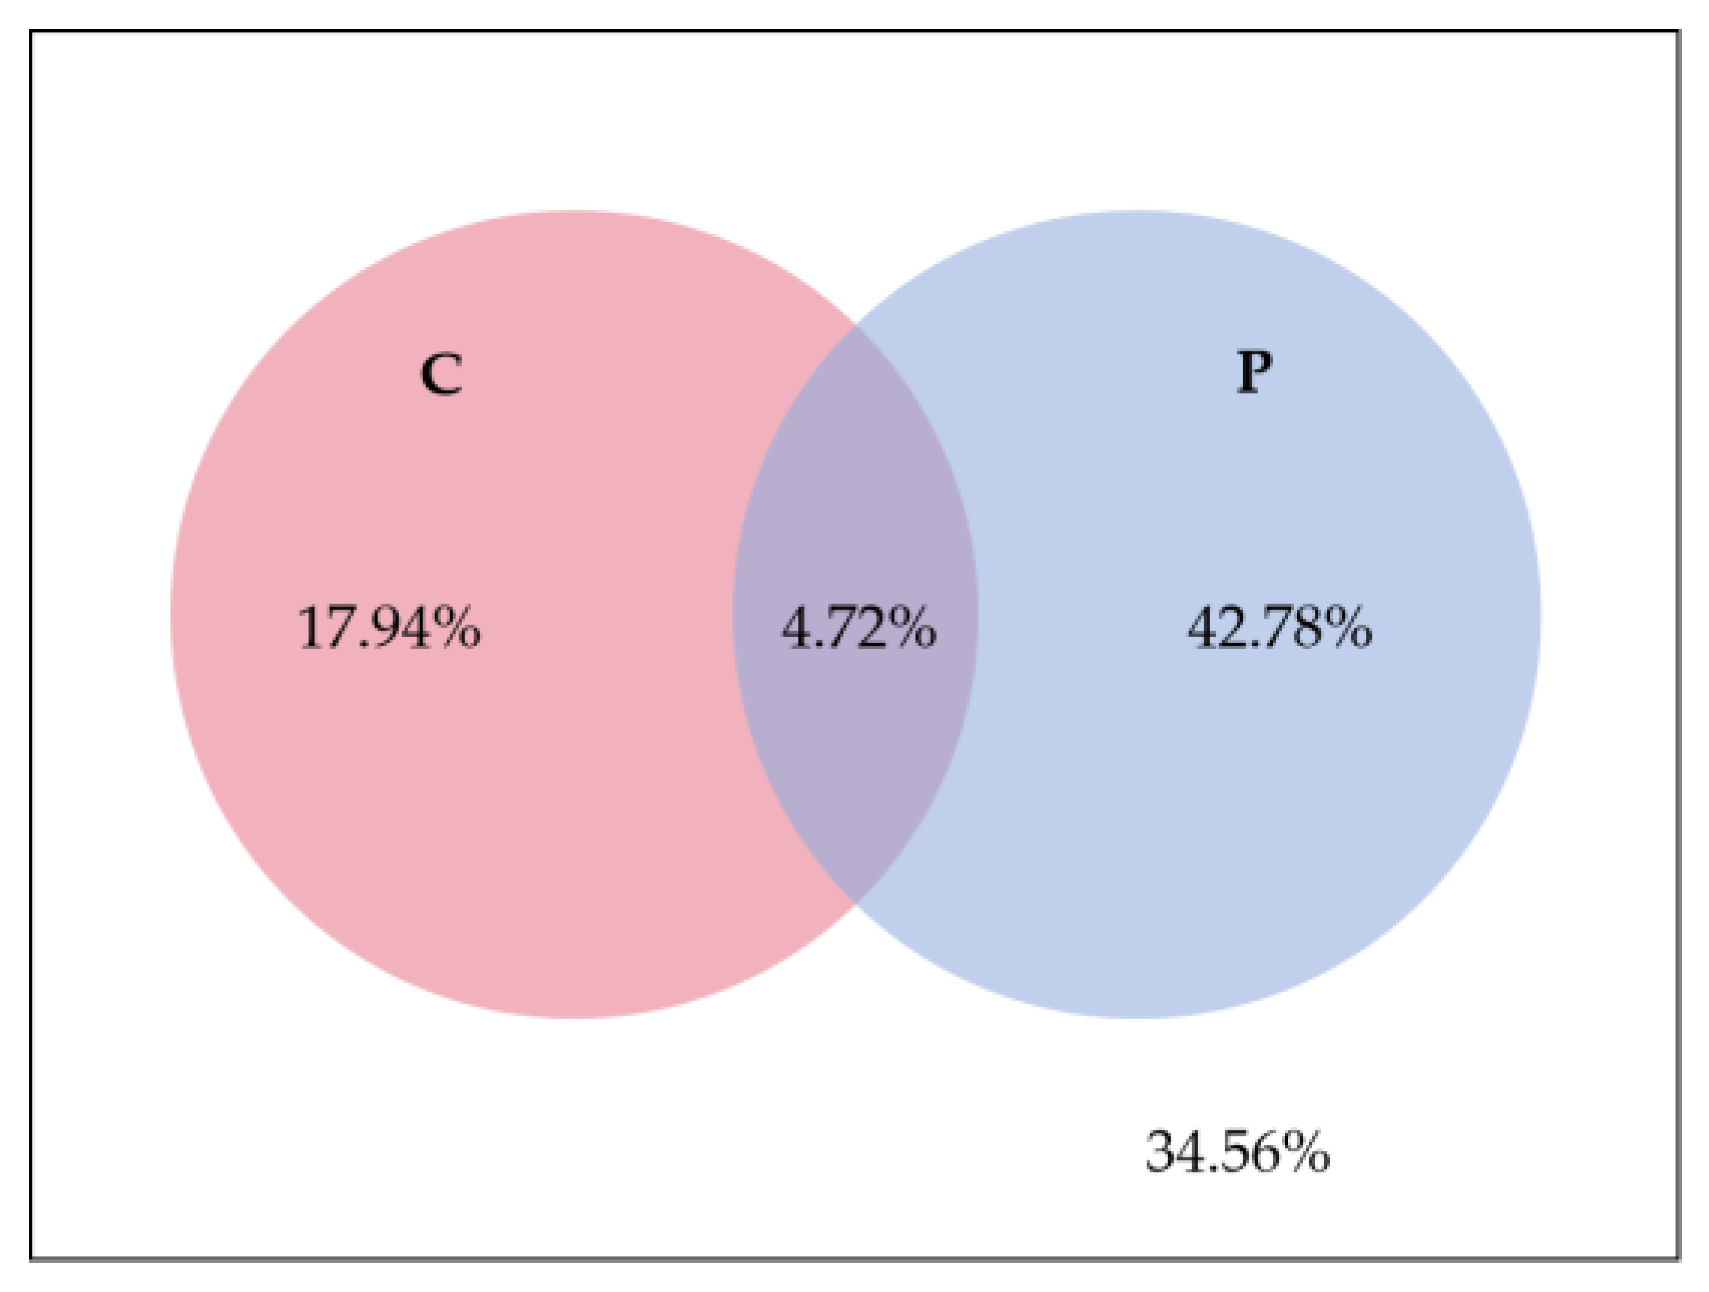
3.5. Correlation between Soil P Fractions and C Fractions

Using the same experimental site as that used in this study, Yan et al. [22] found that straw return significantly affected the soil C fractions. Combined with the experimental results of this study, high correlations were observed between the soil C and P fractions (Figure 5). The amount of straw, NaHCO3-Po, and HCl-P were positively correlated with the total organic carbon (TOC), light fraction organic carbon (LFOC), labile organic carbon (LOC), particulate organic carbon (POC), dissolved organic carbon (DOC), and microbial biomass carbon (MBC). NaHCO3-Pi and NaOH-Po were positively correlated with TOC, LOC, POC, and DOC. NaOH-Pi and Olsen-P were positively correlated with TOC, LFOC, LOC, and POC. TP was positively correlated with TOC, LFOC, POC, and DOC.

3.6. Effect of Straw Return on PSB Abundance

Straw return and land use affected the relative abundance and composition of soil PSB (Table 3) [22]. Across all the samples, a wide range of bacteria were found to solubilize mineral P, and PSB were found to belong to 3 phyla, 4 classes, and 17 families. The observed PSB belong to 3 phyla, including Proteobacteria, Bacteroidetes, and Actinobacteria, and 4 classes, including Betaproteobacteria, Alphaproteobacteria, Gammaproteobacteria, and Bacilli. Compared with the level in the S0 treatment, the relative abundance of PSB was higher in the S2 treatment, and the relative abundances of PSB at the phylum and family levels were lower in the S1 and AL treatments.
A partial redundancy analysis (RDA) was used to analyze the correlations between the soil P fractions and the microbial communities at the phylum level (Figure 6). The total contribution rate of the two axes of the RDA was 45.71%, and the contribution rate of the first axis of the RDA was 24.12%. The NaHCO3-Pi content had the most influence on the microbial communities, followed by the NaOH-Pi, Olsen-P, and TP contents, and the NaHCO3-Po, residual-P, and H2O-P contents had little effect on the microbial communities.
As shown in Figure 7, the environmental factors were grouped; one group included the soil organic C fractions, which is named C, and another group included the soil P fractions, which is named P. For the soil microbial distribution, the explanatory rate of the C group was 17.94%, the explanatory rate of the P group was 42.78%, the common explanatory rate of the C and P groups was 4.72%, and the unexplained proportion was 34.56%. The results showed that the effect of the soil P fractions on species distribution was greater than that of the soil C fractions.

4. Discussion

4.1. Effect of Straw Return on Rice Yield, P Uptake, and P Budget

In a subtropical monsoon climate, straw return increases rice yield compared with no straw return in double rice-cropping systems and rice–wheat-cropping systems [28]. In Northeast China, maize straw return has no significant difference in maize yield and P uptake [29]. In this study, rice straw return had no effect on rice yield during the 10-year cultivation, rice yield showed an increasing trend after straw return for 7 years. The reason may be that long-term straw return gradually improved soil nutrients and had a positive impact on rice yield [10]. The rice yield varied between the different years, which may be influenced by the climate and other reasons.
P fertilization regimes or crop rotations have no effect on corresponding crop P contents and the P uptake of crops [30]. Our study also showed that straw return had no effect on the P uptake of rice. The P balance is negative with no straw return, but the balance is positive when both wheat straw and rice straw are returned, increasing the P input [10]. In this study, the S0 and S1 treatments showed a negative P budget, indicating that P removal by rice plants exceeded the P input, while the S2 treatment partly returned the P taken away by rice growth, and showed a positive P budget.

4.2. Effect of Straw Return on Soil P Content

Straw return increases the soil Olsen-P and TP contents, reduces P absorption, and increases P release [10]. In this study, compared with the S0 treatment, straw return increased soil Olsen-P and total P, and the AL treatment not only significantly decreased the Olsen-P content but also increased the soil TP content. MacDonald et al. [31] found that the soil P content usually increases after farmland abandonment. The weeds in the AL treatment were not removed from the field in this experiment, and the residues returned most of the P absorbed by the weeds. The amount of P removed by rice growth in the S0 treatment was greater than the amount of P applied, decreasing the soil P content. Therefore, the AL treatment had a higher TP content compared with the S0 treatment.
Conventional fertilization combined with straw return could replace part of the P fertilizer [10]. The results of this study showed that straw return significantly increased the soil Olsen-P and TP contents. In a 17-year experiment in eastern China, compared with NPK fertilizer, rice straw return had no effect on the P fractions [32]. The climate and soil types in Northeast China in our studies may be the main reason for the differences among studies. Li et al. [33] found that long-term (20-year) continuous application of a combination of P fertilizer, straw return, and green manure (SG) significantly increased P accumulation and that SG increased the contents of NaHCO3- and NaOH-extractable Pi and Po. In this study, the soil Pi content was the predominant constituent, and straw return significantly increased the NaHCO3-Pi, NaHCO3-Po, NaOH-Pi, NaOH-Po, and HCl-P contents. Straw return treatment increased the soil P content in this study; part of the reason may be due to the P input from rice straw, and another reason may be that the straw incorporation changes the soil environment, and influences the soil microbial community and subsequent nutrient transformations [6,34].
The soil Po fractions increased with time in a long-term field experiment in paddy soil in southeastern China, and compared with NPK fertilizer, NPK+manure, and NPK+straw increased the soil TP, Pi, and Po contents [8]. Compared with the S0 treatment, straw return significantly increased the soil Pi and Po contents, and the AL treatment significantly decreased the Pi content and increased the percentage of Po. Organic matter return increases microbial activity, promotes the formation of soil Po and provides a long-term slow-release P source for crops and soil microbes [16]. The increase in soil Po in the S1, S2, and AL treatments may be due to the return of rice straw and weed residues and the biological fixation of inorganic P. The differences in the physical and chemical properties of the soil, climate, availability of major nutrients, and soil moisture conditions [17] lead to the diversity of soil P availability.
In this study, compared with the S0 treatment, rice straw return significantly increased the contents and percentages of soil labile P and moderately labile P, increased the content of nonlabile P, but decreased the percentage of nonlabile P. Organic management enhances P cycling, reduces the transformation rate of Pi to more stable P forms, and enhances the increase in the labile P pool [35]. Compared to the paddy soil, the contents and percentages of labile P and moderately labile P in the AL treatment were significantly decreased, and the content and percentage of nonlabile P were significantly increased. In clay pasture soil, P accumulates in the form of nonlabile P [36]. Compared with the agroforestry system, pastures feature higher nonlabile P contents due to the strong ability of grass roots to absorb available P; thus, limited available P remains in the soil [37]. The soil P content in the AL treatment was similar to that in the pasture soil.

4.3. Correlation between Soil P Fractions and Enzyme Activities and C Fractions

Soil enzymes reflect microbial community composition and nutrient cycling activities [38]. The activity of S-ACP and S-AKP is increased by the long-term return of organic matter [39]. In this study, compared with the S0 treatment, the S1 and S2 treatments exhibited significantly higher S-ACP activity, and S-ACP activity was highest in the S2 treatment. The activity of S-ACP is higher than that of S-AKP in acidic soils, and the soil pH was decreased by rice straw return in this study [22], leading to an increase in S-ACP. The activities of S-ACP, S-NP, and S-AKP in the AL treatment were significantly lower than those in the rice cultivation soil. Wei et al. [15] found that a no-fertilization treatment reduced S-ACP activity. Because no fertilizer was applied in the AL treatment, our results are similar to the results of Wei et al. [15]. The previous results of these experiments showed that compared with no straw return, straw return for 3 years had no significant effect on soil phosphatase activity [40], while straw return for 5 years increased soil phosphatase activity [41]. When straw return was applied for 10 years, soil phosphatase activity increased further, indicating that the duration of straw return may be a key factor affecting soil phosphatase activity.
Compared with chemical fertilizer treatment, straw return for 3 years changes the structure of the microbial community and increases the soil phosphatase activity and Olsen-P content, and soil enzyme activity is significantly affected by Olsen-P [42]. Our study showed that straw return changed the microbial community and increased the soil Olsen-P content and phosphatase activity. The Olsen-P content was significantly positively correlated with S-ACP and S-AKP, which was consistent with previous research. Yang and Lu [43] found that the contents of various P forms were positively correlated with soil pH and total C. In this study, Olsen-P, TP, NaHCO3-P, and NaOH-P were positively correlated with the soil organic carbon fractions, similar to the results of Yang and Lu [43].

4.4. Relationship between Soil P Fractions and Microbial Communities

Straw return introduces a large amount of organic matter into the field, which promotes soil organic matter accumulation, resulting in an increase in microbial activity [16]. Organic manure increases the SOC and TP contents, and SOC and TP are the critical factors influencing the soil microbial community [44]. In this study, the soil available P and P fractions had a greater impact on the distribution of soil microbial species than the soil C fractions, and the NaHCO3-Pi content had the greatest impact on microbial communities. Microbes are an indispensable part of the soil P cycle and play an important role in regulating its availability to plants [45].
Most microbes that dissolve and mineralize soil P belong to Bacteroidetes, Actinobacteria, Proteobacteria, and Bacilli [18]. In this study, the observed PSB mainly belong to 3 phyla, including Proteobacteria, Bacteroidetes, and Actinobacteria, and 4 classes, including Betaproteobacteria, Alphaproteobacteria, Gammaproteobacteria, and Bacilli, similar to previous research. The abundance and composition of PSB are affected by the changes in soil P status, fertilizer, and land management measures [18]. At the phylum and family levels, compared with the S0 treatment, the S2 treatment exhibited a higher relative abundance of PSB, and the S1 and AL treatments exhibited lower relative abundances of PSB. The relative abundance of PSB did not correspond to the change in soil P content. Hu et al. [20] found that in a long-term experiment, the application of organic manure increased the abundance of PSB, while the application of P fertilizer had no effect. The abundance of PSB does not change with the change in soil P status but is highly correlated with the total abundance of bacteria [46]. The relative abundance of PSB did not correspond to the change in soil P content in this study. The phosphorus-solubilizing frequency increased with soil organic matter and the C:P ratio in the rhizosphere soil, and increased with soil pH in the non-rhizosphere soil [18]. In this study, straw return and AL treatments increased the soil SOC and C:P ratio (SOC: total P), and decreased the soil pH; these factors had a common influence on the change in soil PSB.

5. Conclusions

Compared to no straw return, rice straw return for 10 years had no significant effect on the yield and P uptake of rice. Rice straw return significantly increased the content of soil Olsen-P and TP, S-ACP, and S-NP activities, and the content and proportion of labile P and moderately labile P improved the soil P availability. The straw returned provided a continuous source of P to soil microbes, changing the relative abundance and composition of soil PSB. When rice straw returned at a rate of 12,500 kg ha−1, the cumulative P budget was positive, and soil P accumulation and the relative abundance of PSB were increased. Straw return may be a sustainable practice for rice production in cold regions.

Author Contributions

Conceptualization, Z.G. and S.Y.; methodology, S.Y.; software, J.L. (Jinwang Li); validation, C.Y., Z.G. and Z.Z.; formal analysis, S.Y.; investigation, S.Y. and J.F.; resources, Z.G.; data curation, C.L., J.L. (Jianan Li) and C.C.; writing—original draft preparation, S.Y.; writing—review and editing, S.Y.; visualization, S.Y.; supervision, C.Y.; project administration, C.Y.; funding acquisition, S.Y. and C.Y. All authors have read and agreed to the published version of the manuscript.

Funding

This study was funded by the General Program of Heilongjiang Provincial Postdoctoral Foundation of China, grant number LBH-Z22077, the National Natural Science Foundation of China, grant number 31601270, and the Academic Backbone of Northeast Agricultural University, grant number 20XG01.

Data Availability Statement

The data presented in this study are included within the article.

Conflicts of Interest

The authors declare no conflict of interest.

References

  1. Wang, Y.; Lambers, H. Root-released organic anions in response to low phosphorus availability: Recent progress, challenges and future perspectives. Plant Soil 2020, 447, 135–156. [Google Scholar] [CrossRef]
  2. Sanguin, H.; Wilson, N.L.; Kertesz, M.A. Assessment of functional diversity and structure of phytate-hydrolysing bacterial community in Lolium perenne rhizosphere. Plant Soil 2016, 401, 151–167. [Google Scholar] [CrossRef]
  3. Sanyal, S.K.; De Datta, S.K. Chemistry of Phosphorus Transformations in Soil: Advances in Soil Science; Springer: New York, NY, USA, 1991; Volume 16. [Google Scholar]
  4. Zhu, H.; Wu, J.; Huang, D.; Zhu, Q.; Liu, S.; Su, Y.; Wei, W.; Syers, J.K.; Li, Y. Improving fertility and productivity of a highly-weathered upland soil in subtropical China by incorporating rice straw. Plant Soil 2010, 331, 427–437. [Google Scholar] [CrossRef]
  5. Suriyagoda, L.; De Costa, W.A.J.M.; Lambers, H. Growth and phosphorus nutrition of rice when inorganic fertiliser application is partly replaced by straw under varying moisture availability in sandy and clay soils. Plant Soil 2014, 384, 53–68. [Google Scholar] [CrossRef]
  6. Yadvinder, S.; Bijay, S.; Timsina, J. Crop residue management for nutrient cycling and improving soil productivity in rice-based cropping systems in the tropics. Adv. Agron. 2005, 85, 269–407. [Google Scholar]
  7. Damon, P.M.; Bowden, B.; Rose, T.; Rengel, Z. Crop residue contributions to phosphorus pools in agricultural soils: A review. Soil Biol. Biochem. 2014, 74, 127–137. [Google Scholar] [CrossRef]
  8. Lan, Z.M.; Lin, X.J.; Wang, F.; Zhang, H.; Chen, C.R. Phosphorus availability and rice grain yield in a paddy soil in response to long-term fertilization. Biol. Fertil. Soils 2012, 48, 579–588. [Google Scholar] [CrossRef]
  9. Li, F.; Liang, X.; Zhang, H.; Tian, G. The influence of no-till coupled with straw return on soil phosphorus speciation in a two-year rice-fallow practice. Soil Tillage Res. 2019, 195, 104389. [Google Scholar] [CrossRef]
  10. Gupta, R.K.; Yadvinder, S.; Ladha, J.K.; Bijay, S.; Singh, J.; Singh, G.; Pathak, H. Yield and phosphorus transformations in a rice–wheat system with crop residue and phosphorus management. Soil Sci. Soc. Am. J. 2007, 71, 1500–1507. [Google Scholar] [CrossRef]
  11. Zhang, W.; Wang, Q.; Wu, Q.; Zhang, S.; Zhu, P.; Peng, C.; Huang, S.; Wang, B.; Zhang, H. The response of soil Olsen-P to the P budgets of three typical cropland soil types under long-term fertilization. PLoS ONE 2020, 15, e0230178. [Google Scholar] [CrossRef]
  12. Blake, L.; Johnston, A.; Poulton, P.; Goulding, K.J.P. Changes in soil phosphorus fractions following positive and negative phosphorus balances for long periods. Plant Soil 2003, 254, 245–261. [Google Scholar] [CrossRef]
  13. Shen, J.; Li, R.; Zhang, F.; Fan, J.; Tang, C.; Rengel, Z. Crop yields, soil fertility and phosphorus fractions in response to long-term fertilization under the rice monoculture system on a calcareous soil. Field Crops Res. 2004, 86, 225–238. [Google Scholar] [CrossRef]
  14. Wang, J.; Wang, X.; Xu, M.; Feng, G.; Zhang, W.; Lu, C. Crop yield and soil organic matter after long-term straw return to soil in China. Nutr. Cycl. Agroecosys. 2015, 102, 371–381. [Google Scholar] [CrossRef]
  15. Wei, K.; Bao, H.; Huang, S.; Chen, L. Effects of long-term fertilization on available P, P composition and phosphatase activities in soil from the Huang-Huai-Hai Plain of China. Agric. Ecosyst. Environ. 2017, 237, 134–142. [Google Scholar] [CrossRef]
  16. Malik, M.A.; Marschner, P.; Khan, K.S. Addition of organic and inorganic P sources to soil–Effects on P pools and microorganisms. Soil Biol. Biochem. 2012, 49, 106–113. [Google Scholar] [CrossRef]
  17. Yang, C.; Yang, L.; Jianhua, L. Organic phosphorus fractions in organically amended paddy soils in continuously and intermittently flooded conditions. J. Environ. Qual. 2006, 35, 1142–1150. [Google Scholar] [CrossRef] [PubMed]
  18. Mander, C.; Wakelin, S.; Young, S.; Condron, L.; O’Callaghan, M. Incidence and diversity of phosphate-solubilising bacteria are linked to phosphorus status in grassland soils. Soil Biol. Biochem. 2012, 44, 93–101. [Google Scholar] [CrossRef]
  19. Kwabiah, A.B.; Palm, C.A.; Stoskopf, N.C.; Voroney, R.P. Response of soil microbial biomass dynamics to quality of plant materials with emphasis on P availability. Soil Biol. Biochem. 2003, 35, 207–216. [Google Scholar] [CrossRef]
  20. Hu, J.; Lin, X.; Wang, J.; Chu, H.; Yin, R.; Zhang, J. Population size and specific potential of P-mineralizing and -solubilizing bacteria under long-term P-deficiency fertilization in a sandy loam soil. Pedobiologia 2009, 53, 49–58. [Google Scholar] [CrossRef]
  21. Kumar, A.; Kushwaha, K.K.; Singh, S.; Shivay, Y.S.; Meena, M.C.; Nain, L. Effect of paddy straw burning on soil microbial dynamics in sandy loam soil of Indo-Gangetic plains. Environ. Technol. Innov. 2019, 16, 100469. [Google Scholar] [CrossRef]
  22. Yan, S.; Song, J.; Fan, J.; Yan, C.; Dong, S.; Ma, C.; Gong, Z. Changes in soil organic carbon fractions and microbial community under rice straw return in Northeast China. Glob. Ecol. Conser. 2020, 22, e00962. [Google Scholar] [CrossRef]
  23. Lu, R. Methods of Agricultural Chemical Analysis of Soil; China Agricultural Science and Technology Press: Beijing, China, 2000. [Google Scholar]
  24. Olsen, S.; Cole, C.; Watanabe, F.; Dean, L. Estimation of Available P in Soil by Extraction with Sodium Bicarbonate; Government Printing Office: Washington, DC, USA, 1953; p. 19. [Google Scholar]
  25. Tabatabai, M.A.; Bremner, J.M. Use of p-nitrophenyl phosphate for assay of soil phosphatase activity. Soil Biol. Biochem. 1969, 1, 301–307. [Google Scholar] [CrossRef]
  26. Hedley, M.J.; Stewart, J.W.B.; Chauhan, B.S. Changes in inorganic and organic soil phosphorus fractions induced by cultivation practices and by laboratory incubations. Soil Sci. Soc. Am. J. 1982, 46, 970–976. [Google Scholar] [CrossRef]
  27. Messiga, A.J.; Ziadi, N.; Plénet, D.; Parent, L.E.; Morel, C. Long-term changes in soil phosphorus status related to P budgets under maize monoculture and mineral P fertilization. Soil Use Manag. 2010, 26, 354–364. [Google Scholar] [CrossRef]
  28. Yuan, G.; Huan, W.; Song, H.; Lu, D.; Chen, X.; Wang, H.; Zhou, J. Effects of straw incorporation and potassium fertilizer on crop yields, soil organic carbon, and active carbon in the rice–wheat system. Soil Tillage Res. 2021, 209, 104958. [Google Scholar] [CrossRef]
  29. Wei, K.; Chen, Z.; Jiang, N.; Zhang, Y.; Feng, J.; Tian, J.; Chen, X.; Lou, C.; Chen, L. Effects of mineral phosphorus fertilizer reduction and maize straw incorporation on soil phosphorus availability, acid phosphatase activity, and maize grain yield in northeast China. Arch. Agron. Soil Sci. 2021, 67, 66–78. [Google Scholar] [CrossRef]
  30. Vandermoere, S.; Van De Sande, T.; Tavernier, G.; Lauwers, L.; Goovaerts, E.; Sleutel, S.; De Neve, S. Soil phosphorus (P) mining in agriculture–Impacts on P availability, crop yields and soil organic carbon stocks. Agric. Ecosyst. Environ. 2021, 322, 107660. [Google Scholar] [CrossRef]
  31. MacDonald, G.K.; Bennett, E.M.; Taranu, Z.E. The influence of time, soil characteristics, and land-use history on soil phosphorus legacies: A global meta-analysis. Glob. Chang. Biol. 2012, 18, 1904–1917. [Google Scholar] [CrossRef]
  32. Mao, X.; Xu, X.; Lu, K.; Gielen, G.; Luo, J.; He, L.; Donnison, A.; Xu, Z.; Xu, J.; Yang, W.; et al. Effect of 17 years of organic and inorganic fertilizer applications on soil phosphorus dynamics in a rice–wheat rotation cropping system in eastern China. J. Soils Sediments 2015, 15, 1889–1899. [Google Scholar] [CrossRef]
  33. Li, Y.; Yang, R.; Gao, R.; Wei, H.; Chen, A.; Li, Y. Effects of long-term phosphorus fertilization and straw incorporation on phosphorus fractions in subtropical paddy soil. J. Integr. Agric. 2015, 14, 365–373. [Google Scholar] [CrossRef]
  34. Guo, B.; Liang, Y.; Li, Z.; Han, F. Phosphorus Adsorption and Bioavailability in a Paddy Soil Amended with Pig Manure Compost and Decaying Rice Straw. Commun. Soil Sci. Plant Anal. 2009, 40, 2185–2199. [Google Scholar] [CrossRef]
  35. Xavier, F.A.D.S.; De Oliveira, T.S.; Andrade, F.V.; De Sá Mendonça, E. Phosphorus fractionation in a sandy soil under organic agriculture in Northeastern Brazil. Geoderma 2009, 151, 417–423. [Google Scholar] [CrossRef]
  36. Neufeldt, H.; da Silva, J.E.; Ayarza, M.A.; Zech, W. Land-use effects on phosphorus fractions in Cerrado oxisols. Biol. Fertil. Soils 2000, 31, 30–37. [Google Scholar] [CrossRef]
  37. Rocha Junior, P.R.D.; Ribeiro, P.H.; Mesquita, L.F.; Andrade, F.V.; Mendonça, E.D.S. Distribution of C and inorganic phosphorus fractions in different aggregate sizes under forestry, agroforestry system and pasture. J. Soil Sci. Plant Nut. 2018, 18, 361–375. [Google Scholar] [CrossRef]
  38. Sinsabaugh, R.L.; Lauber, C.L.; Weintraub, M.N.; Ahmed, B.; Allison, S.D.; Crenshaw, C.; Contosta, A.R.; Cusack, D.; Frey, S.; Gallo, M.E.; et al. Stoichiometry of soil enzyme activity at global scale. Ecol. Lett. 2008, 11, 1252–1264. [Google Scholar] [CrossRef]
  39. Luo, G.; Sun, B.; Li, L.; Li, M.; Liu, M.; Zhu, Y.; Guo, S.; Ling, N.; Shen, Q. Understanding how long-term organic amendments increase soil phosphatase activities: Insight into phoD- and phoC-harboring functional microbial populations. Soil Biol. Biochem. 2019, 139, 107632. [Google Scholar] [CrossRef]
  40. Yan, C.; Diao, X.; Ge, H.; Wang, X.; Ma, C.; Gong, Z. Effects of rice straw return-to-field on soil solution nutrients and enzyme activities. Chin. J. Soil Sci. 2012, 43, 1232–1236. (In Chinese) [Google Scholar]
  41. Zhan, H.; Yan, S.; Wang, J.; Ma, C.; Gong, Z.; Dong, S.; Zhang, Q. Effects of rice straw return-to-field on soil phosphatase activity and available phosphorus content. Crops 2015, 2, 78–83. (In Chinese) [Google Scholar]
  42. Zhou, G.; Gao, S.; Lu, Y.; Liao, Y.; Nie, J.; Cao, W. Co-incorporation of green manure and rice straw improves rice production, soil chemical, biochemical and microbiological properties in a typical paddy field in southern China. Soil Tillage Res. 2020, 197, 104499. [Google Scholar] [CrossRef]
  43. Yang, C.; Lu, S. Straw and straw biochar differently affect phosphorus availability, enzyme activity and microbial functional genes in an Ultisol. Sci. Total Environ. 2022, 805, 150325. [Google Scholar] [CrossRef]
  44. Dong, W.; Zhang, X.; Dai, X.; Fu, X.; Yang, F.; Liu, X.; Sun, X.; Wen, X.; Schaeffer, S. Changes in soil microbial community composition in response to fertilization of paddy soils in subtropical China. Appl. Soil Ecol. 2014, 84, 140–147. [Google Scholar] [CrossRef]
  45. Richardson, A.E.; Simpson, R.J. Soil microorganisms mediating phosphorus availability update on microbial phosphorus. Plant Physiol. 2011, 156, 989–996. [Google Scholar] [CrossRef] [PubMed]
  46. Kucey, R.M.N. Phosphate-solubilizing bacteria and fungi in various cultivated and virgin Alberta soils. Can. J. Soil Sci. 1983, 63, 671–678. [Google Scholar] [CrossRef]
Figure 1. Rainfall and accumulated temperature at the experimental site from 2008 to 2017.
Agronomy 13 02214 g001
Figure 2. (a) Grain yield of rice (t ha−1), (b) P uptake amounts in rice (kg ha−1), (c) Cumulative P budget of soils (kg ha−1) over 10 years of cultivation. Error bars indicate the standard errors (n = 3). Straw: the amount of straw return; time: time of straw return; *** represents significant difference at p < 0.001, NS represents no significant difference. S0: no straw return; S1: rice straw return at rates of 6250 kg ha−1; S2: rice straw return at rates of 12,500 kg ha−1. Different lowercases represent significant difference.
Agronomy 13 02214 g002
Figure 3. Proportion of each P fraction in the soil. Error bars indicate the standard errors (n = 3). S0: no straw return; S1: rice straw return at rates of 6250 kg ha−1; S2: rice straw return at rates of 12,500 kg ha−1; and AL: abandoned farmland.
Agronomy 13 02214 g003
Figure 4. Pearson correlation coefficients between P fraction and phosphatase (n = 12). * Represents significance at p < 0.05, ** represents significance at p < 0.01, *** represents significance at p < 0.001.
Agronomy 13 02214 g004
Figure 5. Pearson correlation coefficients between soil P and C fractions (n = 12). The C fractions data are from Yan et al. [22]. * Represents significance at p < 0.05. TOC: total organic carbon, LFOC: light fraction organic carbon, LOC: labile organic carbon, POC: particulate organic carbon, DOC: dissolved organic carbon, MBC: microbial biomass carbon.
Agronomy 13 02214 g005
Figure 6. Partial redundancy analysis (RDA) of soil P fractions and microbial communities at the phylum level. S0: no straw return; S1: rice straw return at rates of 6250 kg ha−1; S2: rice straw return at rates of 12,500 kg ha−1; and AL: abandoned farmland. The microbiological data are from Yan et al. [22].
Agronomy 13 02214 g006
Figure 7. Variation partitioning analysis (VPA) of effects of soil P fractions and organic C fractions on soil microbial community. C: soil organic C fractions, P: soil P fractions. The microbiological data are from Yan et al. [22].
Agronomy 13 02214 g007
Table 1. Soil P contents (mg kg−1).
TreatmentOlsen-PTotal PLabile PModerately Labile PNonlabile P
H2O-PNaHCO3-PiNaHCO3-PoNaOH-PiNaOH-PoHCl-PResidual P
S080.52 b991.25 c13.05 a155.75 b25.40 d122.86 c61.21 b377.75 c38.68 a
S181.27 ab1156.77 ab12.80 a162.63 a41.41 b144.69 b68.07 a396.00 b40.22 a
S283.79 a1187.28 a11.88 a164.31 a54.99 a152.54 a69.09 a394.21 b37.34 a
AL61.38 c1101.05 b12.03 a131.14 c32.55 c98.32 d64.73 ab405.57 a39.19 a
Data were expressed as means, and values within the same column by the different letters represent significance (LSD test, p < 0.05, n = 3). S0: no straw return; S1: rice straw return at rates of 6250 kg ha−1; S2: rice straw return at rates of 12,500 kg ha−1; and AL: abandoned farmland.
Table 2. Soil phosphatase activity (µmol d−1 g−1).
TreatmentS-ACPS-NPS-AKP
S021.31 b4.11 c4.82 a
S122.78 b5.09 b4.92 a
S226.52 a6.57 a5.26 a
AL17.16 c3.32 c3.36 b
Data were expressed as means, and values within the same column by the different letters represent significance (LSD test, p < 0.05, n = 3). S0: no straw return; S1: rice straw return at rates of 6250 kg ha−1; S2: rice straw return at rates of 12,500 kg ha−1; and AL: abandoned farmland.
Table 3. Taxonomy and relative abundance of phosphate-solubilizing bacteria.
TaxonomyRelative Abundance
S0S1S2AL
PhylumProteobacteria0.26180.27700.29350.3188
Bacteroidetes0.25250.24930.25130.1460
Actinobacteria0.04970.02150.03040.0272
ClassBetaproteobacteria0.06940.09160.09770.1621
Alphaproteobacteria0.05430.03250.06420.0576
Gammaproteobacteria0.05040.03700.04160.0314
Bacilli0.02830.02220.01230.0026
FamilySphingomonadaceae0.00860.00600.02500.0072
Comamonadaceae0.01420.01980.02300.0180
Enterobacteriaceae0.00870.00180.00200.0015
Flavobacteriaceae0.00960.00370.00480.0014
Micrococcaceae0.00740.00290.00690.0031
Nocardiaceae0.00480.00020.00030.0001
Microbacteriaceae0.00610.00350.00460.0020
Burkholderiaceae0.00430.00060.00070.0006
Xanthobacteraceae0.00350.00260.00450.0080
Pseudomonadaceae0.00540.00130.00360.0014
Bacillaceae0.00310.00070.00050.0002
Moraxellaceae0.00330.00050.00120.0003
Oxalobacteraceae0.00240.00440.00540.0027
Caulobacteraceae0.00320.00190.00370.0016
Nocardioidaceae0.00120.00140.00140.0009
Paenibacillaceae0.00050.00050.00040.0001
Sphingobacteriaceae0.00350.00340.00340.0012
S0: no straw return; S1: rice straw return at rates of 6250 kg ha−1; S2: rice straw return at rates of 12,500 kg ha−1; and AL: abandoned farmland. The microbiological data are from Yan et al. [22].
Disclaimer/Publisher’s Note: The statements, opinions and data contained in all publications are solely those of the individual author(s) and contributor(s) and not of MDPI and/or the editor(s). MDPI and/or the editor(s) disclaim responsibility for any injury to people or property resulting from any ideas, methods, instructions or products referred to in the content.

