
Optimizing Sowing Patterns and Nitrogen Management Strategies Used to Balance Maize Crop Productivity, N2O Emissions, and Economic Benefits in the Loess Plateau Region of China


Abstract
:1. Introduction
2. Materials and Methods
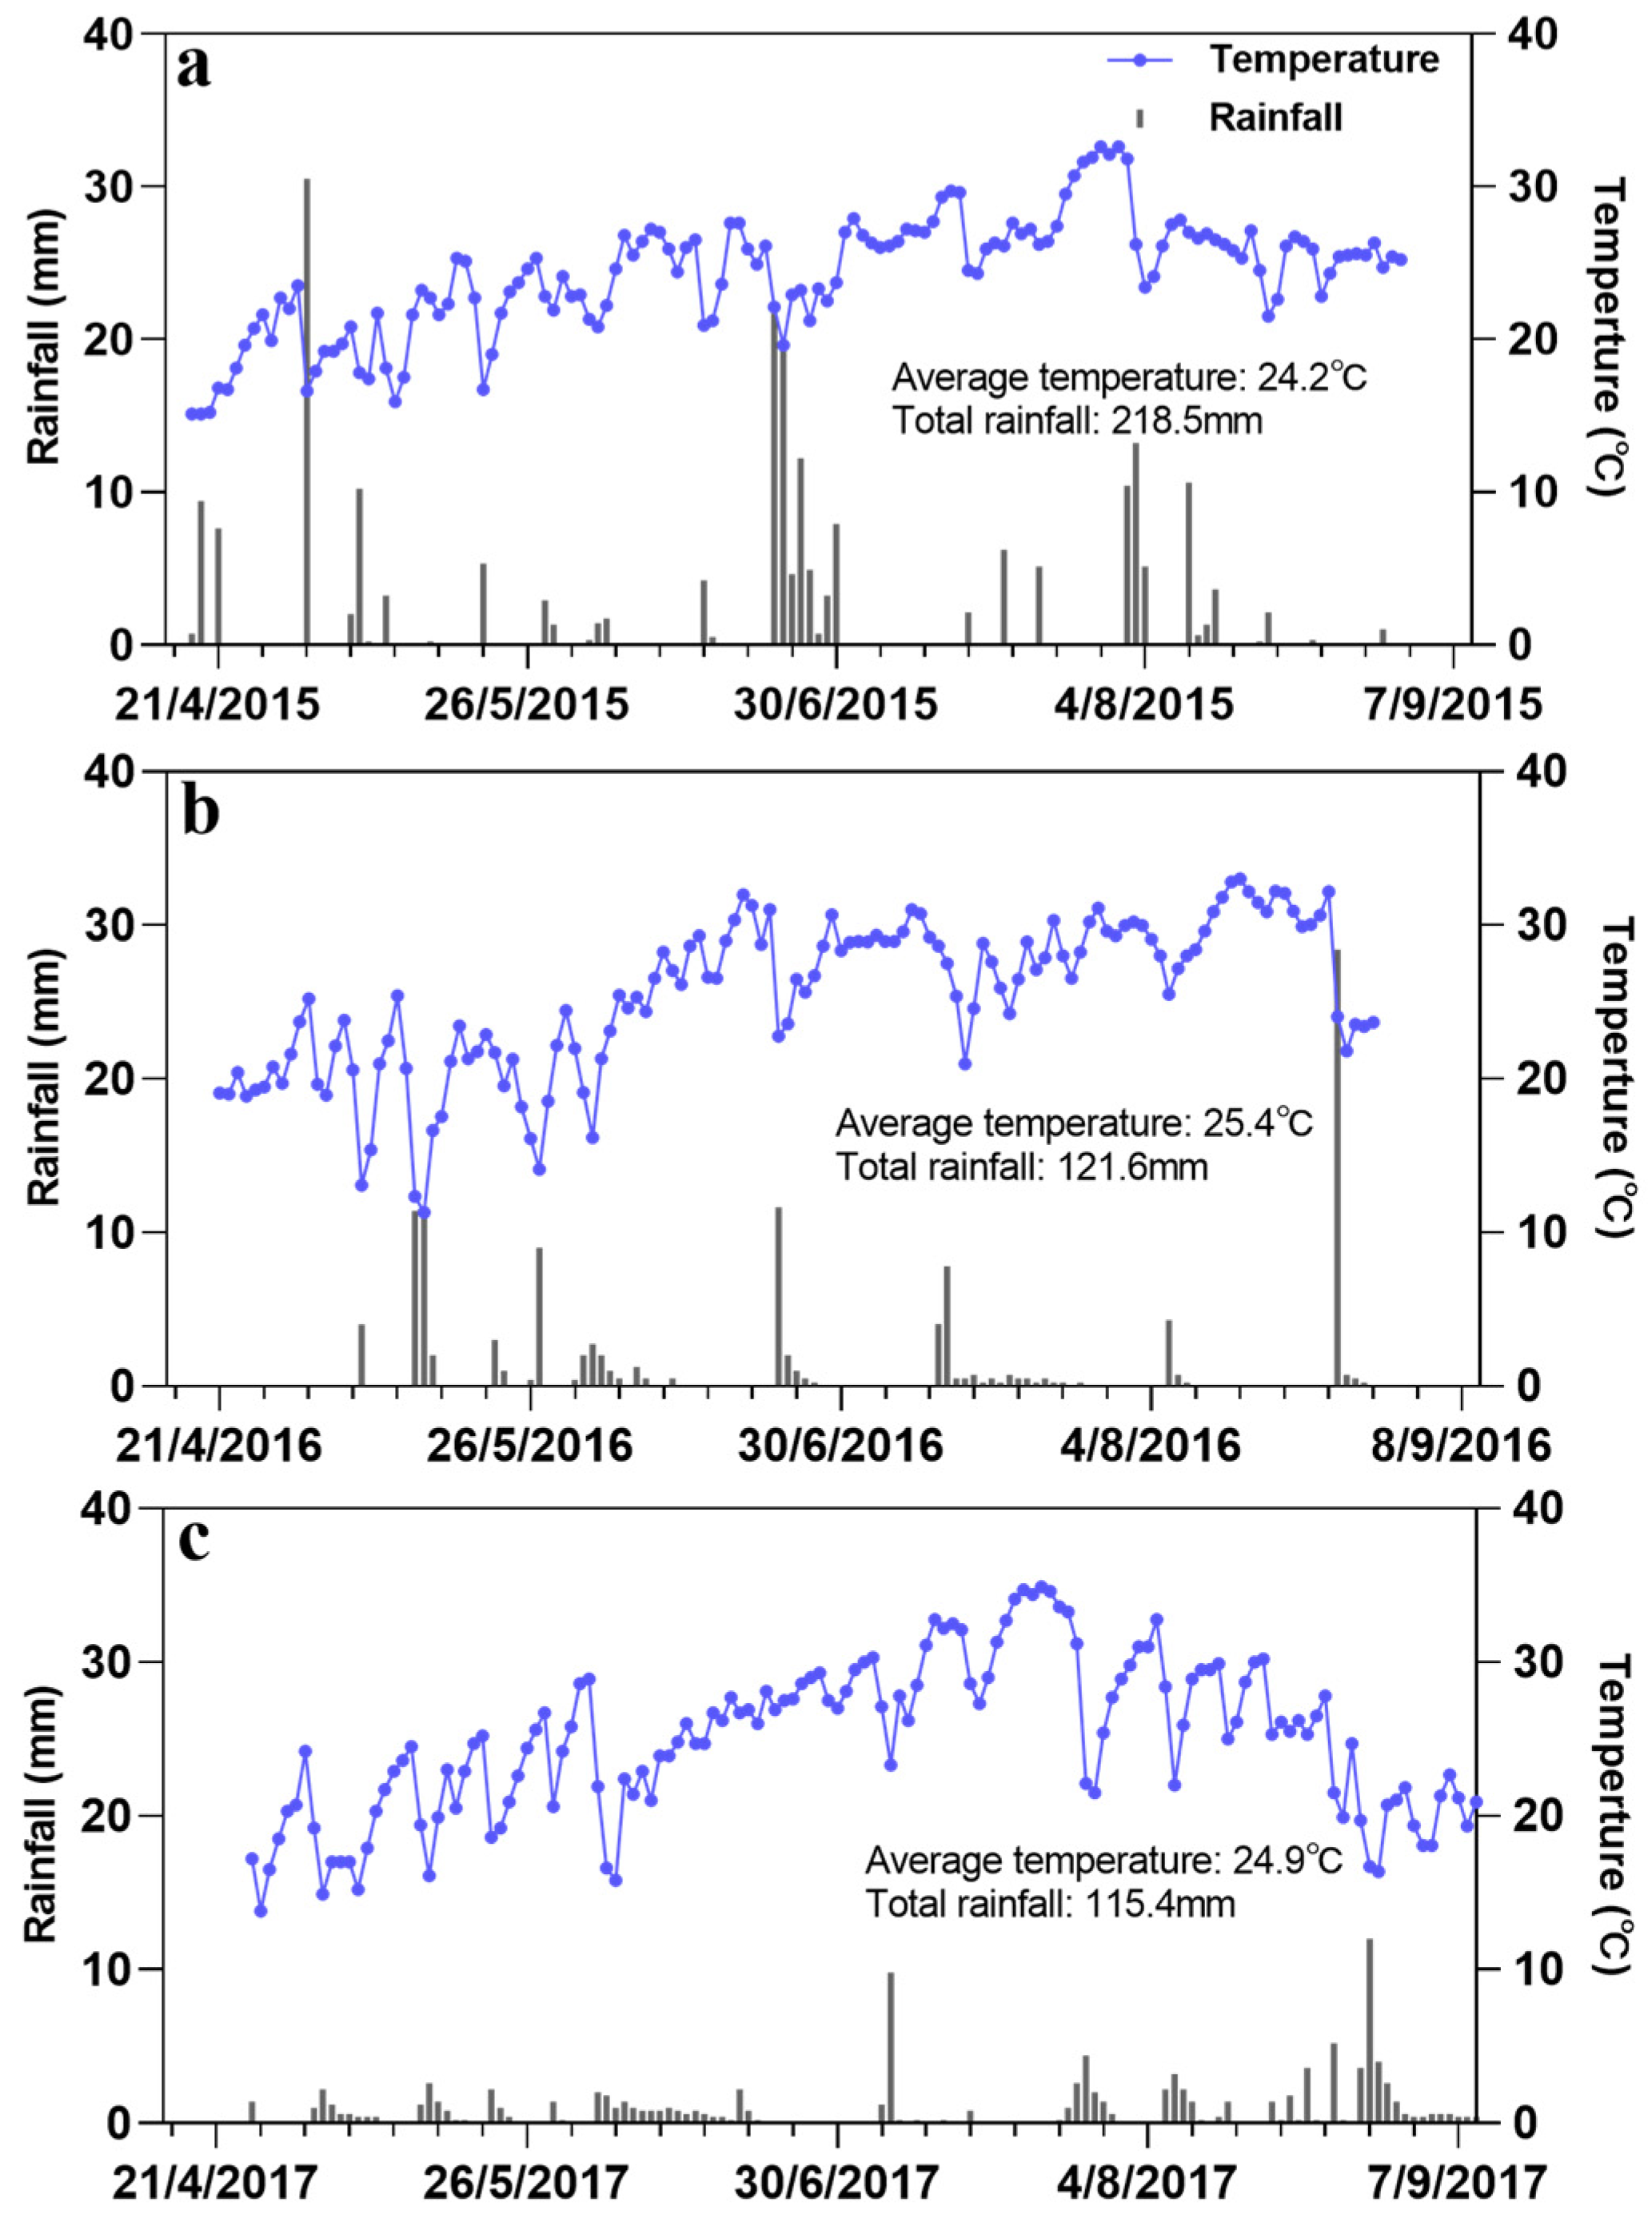
2.1. Experimental Site Description
2.2. Experimental Design and Management Practices
2.3. Measurements and Calculations
2.3.1. Spring Maize Growth
2.3.2. N2O Flux
2.3.3. Soil Properties
2.3.4. Grain Yield, Accumulated Nitrogen Uptake, Nitrogen Partial Factor Productivity (NPFP), and Nitrogen Apparent Use Efficiency (NAUE)
2.3.5. Economic Benefits
2.3.6. Statistical Analysis
3. Results
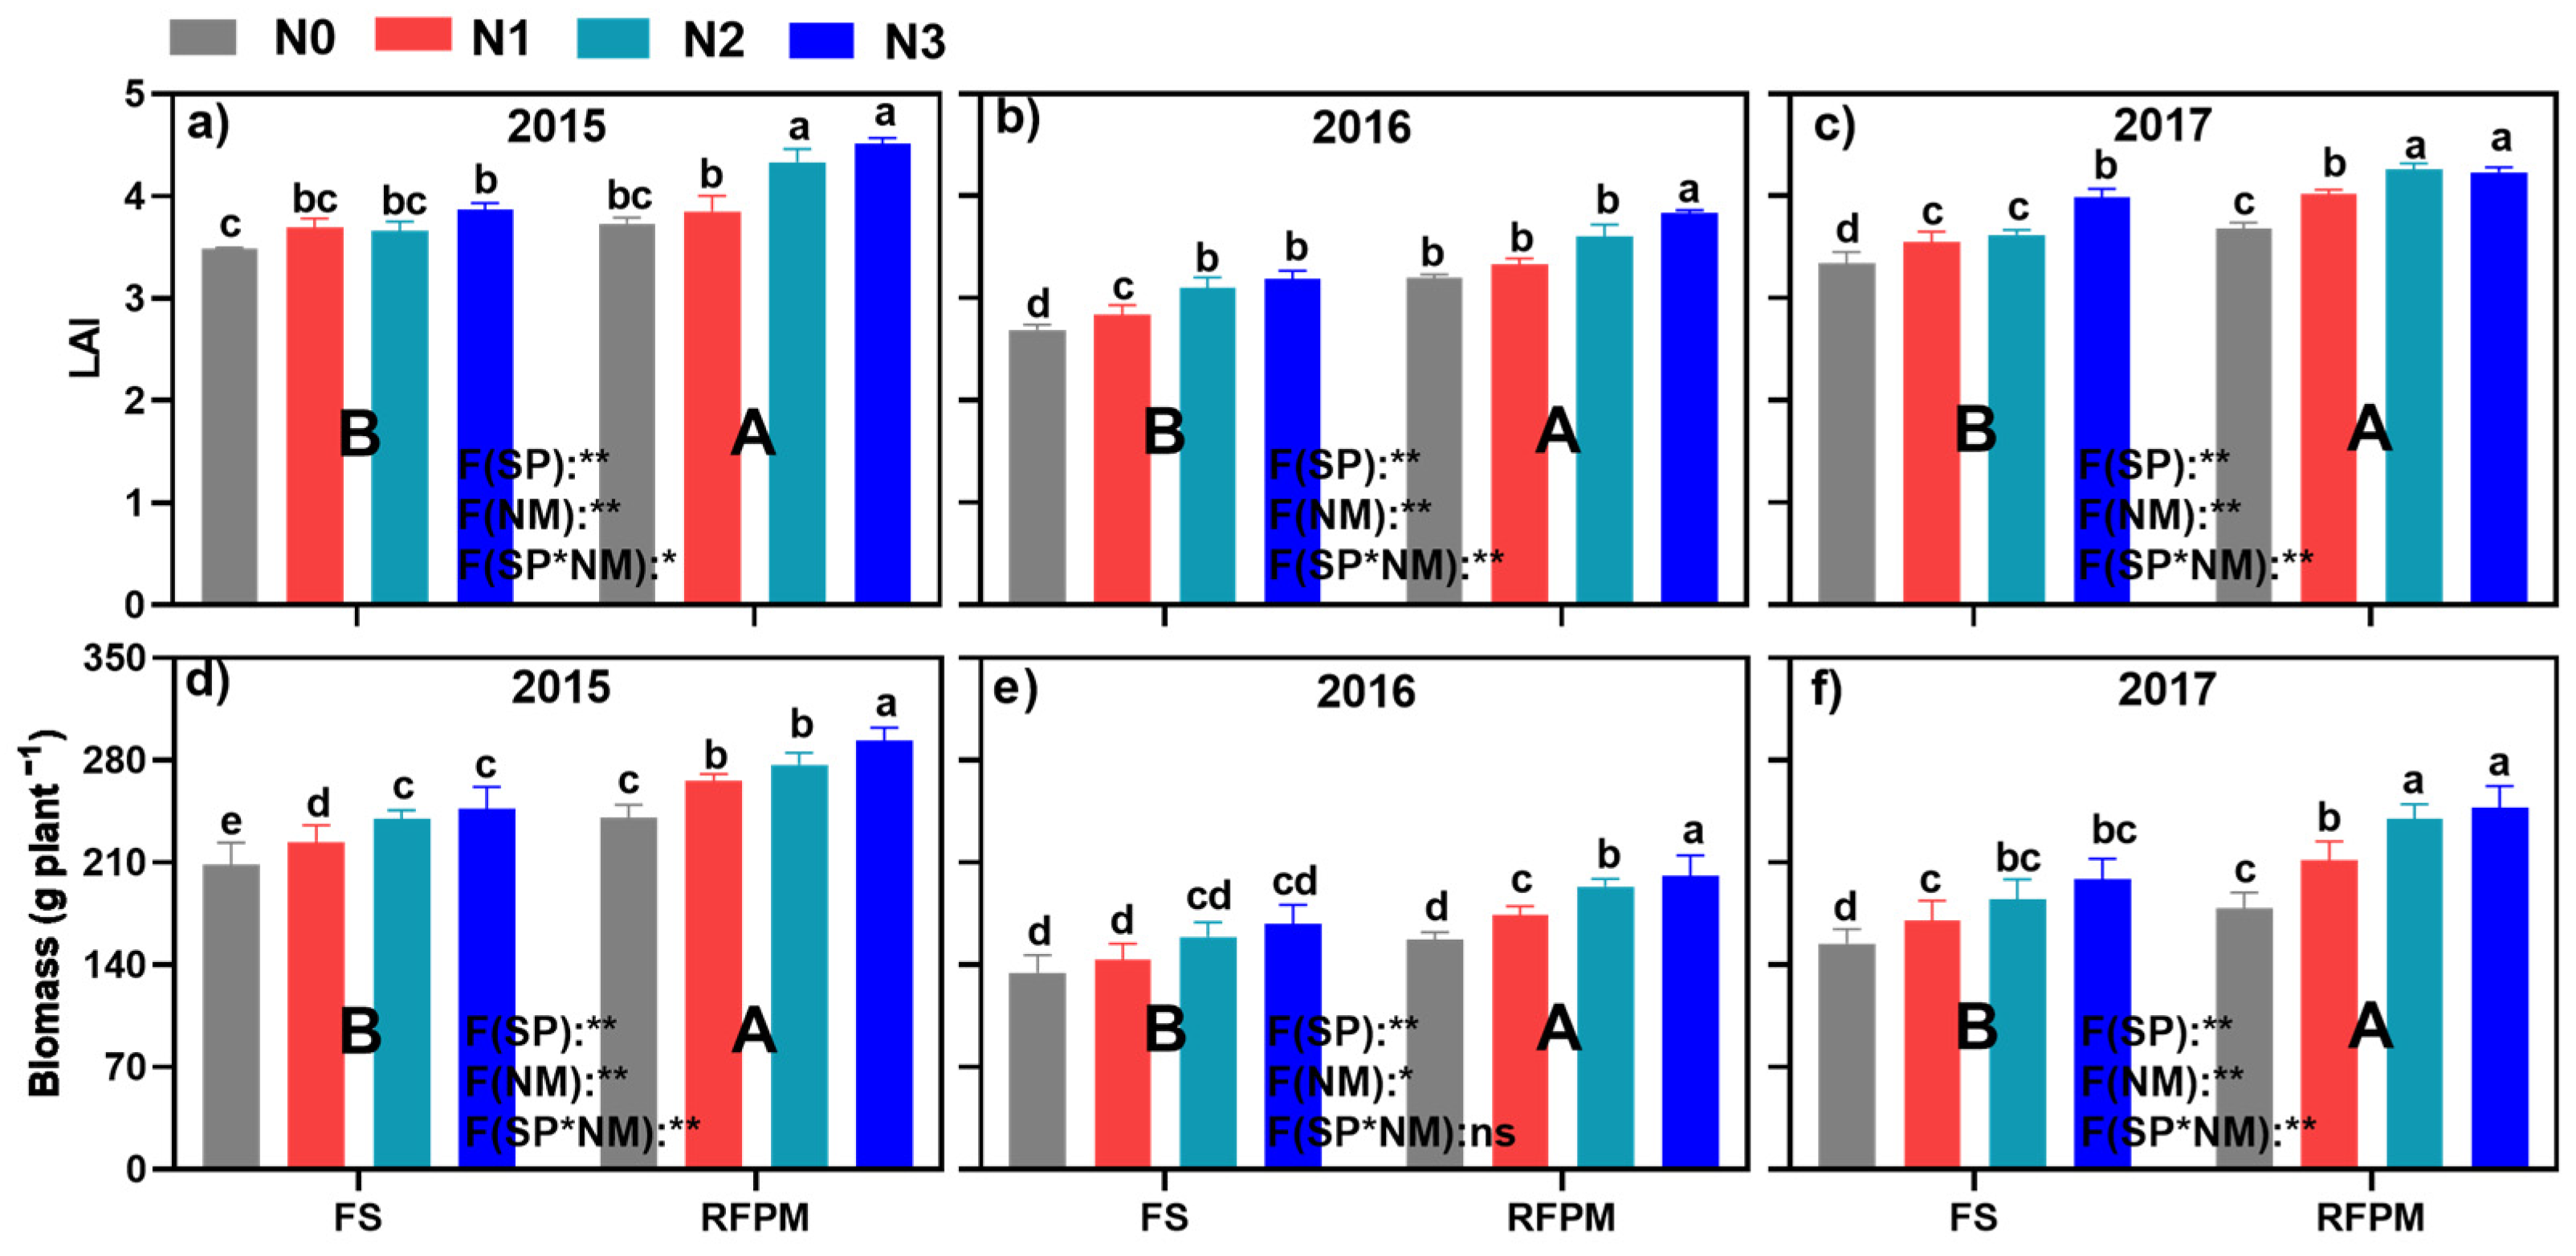
3.1. Spring Maize Growth
3.2. Spring Maize Productivity
3.2.1. Grain Yield and Yield Components
3.2.2. The Accumulation of N Uptake, NRFP, and NAFP
3.3. N2O Emissions
3.3.1. N2O Emission Flux
3.3.2. Cumulative N2O Emission and Yield-Scaled N2O Emission
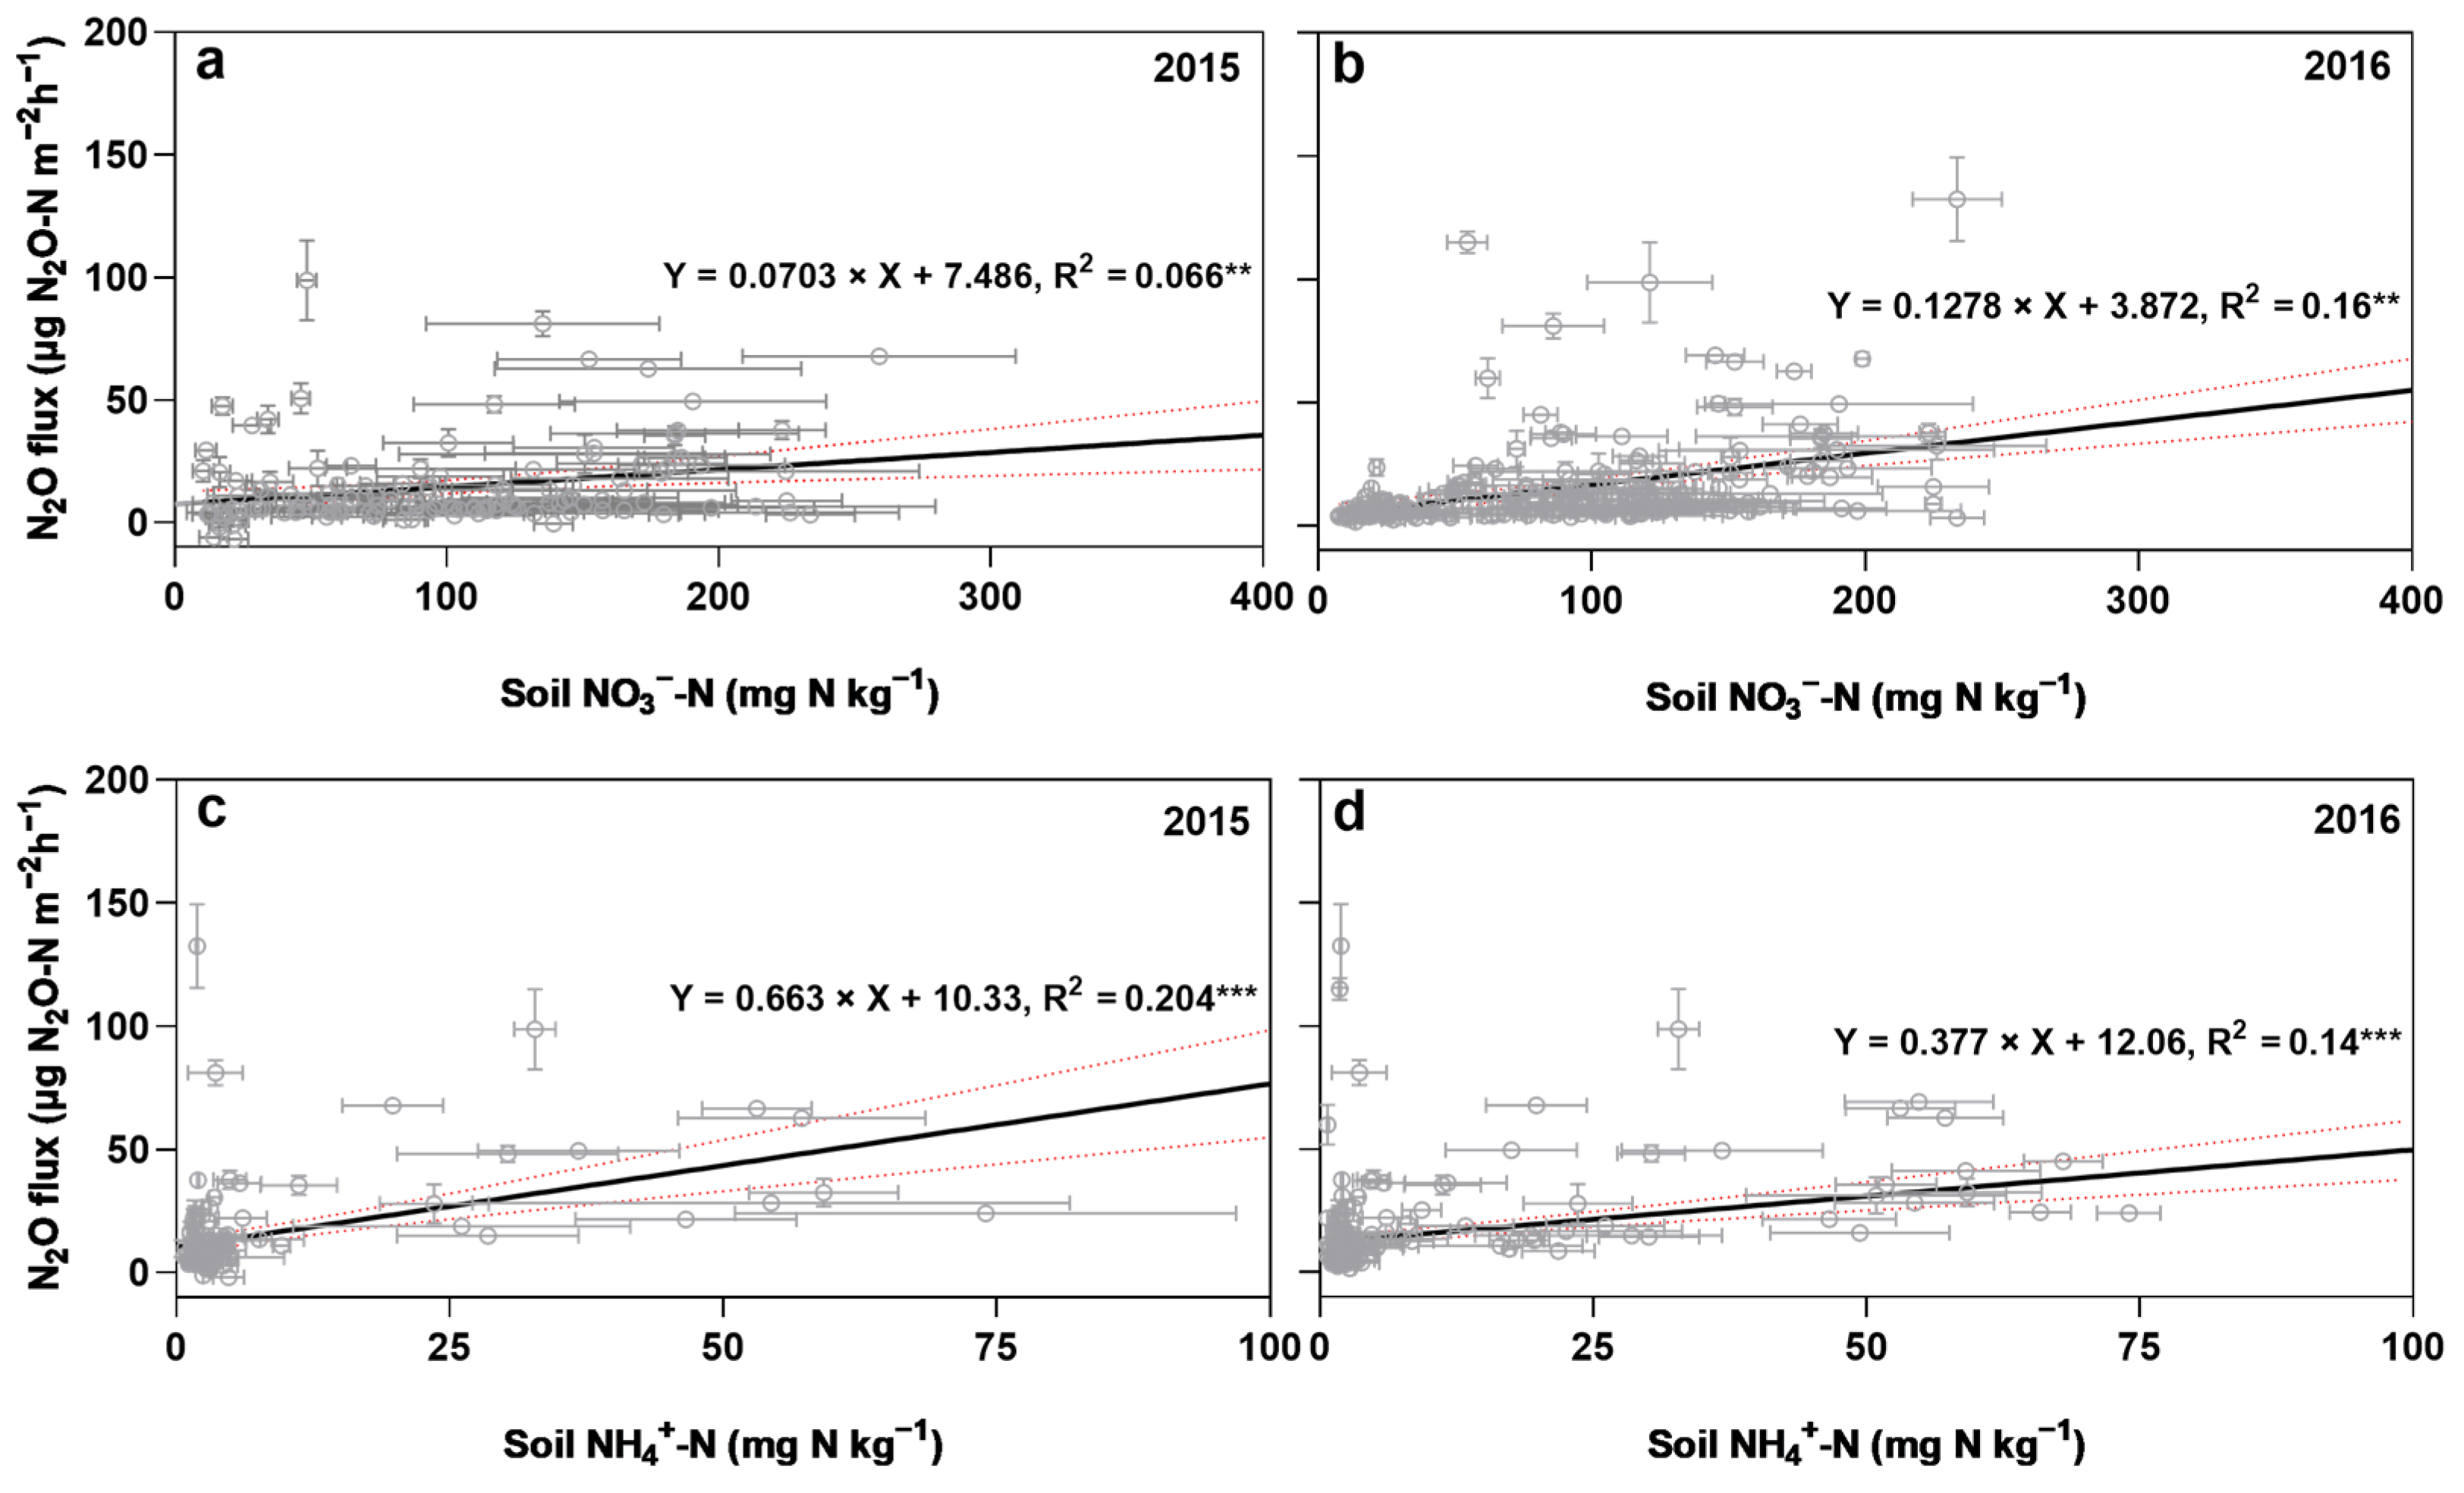
3.4. Selected Soil Physical and Chemical Properties and Their Relationships with N2O Flux
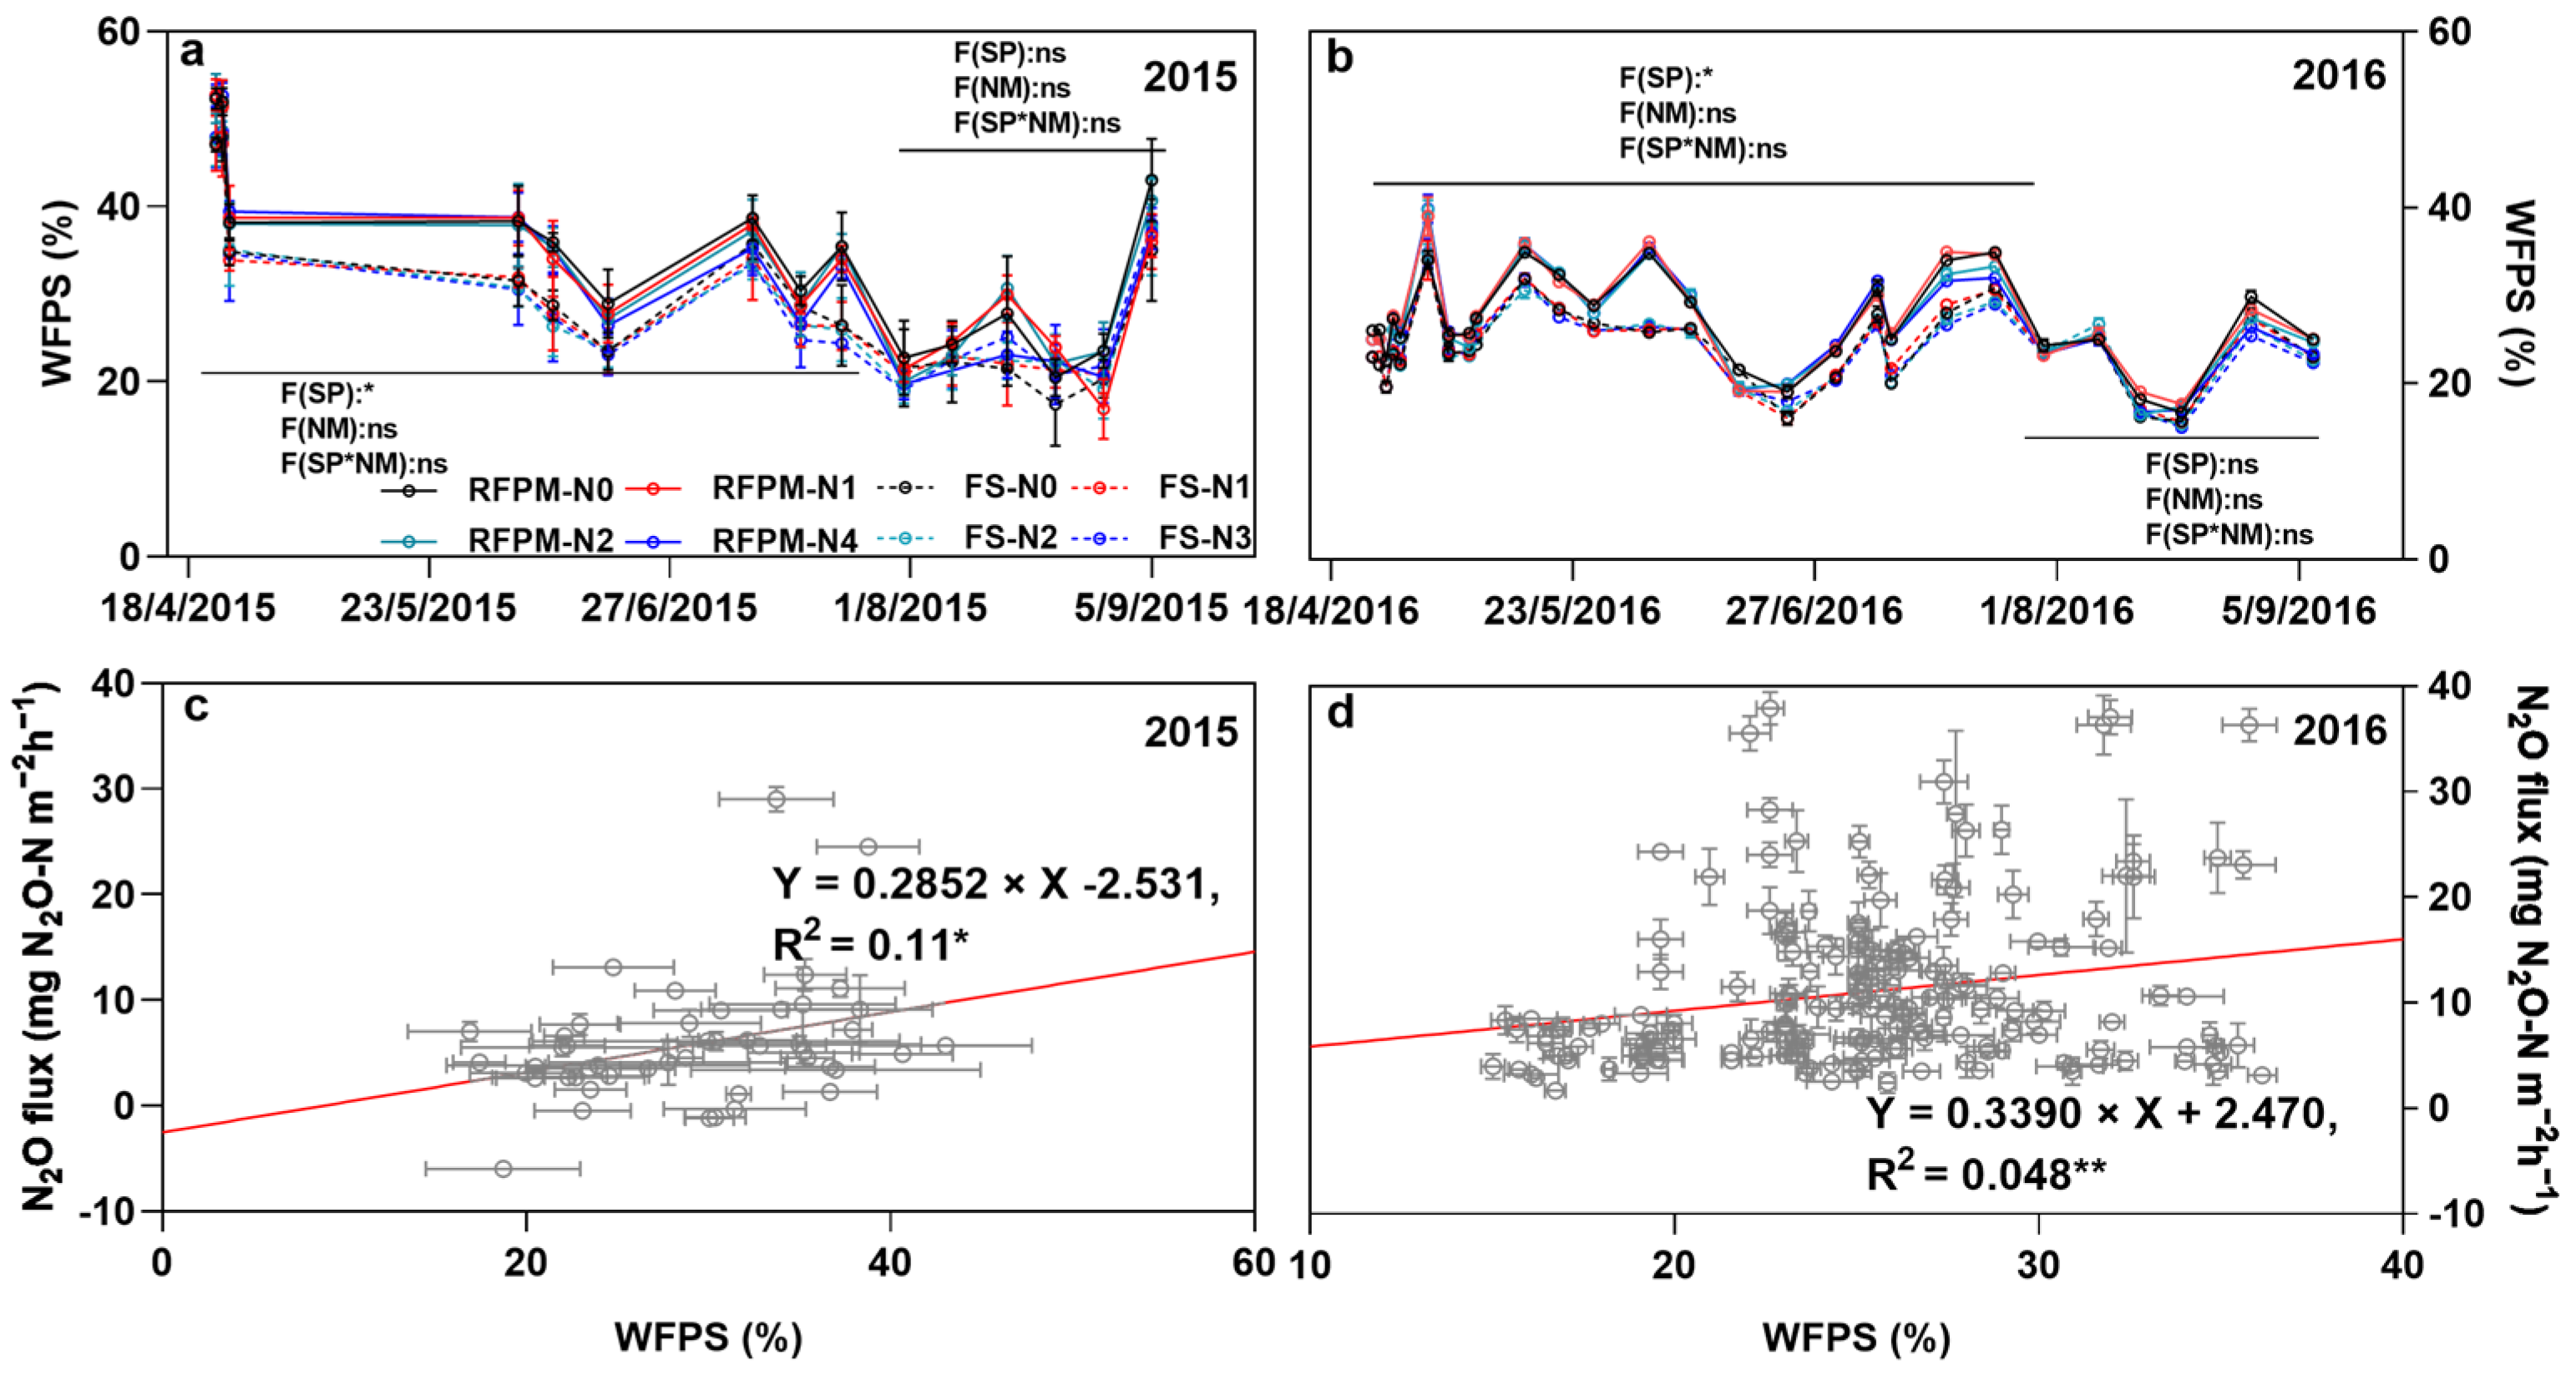
3.4.1. Soil Moisture and Temperature
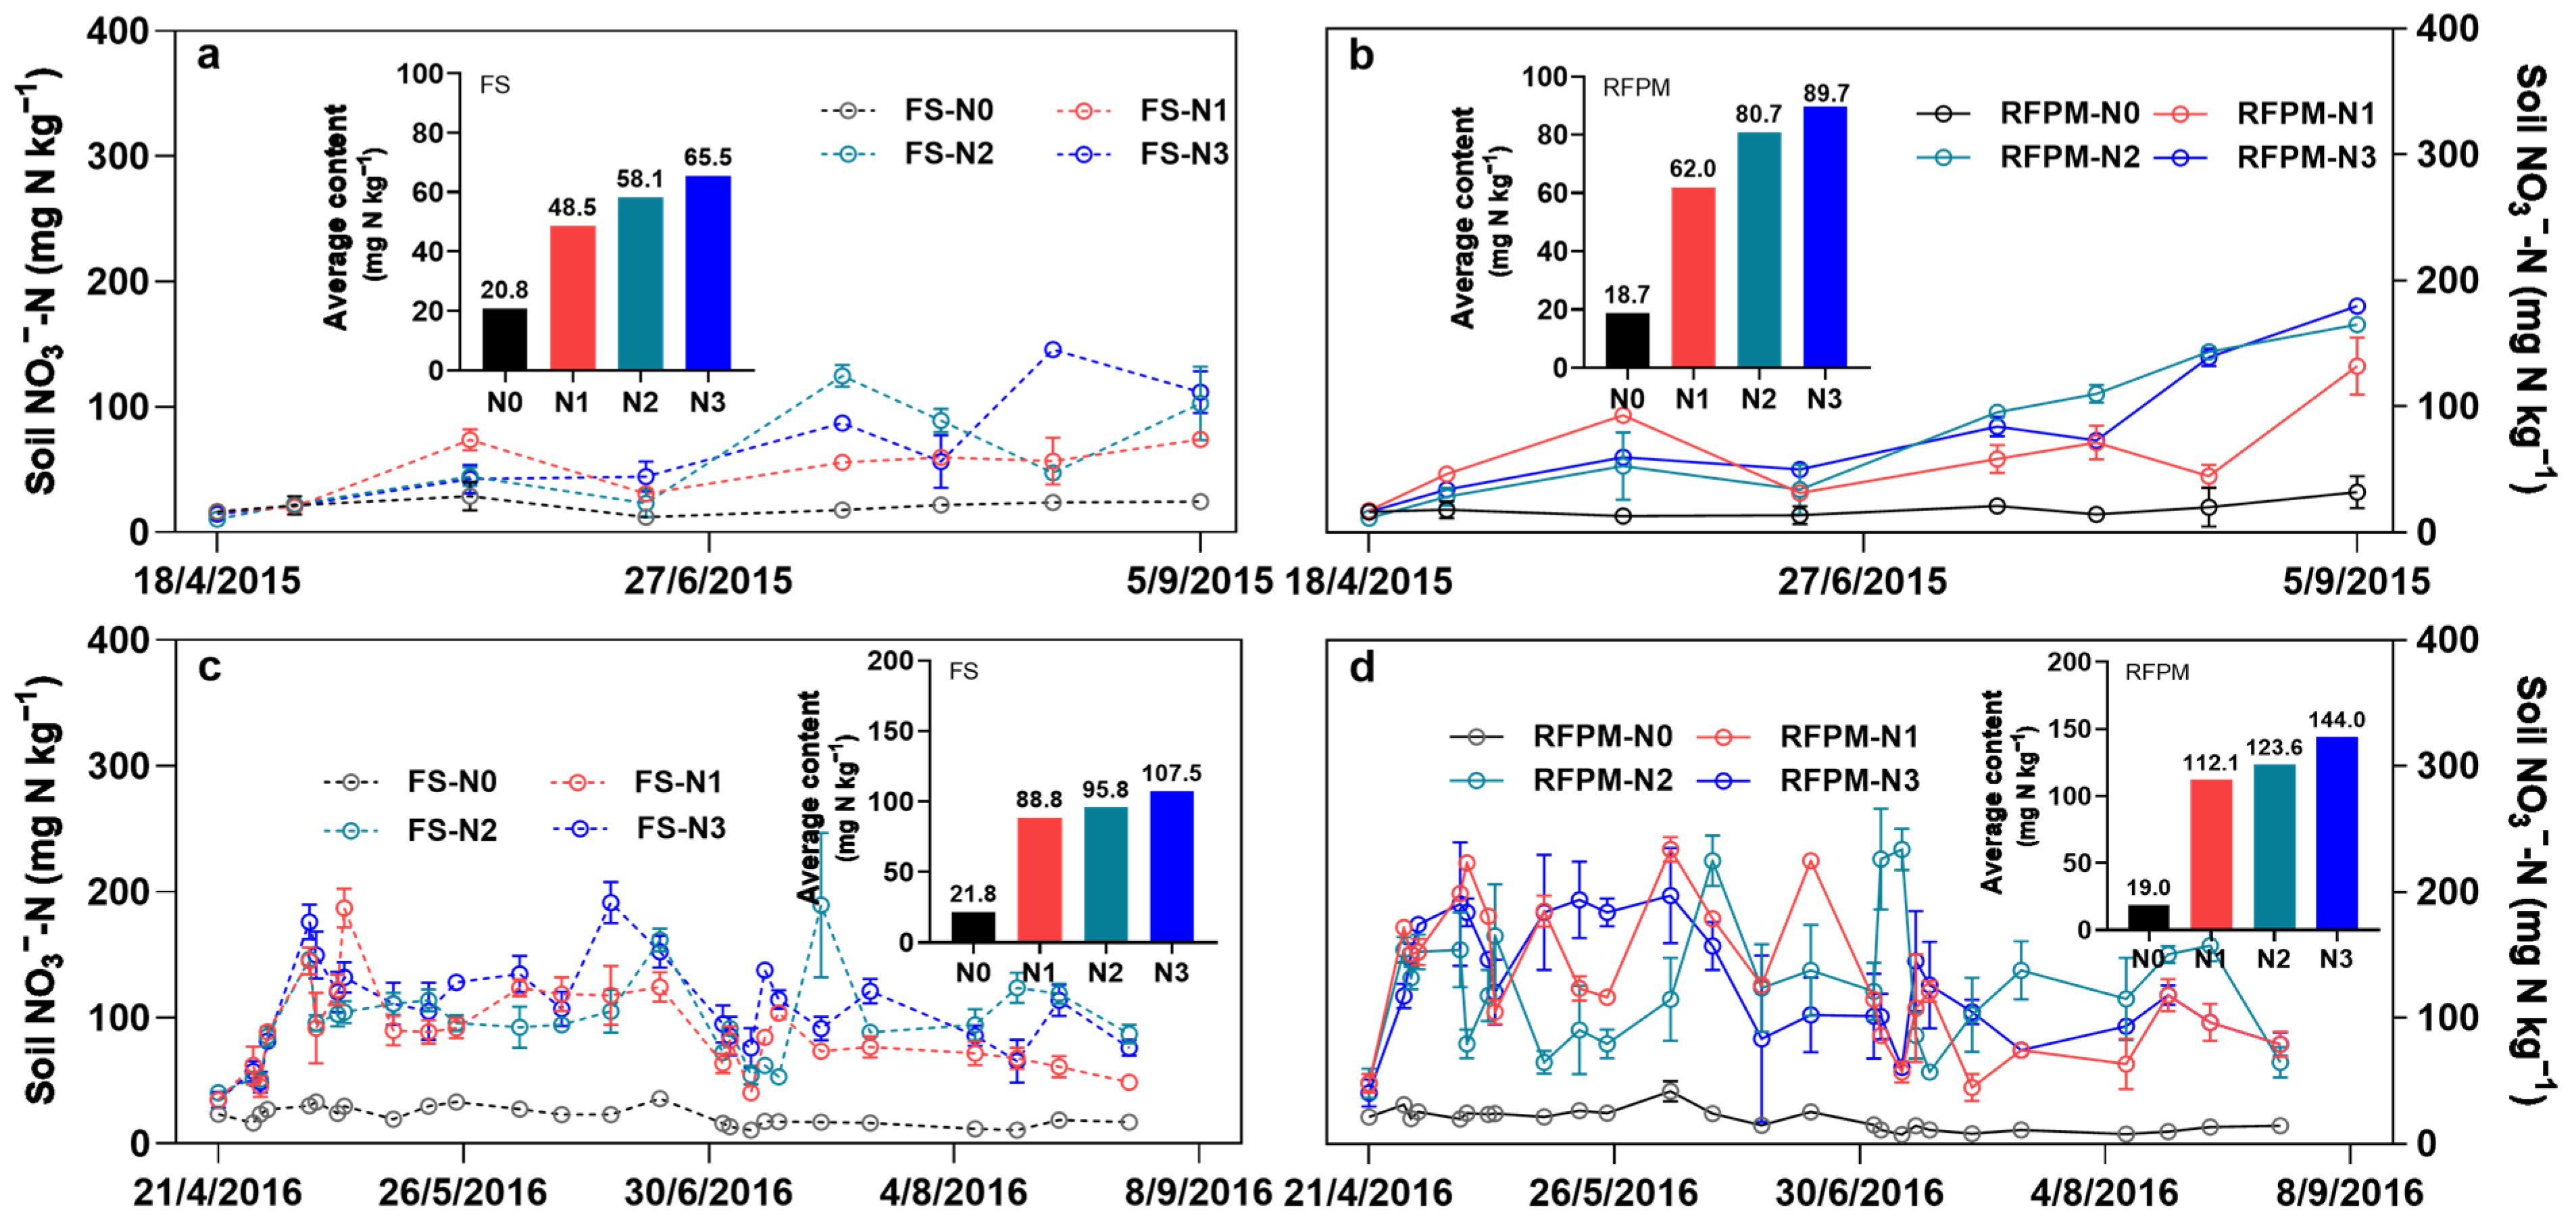
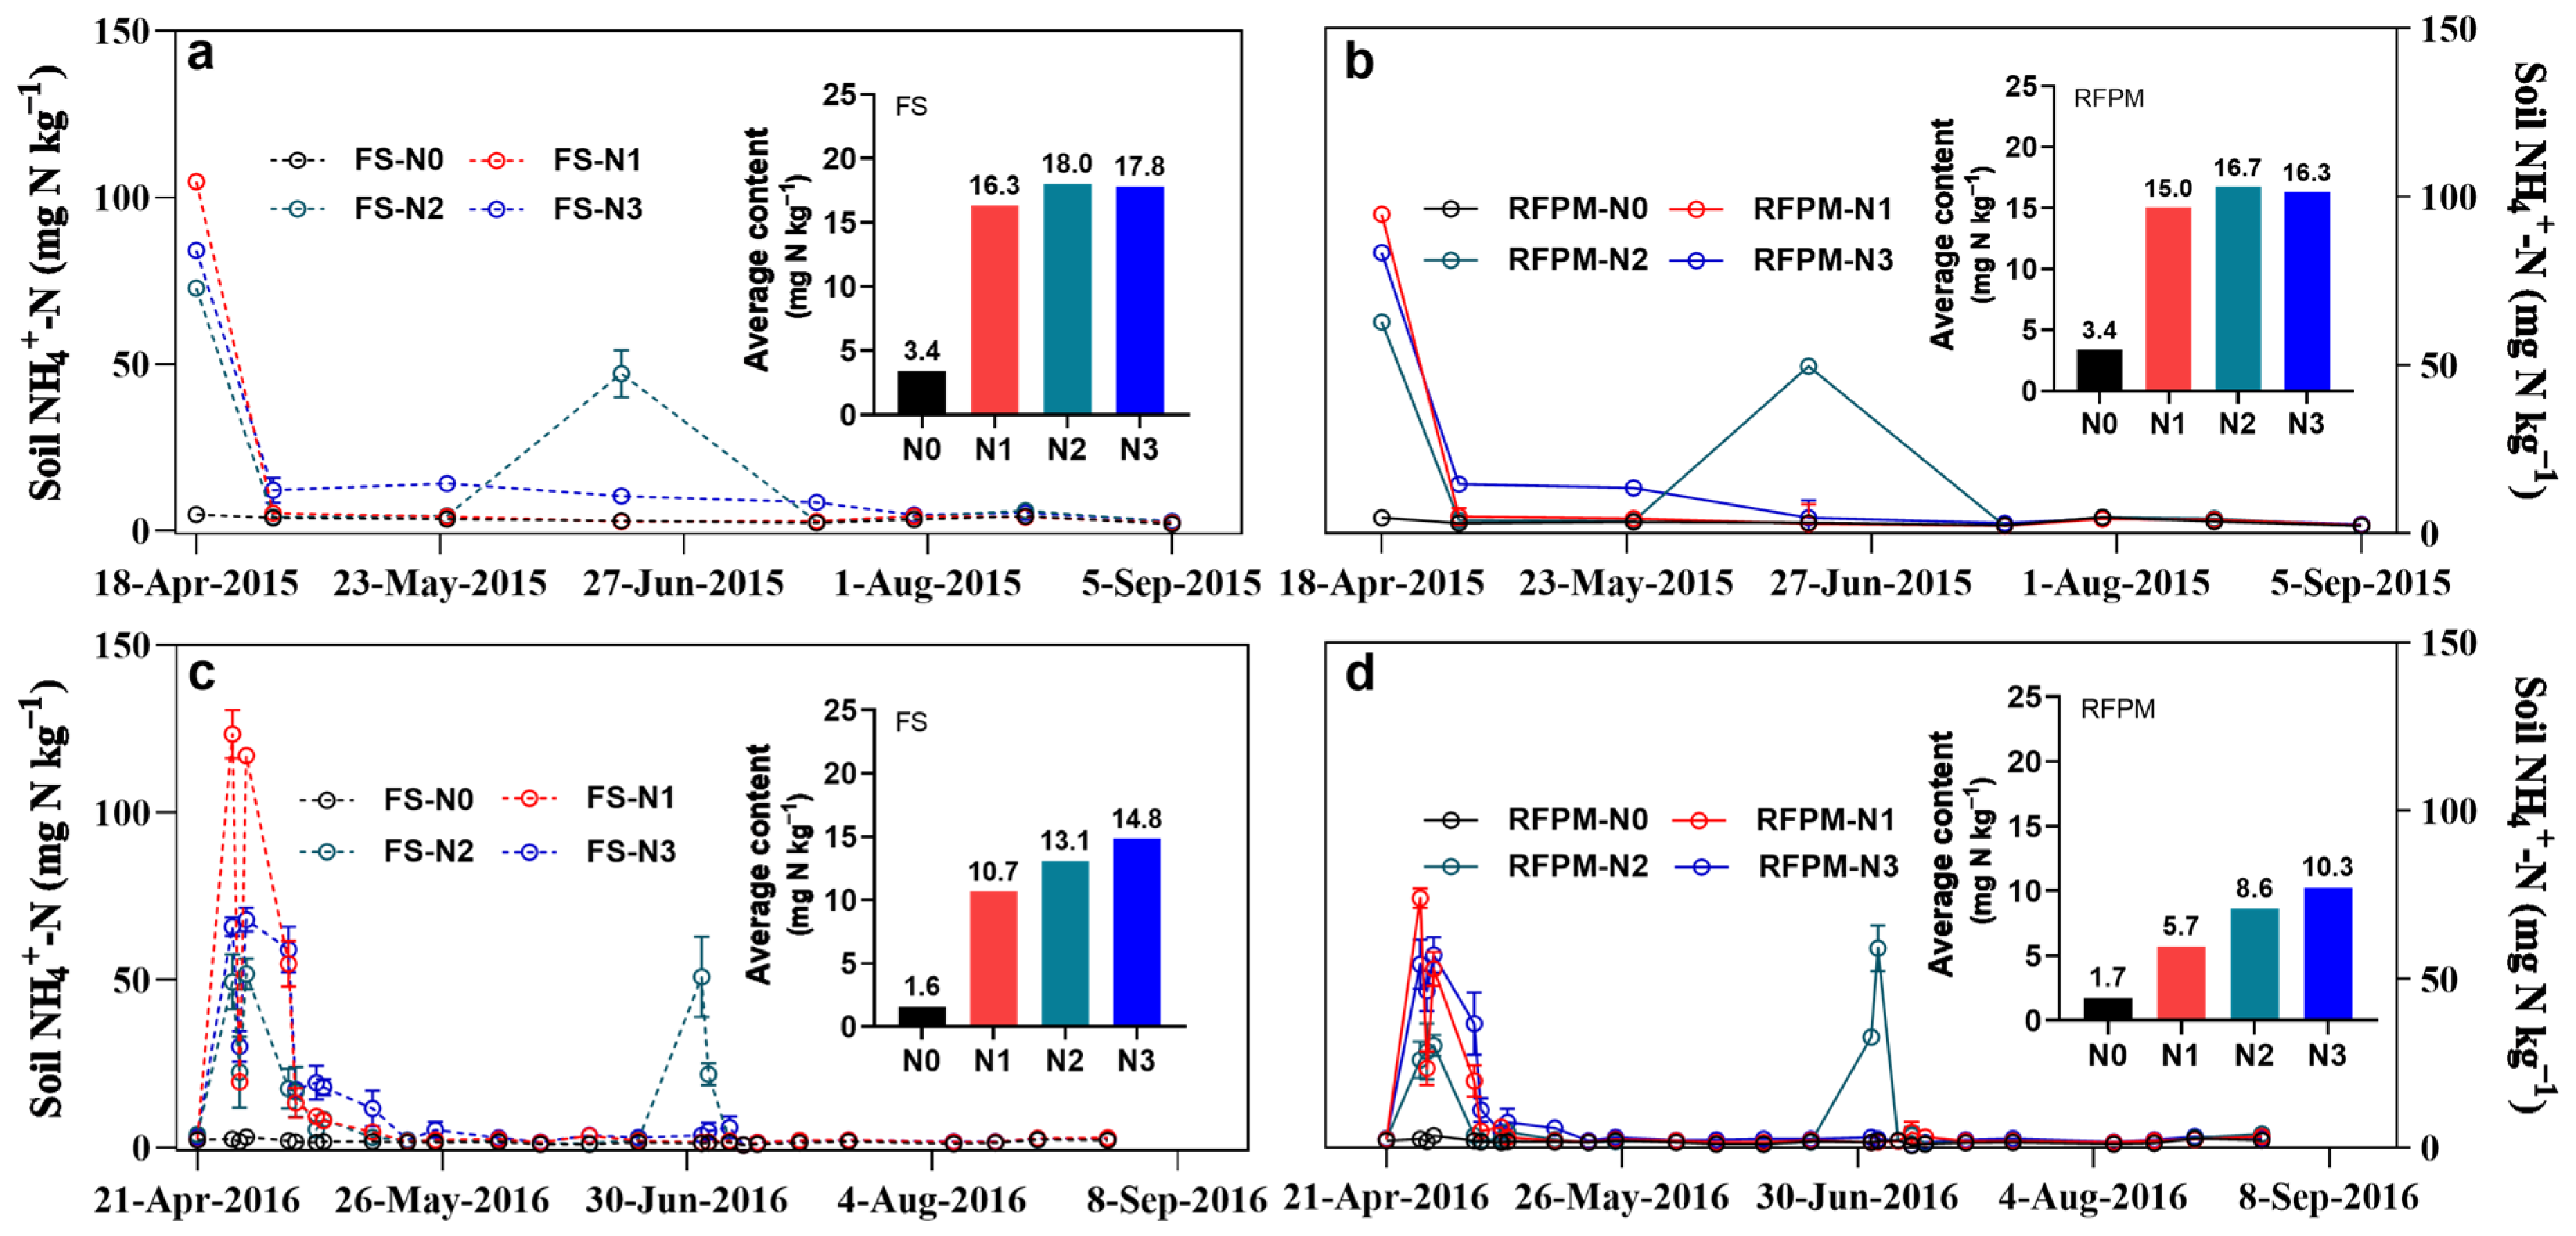
3.4.2. Soil NO3−-N and NH4+-N Contents
3.5. Economic Benefits
4. Discussion
5. Conclusions
Supplementary Materials
Author Contributions
Funding
Data Availability Statement
Conflicts of Interest
References
- Stoate, C.; B’aldi, A.; Beja, P.; Boatman, N.D.; Herzon, I.; van Doorn, A.; de Snoo, G.R.; Rakosy, L.; Ramwell, C. Ecological impacts of early 21st century agricultural change in Europe—A review. J. Environ. Manag. 2009, 91, 22–46. [Google Scholar] [CrossRef]
- Adeux, G.; Cordeau, S.; Antichi, D.; Carlesi, S.; Mazzoncini, M.; Munier-Jolain, N.; Barberi, P. Cover crops promote crop productivity but do not enhance weed management in tillage-based cropping systems. Eur. J. Agron. 2021, 123, 126221. [Google Scholar] [CrossRef]
- Reay, D.S.; Davidson, E.A.; Smith, K.A.; Smith, P.; Melillo, J.M.; Dentener, F.; Crutzen, P.J. Global agriculture and nitrous oxide emissions. Nat. Clim. Change 2012, 2, 410–416. [Google Scholar] [CrossRef]
- IPCC. Climate Change 2013: The Physical Science Basis. Contribution of Working Group I to the Fifth Assessment Report of the Intergovernmental Panel on Climate Change; Cambridge University Press: Cambridge, UK; New York, NY, USA, 2013; Available online: https://www.ipcc.ch/2013/09/30/ipcc-working-group-i-full-report (accessed on 1 December 2022).
- Syakila, A.; Kroeze, C. The global nitrous oxide budget revisited. Greenh. Gas Meas. Manag. 2011, 1, 17–26. [Google Scholar] [CrossRef]
- Parton, W.J.; Holland, E.A.; Del Grosso, S.J.; Hartman, M.D.; Martin, R.E.; Mosier, A.R.; Ojima, D.S.; Schimel, D.S. Generalized model for NOx and N2O emissions from soils. J. Geophys. Res. 2001, 106, 17403–17419. [Google Scholar] [CrossRef]
- Koponen, H.T.; Duran, C.E.; Maljanen, M.; Hytonen, J.; Martikainen, P.J. Temperature responses of NO and N2O emissions from boreal organic soil. Soil Biol. Biochem. 2006, 38, 1779–1787. [Google Scholar] [CrossRef]
- Castaldi, S. Responses of nitrous oxide, dinitrogen and carbon dioxide production and oxygen consumption to temperature in forest and agricultural light-textured soils determined by model experiment. Biol. Fertil. Soils 2000, 32, 67–72. [Google Scholar] [CrossRef]
- Zhang, Y.; Liu, D.H.; Jia, Z.K.; Zhang, P. Ridge and furrow rainfall harvesting can significantly reduce N2O emissions from spring maize fields in semiarid regions of China. Soil Tillage Res. 2021, 209, 104971. [Google Scholar] [CrossRef]
- Cheng, Y.; Wang, J.; Zhang, J.B.; Muller, C.; Wang, S.Q. Mechanistic insights into the effects of N fertilizer application on N2O-emission pathways in acidic soil of a tea plantation. Plant Soil 2015, 389, 45–57. [Google Scholar] [CrossRef]
- Xue, D.; Gao, Y.M.; Yao, H.Y.; Huang, C.Y. Nitrification potentials of Chinese tea orchard soils and their adjacent wasteland and forest soils. J. Environ. Sci. 2009, 21, 1225–1229. [Google Scholar] [CrossRef]
- Avrahami, S.; Bohannan, B.J.M. N2O emission rates in a California meadow soil are influenced by fertilizer level, soil moisture and the community structure of ammonia-oxidizing bacteria. Glob. Chang. Biol. 2009, 15, 643–655. [Google Scholar] [CrossRef]
- Liu, Y.; Yang, S.J.; Li, S.Q.; Chen, X.P.; Chen, F. Growth and development of maize (Zea mays L.) in response to different field water management practices: Resource capture and use efficiency. Agric. For. Meteorol. 2010, 150, 606–613. [Google Scholar] [CrossRef]
- Gan, Y.T.; Siddique, K.H.M.; Turner, N.C.; Li, X.G.; Liu, L.P. Ridge-furrow mulching systems—An innovative technique for boosting crop productivity in semiarid rain-fed environments. Adv. Agron. 2013, 118, 429–476. [Google Scholar] [CrossRef]
- Zhang, G.X.; Mo, F.; Shah, F.; Meng, W.H.; Liao, Y.C.; Han, J. Ridge-furrow configuration significantly improves soil water availability, crop water use efficiency, and grain yield in dryland agroecosystems of the Loess Plateau. Agric. Water Manag. 2021, 245, 106657. [Google Scholar] [CrossRef]
- Mo, F.; Zhou, H.; Wang, J.Y.; Zhao, H.; Zhang, H.J.; Wu, S.; Chen, Y.L.; Yang, T.; Deng, H.L.; Asfa, B.; et al. Research and application of field micro-rainfall technology. Trans. Chin. Soc. Agric. Eng. 2013, 8, 1–17. (In Chinese) [Google Scholar] [CrossRef]
- Mo, F.; Wnagm, J.Y.; Xiong, Y.C.; Nguluu, S.N.; Li, F.M. Ridge-furrow mulching system in semiarid Kenya: A promising solution to improve soil water availability and maize productivity. Eur. J. Agron. 2016, 80, 124–136. [Google Scholar] [CrossRef]
- Mo, F.; Wang, J.Y.; Zhou, H.; Luo, C.L.; Zhang, X.F.; Li, X.Y.; Li, F.M.; Xiong, L.B.; Kavagi, L.; Nguluu, S.N.; et al. Ridge-furrow plastic-mulching with balanced fertilization in rainfed maize (Zea mays L.): An adaptive management in east African Plateau. Agric. For. Meteorol. 2017, 236, 100–112. [Google Scholar] [CrossRef]
- Li, X.Y.; Gong, J.D. Effects of different ridge: Furrow ratios and supplement al irrigation on crop production in ridge and furrow rain fall harvesting system with mulches. Agric. Water Manag. 2002, 54, 243–254. [Google Scholar] [CrossRef]
- Li, R.; Hou, X.Q.; Jia, Z.K.; Han, Q.F.; Ren, X.L.; Yang, B.P. Effects of rainfall harvesting and mulching technologies on soil water, temperature, and maize yield in Loess Plateau region of China. Soil Res. 2012, 50, 105–113. [Google Scholar] [CrossRef]
- Lian, Y.H.; Ali, S.; Zhang, X.D.; Wang, T.L.; Liu, Q.; Jia, Q.M.; Jia, Z.K.; Han, Q.F. Nutrient and tillage strategies to increase grain yield and water use efficiency in semi-arid areas. Agric. Water Manag. 2016, 178, 137–147. [Google Scholar] [CrossRef]
- Jia, Q.M.; Chen, K.Y.; Chen, Y.Y.; Ali, S.; Manzoor; Sohail, A.; Fahad, S. Mulch covered ridges affect grain yield of maize through regulating root growth and root bleeding sap under simulated rainfall conditions. Soil Tillage Res. 2018, 175, 101–111. [Google Scholar] [CrossRef]
- Zhang, X.D.; Li, X.Y.; Niu, F.J.; Zhang, C.R.; Li, S.K.; Zhang, L.; Xiong, Y.C. Alternating small and large ridges with full film mulching increase linseed (Linum usitatissimum L.) productivity and economic benefit in a rainfed semiarid environment. Field Crops Res. 2018, 219, 120–130. [Google Scholar] [CrossRef]
- Zhang, X.D.; Kamran, M.; Xue, X.K.; Zhao, J.; Cai, T.; Jia, Z.K.; Zhang, P.; Han, Q.F. Ridge-furrow mulching system drives the efficient utilization of key production resources and the improvement of maize productivity in the Loess Plateau of China. Soil Till. Res. 2019, 190, 10–21. [Google Scholar] [CrossRef]
- Zhang, H.Y.; Liu, Q.J.; Yu, X.X.; Lü, G.; Wu, Y.Z. Effects of plastic mulch duration on nitrogen mineralization and leaching in peanut (Arachis hypogaea) cultivated land in the Yimeng mountainous area, China. Agric. Ecosyst. Environ. 2012, 158, 164–171. [Google Scholar] [CrossRef]
- Cuello, J.P.; Hwang, H.Y.; Gutierrez, J.; Kim, S.Y.; Kim, P.J. Impact of plastic film mulching on increasing greenhouse gas emissions in temperate upland soil during maize cultivation. Appl. Soil Ecol. 2015, 91, 48–57. [Google Scholar] [CrossRef]
- Smith, K.A.; Ball, T.; Conen, F.; Dobbie, K.E.; Massheder, J.; Rey, A. Exchange of greenhouse gases between soil and atmosphere: Interactions of soil physical factors and biological processes. Eur. J. Soil Sci. 2018, 54, 779–791. [Google Scholar] [CrossRef]
- Berger, S.; Kim, Y.; Kettering, J.; Gebauer, G. Plastic mulching in agriculture-friend or foe of N2O emissions? Agric. Ecosyst. Environ. 2013, 167, 43–51. [Google Scholar] [CrossRef]
- Yang, Q.D.; Zuo, H.C.; Xiao, X.; Wang, S.J.; Chen, B.L.; Chen, J.W. Modelling the effects of plastic mulch on water, heat and CO2 fluxes over cropland in an arid region. J. Hydrol. 2012, 452, 102–118. [Google Scholar] [CrossRef]
- Li, Y.Z.; Song, D.P.; Dang, P.F.; Wei, L.N.; Qin, X.L.; Siddique, K.H.M. The effect of tillage on nitrogen use efficiency in maize (Zea mays L.) in a ridge–furrow plastic film mulch system. Soil Tillage Res. 2019, 195, 104409. [Google Scholar] [CrossRef]
- Liu, J.; Zhu, L.; Luo, S.; Bu, L.; Chen, X.; Yue, S.; Li, S. Response of nitrous oxide emission to soil mulching and nitrogen fertilization in semi-arid farmland. Agric. Ecosyst. Environ. 2014, 188, 20–28. [Google Scholar] [CrossRef]
- Li, Y.Y.; Gao, X.P.; Tenuta, M.; Gui, D.W.; Li, X.Y.; Xue, W.; Zeng, F.J. Enhanced efficiency nitrogen fertilizers were not effective in reducing N2O emissions from a drip-irrigated cotton field in arid region of Northwestern China. Sci. Total Environ. 2020, 748, 141543. [Google Scholar] [CrossRef] [PubMed]
- Lyu, Y.F.; Yang, X.D.; Pan, H.Y.; Zhang, X.H.; Cao, H.X.; Ulgiati, S.; Wu, J.; Zhang, Y.Z.; Wang, G.Y.; Xiao, Y.L. Impact of fertilization schemes with different ratios of urea to controlled release nitrogen fertilizer on environmental sustainability, nitrogen use efficiency and economic benefit of rice production: A study case from Southwest China. J. Clean. Prod. 2021, 293, 126198. [Google Scholar] [CrossRef]
- Yang, M.; Zhu, X.Q.; Bai, Y.; Sun, D.; Zou, H.T.; Fang, Y.T.; Zhang, Y.L. Coated controlled-release urea creates a win-win scenario for producing more staple grains and resolving N loss dilemma worldwide. J. Clean. Prod. 2021, 288, 125660. [Google Scholar] [CrossRef]
- Xue, L.; Khan, S.; Sun, M.; Anwar, S.; Ren, A.; Gao, Z.; Lin, W.; Xue, J.; Yang, Z.; Deng, Y. Effects of tillage practices on water consumption and grain yield of dryland winter wheat under different precipitation distribution in the loess plateau of China. Soil Tillage Res. 2019, 191, 66–74. [Google Scholar] [CrossRef]
- Ribaudo, M.; Hansen, L.; Livingston, M.; Mosheim, R.; Williamson, J.; Delgado, J. Nitrogen in Agricultural Systems: Implications for Conservation Policy. USDAERS Economic Research Report. 2011. Available online: https://www.ers.usda.gov/publications/pub-details/?pubid=44919 (accessed on 23 July 2023).
- Kabir, T.; De Laporte, A.; Nasielski, J.; Weersink, A. Adjusting Nitrogen Rates with Split Applications: Modelled Effects on N Losses and Profits Across Weather Scenarios. Eur. J. Agron. 2021, 129, 126328. [Google Scholar] [CrossRef]
- Hu, C.L.; OSadras, V.; Lu, G.Y.; Zhang, P.X.; Han, Y.; Liu, L.; Xie, J.Y.; Yang, X.Y.; Zhang, S.L. A global meta-analysis of split nitrogen application for improved wheat yield and grain protein content. Soil Tillage Res. 2021, 213, 105111. [Google Scholar] [CrossRef]
- Wang, S.J.; Luo, S.S.; Li, X.S.; Yue, S.C.; Shen, Y.F.; Li, S.Q. Effect of split application of nitrogen on nitrous oxide emissions from plastic mulching maize in the semiarid Loess Plateau. Agric. Ecosyst. Environ. 2016, 220, 21–27. [Google Scholar] [CrossRef]
- Ma, Q.; Wang, M.Y.; Zheng, G.L.; Yao, Y.; Tao, R.R.; Zhu, M.; Ding, J.F.; Li, C.Y.; Guo, W.S.; Zhu, X.K. Twice-split application of controlled-release nitrogen fertilizer met the nitrogen demand of winter wheat. Field Crops Res. 2021, 267, 108163. [Google Scholar] [CrossRef]
- Zheng, W.; Zhang, M.; Liu, Z.; Zhou, H.; Lu, H.; Zhang, W.; Yang, Y.; Li, C.; Chen, B. Combining controlled-release urea and normal urea to improve the nitrogen use efficiency and yield under wheat-maize double cropping system. Field Crops Res. 2016, 197, 52–62. [Google Scholar] [CrossRef]
- Zheng, W.; Liu, Z.; Zhang, M.; Shi, Y.; Zhu, Q.; Sun, Y.; Zhou, H.; Li, C.; Yang, Y.; Geng, J. Improving crop yields, nitrogen use efficiencies, and profits by using mixtures of coated controlled-released and uncoated urea in a wheat-maize system. Field Crops Res. 2017, 205, 106–115. [Google Scholar] [CrossRef]
- Zhang, W.; Liang, Z.; He, X.; Wang, X.; Shi, X.; Zou, C.; Chen, X. The effects of controlled release urea on maize productivity and reactive nitrogen losses: A meta-analysis. Environ. Pollut. 2019, 246, 559–565. [Google Scholar] [CrossRef] [PubMed]
- Ding, W.; Luo, J.; Li, J.; Yu, H.; Fan, J.; Liu, D. Effect of long-term compost and inorganic fertilizer application on background N2O and fertilizer-induced N2O emissions from an intensively cultivated soil. Sci. Total Environ. 2013, 465, 115–124. [Google Scholar] [CrossRef] [PubMed]
- Yu, Y.X.; Tao, H.; Jia, H.T.; Zhao, C.Y. Impact of plastic mulching on nitrous oxide emissions in China’s arid agricultural region under climate change conditions. Atmos. Environ. 2017, 158, 76–84. [Google Scholar] [CrossRef]
- Bremner, J.M. Total nitrogen. In Methods of Soil Analysis: Chemical Methods; Sparks, D.L., Ed.; Soil Science Society of America: Madison, WI, USA, 1996; pp. 1085–1086. [Google Scholar] [CrossRef]
- Li, W.W.; Zhuang, Q.; Wu, W.; Wen, X.; Han, J.; Liao, Y. Effects of ridge–furrow mulching on soil CO2 efflux in a maize field in the Chinese Loess Plateau. Agric. For. Meteorol. 2019, 264, 200–212. [Google Scholar] [CrossRef]
- Zhang, P.; Wei, T.; Han, Q.; Ren, X.; Jia, Z. Effects of different film mulching methods on soil water productivity and maize yield in a semiarid area of China. Agric. Water Manag. 2020, 241, 106382. [Google Scholar] [CrossRef]
- Liu, X.L.; Wang, Y.D.; Yan, X.Q.; Hou, H.Z.; Liu, P.; Cai, T.; Zhang, P.; Jia, Z.K.; Ren, X.L.; Chen, X.L. Appropriate ridge-furrow ratio can enhance crop production and resource use efficiency by improving soil moisture and thermal condition in a semiarid region. Agric. Water Manag. 2020, 240, 106289. [Google Scholar] [CrossRef]
- Zhang, X.D.; Zhao, J.; Yang, L.C.; Kamran, M.; Xue, X.K.; Dong, Z.Y.; Jia, Z.K.; Han, Q.F. Ridge-furrow mulching system regulates diurnal temperature amplitude and wetting-drying alternation behavior in soil to promote maize growth and water use in a semiarid region. Field Crops Res. 2019, 233, 121–130. [Google Scholar] [CrossRef]
- Grant, C.A.; Wu, R.; Selles, F.; Harker, K.N.; Clayton, G.W.; Bittman, S.; Zebarth, B.J.; Lupwayi, N.Z. Crop yield and nitrogen concentration with controlled release urea and split applications of nitrogen as compared to non-coated urea applied at seeding. Field Crops Res. 2012, 127, 170–180. [Google Scholar] [CrossRef]
- Zheng, W.; Sui, C.; Liu, Z.; Geng, J.; Zhang, M. Long-term effects of controlled release urea on crop yields and soil fertility under wheat–corn double cropping systems. Agron. J. 2016, 108, 1703–1716. [Google Scholar] [CrossRef]
- Calvo, P.; Nelson, L.; Kloepper, J.W. Agricultural uses of plant biostimulants. Plant Soil 2014, 383, 3–41. [Google Scholar] [CrossRef]
- Sinha, S.K.; Rani, M.; Bansal, N.; Gayatri Venkatesh, K.; Mandal, P.K. Nitrate starvation induced changes in root system architecture, carbon: Nitrogen metabolism, and miRNA expression in nitrogen-responsive wheat genotypes. Appl. Biochem. Biotechnol. 2015, 177, 1299–1312. [Google Scholar] [CrossRef]
- Li, R.C.; Gao, Y.X.; Chen, Q.; Li, Z.L.; Gao, F.; Meng, Q.M.; Li, T.G.; Liu, A.R.; Wang, Q.; Wu, L.; et al. Blended controlled-release nitrogen fertilizer with straw returning improved soil nitrogen availability, soil microbial community, and root morphology of wheat. Soil Tillage Res. 2021, 212, 105045. [Google Scholar] [CrossRef]
- Nishimura, S.; Komada, M.; Takebe, M.; Yonemura, S.; Kato, N. Nitrous oxide evolved from soil covered with plastic mulch film in horticultural field. Biol. Fert. Soils 2012, 48, 787–795. [Google Scholar] [CrossRef]
- Xia, L.; Lam, S.K.; Wolf, B.; Kiese, R.; Chen, D.; Butterbach-Bahl, K. Trade-offs between soil carbon sequestration and reactive nitrogen losses under straw return in global agroecosystems. Glob. Chang. Biol. 2018, 24, 5919–5932. [Google Scholar] [CrossRef] [PubMed]
- Kuang, W.N.; Gao, X.P.; Tenuta, M.; Zeng, F.J. A global meta-analysis of nitrous oxide emission from drip-irrigated cropping system. Glob. Chang. Biol. 2021, 27, 3244–3256. [Google Scholar] [CrossRef] [PubMed]
- Stres, B.; Danevcic, T.; Pal, L.; Fuka, M.M.; Resman, L.; Leskovec, S.; Hacin, J.; Stopar, D.; Mahne, I.; Mandic-Mulec, I. Influence of temperature and soil water content on bacterial, archaeal and denitrifying microbial communities in drained fen grassland soil microcosms. FEMS Microbiol. Ecol. 2008, 66, 110–122. [Google Scholar] [CrossRef]
- Mosier, A.R. Soil processes and global change. Biol. Fert. Soils. 1998, 27, 221–229. [Google Scholar] [CrossRef]
- Zheng, J.; Wang, H.M.; Fan, J.L.; Zhang, F.C.; Guo, J.J.; Liao, Z.Q.; Zhuang, Q.L. Wheat straw mulching with nitrification inhibitor application improves grain yield and economic benefit while mitigating gaseous emissions from a dryland maize field in northwest China. Field Crops Res. 2021, 265, 108125. [Google Scholar] [CrossRef]
- Picone, L.; Videla, C. Relaciones entre la tasa de desnitrificación y el contenido de nitratos, humedad y carbono orgánico soluble del suelo en un cultivo de trigo. Cienc. Suelo 1998, 16, 77–82. Available online: https://bibliotecas.uncuyo.edu.ar/explorador3/Search/Results?limit=0&filter%5B%5D=collection%3A%22Anal%C3%ADticas%22&filter%5B%5D=building%3A%22Fac.+de+Ciencias+Agrarias%22&lookfor=%22v.+16%2C+no.+2+%281998%29%2C+p.+77-82%22&type=Series (accessed on 1 December 2022).
- Fiorini, A.; Maris, S.C.; Abalos, D.; Amaducci, S.; Tabaglio, V. Combining no-till with rye (Secale cereale L.) cover crop mitigates nitrous oxide emissions without decreasing yield. Soil Tillage Res. 2020, 196, 104442. [Google Scholar] [CrossRef]
- Machefert, S.E.; Dise, N.B.; Goulding, K.W.T.; Whitehead, P.G. Nitrous oxide emissions from two riparian ecosystems: Key controlling variables. Water Air Soil Pollut. Focus 2004, 4, 427–436. [Google Scholar] [CrossRef]
- Zhang, Q.Q.; Zhang, X.; Duan, P.P.; Jiang, X.Y.; Shen, H.J.; Yan, X.Y.; Xiong, Z.Q. The effect of long-term biochar amendment on N2O emissions: Experiments with N15-O18 isotopes combined with specific inhibition approaches. Sci. Total Environ. 2021, 769, 144533. [Google Scholar] [CrossRef]
- Xu, Y.C.; Shen, Q.R.; Li, M.L.; Dittert, K.; Sattelmacher, B. Effect of soil water status and mulching on N2O and CH4 emission from lowland rice field in China. Biol. Fertil. Soils 2004, 39, 215–217. [Google Scholar] [CrossRef]
- Wang, W.Y.; Yang, M.; Shen, P.F.; Zhang, R.Y.; Qin, X.L.; Han, J.; Li, Y.J.; Wen, X.X.; Liao, Y.C. Conservation tillage reduces nitrous oxide emissions by regulating functional genes for ammonia oxidation and denitrification in a winter wheat ecosystem. Soil Tillage Res. 2019, 194, 104347. [Google Scholar] [CrossRef]
- Venterea, R.F.P.; Maharjan, B.; Dolan, M.S. Fertilizer source and tillage effects on yield-scaled nitrous oxide emissions in a corn cropping system. J. Environ. Qual. 2011, 40, 1521–1531. [Google Scholar] [CrossRef]
- Maharjan, B.; Venterea, R.F.P.; Rosen, C. Fertilizer and irrigation management effects on nitrous oxide emissions and nitrate leaching. Agron. J. 2014, 106, 703–714. [Google Scholar] [CrossRef]
- Chen, X.P.; Cui, Z.L.; Vitousek, P.M.; Cassman, K.G.; Matson, P.A.; Bai, J.-S.; Meng, Q.F.; Hou, P.; Yue, S.C.; Römheld, V.; et al. Integrated soil–crop system management for food security. Proc. Natl. Acad. Sci. USA 2011, 108, 6399–6404. [Google Scholar] [CrossRef]
- Cui, Z.L.; Yue, S.C.; Wang, G.L.; Meng, Q.F.; Wu, L.; Yang, Z.P.; Zhang, Q.; Li, S.Q.; Zhang, F.S.; Chen, X.P. Closing the yield gap could reduce projected greenhouse gas emissions: A case study of maize production in China. Glob. Chang. Biol. 2013, 19, 2467–2477. [Google Scholar] [CrossRef]
- Liu, Y.T.; Li, Y.E.; Wan, Y.F.; Chen, D.L.; Gao, Q.Z.; Li, Y.; Qin, X.B. Nitrous oxide emissions from irrigated and fertilized spring maize in semi-arid northern China. Agric. Ecosyst. Environ. 2011, 141, 287–295. [Google Scholar] [CrossRef]
- Chen, X.; Cui, Z.; Fan, M.; Vitousek, P.; Zhao, M.; Ma, W.; Wang, Z.; Zhang, W.; Yan, X.; Yang, J. Producing more grain with lower environmental costs. Nature 2014, 514, 486–489. [Google Scholar] [CrossRef]
- Tilman, D.; Balzer, C.; Hill, J.; Befort, B.L. Global food demand and the sustainable intensification of agriculture. Proc. Natl. Acad. Sci. USA 2011, 108, 20260–20264. [Google Scholar] [CrossRef] [PubMed]
- Grassini, P.; Cassman, K.G. High-yield maize with large net energy yield and small global warming intensity. Proc. Natl. Acad. Sci. USA 2012, 109, 1074–1079. [Google Scholar] [CrossRef]
- Zhang, W.S.; Li, F.M.; Xiong, Y.C.; Xia, Q. Econometric analysis of the determinants of adoption of raising sheep in folds by farmers in the semiarid Loess Plateau of China. Ecol. Econ. 2012, 74, 145–152. [Google Scholar] [CrossRef]
- Qin, X.L.; Li, Y.Z.; Han, Y.L.; Hu, Y.C.; Li, Y.J.; Wen, X.X.; Liao, Y.C.; Siddique, K.H.M. Ridge-furrow mulching with black plastic film improves maize yield more than white plastic film in dry areas with adequate accumulated temperature. Agric. For. Meteorol. 2018, 262, 206–214. [Google Scholar] [CrossRef]


| Factor | GY (t ha−1) | Spike Number per Hectare | Grain Number per Spike | 100-Grain Weight (g) | Accumulation of N Uptake (kg ha−1) | NPFP (kg kg−1) | NAUE (%) | |
|---|---|---|---|---|---|---|---|---|
| Growing season | 2015 | 11.20 a | 65,414.13 a | 557.13 a | 26.46 a | 209.51 a | 51.46 a | 26.90 a |
| 2016 | 5.69 c | 62,248.13 c | 407.29 c | 26.54 a | 140.02 c | 25.92 c | 14.91 b | |
| 2017 | 6.69 b | 64,822.50 b | 434.50 b | 26.54 a | 183.69 b | 30.87 b | 14.50 b | |
| SP | FS | 7.15 b | 63,145.75 b | 435.53 b | 25.79 b | 159.58 b | 32.53 b | 15.20 b |
| RFPM | 8.57 a | 65,177.42 a | 497.08 a | 27.23 a | 195.90 a | 39.64 a | 22.34 a | |
| NM | N0 | 7.18 c | 64,215.83 ab | 443.67 c | 25.70 c | 146.08 c | / | / |
| N1 | 7.70 b | 63,861.33 b | 460.56 b | 26.23 bc | 173.53 b | 34.16 b | 12.21 c | |
| N2 | 8.24 a | 64,191.33 ab | 479.33 a | 26.78 ab | 193.69 a | 36.88 a | 21.17 b | |
| N3 | 8.32 a | 64,377.83 a | 481.67 a | 27.33 a | 197.66 a | 37.22 a | 22.92 a | |
| F test (Y) | ** | ** | ** | ** | ** | ** | ** | |
| F test (SP) | ** | ** | ** | ** | ** | ** | ** | |
| F test (NM) | ** | ** | ** | ** | ** | ** | ** | |
| F test (Y*SP) | ** | ** | ** | NS | ** | * | ** | |
| F test (Y*NM) | NS | NS | ** | NS | NS | NS | NS | |
| F test (SP*NM) | NS | NS | NS | NS | NS | NS | NS | |
| F test (Y*SP*NM) | NS | NS | NS | NS | NS | NS | NS | |
| Growing Seasons | Sowing Method | Treatments | Labor Input (US$ ha−1) | Material Input (US$ ha−1) | Machinery Input (US$ ha−1) | Total Input (US$ ha−1) | Output (US$ ha−1) | Total Output (US$ ha−1) | Net Income (US$ ha−1) | ||||
|---|---|---|---|---|---|---|---|---|---|---|---|---|---|
| Field Managements | Seeding, Harvesting | Plastic Sheets | Commercial Seeds | Fertilizers | Land Preparation | Grain Yield | Hay Yield | ||||||
| 2015 | FS | N0 | 160 | 50 | 0 | 156.3 | / | 120 | 486.3 | 2669.64 | 324.8 | 2994.4 | 2508.1 |
| N1 | 190 | 50 | 0 | 156.3 | 151.2 | 120 | 667.5 | 3325.00 | 358.3 | 3683.3 | 3015.8 | ||
| N2 | 250 | 50 | 0 | 156.3 | 151.2 | 120 | 727.5 | 3405.16 | 374.0 | 3779.2 | 3051.7 | ||
| N3 | 190 | 50 | 0 | 156.3 | 226.8 | 120 | 743.1 | 3292.39 | 396.0 | 3688.4 | 2945.3 | ||
| RFPM | N0 | 210 | 50 | 117.2 | 156.3 | / | 120 | 653.5 | 2909.40 | 541.3 | 3450.7 | 2797.2 | |
| N1 | 240 | 50 | 117.2 | 156.3 | 151.2 | 120 | 834.7 | 3325.00 | 597.2 | 3922.2 | 3087.5 | ||
| N2 | 300 | 50 | 117.2 | 156.3 | 151.2 | 120 | 894.7 | 3681.25 | 623.4 | 4304.6 | 3409.9 | ||
| N3 | 240 | 50 | 117.2 | 156.3 | 226.8 | 120 | 910.3 | 3651.56 | 660.1 | 4311.6 | 3401.3 | ||
| 2016 | FS | N0 | 160 | 50 | 0 | 156.3 | / | 120 | 486.3 | 1079.16 | 212.3 | 1291.4 | 805.1 |
| N1 | 190 | 50 | 0 | 156.3 | 151.2 | 120 | 667.5 | 1246.88 | 234.9 | 1481.8 | 814.3 | ||
| N2 | 250 | 50 | 0 | 156.3 | 151.2 | 120 | 727.5 | 1464.86 | 261.4 | 1726.3 | 998.8 | ||
| N3 | 190 | 50 | 0 | 156.3 | 226.8 | 120 | 743.1 | 1488.25 | 271.2 | 1759.4 | 1016.3 | ||
| RFPM | N0 | 210 | 50 | 117.2 | 156.3 | / | 120 | 653.5 | 1543.80 | 353.8 | 1897.6 | 1244.1 | |
| N1 | 240 | 50 | 117.2 | 156.3 | 151.2 | 120 | 834.7 | 1929.69 | 391.5 | 2321.2 | 1486.5 | ||
| N2 | 300 | 50 | 117.2 | 156.3 | 151.2 | 120 | 894.7 | 2137.50 | 435.7 | 2573.2 | 1678.5 | ||
| N3 | 240 | 50 | 117.2 | 156.3 | 226.8 | 120 | 910.3 | 2137.50 | 452.0 | 2589.5 | 1679.2 | ||
| 2017 | FS | N0 | 160 | 50 | 0 | 156.3 | / | 120 | 486.3 | 1663.36 | 241.0 | 1904.3 | 1418.0 |
| N1 | 190 | 50 | 0 | 156.3 | 151.2 | 120 | 667.5 | 1690.13 | 285.4 | 1975.5 | 1308.0 | ||
| N2 | 250 | 50 | 0 | 156.3 | 151.2 | 120 | 727.5 | 1848.87 | 323.9 | 2172.7 | 1445.2 | ||
| N3 | 190 | 50 | 0 | 156.3 | 226.8 | 120 | 743.1 | 1900.41 | 334.1 | 2234.5 | 1491.4 | ||
| RFPM | N0 | 210 | 50 | 117.2 | 156.3 | / | 120 | 653.5 | 1840.63 | 401.6 | 2242.3 | 1588.8 | |
| N1 | 240 | 50 | 117.2 | 156.3 | 151.2 | 120 | 834.7 | 2196.88 | 475.7 | 2672.5 | 1837.8 | ||
| N2 | 300 | 50 | 117.2 | 156.3 | 151.2 | 120 | 894.7 | 2375.00 | 539.8 | 2914.8 | 2020.1 | ||
| N3 | 240 | 50 | 117.2 | 156.3 | 226.8 | 120 | 910.3 | 2345.31 | 556.9 | 2902.2 | 1991.9 | ||
Disclaimer/Publisher’s Note: The statements, opinions and data contained in all publications are solely those of the individual author(s) and contributor(s) and not of MDPI and/or the editor(s). MDPI and/or the editor(s) disclaim responsibility for any injury to people or property resulting from any ideas, methods, instructions or products referred to in the content. |
© 2023 by the authors. Licensee MDPI, Basel, Switzerland. This article is an open access article distributed under the terms and conditions of the Creative Commons Attribution (CC BY) license (https://creativecommons.org/licenses/by/4.0/).
Share and Cite
Liu, S.; Li, W.; Liu, L.; Wen, X.; Liao, Y.; Zhang, G.; Han, J. Optimizing Sowing Patterns and Nitrogen Management Strategies Used to Balance Maize Crop Productivity, N2O Emissions, and Economic Benefits in the Loess Plateau Region of China. Agronomy 2023, 13, 2220. https://doi.org/10.3390/agronomy13092220
Liu S, Li W, Liu L, Wen X, Liao Y, Zhang G, Han J. Optimizing Sowing Patterns and Nitrogen Management Strategies Used to Balance Maize Crop Productivity, N2O Emissions, and Economic Benefits in the Loess Plateau Region of China. Agronomy. 2023; 13(9):2220. https://doi.org/10.3390/agronomy13092220
Chicago/Turabian StyleLiu, Shiju, Wei Li, Lulu Liu, Xiaoxia Wen, Yuncheng Liao, Guangxin Zhang, and Juan Han. 2023. "Optimizing Sowing Patterns and Nitrogen Management Strategies Used to Balance Maize Crop Productivity, N2O Emissions, and Economic Benefits in the Loess Plateau Region of China" Agronomy 13, no. 9: 2220. https://doi.org/10.3390/agronomy13092220