Article

Nitrogen Fertilization Using Conventional and Slow-Release Fertilizers at Multiple Levels in Lolium multiflorum Lam. Pastures

1
Faculty of Agricultural and Environmental Sciences, University of the Azores, Rua Capitão João d’Ávila, 9700-042 Angra do Heroísmo, Portugal
2
IITTA—Instituto de Investigação e Tecnologias Agrárias e do Ambiente, Rua Capitão João d’Ávila, 9700-042 Angra do Heroísmo, Portugal
3
Bel Portugal, Estrada Regional, nº 46 Matriz, 9600-549 Ribeira Grande, Portugal
4
CBA—Centro de Biotecnologia dos Açores, Rua Capitão João d’Ávila, 9700-042 Angra do Heroísmo, Portugal
*
Author to whom correspondence should be addressed.
Agronomy 2024, 14(10), 2191; https://doi.org/10.3390/agronomy14102191
Submission received: 1 September 2024 / Revised: 18 September 2024 / Accepted: 20 September 2024 / Published: 24 September 2024
(This article belongs to the Section Agroecology Innovation: Achieving System Resilience)

Abstract

:
Pastures are essential for sustaining dairy production, particularly in temperate climates where year-round grazing is feasible. However, comprehensive analyses of their productivity, efficiency, and cost evaluation remain uncommon. This study evaluated the productivity, quality, nitrogen fertilization use efficiency, and production costs of Lolium multiflorum Lam pasture on a farm in São Miguel Island. The research compared conventional nitrogen fertilizer with slow-release nitrogen fertilizer at application rates of 320 and 160 kg N ha−1, alongside a control treatment. A Latin square design with five treatments was employed to assess both agronomic and economic performance. The results showed that the type of fertilizer did not significantly influence productivity or quality, while nitrogen levels had a notable impact. Higher nitrogen doses increased dry matter yield and crude protein content. Fiber characteristics remained relatively stable, though neutral detergent fiber and acid detergent fiber levels tended to rise with increased nitrogen application. Nitrogen fertilizer use efficiency consistently exceeded 70%, regardless of the fertilizer type or application rate. Regarding production costs, conventional fertilizer was significantly more cost-effective than slow-release fertilizer, underscoring the importance of selecting economically viable options without compromising agronomic performance in forage production.

1. Introduction

Efficient forage production is crucial for the sustainability and success of farms, particularly in feeding dairy cows [1,2]. In the Azores, with their temperate maritime climate and fertile volcanic soils, pastures are the primary feed source. Forage crops play a key role in this system, and silage preservation is a vital strategy to mitigate feed shortages. Continuous monitoring of forage quality—whether from pasture or silage—is essential for effective pasture management, enabling the formulation of diets that enhance animal welfare, longevity, and performance [3,4,5].
In the specific context of Lolium multiflorum Lam. pastures, rotational grazing stands out as a promising management practice. This method, which involves periodically moving animals to fresh plots, promotes vigorous pasture growth. Variations of rotational grazing include intensive grazing, multiple grazing, and short-term grazing [6], all of which incorporate rest periods to support plant regrowth. While this grazing model requires substantial labor and decision-making, it has proven effective for sustainable pasture management [7].
Nitrogen is often the most limiting nutrient for plants due to high demand and limited soil availability, especially in crops that lack biological nitrogen fixation mechanisms. Plants rely on nitrogen from soil reserves, both mineral and organic, or from external sources like inorganic and organic fertilizers. Inorganic fertilizers typically come in two forms: conventional and slow-release. Both significantly affect forage productivity, quality, and cost for producers. Slow-release fertilizers, by reducing nitrogen leaching and synchronizing nutrient availability with plant demand, have been shown to enhance yield and forage quality [8,9,10,11,12]. However, their higher cost can be a drawback, as increased yield may not always offset the expense [12]. Additionally, while the effects of conventional fertilizers tend to be more predictable, slow-release fertilizers can vary in performance due to inconsistencies in particle size and coating properties [8]. Understanding these dynamics is critical for optimizing production and improving the environmental sustainability of agricultural systems [13].
Nitrogen fertilization levels have been shown to positively affect pasture productivity [9,10,14,15] and influence forage quality in multiple ways [15,16,17,18,19,20], particularly with respect to crude protein (CP) levels and dry matter (DM) content. Nitrogen fertilization use efficiency (NFUE) is crucial to agricultural production. Research by [21] found that NFUE varies significantly between grain and forage crops. For example, grain wheat had an efficiency of only 20–25%, while fodder crops exhibited a much higher NFUE of 45–50%. In Lolium multiflorum pastures, higher NFUE values have been observed, particularly under lower fertilization levels [10,22].
Production costs vary considerably, depending on productivity, the type of feed produced (grazing, silage, or hay), cash costs, and the farm machinery used [12,23]. The costs of pastures are generally much lower than those of silage and hay, primarily due to reduced machinery use and fewer expenditures for forage preservation.
In the specific conditions of the Azores, further research is needed to compare the effectiveness of conventional versus slow-release fertilizers. This study aims to address this gap by evaluating the impact of different fertilizer types and application rates on pasture productivity and forage quality, as well as on the cost of producing DM and CP. The findings will contribute to agricultural sustainability and help optimize production costs in dairy cow feeding systems.

2. Materials and Methods
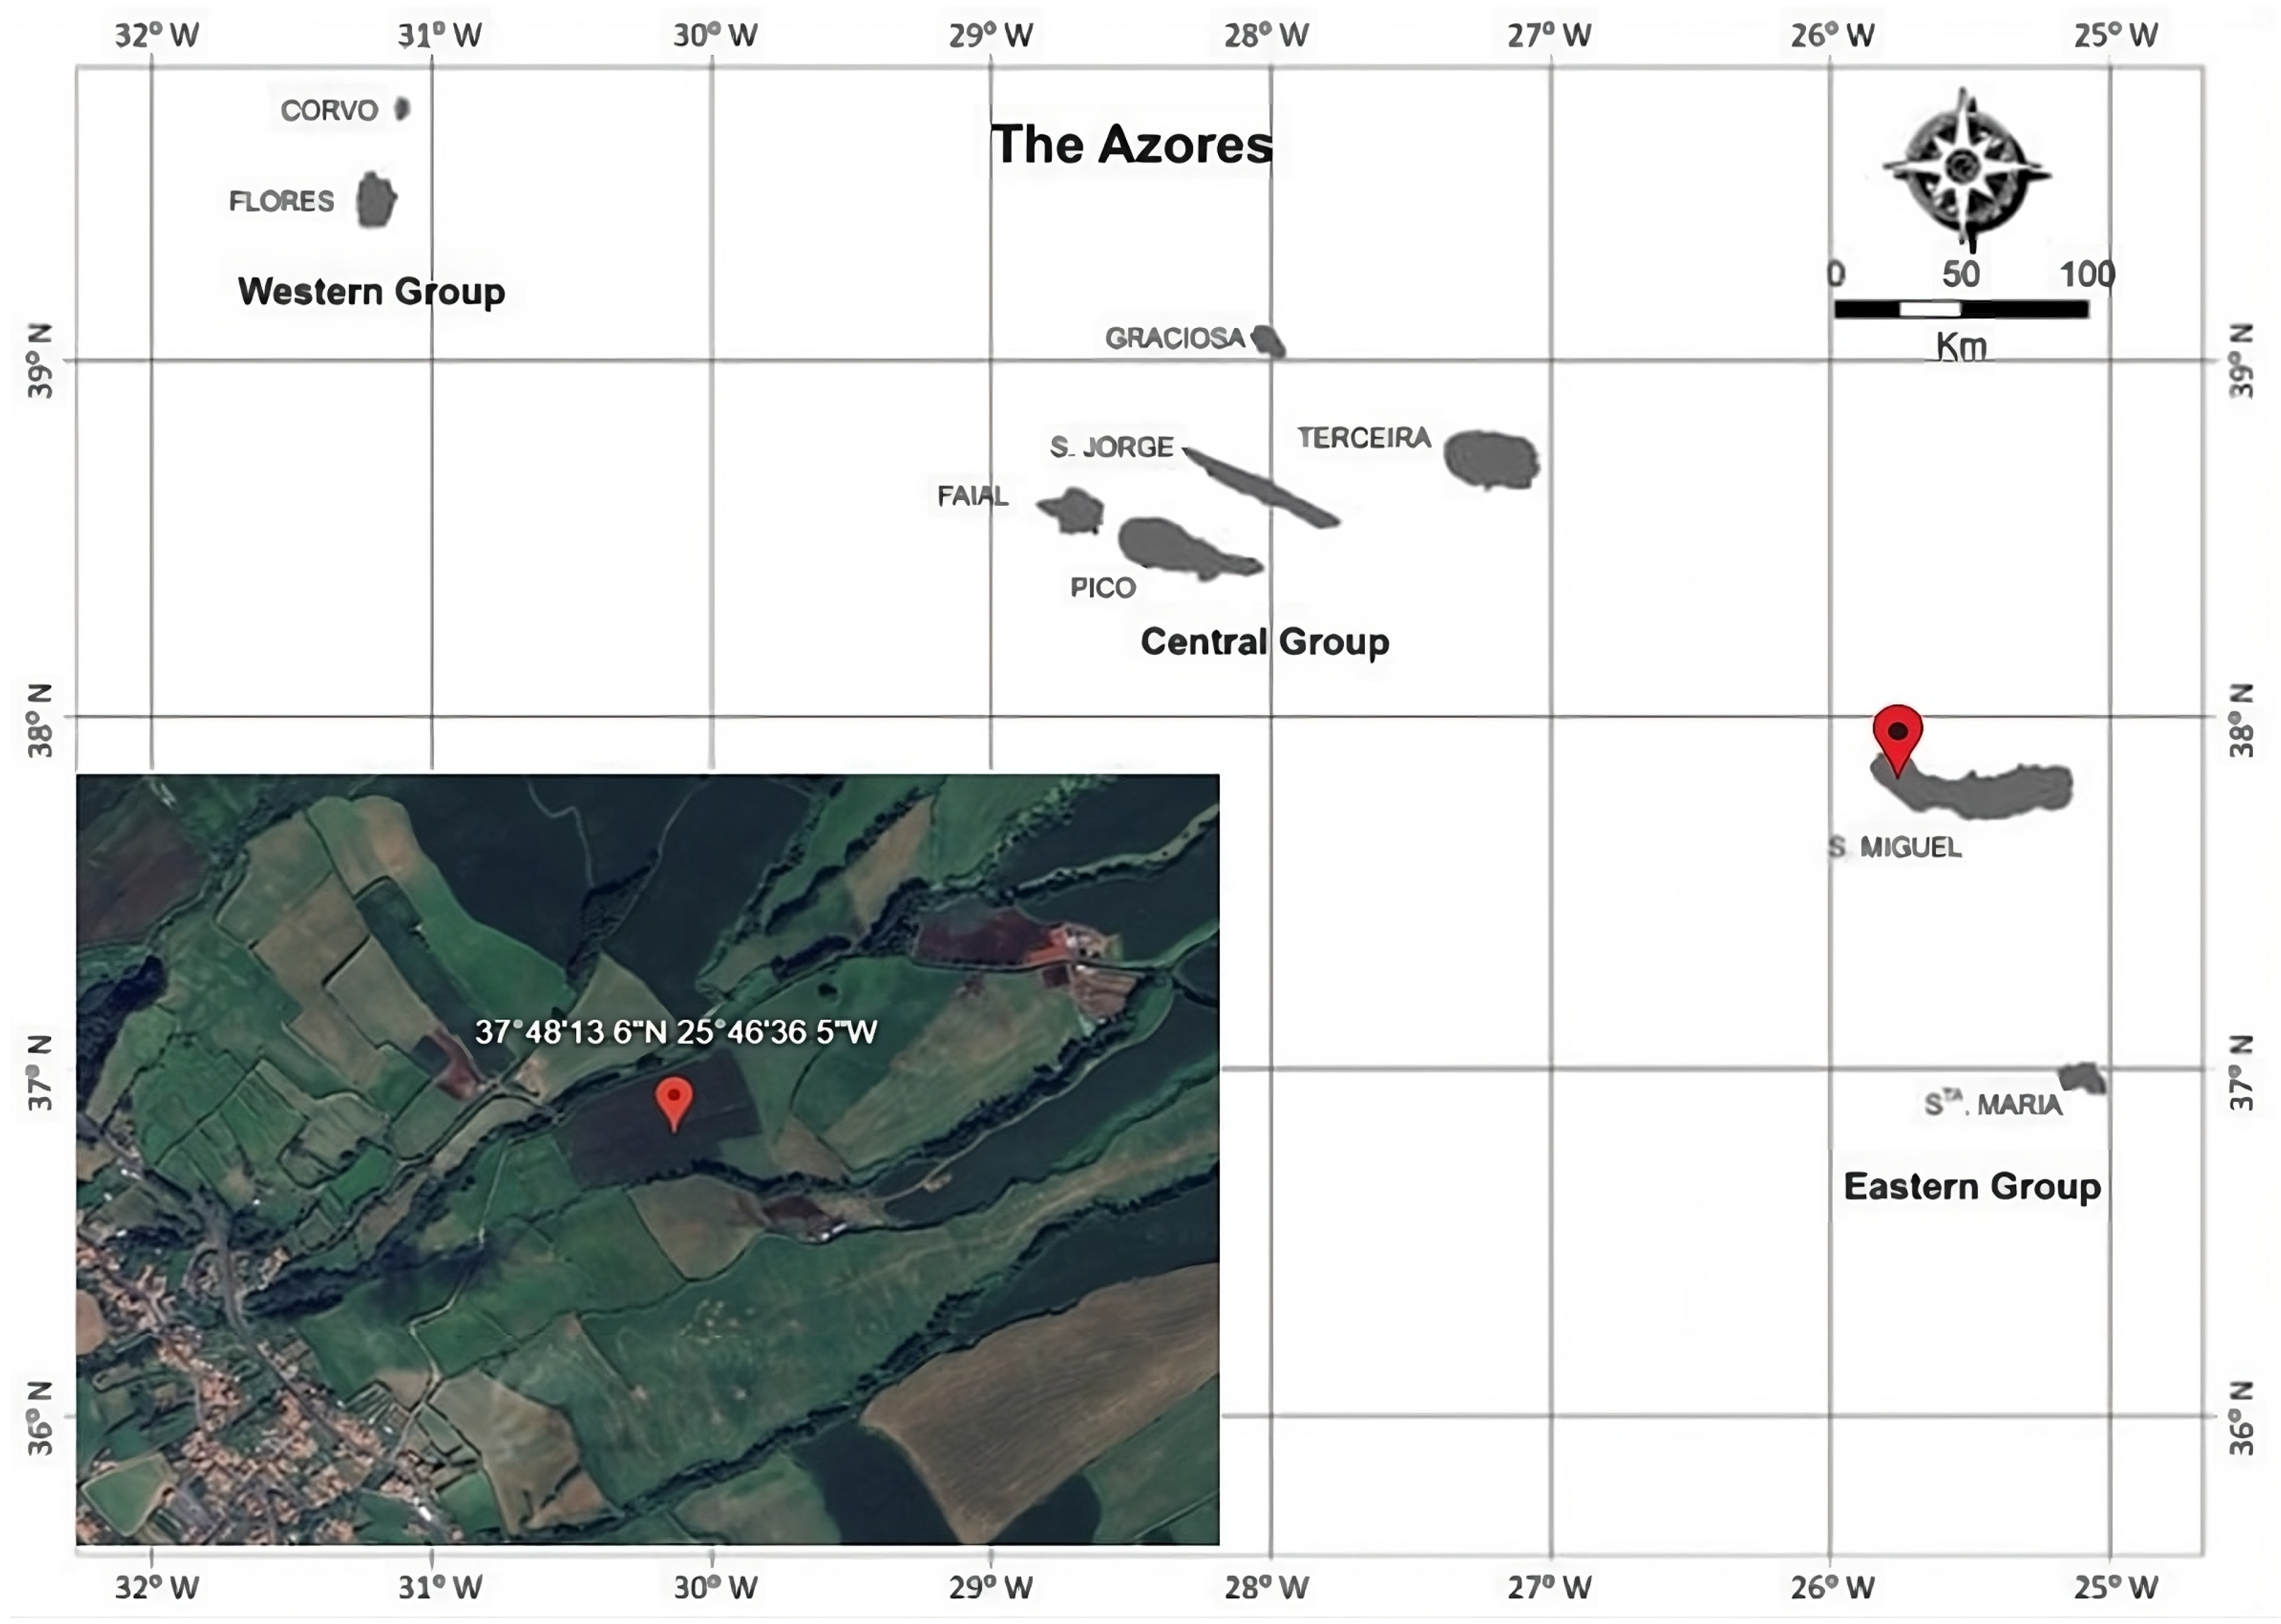
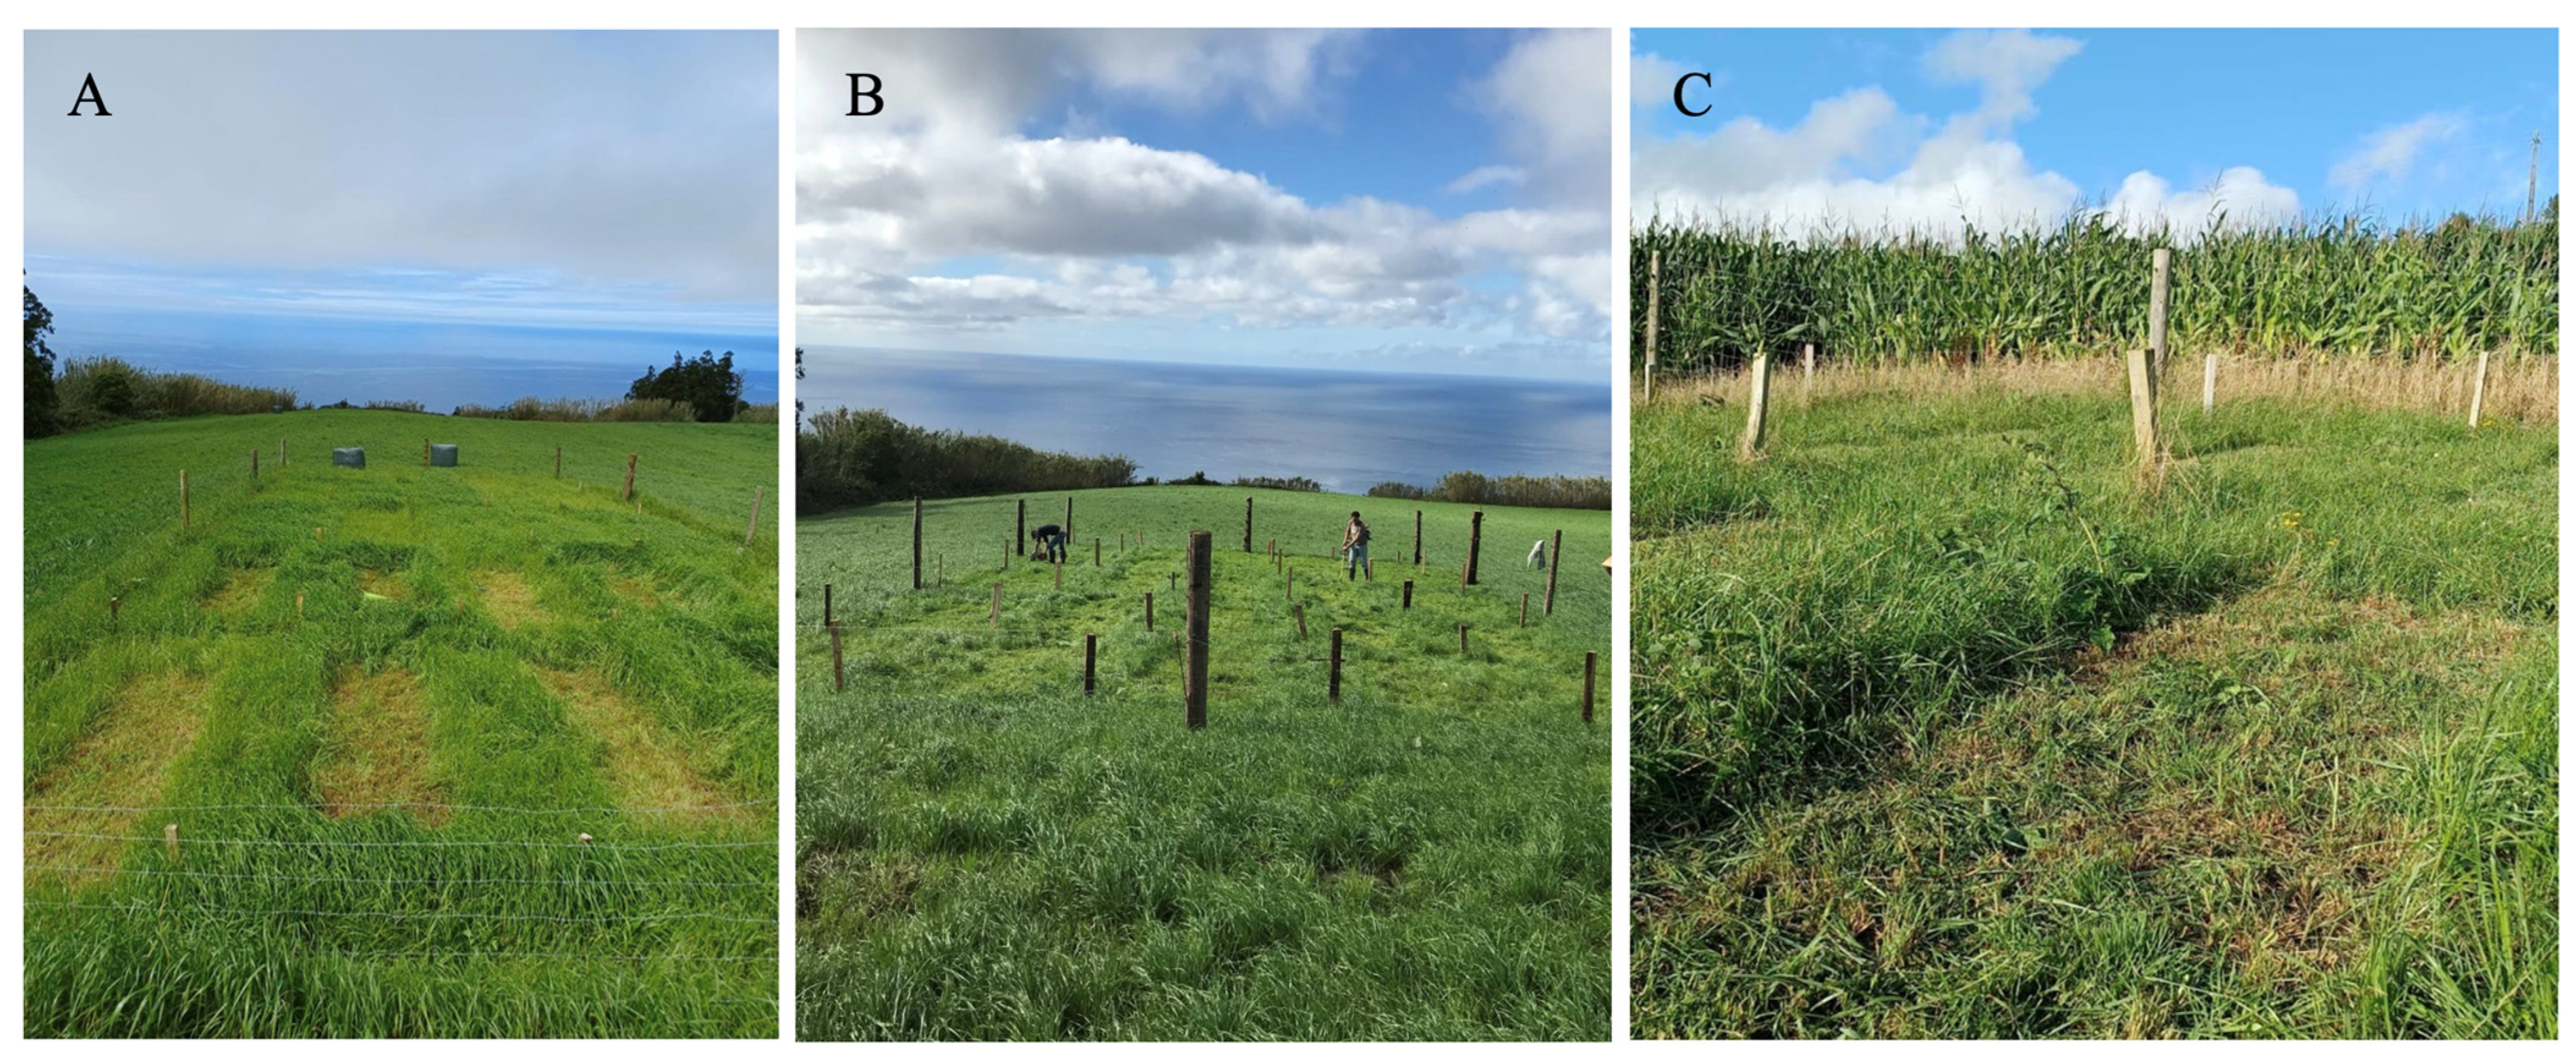
2.1. Study Site

This study was conducted on São Miguel Island, on a dairy farm located on the southern side of the island at an approximate altitude of 300 m above sea level (Figure 1). São Miguel is part of the Azores, an outermost region of the European Union known for its unique geography as an archipelago of nine islands. Situated in the northern hemisphere between latitudes 37° and 40° N and longitudes 25° and 31° W, the Azores lie approximately 1500 km from mainland Portugal and 3900 km from North America.
The Azores are renowned for their robust dairy and beef production capabilities. Despite comprising only 2.54% of Portugal’s total land area, the Azores accounted for 30.5% of the country’s milk production in 2023 [24,25], a trend that has persisted for decades. The islands’ temperate maritime climate and fertile volcanic soils have led to approximately 88% of their agricultural land being dedicated to fodder crops [26]. The prevalent cropping systems in São Miguel at altitudes up to 400 m are:
(a) An annual rotation consisting of Lolium multiflorum, grown from October through April or May, followed by maize (Zea mays L.) grown from April or May through August or September, with both crops cultivated in the same year and soil tillage performed before each crop (mostly conventional tillage and more intensive for maize, and reduced tillage for annual ryegrass).
(b) A biennial rotation of maize and annual ryegrass, where ryegrass is grown for a full year. In the following October, after the first abundant fall rains, the pasture is typically sown without soil tillage (zero tillage) or with reduced tillage, unless spontaneous reseeding occurred in the summer. The pasture is then grazed by animals until the following spring or cut for silage, after which the soil is tilled, and maize is sown.
This experiment was conducted within a biennial rotation system.

2.2. Soils

The soils in the Azores are of volcanic origin, with most classified as andisols. Specifically, the soils on São Miguel Island are predominantly trachytic [27]. The experiment was conducted on a vitric hapludand soil, which is particularly notable for its agricultural suitability. Consequently, the farm where the experiment took place is part of an extensive agricultural area.

2.3. Climate Data

The Azores feature a temperate oceanic climate, with lower temperatures in February, averaging around 14 °C at altitudes below 100 m above sea level, and higher temperatures in August, averaging between 22 °C and 23 °C [28]. Atmospheric humidity levels are typically high, reaching up to 95% in high-altitude regions. Rainfall peaks in January and February, with the lowest levels in July. According to the Köppen classification, most agricultural regions of the Azores fall into classes Csa and Csb [29], with the study site classified as Csb.
The climatic conditions at the study area (Supplementary Table S1) were colder than those recorded at national weather stations in the Azores, with average monthly temperatures ranging from 11.6 °C to 20.4 °C, due to its higher altitude of 300 m, similar to the climatic data of a study site reported by [30]. The area also experienced higher precipitation, totaling 1280.3 mm annually, average monthly wind speeds ranging from 0.32 to 1.61 m s−1, high relative humidity with monthly averages ranging from 86.1% to 95.0%, and low solar radiation, ranging from 51.9 to 171.6 W m−2.

2.4. Soil Chemical Analyses

At the beginning of the trial, soil samples were collected to characterize soil fertility levels across the entire field. Each sample was obtained from each plot using an eight-subsample zigzag sampling method. Organic matter (OM) percentage (w/w) was determined by calcination, while pH was measured potentiometrically in H2O using a glass electrode (10:25 w/v). Phosphorus (P) was determined using the modified Olsen method, extracted with sodium bicarbonate at pH 8.5, and measured by spectrophotometry (1:20). Potassium (K), calcium (Ca), and magnesium (Mg) were extracted using ammonium acetate at pH 7 and analyzed by atomic absorption spectroscopy (1:10) according to the ISO 11260:2018 E standard [31].
The soil analyses (Supplementary Table S2) revealed variation in organic matter levels, ranging from 4.1% to 9.2%, with values classified as average to high. The pH ranged between 5.5 and 6.3, indicating acidic to slightly acidic soil. Phosphorus (P) levels ranged from 20 to 129 mg kg−1, with only two plots at medium levels and the rest at high to very high levels. Potassium (K) levels were consistently high (173–493 mg kg−1). Calcium (Ca) levels were uniformly low (437–865 mg kg−1). Magnesium (Mg) levels ranged from 51 to 187 mg kg−1, indicating high to very high levels. Given that most macronutrient levels were high, fertilization was limited to nitrogen applications, supplemented with calcium, magnesium, and sulfur.

2.5. Experimental Design

In this trial, five treatment modalities were tested using a Latin square design (Supplementary Figure S1) over a total area of 250 m2 (25 m × 10 m), consisting of 25 plots, each with an area of 10 m2 (5 m × 2 m). Two types of nitrogen-based fertilizers were used: a conventional (Cf) inorganic fertilizer with 27% nitrogen (plus 3.5% CaO and 3.5% MgO) and a slow-release (Sr) coated inorganic fertilizer containing 26% nitrogen (plus 22% SO3, 5% CaO, and 2% MgO). These were applied at two levels (approximately 160 and 320 kg N ha−1Table 1), along with a control treatment (C) where no fertilizer was applied. Each treatment was allocated an area of 50 m2, divided into five replicates.
The plots were arranged with this layout to account for the 6% slope of the land from north to south and the presence of windbreaks to the east, approximately 50 m away. This design aimed to mitigate potential variations due to the terrain and enhance sensitivity in detecting differences between treatments. Additionally, a 1 m buffer was established between the plots and the surrounding fence to prevent interference from nearby grazing animals on the farm.

2.6. Agricultural Practices

After the previous maize crop had been harvested, glyphosate herbicide was applied to the entire field to eliminate any existing plant species that could interfere with the trial. Seven days later, soil tillage was performed using twice a disc harrow. No additional pesticides were applied throughout the duration of the trial.
The trial began with the seeding of a local landrace of annual ryegrass, designated as “Azevém da Terra”, which is notorious for its high winter productivity and rust resistance, using a centrifugal broadcast fertilizer spreader at a rate of 60 kg ha−1. This was followed by shallow tillage with the disc harrow on 8 October 2021, to partially cover the seeds. The trial concluded on 12 September 2022, following the final cut, thus completing the plant’s annual cycle.
Throughout the trial, ten cuts were performed in the middle area of each plot (Figure 2A) to simulate rotational grazing, the most common method of feeding dairy and beef animals on these islands. The intervals between cuts showed minimal variance, averaging 32 days, with the goal of conducting cuts every 30–31 days (Table 1). After the plant material was removed to estimate yield (Figure 2A), the remaining grass was cut to the same height (Figure 2B) and removed as well, ensuring that the entire trial field remained homogeneous after each cut.
Fertilization was carried out on seven of the ten cuts (Table 1). The amount of nitrogen applied per cut was proportional to the expected seasonal yield. The last fertilization took place on 6 June. Subsequent cuttings were not accompanied by fertilization due to the closure of the growing season, reduced soil moisture from lower precipitation and relative humidity, and higher temperatures and radiation (Supplementary Table S1). Consequently, from that point onward, a low response to fertilization was expected.

2.7. Productivity Determination and Sample Collection

Yield assessment was conducted on a 3.6 m2 area in the middle of each plot for every cut, ensuring at least 50 cm of clearance from the plot boundaries (Figure 2A). The grass was cut using a disc brush cutter set to a stubble height of 4–6 cm, then collected with a leaf rake and deposited on a mat. The fresh mass of the grass was measured with a crane scale. A 1 kg amount of fresh sample was randomly collected from each plot for further analysis to determine the percentage of dry matter and evaluate forage quality.
With five treatments and five replications, this resulted in 25 samples per cut. Over the course of the 10 cuts conducted during the experiment, a total of 250 forage samples were obtained for chemical analysis.
Throughout most of the trial, the species composition predominantly consisted of Lolium multiflorum. However, during the final two cuts, particularly on 12 September 2022, the species composition shifted due to the gradual disappearance of Lolium multiflorum and the emergence of numerous C4 and C3 weeds, including white clover (Trifolium repens L.) (Figure 2C).

2.8. Forage Chemical Analyses

The samples were properly identified and then dried at 65 °C in an oven with forced air circulation until they reached a constant weight. The dried samples were then ground in a mill equipped with a 1 mm round mesh sieve. Analytical characterization was conducted using the Weende scheme [32] to determine DM at 105 °C (method 930.15), crude ash (CA, method 942.05), and CP (method 954.01). Neutral detergent fiber (NDF), acid detergent fiber (ADF), and acid detergent lignin (ADL) were measured using the methods proposed by [33]. The results for NDF and ADF were expressed without residual ash.

2.9. Crude Protein Productivity and Nitrogen Fertilization Use Efficiency

Crude protein productivity per cut was calculated by multiplying the DM productivity by the CP content (%). To determine the total CP productivity (kg ha−1) for each treatment, the following Formula (1) was used:
T o t a l   C P   p r o d u c t i v i t y = i = 1 10 D M   p r o d u c t i v i t y i × C P i
i = cut number
Considering that this trial tested four fertilization treatments (Cf++, Cf+, Sr++, Sr+) and compared them with a treatment without any fertilization (C), we calculated nitrogen fertilization use efficiency (NFUE) by the gain in nitrogen with its fertilization [21]. Therefore, NFUE was calculated according to the following Formula (2) for each fertilization treatment:
N F U E = T o t a l   p l a n t   N   y T o t a l   p l a n t   N ( c ) N f e r t i l i z e d ( y )
y = fertilization treatment
c = control treatment

2.10. Determination of Production Costs

The production costs were primarily divided into two categories: (a) cash costs, including seeds, herbicides, and fertilizers, and (b) mechanized operations carried out using the farm’s machinery, assuming a rotational grazing system. Cash cost information was provided by the farmer who owns the trial land and one of the authors of this article (MFM). Mechanized operational costs were calculated based on tasks performed using the farm’s own equipment, allowing us to assess whether equipment depreciation and interest costs needed to be considered. Maintenance, fuel, labor, and insurance costs (where applicable) were also included. These variables enabled us to calculate the hourly cost of each operation and, combined with the effective field capacity, the cost per hectare. It is worth noting that the prices of fertilizers, purchased at the beginning of the trial, were significantly lower than those a few months later, due to logistical challenges arising from the pandemic and the conflict in Ukraine. The production costs were indexed to the kilogram of DM and CP produced across all tested methods.

2.11. Statistical Analysis

Analyses of variance were conducted considering the trial design (Latin square), using the IBM SPSS program (version 24). The means were compared using the Tukey method. Before applying the Tukey method, the homogeneity of variances and the normality of the data distribution were tested to ensure the validity of the results. These analyses were performed for DM and CP productivity, forage chemical composition, NFUE, and production costs.

3. Results

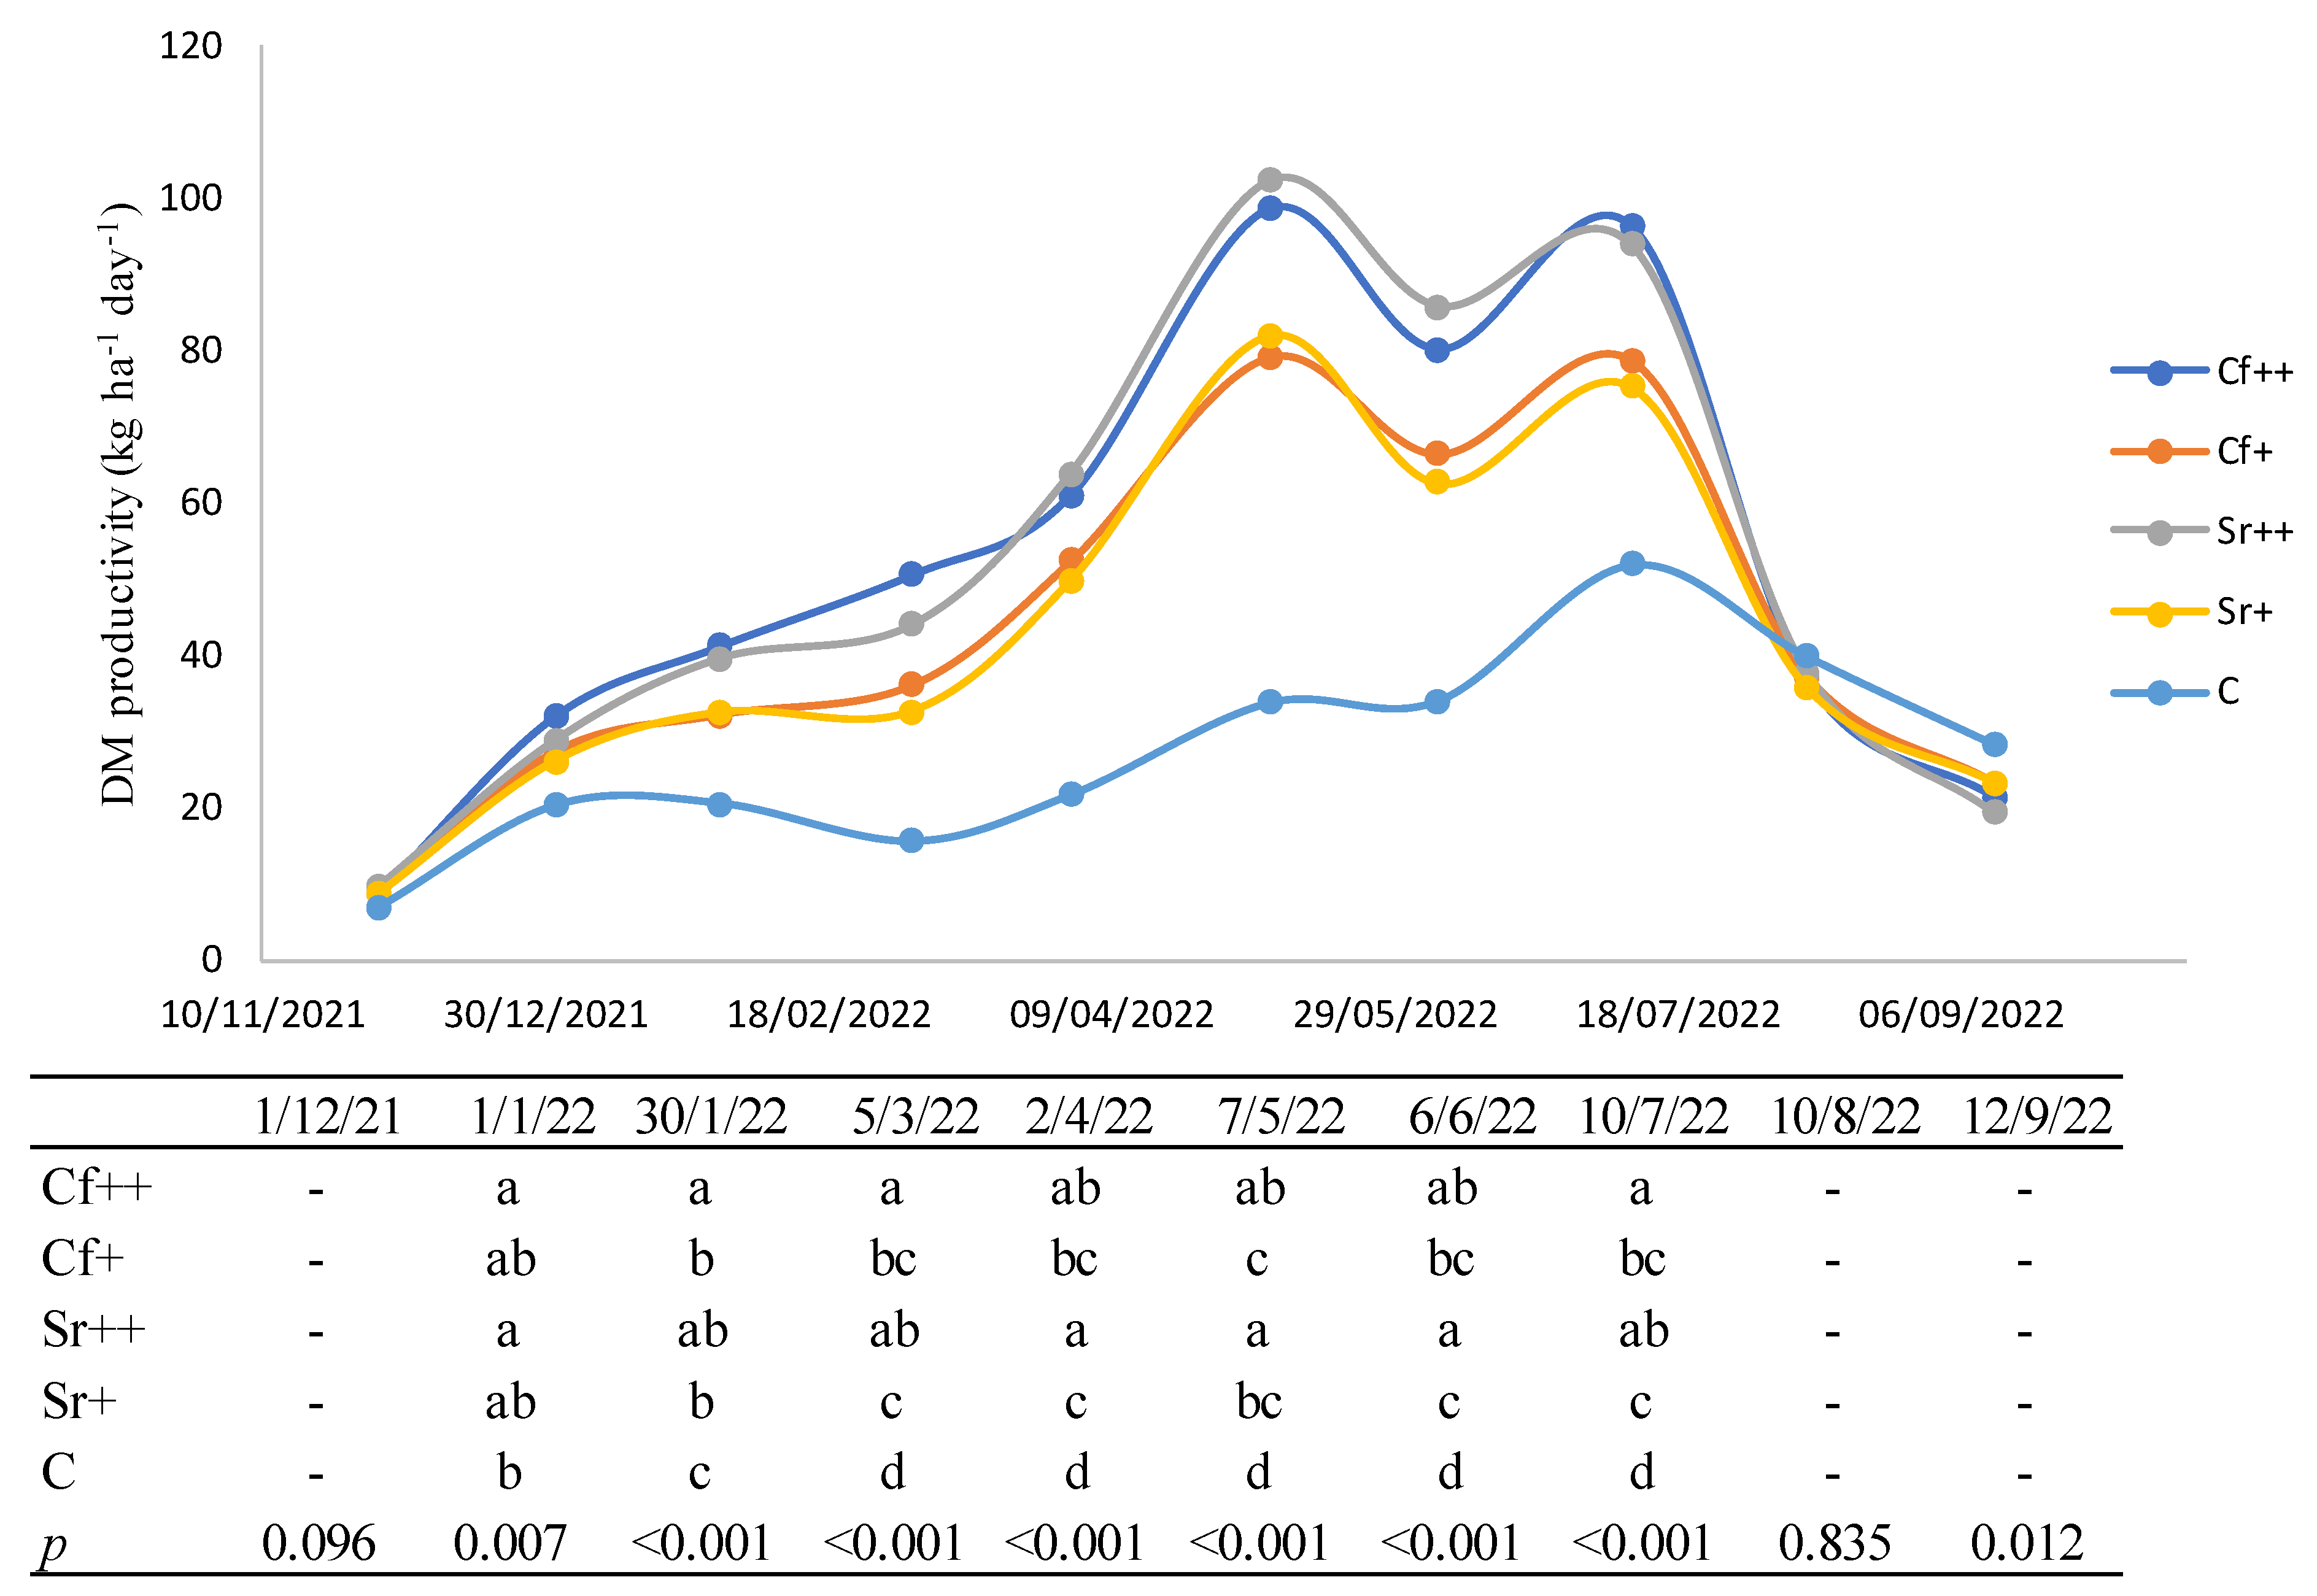
3.1. Productivity Analyses

Throughout the crop cycle, the daily productivity of the five treatments followed a consistent pattern, except in unfertilized cuts (Figure 3). Treatments with higher levels of nitrogen fertilization (approximately 320 kg N ha−1) significantly outperformed others, while those with intermediate levels (approximately 160 kg N ha−1) also stood out compared to the control. The first cut, without nitrogen fertilization, served as a uniform base for the treatments, showcasing an initial productivity ranging between 6.90 and 9.75 kg of DM ha−1 day−1. The subsequent cut, after fertilization, highlighted the increase in productivity across all treatments, with values ranging between 20.22 and 30.01 kg of DM ha−1 day−1. The Cf++ treatment outperformed all other treatments but was only significantly different from the intermediate-level fertilization and the control. In the following cuts, the trend of increasing productivity continued, reaching higher values such as 102.21 kg of DM ha−1 day−1 in April and May for Sr++. This trend continued until early July. However, water scarcity from mid-July onwards negatively impacted productivity, which varied between 19.27 and 39.88 kg of DM ha−1 day−1 in the last two cuts. During this period, the daily productivity of the treatments did not differ significantly, and the C treatment had slightly higher productivity than the others.
The accumulated DM productivity (Figure 4) highlighted the differences between treatments in daily productivity (Figure 3). The highest level of fertilization significantly outperformed the C treatment on 1 January, whereas the intermediate fertilization level did not. By 31 January, all fertilized treatments significantly outperformed the C treatment. From 2 April onwards, all fertilization levels were significantly different from each other. There were no significant differences in accumulated yield at any cutting date between the two types of fertilizers, although the conventional fertilizer tended to outperform the slow-release fertilizer. The accumulated yields were 17,080.89 kg ha−1 for Cf++, 16,992.84 kg ha−1 for Sr++, 14,296.26 kg ha−1 for Cf+, 13,909.78 kg ha−1 for Sr+, and 8856.06 kg ha−1 for C. The higher fertilization level resulted in an average 92% increase in DM productivity compared to the C treatment, while the intermediate fertilization level showed a 59% increase. When comparing the two fertilization levels, the highest level produced 21% more DM than the intermediate level.

3.2. Forage Chemical Analyses

The chemical evaluation of the five treatments was conducted across all cuts (Table 2 and Table 3). The first cut of the trial took place on 1 December 2021, during the crop’s establishment period, without any prior fertilization. As expected, no significant differences were found between treatments for any of the parameters (Table 2), indicating similar conditions among them. The DM content of this cut was low, while CP, NDF, and ADF levels were high, and ADL was low to average, consistent with data from [27]. Crude ash content was high, likely due to the low cutting height (4–6 cm) and low productivity, which increased the relative contribution of the lower strata biomass that was more contaminated with soil.
For the second cut, conducted on 1 January 2022 (Table 2), significant differences were observed only in DM content among treatments (p = 0.004). The C treatment had the highest DM content (13.65%), while the other treatments ranged between 11.81% and 12.28%. The other parameters showed little variation from the first cut.
In the third cut, conducted on 30 January 2022 (Table 2), significant differences were observed only in CP content between treatments (p = 0.017). The C treatment had the lowest CP value (18.94%), while the Sr++ treatment had the highest (22.32%). Dry matter content was the lowest recorded in the trial, likely due to low temperatures, limited sunlight, high relative humidity, and heavy precipitation (Supplementary Table S1). Dry matter values ranged from 9.01% in the Cf+ treatment to 10.72% in the C treatment.
In the fourth cut, conducted on 5 March 2022 (Table 2), significant differences were found in both DM and CP contents (p = 0.003 and p = 0.002, respectively). Dry matter content ranged from 9.76% for Sr++ to 12.49% for C, while CP content decreased compared to previous cuts, ranging from 15.32% in C to 19.15% in Sr++. Neutral detergent fiber values were higher than in previous cuts, ranging from 72.05% in Cf+ to 76.77% in Sr+, a trend that persisted in subsequent cuts. Acid detergent fiber levels were also higher than in the previous cut, with an average value of 4.12%, as expected as the plants approached the reproductive stage.
In the fifth cut, conducted on 2 April 2022 (Table 3), significant differences were observed in both DM and CP contents (p < 0.001 and p = 0.001, respectively). Dry matter content increased considerably compared to the previous cut, with the C treatment reaching 19.90%, significantly higher than the other treatments. Crude protein content continued to decline, ranging from 13.14% in the C treatment to 18.41% in the Sr++ treatment.
In the sixth cut, conducted on 7 May 2022 (Table 3), significant differences were observed in DM, CP, NDF, ADF, and CA contents. Dry matter values were like those in the previous cut, ranging from 13.29% in the Cf++ treatment to 17.93% in the C treatment. The downward trend in CP continued, with values ranging from 11.15% in the Sr+ treatment to 14.33% in the Cf++ treatment. Neutral detergent fiber levels were high across all treatments, reflecting the plants’ advancement in their reproductive cycle, ranging from 70.51% in the C treatment to 76.44% in the Cf++ treatment. Acid detergent fiber values were also elevated, ranging from 33.18% in the C treatment to 39.31% in the Cf++ treatment. Crude ash content continued to decline compared to previous cuts, ranging from 9.97% in the Sr+ treatment to 12.05% in the C treatment.
In the seventh cut, conducted on 6 June 2022 (Table 3), significant differences were observed in DM and CP, with generally low DM values. The C treatment, however, had the highest DM level at 12.81%. Higher fertilization levels produced the highest CP values, with 16.78% for Cf++ and 16.01% for Sr++. In contrast, intermediate and unfertilized treatments had lower CP values, with 13.56% for Sr+ and 13.57% for C. Neutral detergent fiber values were notably high, reaching 77.37% in the Cf++ treatment.
In the eighth cut, conducted on 10 July 2022 (Table 3), significant differences were observed in CP and NDF levels, with p-values of 0.003 and 0.020, respectively. Crude protein values were the lowest recorded during the trial, ranging from 10.21% in the Sr+ treatment to 13.34% in the Sr++ treatment. Neutral detergent fiber values were generally high but lower than in some previous cuts, ranging from 68.48% in the C treatment to 72.98% in the Sr++ treatment. Acid detergent fiber levels were the highest observed up to this point, averaging 6.17%. Crude ash content, which had been systematically decreasing, reached its lowest level of the trial, averaging 8.99%. As the plants advanced through their reproductive cycle, with longer days, increased radiation, and higher temperatures, the DM percentage increased compared to previous cuts, averaging 21.35%.
In the ninth cut, conducted on 10 August 2022 (Table 3), no significant differences were observed among treatments. This lack of variation is attributed to the absence of fertilization in the previous cut and the plants nearing the end of their life cycle. Dry matter percentages were the highest recorded in the trial, averaging 23.86%. Crude protein levels increased compared to the previous cut, while NDF, ADF, and ADL reached their highest levels, averaging 74.26%, 39.91%, and 10.59%, respectively. At this stage, the surviving Lolium multiflorum plants were primarily in reproductive development, and other spontaneous species, including a mix of C4 and C3 plants such as clovers, were growing in the plots.
In the tenth cut, conducted on 12 September 2022 (Table 3), no significant differences were observed in any parameters, similar to the previous cut. Crude protein levels were comparable to those of the first three cuts, likely due to the growth of spontaneous species, particularly white clover (Trifolium repens L.), while most Lolium multiflorum Lam. plants were dying. Subsequently, NDF, ADF, and ADL levels decreased compared to the ninth cut.

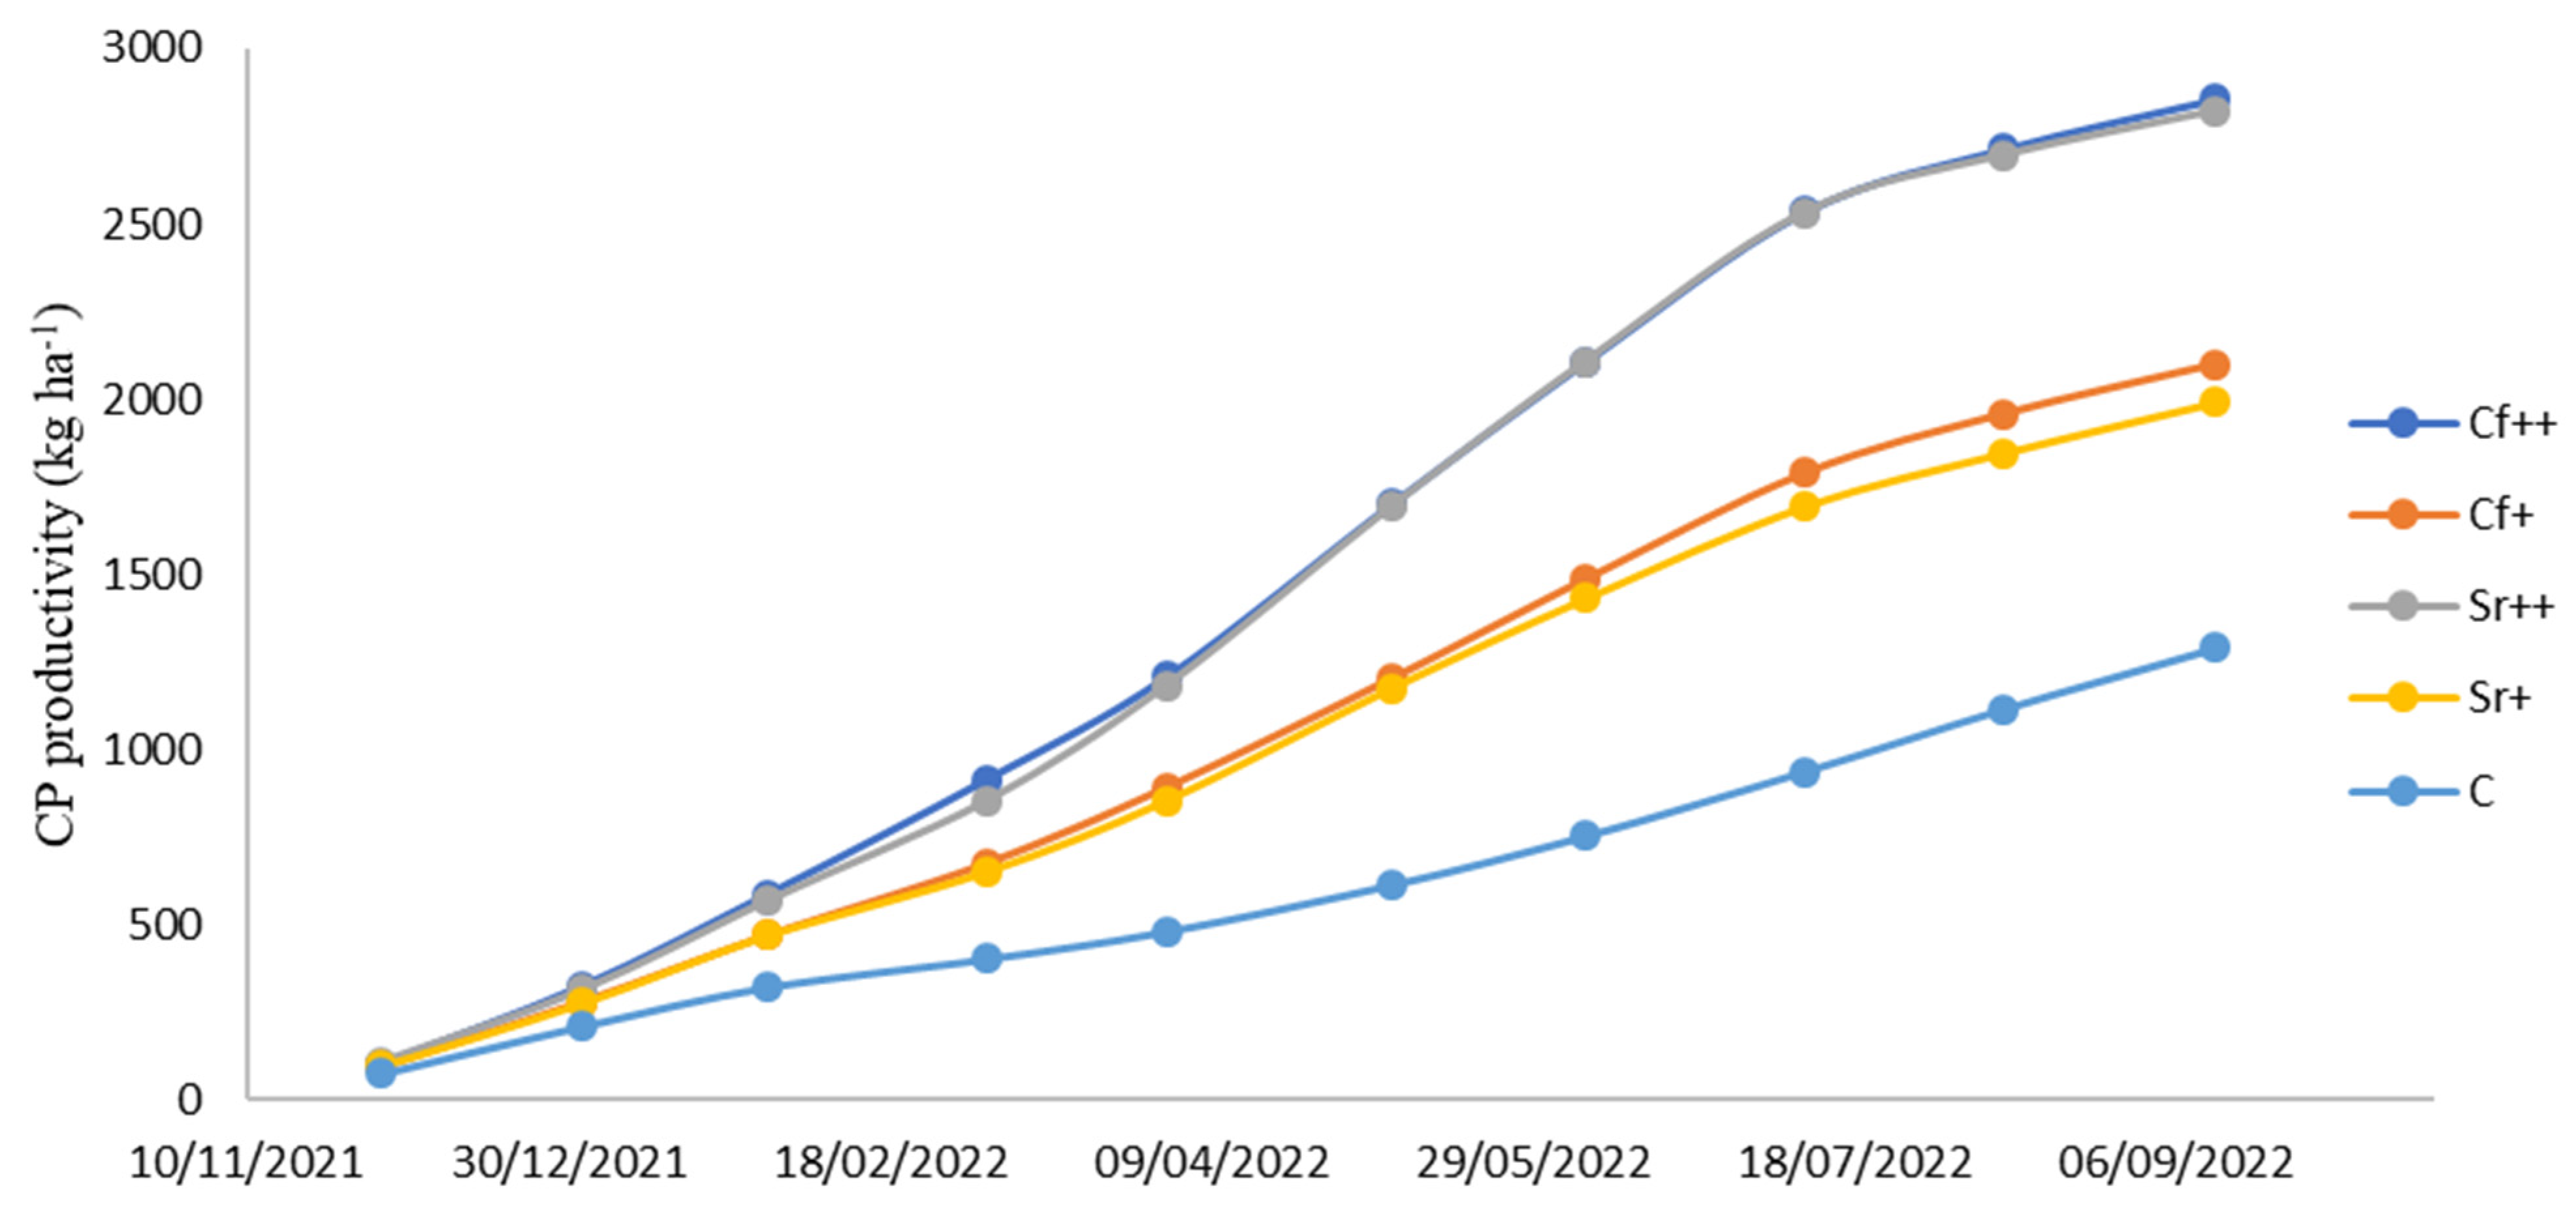
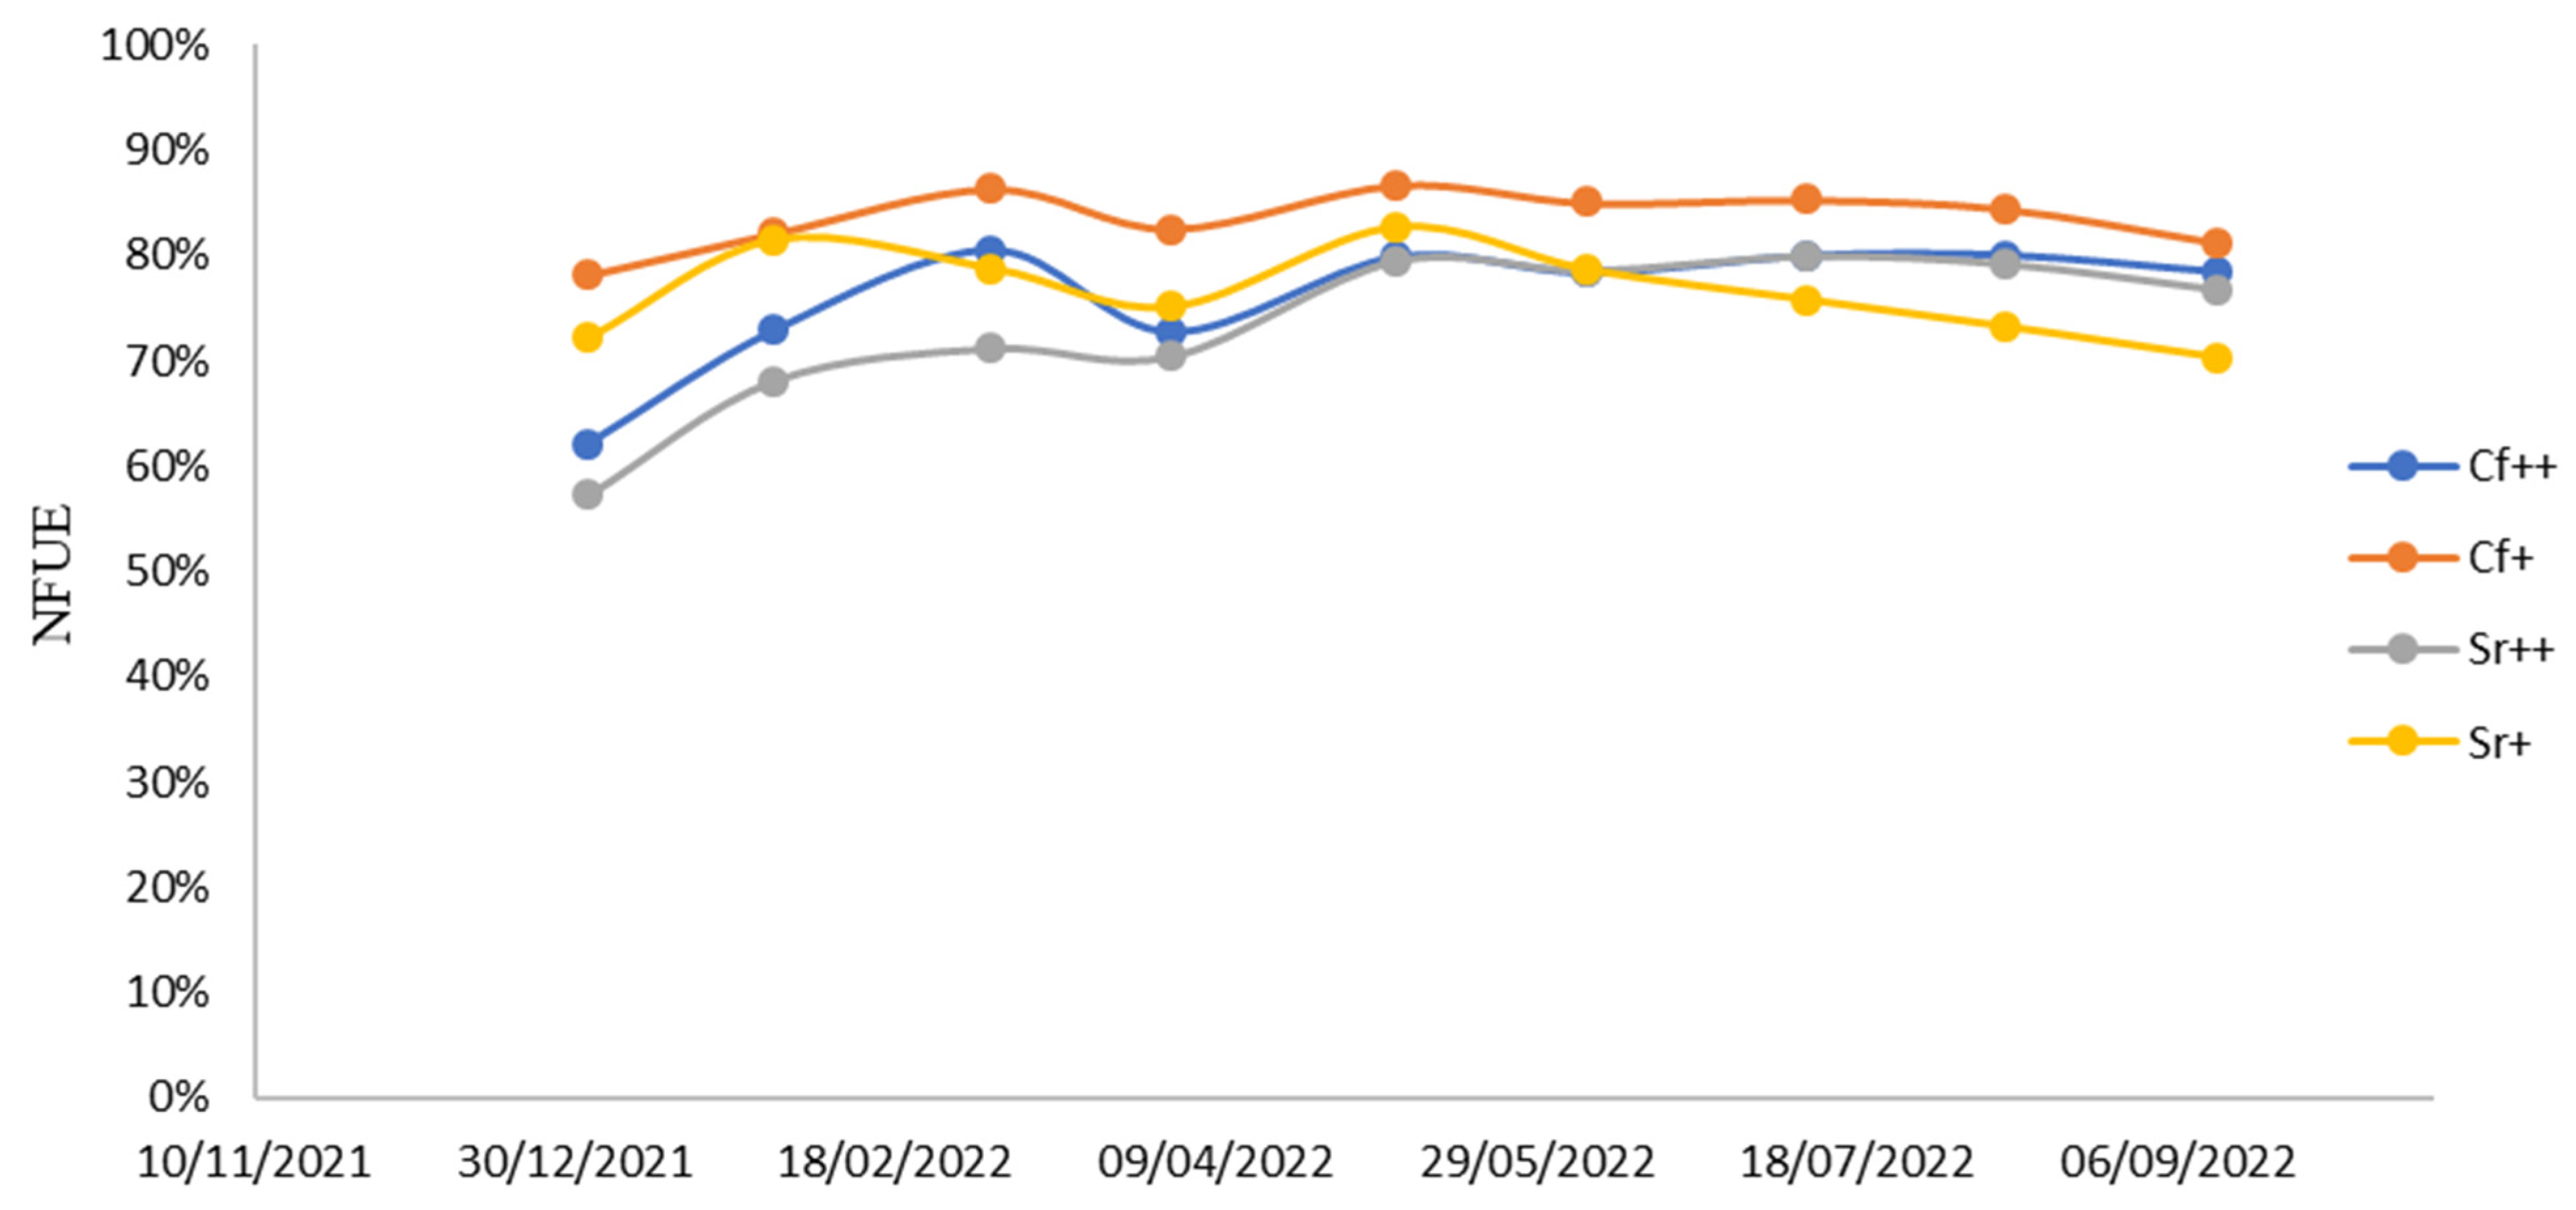
3.3. Crude Protein Productivity and Nitrogen Fertilization Use Efficiency

Crude protein production, measured cumulatively, showed significant variation among treatments (Figure 5). In the second cut, following the initial nitrogen fertilization, significant differences were observed between the highest nitrogen fertilization level and the control. However, the intermediate fertilization level did not differ significantly from any other treatments. From the third cut onward, the higher nitrogen fertilization levels were significantly different from the intermediate levels, and all fertilized treatments yielded significantly more CP than the control. The type of fertilizer did not significantly impact protein accumulation, as CP levels remained similar throughout the plant cycle regardless of the fertilizer used.
The amount of accumulated protein was 2856.20 kg ha−1 for Cf++, 2821.90 kg ha−1 for Sr++, 2099.70 kg ha−1 for Cf+, 1990.46 kg ha−1 for Sr+, and 1288.08 kg ha−1 for the C treatment.
In this study assessed NFUE across the four nitrogen fertilization treatments relative to the control, based on nitrogen accumulation in successive cuts. Nitrogen fertilizer use efficiency varied throughout the plant cycle, starting at 57.24% for the Sr++ treatment on January 1 and peaking at 86.75% for the Cf+ treatment on 7 May (Figure 6). Although there were no significant differences in NFUE between fertilization treatments at each cut, conventional fertilizer always showed higher NFUE compared to slow-release fertilizer and at both fertilization levels. For conventional fertilizer, the intermediate level consistently had higher NFUE across all cuts. However, with slow-release fertilizer, this trend was observed only until the 7 May cut; after 6 June, the trend reversed. In the later cuts, which were not preceded by nitrogen fertilization (10 August and 12 September), NFUE decreased in all fertilized treatments, while the C treatment showed less decline in yield (Figure 3) and CP production (Figure 5) than any of the fertilizer treatments.

3.4. Cost Analysis

Given the agricultural practices across the five treatments, the only differences were related to fertilization—specifically, the type and amount of fertilizer and its application method (Table 4). Since expense calculations were done per hectare and productivity was measured for the same area, we were able to determine costs per kg of DM and CP.
The cost per kg of DM produced varied significantly among treatments (p < 0.001). All treatments differed from each other, except for Cf+, which did not differ from C (Table 4). The treatments were ranked by cost from highest to lowest: Sr++ > Sr+ > Cf++ > Cf+ > C. Slow-release fertilizer treatments were the most expensive, while the least expensive were C and Cf+.
For CP costs, treatments with slow-release fertilizer were significantly more expensive than others (p < 0.001), but there were no significant differences among the fertilization levels of the slow-release treatments (Table 4). In contrast to DM costs, no significant differences were observed between the Cf++, Cf+, and C treatments, although the C tended to be the least expensive.

4. Discussion

Grazing is essential for sustaining dairy and beef production, making the pursuit of more efficient production methods crucial. Nitrogen is a key factor in this efficiency, often being the most limiting nutrient in various production systems. Nitrogen deficiencies are common, as most soils cannot supply sufficient nitrogen for optimal grass yields in pastures [34]. The results from this trial support this, showing significant productivity improvements with increased nitrogen availability through fertilization.
Throughout the trial, the pasture production curve fluctuated, with significant differences (p < 0.001) in productivity between fertilization levels from 1 January to 10 July. However, no significant differences were observed between types of fertilizers. Daily productivity at the highest fertilization rate matched other trials with favorable conditions, reaching up to 102 kg DM ha−1 day−1. Accumulated DM was 17,000 kg ha−1 for the highest fertilization level (slightly lower than yields reported by [9,14]) and 14,000 kg ha−1 for the intermediate level (similar to values found by [10,15]). These results were higher than those from trials with shorter growth periods due to dry or cold seasons [12,17,35,36]. It is important to note that DM yield in this experiment was based on 105 °C drying, whereas some studies use 60–65 °C drying [9,14].
We expected a peak in daily productivity by midspring, but observed two peaks (Figure 3), with the second peak occurring in early summer. The first peak coincided with the transition from vegetative to reproductive development, showing improved forage quality traits (Table 3). The second peak, however, occurred during a period of greater reproductive commitment, resulting in lower quality traits (Table 3).
Following the 10 July cut, water scarcity limited plant growth. There was no evidence of residual nitrogen from previous fertilizations, including the slow-release fertilizer, which was expected to have a prolonged release period. This contradicts other studies where such benefits were observed months after application [8].
Despite earlier expectations, no significant differences (p > 0.05) in productivity between fertilizer types were observed. This differs from other studies [9,12] that found slow-release fertilizers improved nitrogen use efficiency by reducing leaching and volatilization. In this study, frequent grazing simulated by high cutting frequency likely mitigated these differences, as plants focused on producing leaves and tillers, which require high nitrogen availability and reduce nitrogen leaching [36].
Chemical analysis of pasture samples provided insights into how nitrogen fertilization impacted the quality of Lolium multiflorum forage throughout its growth cycle. While CP, ADL, and DM content were as expected [15,17,19], NDF and ADF content were consistently higher than in previous studies [19,20,35,36] but similar to another study in the Azores with the same landrace [30].
Dry matter content varied significantly over the crop cycle, primarily influenced by nitrogen fertilization. The lowest DM contents were observed with higher nitrogen levels, consistent with [32] findings of a negative correlation between DM content and nitrogen levels. No significant differences (p > 0.05) between fertilizer types were noted, indicating similar impacts on DM content. The same was true for fiber content (ADF and NDF), where fertilizer type did not affect results. Increased nitrogen levels, especially in later cuts, raised NDF (7 May and 7 July) and ADF contents (7 May), likely due to greater cell wall development and reduced water availability, contradicting findings by [20,37,38].
Acid detergent lignin values varied throughout the plant cycle, being low in most cuts (similar to [20,30]) or higher than [34], with an increase in later cuts likely due to reproductive development. Nitrogen fertilization did not significantly impact ADL levels, suggesting nitrogen availability did not affect this parameter.
Crude protein content was positively correlated with nitrogen levels, with higher protein contents associated with higher nitrogen doses, and varied with plant cycle stages. This aligns with findings by [15,38].
Crude ash content showed a downward trend over the study period, with higher values in earlier cuts due to soil contamination during harvesting, especially in the earlier cuts, and a low cutting height (4–6 cm). Significant differences (p < 0.05) in CA content were observed with higher nitrogen doses, likely due to higher biomass and dilution of lower strata in the harvested material.
Understanding the significance of this landrace, known as “Azevém da Terra” in the Azores, requires recognizing its historical context. It originated in the 1960s–70s when a farmer from São Miguel selected Lolium multiflorum plants for high rust resistance and winter yield, leading to the cultivar now known as “Azevém de São Miguel” (information provided by Eng João Pereira, the owner of the cultivar and son of the farmer that started its selection). Since then, several farmers have multiplied this cultivar by seed without rigorous control, which has resulted in changes in phenotype and possible hybridization with Lolium perenne [39] and other genotypes of Lolim multiflorum. This is why it is considered to be a landrace that presently is known as “Azevém da Terra”, that maintains high winter yield and rust resistance, which is relevant in these mild and very humid conditions where most registered rust-resistant cultivars are severely affected by Puccinia coronata [40]. However, forage chemical composition has been less studied. The landrace exhibits similar CP and ADL levels to many registered cultivars but higher NDF and ADF contents, as highlighted in this trial and in [30].
Crude protein productivity varied among treatments, with accumulated values of approximately 2800 kg ha−1 for the highest fertilization level, 2000 kg ha−1 for the intermediate level, and 1290 kg ha−1 for the C treatment. These values surpass those found by [17,18,19,20,21,22,23]. No significant differences between fertilizer types were observed, contrary to studies indicating higher CP production with slow-release fertilizers [8,12].
Nitrogen fertilizer use efficiency varied between 70% and 81% by the end of the plant cycle, with no significant differences between fertilization levels or types. Nitrogen fertilizer use efficiency remained above 70% in all cuts except the first two, even when no fertilizations preceded the last two cuts (10 August and 12 September). This high NFUE was consistent with other studies [9,11,12] and was particularly notable during reproductive development (10 July and 10 August).
Several factors likely contributed to the high NFUE observed in all fertilized treatments: (a) the study simulated grazing by maintaining a consistent cut frequency, averaging 32 days; (b) the plants completed a full year of their life cycle; (c) crop productivity was high, particularly at the highest fertilization level, due to favorable environmental and soil conditions, minimal pest and disease issues, and effective agricultural practices.
Contrary to expectations, intermediate fertilization levels did not show significant improvements in NFUE compared to higher levels: with the conventional fertilizers, the intermediate fertilization levels always tended to have higher NFUE (as reported by [10,22]); slow-release fertilizers exhibited different trends; up to 6 June, the intermediate fertilization levels had higher NFUE, whereas in the later cutting dates, the trend was the opposite. Despite not being statistically significant, conventional fertilizers tended to show higher NFUE compared to slow-release fertilizers. This could be attributed to the delayed release effect of the membrane, which may have caused the fertilizer to not be released in alignment with the plant’s nutrient requirements. In a system with frequent cuts and fertilizations, the slow-release mechanism likely became more of a constraint than a beneficial feature.
These findings indicate that frequent cuts, similar to grazing in temperate climates, promote vegetative growth with minimal leaf loss, leading to high nitrogen accumulation and use efficiency. This aligns with [23], who found that winter growth in Lolium multiflorum was crucial for reducing nitrate leaching. Our interpretation is that fodder crop management, rather than fertilizer type or rate, is the key factor in determining NFUE and enhancing sustainability [7].
The production costs per kg of DM in this trial were relatively low (compared to [12], and earlier studies like [23]), with significant differences between treatments. Three major factors contributed to this: (i) by simulating grazing, low costs were associated with farm machinery due to reduced soil tillage and fertilization only; (ii) fertilizer was acquired at low cost before the Russian invasion of Ukraine, which had inflated costs in 2022 and dropped significantly in cost in 2023 [41]; (iii) there was high productivity at both fertilization levels.
Fertilizers were the most prominent cost, which was aggravated by the slow-release fertilizers. In studies where their benefits were acknowledged, the cost/benefit ratio was not in their favor [29]. Considering that in our study there were no benefits in using the slow-release fertilizer on yield and quality, its higher cost made it even more disadvantageous economically.
One final note is CP cost per kg. As expected, the conventional fertilizers had a significantly lower cost than the slow-release fertilizers, but there were no significant differences with the C treatment. These findings underscore the effectiveness of conventional fertilizers in rotational grazing systems with frequent fertilizations, particularly in terms of CP accumulation and production costs.

5. Conclusions

This experiment demonstrated that nitrogen fertilization significantly increases Lolium multiflorum DM and CP productivity. In most cuts, DM content decreased while CP content increased. In a few instances, there was a significant rise in NDF and ADF. These findings align with the consensus that nitrogen deficiency universally limits optimal yields in grass-dominant pastures.
No substantial differences in forage productivity and quality were observed between conventional and slow-release fertilizers. Similarly, nitrogen fertilizer use efficiency did not significantly differ between fertilization levels or fertilizer types, and it consistently remained high (>70%) after the third cut.
While DM and CP production costs were generally low, they were significantly higher with slow-release fertilizers compared to conventional ones. However, no significant differences in costs were observed between the different fertilization levels. The cost-effectiveness of slow-release fertilizers was inferior to that of conventional fertilizers, particularly within the unique agricultural context of the Azores. In this region, characterized by rotational grazing, andisols, and a temperate climate, selecting effective and economically viable fertilization strategies is crucial for the sustainable financial management of agricultural operations. In high-intensity production systems, our recommendation is to fertilize at 320 kg ha−1, whereas in lower-intensity production systems, we recommend fertilizing at 160 kg ha−1.

Supplementary Materials

The following supporting information can be downloaded at https://www.mdpi.com/article/10.3390/agronomy14102191/s1. Table S1: Climatic conditions measured by the weather station in Chã da Macela in 1 São Miguel from October 2021 through September 2022, Table S2: Soil analyses by plot (plot number described in S2), Figure S1: Experimental trial design.

Author Contributions

C.M.D.: Investigation, Methodology, Data curation, Visualization, Writing—original draft, M.M.: Conceptualization, Investigation, Methodology, Data curation, H.N.: Methodology, Writing—review and editing, A.B.: Conceptualization, Funding acquisition, Project administration, Validation, Writing—review and editing, J.M.: Conceptualization, Validation, Writing—review and editing, and P.M.: Conceptualization, Investigation, Methodology, Data curation, Validation, Writing—review and editing. All authors have read and agreed to the published version of the manuscript.

Funding

Researchers Cristiana Maduro Dias and Helder Nunes were funded by FCT—Fundação para a Ciência e a Tecnologia, I.P., under the framework of the Contract-Program for the Institute of Agricultural Research and Environmental Technologies (IITAA), through programmatic funding with reference UIDP/00153/2020. Additionally, this research received partial funding from the Biotechnology Centre of Azores, funded by FCT—Fundação para a Ciência e a Tecnologia, I.P., under projects UIDP/05292/2020 and UIDB/05292/2020.

Data Availability Statement

The data presented in this study are available on request from the corresponding author.

Acknowledgments

The authors wish to express their gratitude to the Serviços de Desenvolvimento Agrário de São Miguel for providing laboratory equipment to carry out part of this work.

Conflicts of Interest

The authors declare no conflicts of interest.

References

  1. Givens, D.I.; Deaville, E.R. The Current and Future Role of Near Infrared Reflectance Spectroscopy in Animal Nutrition: A Review. Aust. J. Agric. Res. 1999, 50, 1131–1145. [Google Scholar] [CrossRef]
  2. Rezaei, J.; Rouzbehan, Y.; Zahedifah, M.; Fazaeli, H. Effects of Dietary Substitution of Maize Silage by Amaranth Silage on Feed Intake, Digestibility, Microbial Nitrogen, Blood Parameters, Milk Production and Nitrogen Retention in Lactating Holstein Cows. Anim. Feed Sci. Technol. 2015, 202, 32–41. [Google Scholar] [CrossRef]
  3. Wilkins, R.J.; Givens, D.I.; Owen, E.; Axford, R.F.E.; Omed, H.M. Forages and Their Role in Animal Systems. In Forage Evaluation in Ruminant Nutrition; CAB International: Wallingford, UK, 2000; pp. 1–14. [Google Scholar]
  4. Dale, L.M.; Thewis, A.; Boudry, C.; Rotar, I.; Pacurar, S.F.; Abbas, Q.; Dardenne, P.; Baeten, V.; Pfister, J. Discrimination of Grassland Species and Their Classification in Botanical Families by Laboratory Scale NIR Hyperspectral Imaging: Preliminary Results. Talanta 2013, 116, 149–154. [Google Scholar] [CrossRef]
  5. Maduro Dias, C.S.A.; Nunes, H.P.B.; Borba, A.E.S. Influence of the Physical Properties of Samples in the Use of NIRS to Predict the Chemical Composition and Gas Production Kinetic Parameters of Corn and Grass Silages. Fermentation 2023, 9, 418. [Google Scholar] [CrossRef]
  6. Gerrish, J. Management-Intensive Grazing: The Grassroots of Grass Farming; Green Park Press: Ridgeland, MS, USA, 2004. [Google Scholar]
  7. Crestani, S.; Baade, E.A.S.; Ribeiro Filho, H.M.N. Características Morfogênicas, Estruturais e Padrões de Desfolhação em Pastos de Azevém Anual Durante o Período de Ocupação e em Duas Pressões de Pastejo. In Proceedings of the XVII Congresso de Iniciação Científica e X Encontro de Pós-Graduação; Universidade Federal de Pelotas: Pelotas, Brazil, 2008. [Google Scholar]
  8. Miltner, E.D.; Stahnke, G.K.; Johnston, W.J.; Golob, C.T. Late Fall and Winter Nitrogen Fertilization of Turfgrass in Two Pacific Northwest Climates. HortScience 2004, 39, 1745–1749. [Google Scholar] [CrossRef]
  9. Zaman, M.; Zaman, S.; Adhinarayanan, C.; Nguyen, M.L.; Nawaz, S.; Dawar, K.M. Effects of Urease and Nitrification Inhibitors on the Efficient Use of Urea for Pastoral Systems. Soil Sci. Plant Nutr. 2013, 59, 649–659. [Google Scholar] [CrossRef]
  10. Malinas, A.; Rotar, I.; Vidican, R.; Iuga, V.; Pacurar, F.; Malinas, C.; Moldovan, C. Designing a Sustainable Temporary Grassland System by Monitoring Nitrogen Use Efficiency. Agronomy 2020, 10, 149. [Google Scholar] [CrossRef]
  11. Abdullah, B.; Niazi, M.B.K.; Jahan, Z.; Khan, O.; Shahid, A.; Shah, G.A.; Azeem, B.; Iqbal, Z.; Mahmood, A. Role of Zinc-Coated Urea Fertilizers in Improving Nitrogen Use Efficiency, Soil Nutritional Status, and Nutrient Use Efficiency of Test Crops. Front. Environ. Sci. 2022, 10, 888865. [Google Scholar] [CrossRef]
  12. Han, K.J.; Pitman, W.D.; Alison, W.M.; Twidwell, E.K.; Guidry, K.M. Quantification of Slow-Release Fertilizer on Year-Round Forage Production. Agron. J. 2022, 114, 3306–3316. [Google Scholar] [CrossRef]
  13. Qian, P.; Schoenau, J. Effects of Conventional and Controlled Release Phosphorus Fertilizer on Crop Emergence and Growth Response under Controlled Environment Conditions. J. Plant Nutr. 2010, 33, 1253–1263. [Google Scholar] [CrossRef]
  14. Cotching, W.E.; Burkitt, L.L. Nitrogen Use Efficiency in Grazing Systems. In Proceedings of the 26th Annual Conference of the Grassland Society of Southern Australia, Hamilton, VIC, Australia, 26–28 July 2011. [Google Scholar]
  15. Sulewska, H.; Ratajczak, K.; Roszkiewicz, R. Assessment of the Impact of Magnesium and Nitrogen Fertilization on Two Species of Grasses Used as Horse Feed. Agronomy 2024, 14, 1086. [Google Scholar] [CrossRef]
  16. Cherney, J.H.; Cherney, D.J.R. Grass for Dairy Cattle; CABI Publishing: Wallingford, UK, 1998; Volume 33–93, pp. 223–241. [Google Scholar]
  17. Pavinato, P.S.; Restelatto, R.; Sartor, L.R.; Paris, W. Production and Nutritive Value of Ryegrass (cv. Barjumbo) Under Nitrogen Fertilization. Rev. Ciência Agronômica 2014, 45, 230–237. [Google Scholar] [CrossRef]
  18. Delevatti, L.M.; Cardoso, A.S.; Barbero, R.P.; Leite, R.G.; Romanzini, E.P.; Ruggieri, A.C.; Reis, R.A. Effect of nitrogen application rate on yield, forage quality, and animal performance in a tropical pasture. Sci. Rep. 2019, 20, 7596. [Google Scholar] [CrossRef]
  19. Cinar, S.; Ozkurt, M.; Cetin, R. Effects of Nitrogen Fertilization Rates on Forage Yield and Quality of Annual Ryegrass. Appl. Ecol. Environ. Res. 2020, 18, 417–432. [Google Scholar] [CrossRef]
  20. Godlewska, A.; Ciepiela, G.A. Italian Ryegrass (Lolium multiflorum Lam.) Fiber Fraction Content and Dry Matter Digestibility Following Biostimulant Application Against the Background of Varied Nitrogen Regime. Agronomy 2021, 11, 39. [Google Scholar] [CrossRef]
  21. Thomason, W.E.; Raun, W.R.; Johnson, G.V. Winter Wheat Fertilizer Nitrogen Use Efficiency in Grain and Forage Production Systems. J. Plant Nutr. 2000, 23, 1505–1516. [Google Scholar] [CrossRef]
  22. Silveira, D.C.; Machado, J.M.; Bonetti, L.P.; Carvalho, I.C.; Szareski, V.J.; Barbosa, M.H.; Rosa, T.C.; Schaeffer, A.H.; Minski da Motta, E.A.; Moura, N.B. Influence of nitrogen rates on the persistence of ryegrass (Lolium multiflorum L.) forage production. Aust. J. Crop Sci. 2020, 14, 1549–1554. [Google Scholar] [CrossRef]
  23. McCartney, D.H.; Lardner, H.A.; Stevenson, F.C. Economics of Backgrounding Calves on Italian Ryegrass (Lolium multiflorum) Pastures in the Aspen Parkland. Can. J. Anim. Sci. 2008, 88, 19–28. [Google Scholar] [CrossRef]
  24. INE—Instituto Nacional de Estatística. Estatísticas Agrícolas 2023. Available online: https://www.ine.pt/xportal/xmain?xpid=INE&xpgid=ine_publicacoes&PUBLICACOESpub_boui=439500127&PUBLICACOESmodo=2 (accessed on 1 August 2024).
  25. IAMA—Instituto de Alimentação e Mercados Agrícolas. Portal do Leite e Lacticínios dos Açores. Available online: https://portaldoleite.azores.gov.pt/Entregas_Leite_Produtores_Total.aspx (accessed on 1 August 2024).
  26. ARF—Agricultura e Recursos Florestais. Available online: https://rea.azores.gov.pt/reaa/36/agricultura-e-recursos-florestais/707/superficie-agricola-e-florestal (accessed on 20 August 2024).
  27. Madeira, M.; Pinheiro, J.; Madruga, J.; Monteiro, F. Soils of Volcanic Systems in Portugal. In Soils of Volcanic Regions in Europe; Arnalds, Ó., Óskarsson, H., Bartoli, F., Buurman, P., Stoops, G., García-Rodeja, E., Eds.; Springer: Berlin/Heidelberg, Germany, 2007. [Google Scholar] [CrossRef]
  28. IPMA—Instituto Português do Mar e da Atmosfera. Fichas Climatológicas 1981–2010. Available online: https://www.ipma.pt/pt/oclima/normais.clima/1981-2010/normalclimate8110.jsp (accessed on 8 July 2024).
  29. Paredes, P.; Fontes, J.C.; Azevedo, E.B.; Pereira, L.S. Daily Reference Crop Evapotranspiration with Reduced Data Sets in the Humid Environments of Azores Islands Using Estimates of Actual Vapor Pressure, Solar Radiation, and Wind Speed. Theor. Appl. Climatol. 2018, 134, 1115–1133. [Google Scholar] [CrossRef]
  30. Melo, C.D.; Maduro Dias, C.S.A.M.; Wallon, S.; Borba, A.E.S.; Madruga, J.; Borges, P.A.V.; Ferreira, M.T.; Elias, R.B. Influence of Climate Variability and Soil Fertility on the Forage Quality and Productivity in Azorean Pastures. Agriculture 2022, 12, 358. [Google Scholar] [CrossRef]
  31. ISO 11260:2018; Soil quality—Determination of Effective Cation Exchange Capacity and Base Saturation Level Using Barium Chloride Solution. International Organization for Standardization: Geneva, Switzerland, 2018.
  32. AOAC—Association of Official Analytical Chemists. Official Methods of Analysis, 12th ed.; AOAC: Washington, DC, USA, 1999. [Google Scholar]
  33. Goering, H.K.; Van Soest, P.J. Forage Fiber Analysis (Apparatus, Reagents, Procedures, and Some Applications); Agriculture Handbook 379; ARS, USDA: Washington, DC, USA, 1970. [Google Scholar]
  34. Walton, P.D. The Production and Management of Cultivated Forages; Reston Publishing Company Inc.: Reston, VA, USA, 1983; p. 336. [Google Scholar]
  35. Hopkins, C.; Marais, J.P.; Goodenough, D.C.W. A Comparison, Under Controlled Environmental Conditions, of a Lolium multiflorum Selection Bred for High Dry-Matter Content and Non-Structural Carbohydrate Concentration with a Commercial Cultivar. Grass Forage Sci. 2002, 57, 367–372. [Google Scholar] [CrossRef]
  36. Malcolm, B.J.; Cameron, K.C.; Di, H.J.; Edwards, G.R.; Moir, J.L. The Effect of Four Different Pasture Species Compositions on Nitrate Leaching Losses Under High N Loading. Soil Use Manag. 2015, 30, 58–68. [Google Scholar] [CrossRef]
  37. Dupas, E.; Buzetti, S.; Rabêlo, F.H.; Sarto, A.L.; Cheng, N.C.; Filho, M.C.; Galindo, F.S.; Dinalli, R.P.; Gazola, R. Nitrogen recovery, use efficiency, dry matter yield, and chemical composition of palisade grass fertilized with nitrogen sources in the Cerrado biome. Aust. J. Crop Sci. 2016, 10, 1330–1338. [Google Scholar] [CrossRef]
  38. Salama, H.S.A.; Badry, H.H. Influência de Doses Variáveis de Mistura e Doses de Adubação Nitrogenada na Qualidade da Forragem de Trevo Egípcio (Trifolium alexandrinum L.) e Azevém Anual (Lolium multiflorum Lam.). J. Afr. De Pesqui. Agrícola 2015, 10, 4858–4864. [Google Scholar]
  39. Viana, J. Pastagens e Forragens—Manual do Formador; Secretaria Regional de Agricultura e Florestas: Angra do Heroísmo, Açores, Portugal, 2020; 240p. [Google Scholar]
  40. Reis, R. Avaliação da Incidência de Puccinia spp. nas Pastagens de Lolium multiflorum Lam. e Lolium perenne L. Bachelor’s Thesis, Universidade dos Açores, Ponta Delgada, Portugal, 2016. [Google Scholar]
  41. Kee, J.; Cardell, L.; Zereyesus, Y.A. Global Fertilizer Market Challenged by Russia’s Invasion of Ukraine. Available online: https://www.ers.usda.gov/amber-waves/2023/september/global-fertilizer-market-challenged-by-russia-s-invasion-of-ukraine/ (accessed on 15 August 2024).
Figure 1. Trial location, São Miguel Island, Azores Archipelago.
Agronomy 14 02191 g001
Figure 2. (A) General view of the trial on 7 May 2022, showing the areas where yield was calculated. (B) After harvesting and weighing, the remaining plot area was mowed to ensure a uniform cutting height across the entire trial area (photo taken on 1 December 2021). (C) Detailed view of part of the trial area on 12 September 2022, illustrating the altered species composition.
Agronomy 14 02191 g002
Figure 3. Productivity of DM in kg ha−1 day−1 per treatment and cut with their respective mean comparison indices. Different letters indicate significant differences between treatments
Agronomy 14 02191 g003
Figure 4. Productivity of accumulated DM in kg ha−1 per treatment with their respective mean comparison indices. Different letters indicate significant differences between treatments
Agronomy 14 02191 g004
Figure 5. Productivity of accumulated CP in kg ha−1 per treatment.
Agronomy 14 02191 g005
Figure 6. Nitrogen fertilizer use efficiency for each fertilized treatment.
Agronomy 14 02191 g006
Table 1. Harvest calendar with the respective growing days per cutting and nitrogen units applied (kg ha−1) per fertilization and total per modality.
HarvestFertilization
CutsDateGrowing
Days
Cf+/Sr+
(kg N ha−1)
Cf++/Sr++ (kg N ha−1)
1st1 December 20215414.5329.05
2nd1 January 20223114.5329.05
3rd30 January 20222921.7943.58
4th5 March 20223429.0558.11
5th2 April 20222829.0558.11
6th7 May 20223529.0558.11
7th6 June 20223021.7943.58
8th10 July 202234
9th10 August 202231
10th12 September 202233
Total 159.79319.59
Table 2. Chemical composition of the pastures in first cut (without prior fertilization).
DateTreatmentDM
(%)
CP
(%DM)
NDF
(%DM)
ADF
(%DM)
ADL
(%DM)
CA
(%DM)
1 December 2021Cf++11.65 ± 0.0320.63 ± 1.1466.99 ± 4.9636.19 ± 2.005.23 ± 1.5019.62 ± 2.68
Cf+11.93 ± 0.0319.62 ± 1.9270.89 ± 4.0137.32 ± 4.985.00 ± 1.1420.97 ± 2.67
Sr++12.33 ± 0.0320.33 ± 1.7568.36 ± 5.0336.88 ± 3.384.42 ± 1.5020.35 ± 2.94
Sr+11.96 ± 0.0219.79 ± 1.4667.00 ± 4.0937.79 ± 1.184.43 ± 0.5822.39 ± 1.89
C11.58 ± 0.0119.50 ± 1.1568.62 ± 7.2736.56 ± 0.955.07 ± 0.9820.61 ± 2.41
p0.9300.5900.7300.8700.5000.590
1 January 2022Cf++12.08 ± 0.04 b22.30 ± 2.5871.47 ± 5.6135.25 ± 1.174.00 ± 0.5815.17 ± 2.31
Cf+12.24 ± 0.07 b21.82 ± 1.5867.23 ± 3.5133.71 ± 2.663.59 ± 0.8415.25 ± 0.33
Sr++11.81 ± 0.03 b22.85 ± 0.8968.98 ± 1.7734.02 ± 1.584.07 ± 0.5715.28 ± 1.33
Sr+12.28 ± 0.03 b22.22 ± 1.3567.40 ± 6.3732.87 ± 1.984.05 ± 0.7715.36 ± 1.25
C13.65 ± 0.07 a21.46 ± 1.1268.07 ± 4.2733.21 ± 2.903.72 ± 0.9214.66 ± 0.68
p0.0040.3830.2160.2060.7140.835
30 January 2022Cf++9.37 ± 0.4922.13 ± 1.04 a66.01 ± 2.9535.72 ± 5.233.44 ± 0.4714.79 ± 0.48
Cf+9.01 ± 1.3020.52 ± 1.33 ab64.75 ± 3.7137.31 ± 1.363.44 ± 0.3414.84 ± 0.61
Sr++9.04 ± 1.2822.32 ± 1.79 a65.63 ± 4.2435.09 ± 1.373.37 ± 0.5613.88 ± 0.81
Sr+9.80 ± 0.8820.60 ± 1.46 ab64.77 ± 2.3534.12 ± 1.353.6 ± 0.1714.22 ± 0.69
C10.72 ± 0.5018.94 ± 1.09 b66.53 ± 3.0232.88 ± 1.673.34 ± 0.3514.73 ± 0.33
p0.9700.0170.900.2320.8440.168
5 March 2022Cf++10.40 ± 1.19 b19.00 ± 1.47 a74.04 ± 5.0837.38 ± 2.504.24 ± 0.5113.53 ± 0.71
Cf+10.70 ± 0.65 a16.86 ± 2.14 ab72.05 ± 1.6335.48 ± 1.253.90 ± 0.6413.95 ± 0.89
Sr++9.76 ± 0.46 a19.15 ± 1.33 a72.93 ± 4.6935.83 ± 2.454.08 ± 0.6713.59 ± 1.49
Sr+10.69 ± 0.51 a16.39 ± 1.16 b76.77 ± 1.8334.67 ± 2.424.38 ± 0.4413.56 ± 1.27
C12.49 ± 0.87 a15.32 ± 0.33 b74.16 ± 3.6633.90 ± 2.564.02 ± 0.3814.50 ± 1.27
p0.0030.0020.1640.2310.5610.380
DM: dry matter, CP: crude protein, NDF: neutral detergent fiber, ADF: acid detergent fiber, ADL: acid detergent lignin, CA: crude ash. Values are mean ± standard deviation. Different letters next to the respective values indicate significant differences in the nutritive parameters among sampling dates. p > 0.05, no significant differences were found.
Table 3. Forage chemical composition of the fifth through the seventh cut.
DateTreatmentDM
(%)
CP
(%DM)
NDF
(%DM)
ADF
(%DM)
ADL
(%DM)
CA
(%DM)
2 April 2022Cf++12.56 ± 0.45 c17.18 ± 1.50 ab69.59 ± 5.8732.87 ± 5.433.70 ± 1.0312.07 ± 0.82
Cf+15.31 ± 1.29 b14.86 ± 0.62 bc68.69 ± 5.8432.20 ± 2.733.22 ± 0.9712.08 ± 0.48
Sr++12.40 ± 1.00 c18.41 ± 1.46 a69.91 ± 3.9535.16 ± 1.683.53 ± 0.5611.87 ± 0.98
Sr+15.42 ± 0.64 b14.64 ± 2.58 bc68.67 ± 6.7332.91 ± 2.353.07 ± 0.2811.91 ± 0.24
C19.90 ± 0.94 a13.14 ± 0.78 c65.16 ± 4.1631.43 ± 2.073.03 ± 0.5011.79 ± 0.49
p<0.0010.0010.7050.3540.4790.943
7 May 2022Cf++13.29 ± 0.02 c14.33 ± 1.29 a76.44 ± 3.42 a39.31 ± 3.77 a4.28 ± 0.4310.13 ± 0.45 b
Cf+14.72 ± 0.02 bc11.27 ± 1.21 b72.91 ± 2.88 ab34.97 ± 1.51 bc4.53 ± 0.5610.44 ± 0.59 b
Sr++13.61 ± 0.01 c14.22 ± 1.64 a75.45 ± 2.34 a38.44 ± 2.10 ab4.43 ± 0.3210.33 ± 0.48 b
Sr+15.60 ± 0.01 b11.15 ± 0.79 b73.69 ± 1.26 ab35.76 ± 2.70 bc3.93 ± 0.459.97 ± 0.45 b
C17.93 ± 0.02 a11.25 ± 0.86 b70.51 ± 3.87 b33.18 ± 0.86 c3.99 ± 0.7212.05 ± 0.23 a
p<0.001<0.0010.0400.0020.384<0.001
6 June 2022Cf++11.03 ± 0.08 b16.78 ± 1.26 a77.37 ± 1.2239.03 ± 1.784.91 ± 0.6111.18 ± 0.89
Cf+11.77 ± 0.06 ab14.17 ± 1.39 b75.04 ± 4.1537.65 ± 1.554.71 ± 0.6511.09 ± 0.46
Sr++11.42 ± 0.03 ab16.01 ± 2.02 a74.57 ± 2.8239.44 ± 0.334.36 ± 0.3910.67 ± 0.64
Sr+12.04 ± 0.04 ab13.56 ± 1.05 b71.70 ± 4.8437.20 ± 2.794.67 ± 0.5510.76 ± 0.36
C12.81 ± 0.01 a13.57 ± 1.71 b72.75 ± 3.0033.94 ± 6.284.74 ± 1.2211.32 ± 0.46
p0.050<0.0010.0970.0810.8620.507
10 July 2022Cf++21.02 ± 0.0113.07 ± 0.87 a71.46 ± 1.34 ab35.69 ± 2.366.93 ± 0.228.68 ± 0.43
Cf+21.81 ± 0.0111.26 ± 0.63 ab71.62 ± 4.03 ab36.80 ± 3.636.65 ± 1.249.04 ± 0.40
Sr++20.54 ± 0.0113.34 ± 2.39 a72.98 ± 2.03 a38.12 ± 0.735.94 ± 0.808.74 ± 0.57
Sr+21.43 ± 0.0110.21 ± 0.50 b70.53 ± 2.64 ab36.98 ± 2.055.93 ± 0.908.99 ± 0.26
C21.97 ± 0.0110.39 ± 0.58 b68.48 ± 1.54 b37.96 ± 0.775.41 ± 0.539.48 ± 0.38
p0.2580.0030.0200.4100.1000.072
10 August 2022Cf++23.72 ± 0.0215.80 ± 1.1574.61 ± 2.5940.32 ± 1.2810.43 ± 1.129.80 ± 0.70
Cf+23.61 ± 0.0214.81 ± 0.8774.95 ± 2.2240.00 ± 1.9910.60 ± 0.869.99 ± 0.46
Sr++25.52 ± 0.0114.01 ± 0.4772.24 ± 1.6338.71 ± 1.6010.35 ± 0.999.14 ± 0.50
Sr+24.28 ± 0.0113.78 ± 0.0.6674.93 ± 1.9640.76 ± 1.0810.83 ± 0.749.97 ± 0.30
C22.16 ± 0.0214.39 ± 1.1574.59 ± 2.6539.74 ± 0.8810.72 ± 0.9010.40 ± 0.36
p0.1000.0560.3780.1560.9560.097
12 September 2022Cf++19.13 ± 2.0020.27 ± 1.4368.36 ± 1.9938.19 ± 3.267.93 ± 0.3311.89 ± 0.55
Cf+18.78 ± 1.3718.54 ± 1.2366.38 ± 1.1838.54 ± 1.118.13 ± 0.4511.49 ± 0.62
Sr++21.27 ± 2.6519.72 ± 1.8367.74 ± 4.5136.69 ± 1.468.09 ± 0.2611.13 ± 1.35
Sr+21.08 ± 2.0618.74 ± 1.2568.53 ± 2.8738.52 ± 1.367.96 ± 0.4211.45 ± 1.02
C19.80 ± 1.0418.29 ± 1.6067.93 ± 3.4738.28 ± 1.958.09 ± 0.5611.24 ± 0.89
p0.0520.2730.6930.6720.9240.503
DM: dry matter, CP: crude protein, NDF: neutral detergent fiber, ADF: acid detergent fiber, ADL: acid detergent lignin, CA: crude ash. Values are mean ± standard deviation. Different letters next to the respective values indicate significant differences in the nutritive parameters among sampling dates. p > 0.05, no significant differences were found.
Table 4. Production costs per treatment per hectare.
TaskCf++Cf+Sr++Sr+C
Fertilizer 355.08 EUR177.56 EUR786.71 EUR393.36 EUR0.00 EUR
Seeds 114.78 EUR114.78 EUR114.78 EUR114.78 EUR114.78 EUR
Herbicide (4 L ha−1) 23.90 EUR23.90 EUR23.90 EUR23.90 EUR23.90 EUR
Disc harrowing (3×)76.01 EUR76.01 EUR76.01 EUR76.01 EUR76.01 EUR
Fertilizer distribution 53.59 EUR53.59 EUR53.59 EUR53.59 EUR00.00 EUR
Seed distribution 7.66 EUR7.66 EUR7.66 EUR7.66 EUR7.66 EUR
Spraying 22.19 EUR22.19 EUR22.19 EUR22.19 EUR22.19 EUR
Total 653.21 EUR475.68 EUR1084.84 EUR691.48 EUR244.54 EUR
Cost (EUR Kg DM−1) 0.038 c EUR0.033 ac EUR0.064 a EUR0.050 b EUR0.028 d EUR
Cost (EUR Kg CP−1) 0.229 b EUR0.227 b EUR0.384 a EUR0.347 a EUR0.190 b EUR
Different letters next to the respective values indicate significant differences in production costs among sampling dates.
Disclaimer/Publisher’s Note: The statements, opinions and data contained in all publications are solely those of the individual author(s) and contributor(s) and not of MDPI and/or the editor(s). MDPI and/or the editor(s) disclaim responsibility for any injury to people or property resulting from any ideas, methods, instructions or products referred to in the content.

