Article

Effect of Nitrogen Management Practices on Photosynthetic Characteristics and Grain Yield of Wheat in High-Fertility Soil

1
National Key Laboratory of Wheat Improvement, Agricultural College, Shandong Agricultural University, Tai’an 271018, China
2
Agricultural Technology Extension Center, Yanzhou District, Jining 272116, China
*
Author to whom correspondence should be addressed.
Agronomy 2024, 14(10), 2197; https://doi.org/10.3390/agronomy14102197
Submission received: 3 August 2024 / Revised: 21 September 2024 / Accepted: 22 September 2024 / Published: 24 September 2024
(This article belongs to the Special Issue Water and Fertilizer Regulation Theory and Technology in Crops)

Abstract

:
The uneven soil fertility made it difficult to implement the recommended nitrogen (N) management practices in the North China Plain (NCP). In order to clarify the effect of N managements in high-fertility soil with a perennial wheat yield of 10,500 kg ha−1 on photosynthetic characteristics, grain yield, N agronomic efficiency (NAE), and water use efficiency (WUE), a trial was conducted from 2022 to 2024. Main plots were N rates of 0 (N1), 150 (N2), 210 (N3), and 270 (N4) kg N ha−1; The sub-plots adopted fertigation (F) and traditional fertilization method (T). The results showed that, compared with T, F increased the intercept rate of photosynthetic effective radiation of canopy, net photosynthetic rate, stomatal conductance, and transpiration rate of flag leaves, as well as the activity of phosphate sucrose synthase and sucrose content. It enhanced dry matter transport and contribution to grain. Under N2, the time required to reach the maximum grain filling rate, duration of grain filling and active grain-filling period of F were improved. Grain yield of N2 was increased by 27.81% and 6.75% compared to N1 and N3, respectively. NAE was improved by 48.63% and 51.47%, and WUE was improved by 20.71% and 9.85%. Therefore, the best effect was achieved by using fertigation and the N rate of 210 kg ha−1 in high-fertility soil.

1. Introduction

With the continuous increase in global population and the improvement of people’s living standards, there is an urgent need for a significant increase in wheat production. The wheat production of China increased at a faster rate than most countries, especially in terms of grain yield per unit area. The main reason for this were not only the cultivation of new varieties, but also the improvement of agricultural management technology [1]. Among the main factors leading to grain yield increase, the contribution rate of fertilizer practice was 57.4%, and irrigation management accounted for 7.9% [2]. In pursuit of high grain yield, excessive use of N fertilizers and irrigation usually resulted in low N use efficiency, serious water resource waste, and adverse effects on food security and sustainable agricultural development [3,4].
Reducing the N application rate is the simplest and most direct method to improve N use efficiency [5]. However, N is a crucial element driving wheat growth, and its reduced application rate directly affects leaf area, photosynthetic capacity, and radiation interception, thereby affecting grain yield [6,7]. Among them, photosynthesis is a key process for biomass accumulation in wheat, closely related to sustainable development and food security, as it affects nutrients, water, and land use efficiency [8,9]. After anthesis, the accumulation of organic matter in grain mainly depended on photosynthesis, and a higher photosynthetic rate was an important guarantee for higher yield. It was reported that about one-third of the dry matter in grain came from the remobilization of substances stored in nutrient organs at pre-anthesis, while two-thirds came from the accumulation of photosynthetic products in flag leaves after anthesis [10]. The application of N enhanced the light energy harvesting capacity of wheat leaves, improved the conversion efficiency of light energy and the proportion of open parts of photosystem II (PSII), reduced non radiative heat dissipation, and enabled plant to more effectively use the captured light energy for photosynthesis, thereby increasing the net photosynthetic rate [11].
Pre-anthesis photosynthesis of leaves and the remobilization of pre-anthesis accumulated substances in plant affected the grain filling process of wheat, thereby affecting final grain weight [12,13]. Therefore, it was crucial to ensure sufficient photosynthesis and dry matter transport at the grain filling stage. An appropriate N application rate could optimize the grain filling rate and duration, while excessive N application reduced the grain filling rate, decreased the amount of assimilates transported from nutrient organs to grains, and led to a decrease in grain weight [14]. Moreover, a larger canopy consumed more nutrients, which was not conducive to the accumulation of dry matter at filling stage [15]. In addition, N application methods also affected grain filling and dry matter accumulation processes. Studies in some regions showed that water and fertilizer integration could match water and N supply with plant demand, improve grain filling duration and biomass, and ultimately increase grain yield [16,17].
However, differences in regional environment, soil fertility, and variety resulted in inconsistent suitable N application rates for winter wheat. In the NCP, the amount of N fertilizer applied in winter wheat season was 60–385 kg N ha−1 [18]. However, most of the fields in the NCP were managed by smallholder farmers, resulting in uneven soil fertility and significant differences in yield. It seemed difficult to promote and apply a single recommended amount of N fertilizer as it was difficult to match the water and fertilizer structure in the soil. Under the conditions of fully tapping into the production potential of wheat varieties, grain yields in the region exceeded 12,000 kg ha−1 [19]. However, previous studies on the photosynthetic physiological characteristics and grain yield formation of wheat were mostly conducted on low and medium soil fertility plots with yield levels of 7500–9000 kg ha−1 [20,21], while there was relatively little research on wheat fields with grain yields above 10,000 kg ha−1. And it was still unclear the appropriate N application rate in high soil fertility plot, and whether fertigation could further increase the grain yield. Therefore, studying suitable N management practices of wheat in high soil fertility and high potential farmland was crucial for narrowing the yield gap between different plots.
Therefore, the study explored and compared the physiological mechanisms of different N management practices affecting wheat grain yield in in high-fertility soil with a perennial grain yield exceeding 10,500 kg ha−1. In this study, we hypothesized that in high-fertility soil, fertigation would further improve grain yield, water, and N use efficiency, affecting photosynthetic characteristics and dry matter accumulation and remobilization processes by properly decreasing the amount of N applied. The aim was to (a) explore the effects of traditional fertilization methods and fertigation on the biomass and photosynthetic mechanisms of grain yield formation; (b) determine the appropriate N application rate under the two N application methods; (c) clarify the suitable N management practices for high soil fertility plot.

2. Materials and Methods

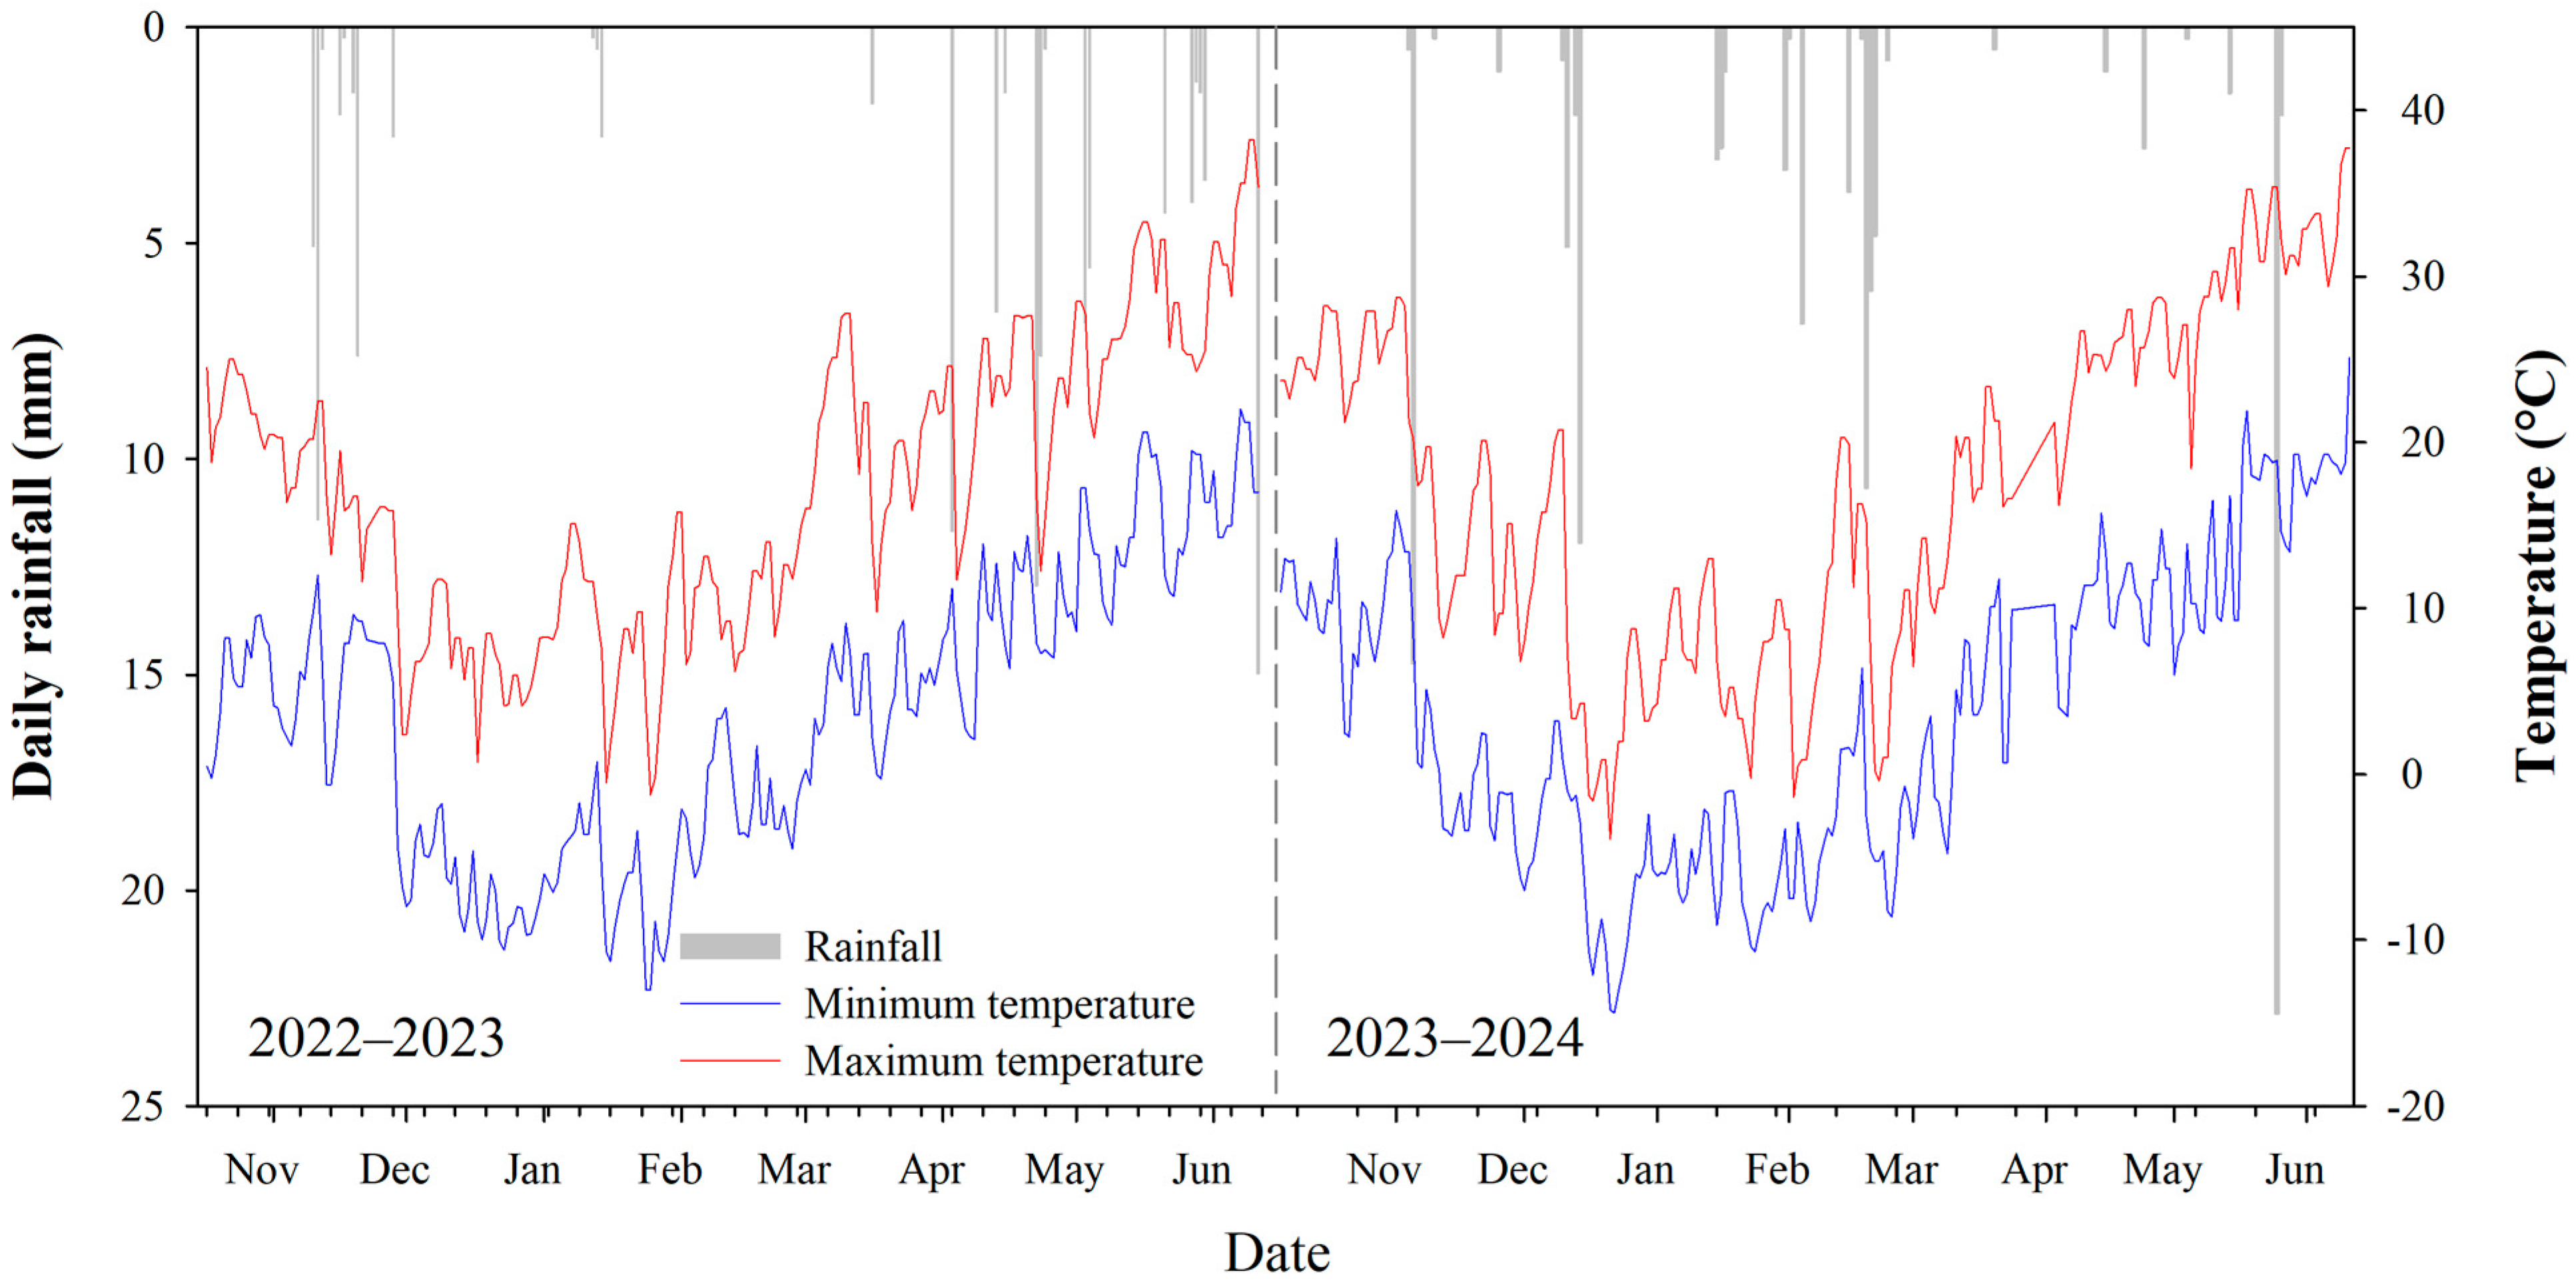
2.1. Experiment Site and Design

The field experiment was carried out at Xiaomeng research field (35°40′ N, 116°41′ E), Shandong province, China and National Key Laboratory of Wheat Improvement from 2022 to 2024. The study area is characterized by the representative environment of the NCP, where experiences a temperate, semi-humid, and continental monsoon climate. It has an annual average temperature of 12.9–13.6 °C and average annual precipitation of 500–800 mm. The soil properties (0–20 cm) prior to the start of the experiment were 18.65 g kg−1 soil organic matter (SOM), 1.31 g kg−1 of total nitrogen (TN), 110.00 mg kg−1 hydrolysable N, 48.57 mg kg−1 olsen phosphorus (P), and 207.30 mg kg−1 available potassium (K). The meteorological conditions in the region are shown in Figure 1.
The experiment was a split-plot design with four N input levels as main plot factor and two N management practices as sub-plot factor (Figure 2). The main plot treatments had four application rates of N (0, 150, 210, 270 kg N ha−1), named N0, N1, N2, and N3, respectively. The sub-plot treatments comprised two N management practices, including traditional fertilization method of farmers (T) and fertigation (F). Manual surface broadcast (the common farmer practice) was adopted as the traditional fertilization method. The other was to inject the dissolved urea solution into micro-sprinkling hose equipment. Before planting, phosphorus pentoxide and potassium oxide were applied at 150 kg ha−1 each, along with 50% of the pure N, topdressing other N fertilizers at jointing stage. Urea, calcium superphosphate, and potassium sulfate were selected for N, phosphorus, and potassium fertilizers, respectively. Seeds of wheat cultivar Yannong 1212 were planted. The irrigation measures were carried out during the jointing and anthesis stages, and the irrigation amount for each treatment was 60 mm. Among them, furrow irrigation was adopted by traditional fertilization treatment, and the specific N application and irrigation practices are shown in Figure 2. The irrigation, fertilizer, cultivation, and tillage were kept essentially the same operations during all experimental years.

2.2. Samplings and Measurements

2.2.1. Photosynthetically Active Radiation

SunScan canopy analysis system (Delta-T Devices, Cambridge, UK) was used for measurements in three random plots of the experimental site, with three replicates per treatment. Measurements were conducted from 10:00–11:00 a.m. at 0, 7, 14, 21, and 28 d after anthesis. The photosynthetically active radiation (PAR) at the top and bottom of the wheat canopy was recorded. The intercepted photosynthetically active radiation (CaR, %) was estimated as follows [22]:
CaR = [ 1 P A R 0 PARt ]   ×   100
where PAR0 (μmol m−1 s−1) was the incident PAR at the surface of the ground, and PARt (μmol m−1 s−1) was the incident PAR at 50 cm above the wheat canopy.

2.2.2. Leaf Gas Exchange Parameters

The net photosynthetic rate (Pn), stomatal conductance (Gs), transpiration rate (Tr) and intercellular CO2 concentration (Ci) were measured by using the LI-6400XT (LI-COR, Lincoln, NE, USA) portable gas exchange measuring system. The representative flag leaves in each plot were measured between 9:00 a.m. to 11:00 a.m. at 7-day intervals from anthesis to 35 days after anthesis under the condition of 25–26 °C, atmospheric CO2 concentration, 500 μmol s−1 flow rate and 1500 mol m−2 s−1 photosynthetic active radiation in the leaf chamber [23].

2.2.3. Leaf Sucrose Content and Sucrose Phosphate Synthase Activity

The wheat flag leaves were taken from each plot at 7-day intervals from anthesis to 35 days after anthesis. Fresh samples were immersed in liquid nitrogen and stored at −80 °C. The sucrose content was measured using the resorcinol colorimetric method, and the activity of sucrose phosphate synthase was measured using the UDPG colorimetric method [24].

2.2.4. Dry Matter Accumulation and Remobilization

At anthesis and maturity stage, 30 representative plants were collected. The samples were separated into leaves, stems and sheaths, spike axis and kernel husks, and grains (only at maturity). These were dried separately to constant weight at 70 °C. Parameters related to dry matter remobilization were calculated as follows [25]:
RDM = ADM MDM
CRB = RDM MGDM × 100
DMA = MGDM RDM
CRP = DMA MGDM × 100
where RDM is the remobilization of pre-anthesis stored assimilates (kg ha−1), ADM is the dry matter at anthesis (kg ha−1), MDM is the dry matter at maturity (excluding grains, kg ha−1), CRB is the contribution of RDM to grain (%), MGDM is the grain weight at maturity (kg ha−1), DMA is the dry matter assimilation after anthesis (kg ha−1), and CRP is the contribution of DAP to grain (%).

2.2.5. Grain Filling Characteristics

At 7-day intervals from anthesis to 35 days after anthesis, 30 spikes were collected from each plot. The samples were dried at 70 °C to constant weight, and then threshed and weighed. The grain filling process was assessed using the logistic growth equation. The time required to reach the maximum grain filling rate (Tmax), maximum filling rate (Vmax), duration of grain filling (T), and the active grain-filling period (D) were used to analyze grain filling traits.

2.2.6. Grain Yield, N Agronomic Efficiency and Water Use Efficiency

All plants within a 3 m2 area from each plot were harvested at maturity. The harvested grain was dried under the sun, and then yield was expressed at 12.5% grain moisture [26].
NAE = GF G 0 NR
WUE = Y E t α
where Y is the grain yield (kg ha−1), NAE is the N agronomic efficiency (kg kg−1), GF is the grain yield in the fertilized plots (kg ha−1), G0 is the grain yield in the no N plot (kg ha−1), NR is the N rate, WUE is the water use efficiency (kg ha−1 mm−1) and ETα is the water consumption during the wheat season, including soil water storage consumption, irrigation amount, and precipitation (mm).

2.2.7. Data Statistics and Analysis

Excel was used for data aggregation and standard deviation calculation. All data were first subjected to normality and homogeneity of variance tests, and then analyzed by SPSS 27.0 (SPSS Inc., Chicago, IL, USA) to examine differences, and the analysis of variance was performed using one-way ANOVA. Comparisons among the treatments were performed with Duncan’s multiple range tests (p value < 0.05). The interaction analysis was conducted using the N application rate (R) and method (M) as the primary effects.

3. Result

3.1. The Effect of Different N Management Practices on Grain Yield

The N rates (R) and N application methods (M) had a significant impact on grain yield and its components (Table 1). Under N1, N2, and N3, the F treatment significantly increased the grain yield compared to that of T, while there was no significant difference between the two treatments under N0. The grain number per spike under N1 in F treatment was significantly higher than T. The spike number and 1000-grain weight under N2 showed a trend of F > T, while there was no significant difference in grain number per spike between them. The spike number in F treatment under N3 was significantly higher than that of T. Furthermore, under the T treatment, the grain yield of N3 was significantly higher than others in 2022–2023, while there was no significant difference between N3 and N2 treatments in 2023–2024. Obviously, under the F treatment, both seasons showed a trend of N2 > N3 > N1 > N0.

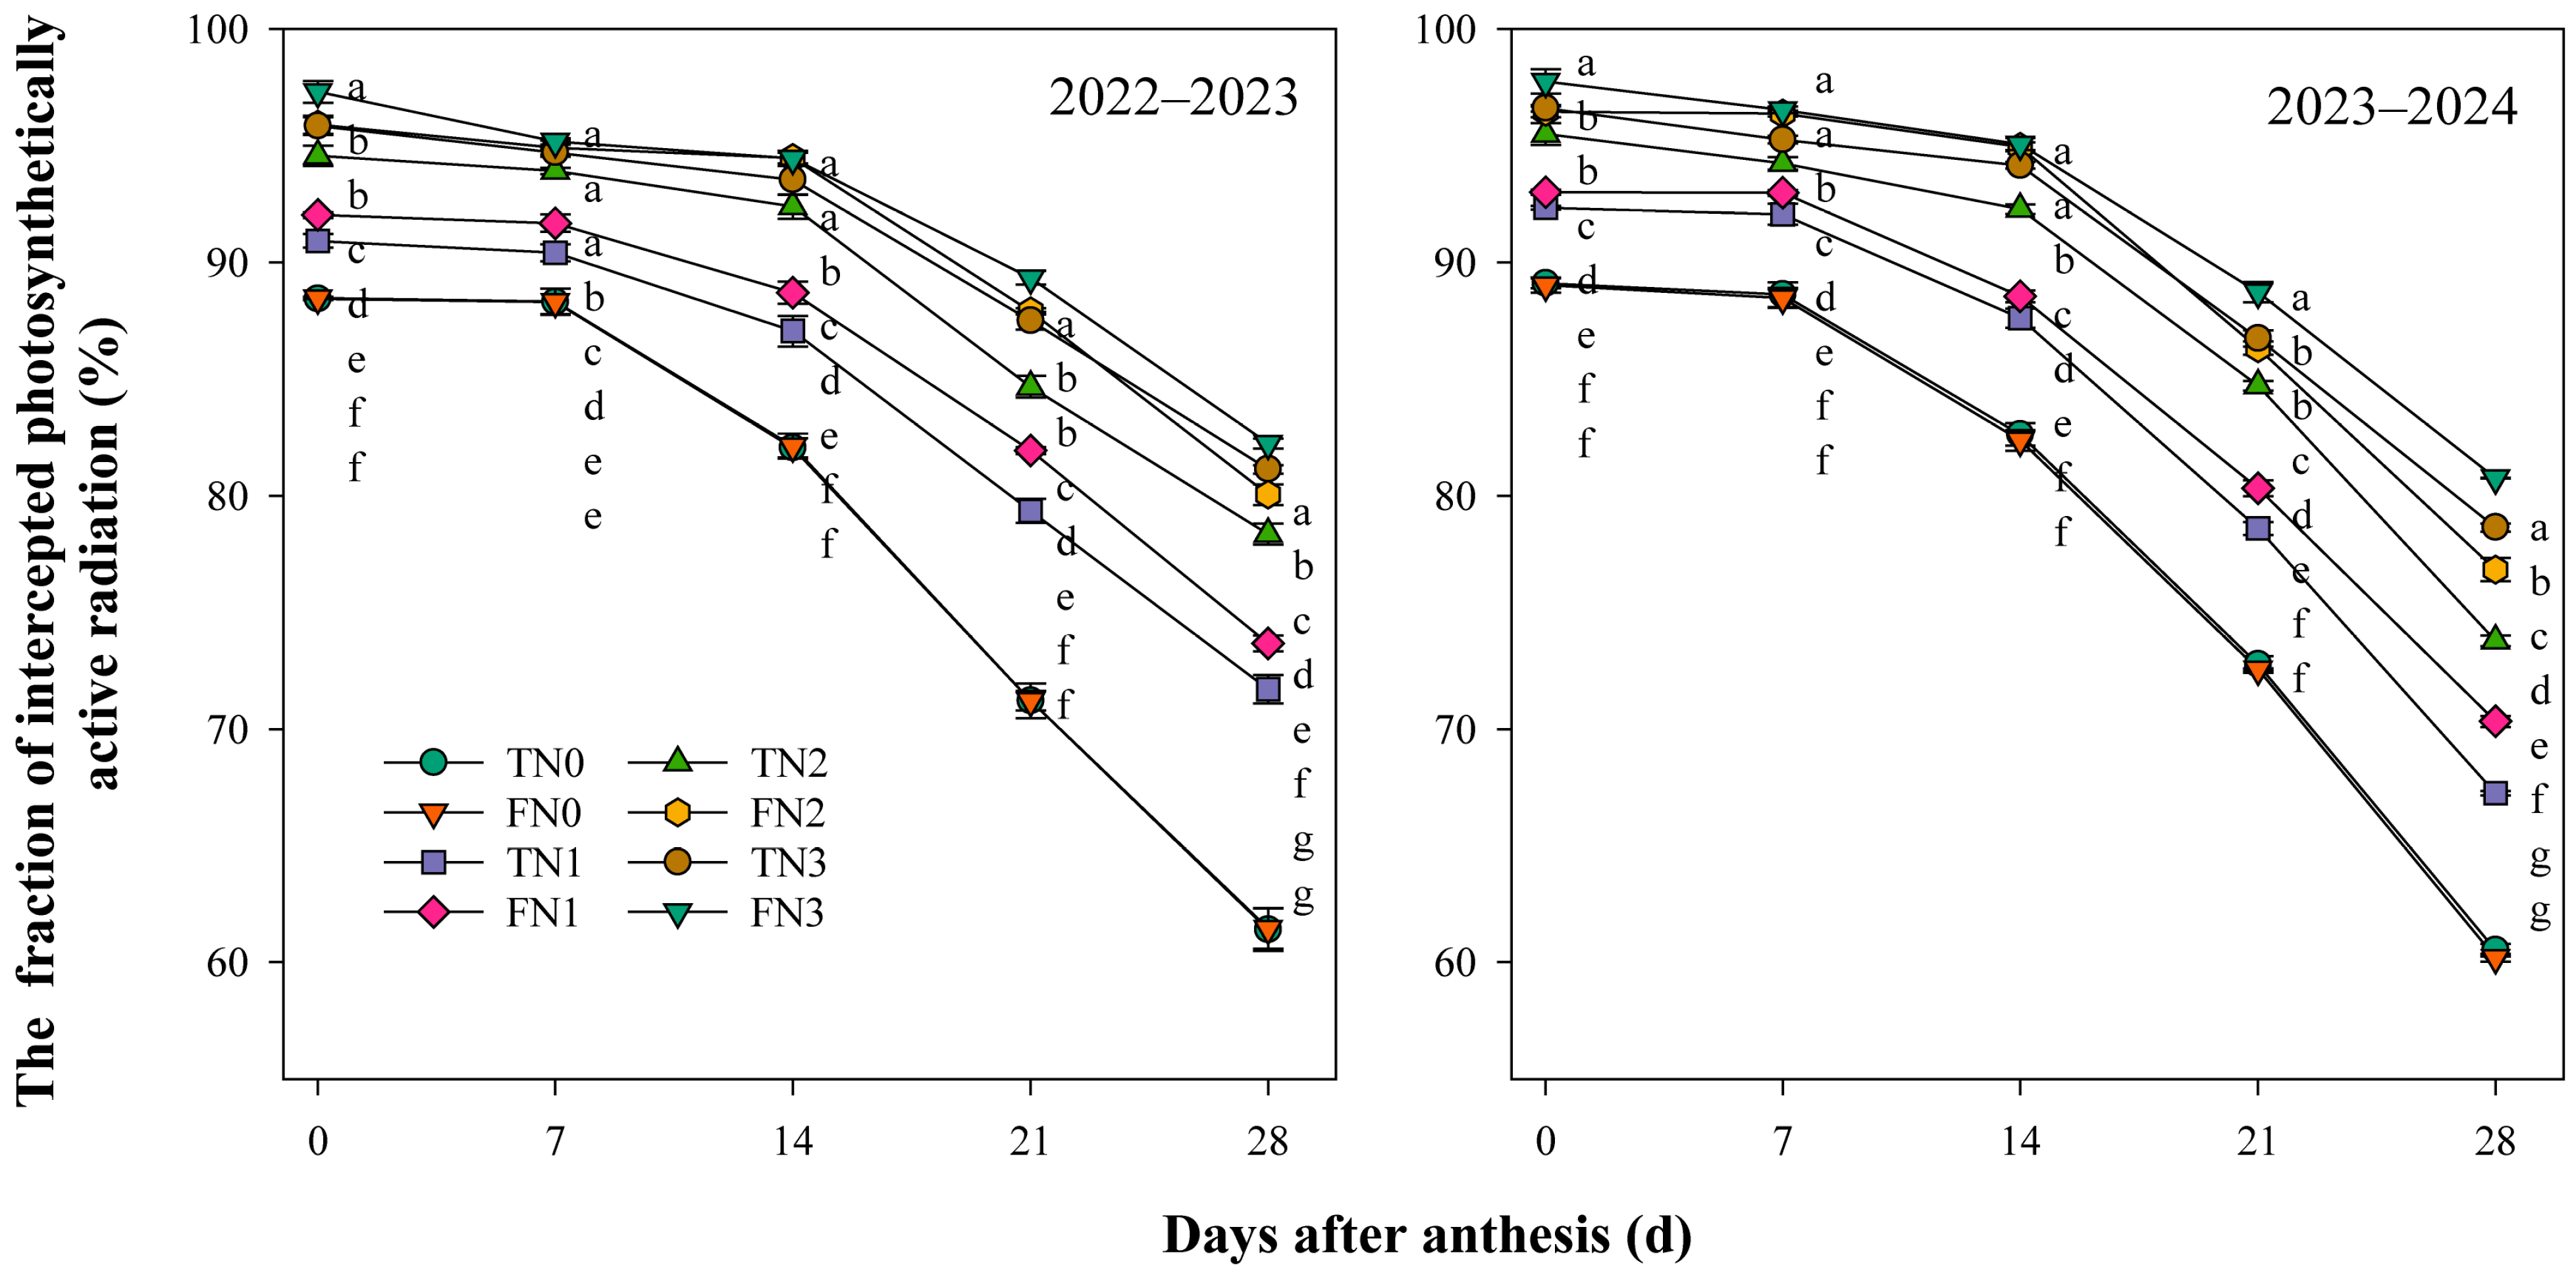
3.2. The Effect of Different N Management Practices on Canopy Photosynthetic Effective Radiation Interception Rate

The canopy photosynthetic effective radiation interception rate (CaR) of different treatments is shown in Figure 3, which gradually decreased with the increase of days after anthesis. There was no significant difference in CaR under N0, between T and F. Under the same N application rate, the CaR of F treatment was higher than that of T at 0, 7, 14, 21 and 28 d after anthesis. In addition, the CaR under T treatment after anthesis showed a trend of N3 > N2 > N1 > N0. The CaR under F treatment at 0, 21, and 28 d also showed a trend of N3 > N2 > N1 > N0, while there was no significant difference between N2 and N3 treatments at 7 and 14 d after anthesis.

3.3. The Effect of Different N Management Practices on Photosynthesis Characteristics

There was no significant difference in Pn of flag leaves after anthesis under N0 between T and F treatments. However, compared with T treatment, the Pn of F under N1 increased at 0 and 7 d after anthesis. And the Pn of F under N3 treatment significantly increased at 7 and 14 d after anthesis. Especially under N2, the Pn of F treatment increased on all sampling days after anthesis compared to that of T. In addition, under the same N application methods, the Pn of T and F treatments showed N2 > N3 > N1 > N0 at 7 and 14 d after anthesis. However, the Pn of T and F treatments increased with the increase of N application rate at 21 and 28 d after anthesis (Figure 4a,b).
Under the same N application rate, the effect of the N application method on Gs and Tr of flag leaves after anthesis was similar to that of Pn (Figure 4c–f). Specifically, under the T treatment, there was no significant difference in Gs and Tr at 0 and 7 d between N2 and N3; however, at 14 d after anthesis, the Gs and Tr of N2 were significantly higher than those of the other treatments. The Gs and Tr of flag leaves under the F at 0, 7, and 14 d after anthesis showed a trend of N2 > N3 > N1 > N0. Additionally, the Ci of F treatment significantly reduced at 0, 14, and 28 d after anthesis under N2, compared to that of T (Figure 4g,h). Under the same N application method, the Ci of N2 was significantly lower than other treatments at 14 d after anthesis. However, the flag leaf Ci at 21 and 28 d after anthesis increased with the increase of N application rate.

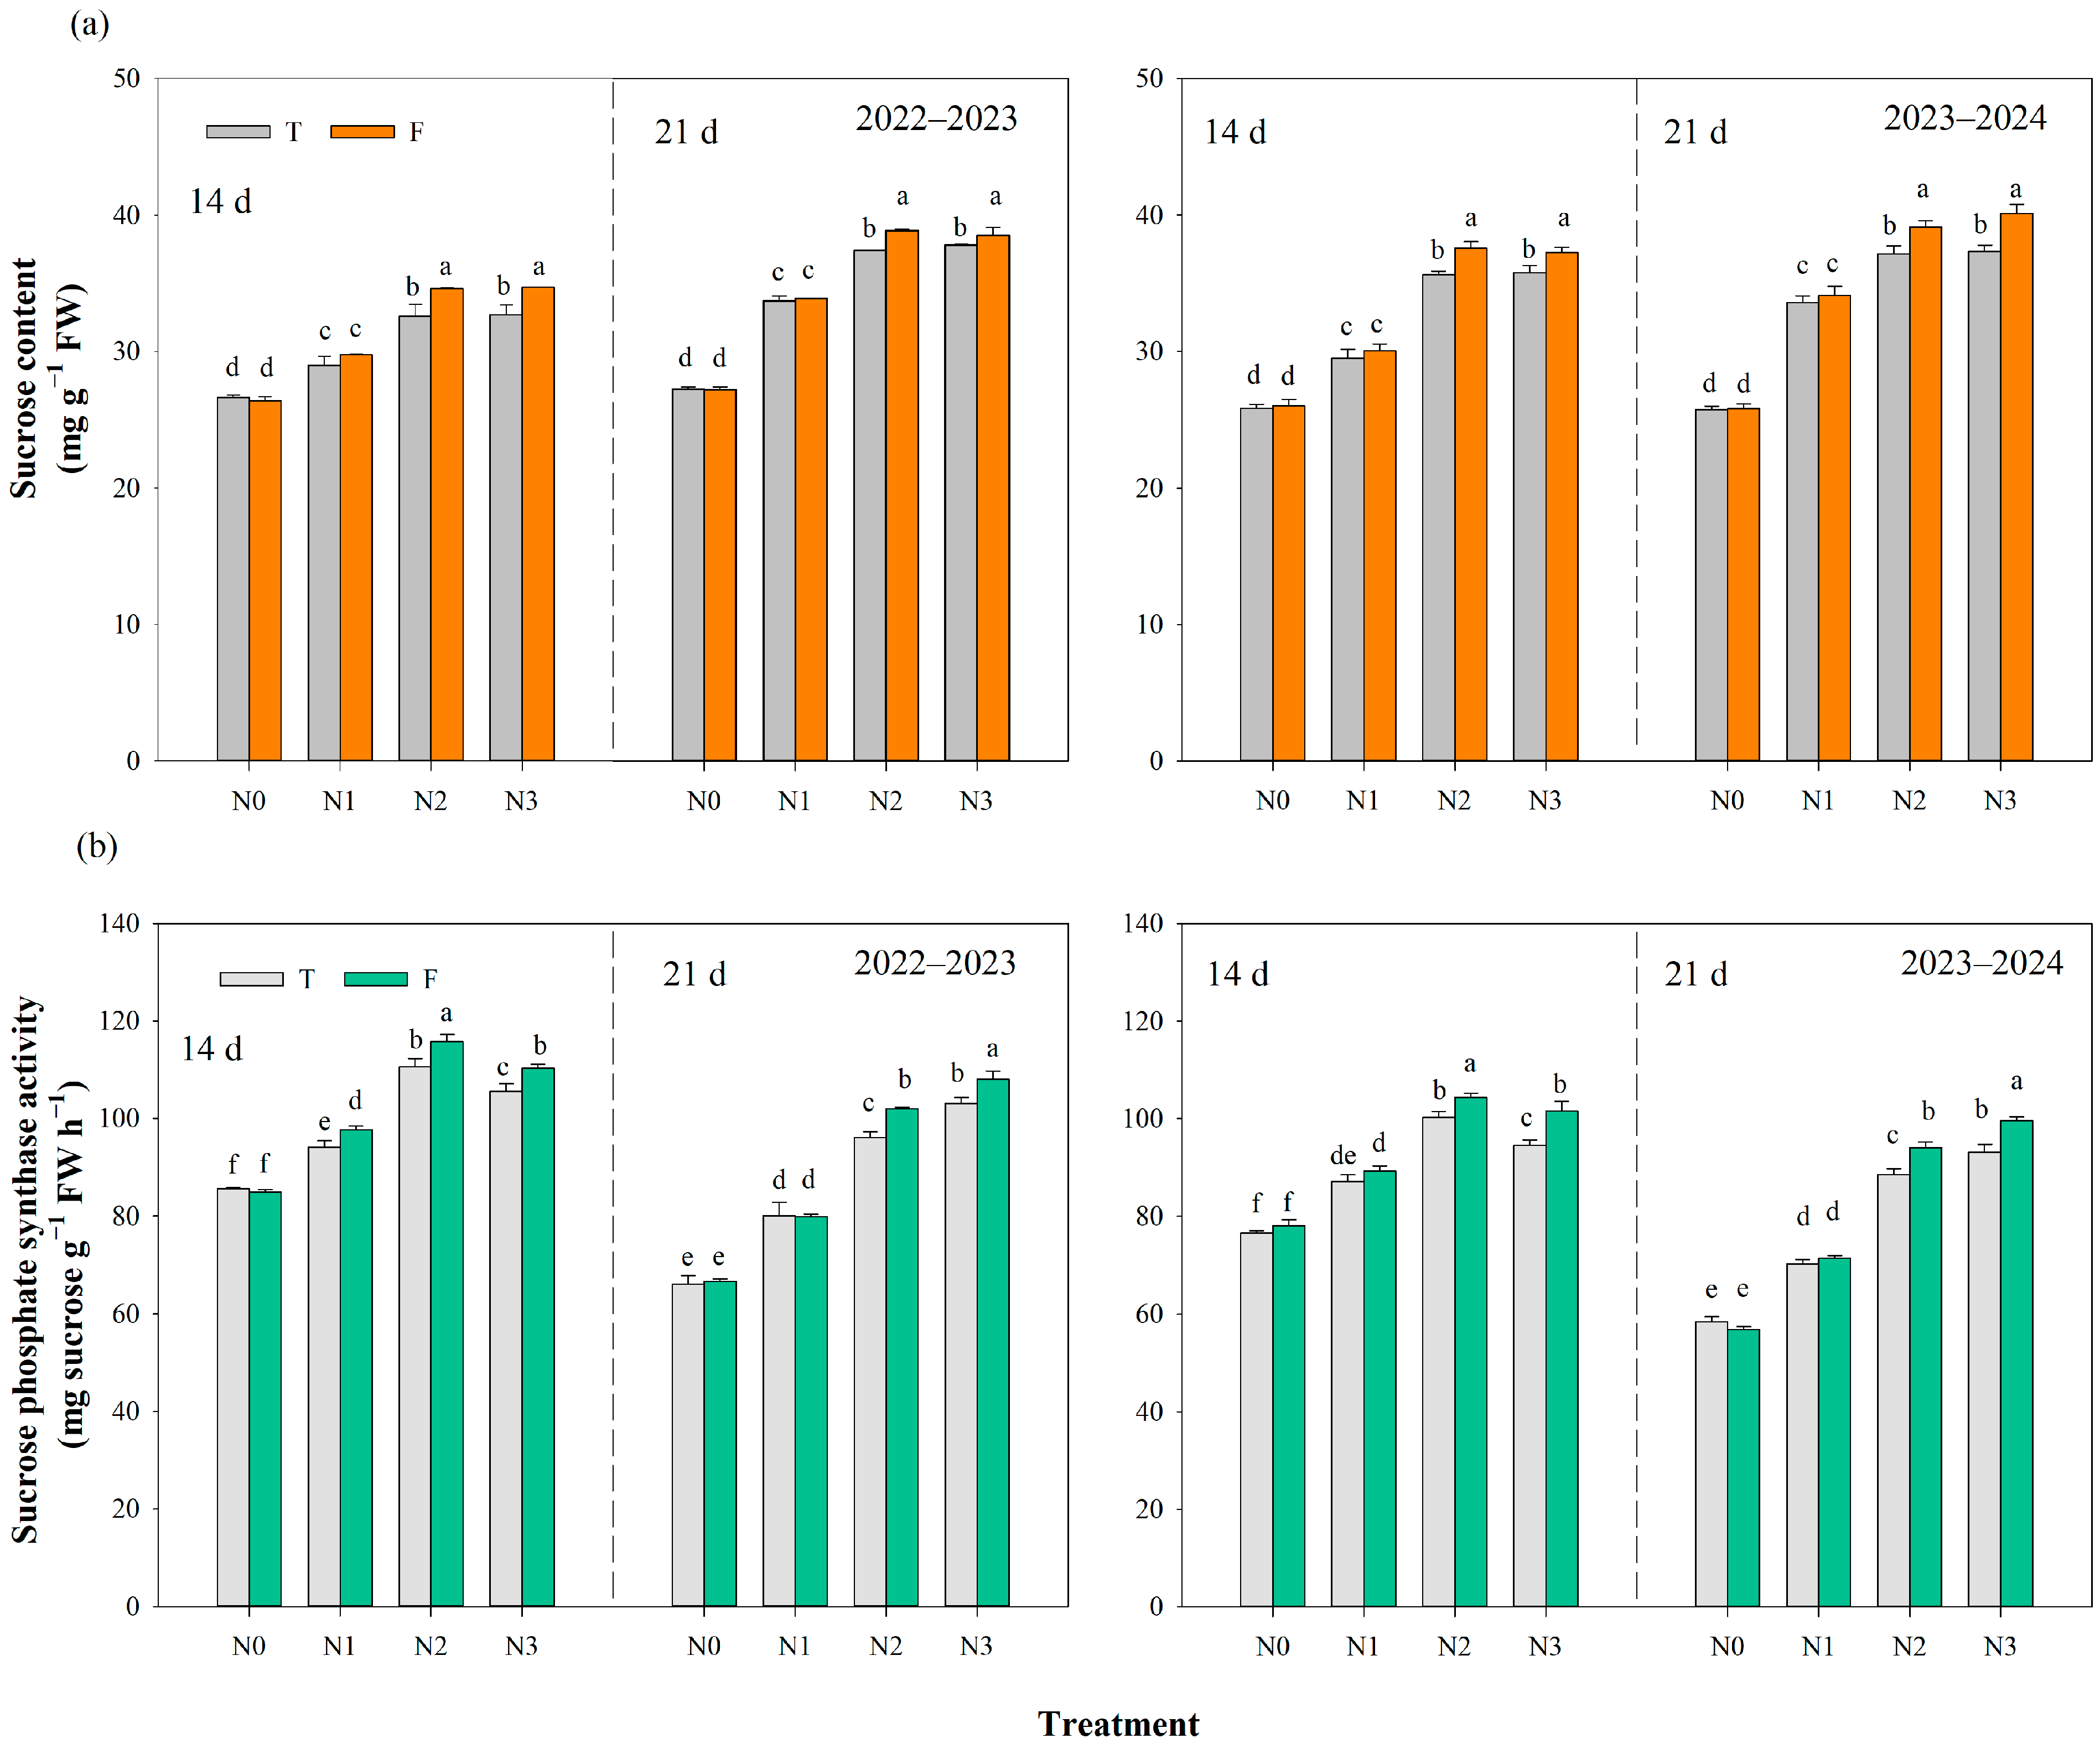
3.4. The Effect of Different N Management Practices on Sucrose Content and Sucrose Phosphate Synthase Activity in Flag Leaves

Under the T and F treatment, the sucrose content in the flag leaves of two wheat seasons showed a trend of N3 = N2 > N1 > N0 at 14 d and 21 d after anthesis. Among them, there was no significant difference between T and F treatments under N0 and N1. Under N2 and N3, the sucrose content in flag leaves of F was significantly higher than that of T (Figure 5a).
The sucrose phosphate synthase activity (SPS) under T and F at 14 d after anthesis in two wheat seasons showed a trend of N2 > N3 > N1 > N0. At 14 d after anthesis, the SPS of T and F treatments increased with the increase of N application rate. In 2022–2023, the SPS activity of F treatment was significantly higher than that of T under N1, N2, and N3, while there was no significant difference between T and F treatments under N1 in 2023–2024 (Figure 5b).

3.5. The Effect of Different N Management Practices on Dry Matter Accumulation and Remobilization

3.5.1. Dry Matter Accumulation at Maturity

The dry matter weight in various organs at maturity stage showed a trend of grain > stem and sheath > spike axis and glume > leaf (Figure 6). Under N1, N2, and N3, compared with T treatment, F increased the total dry matter weight of plants, and the dry matter weight of stem and sheath, spike axis and glume, and grain. While there was no significant difference between T and F under N0.
The total dry matter weight under T treatment increased with the increase of N application rate. However, the total dry matter weight under F showed a trend of N2 = N3 > N1 > N0. Under both N application methods, N application increased the dry matter allocation of various nutrient organs in the plant, and it increased with the increase of N rate. The dry matter weight of the grain under T treatment showed a trend of N3 = N2 > N1 > N0, while it showed a trend of N2 > N3 > N1 > N0 under F.

3.5.2. Dry Matter Remobilization

According to Table 2, under N1 and N2, the remobilization of pre-anthesis stored assimilates (RDM) and dry matter assimilation (DMA) after anthesis of F treatment significantly increased compared to T. However, there was no significant difference in RDM under N0 and N3 between the T and F treatment. Under N2 and N3, the F treatment significantly increased the contribution of DMA to grain, while reducing the contribution of RDM to grain.
Under the T treatment, the RDM, DMA and the contribution of DMA to grain increased with the increase of N application rate. However, the RDM under F exhibited a trend of N2 > N3 > N1 > N0. In 2023–2024, the DMA of N2 treatment under F was significantly higher than N3. However, in 2022–2023, there was no significant difference between the two treatments. At the meantime, there was no significant difference in the contribution of DMA to grain between N2 and N3 under F treatment.

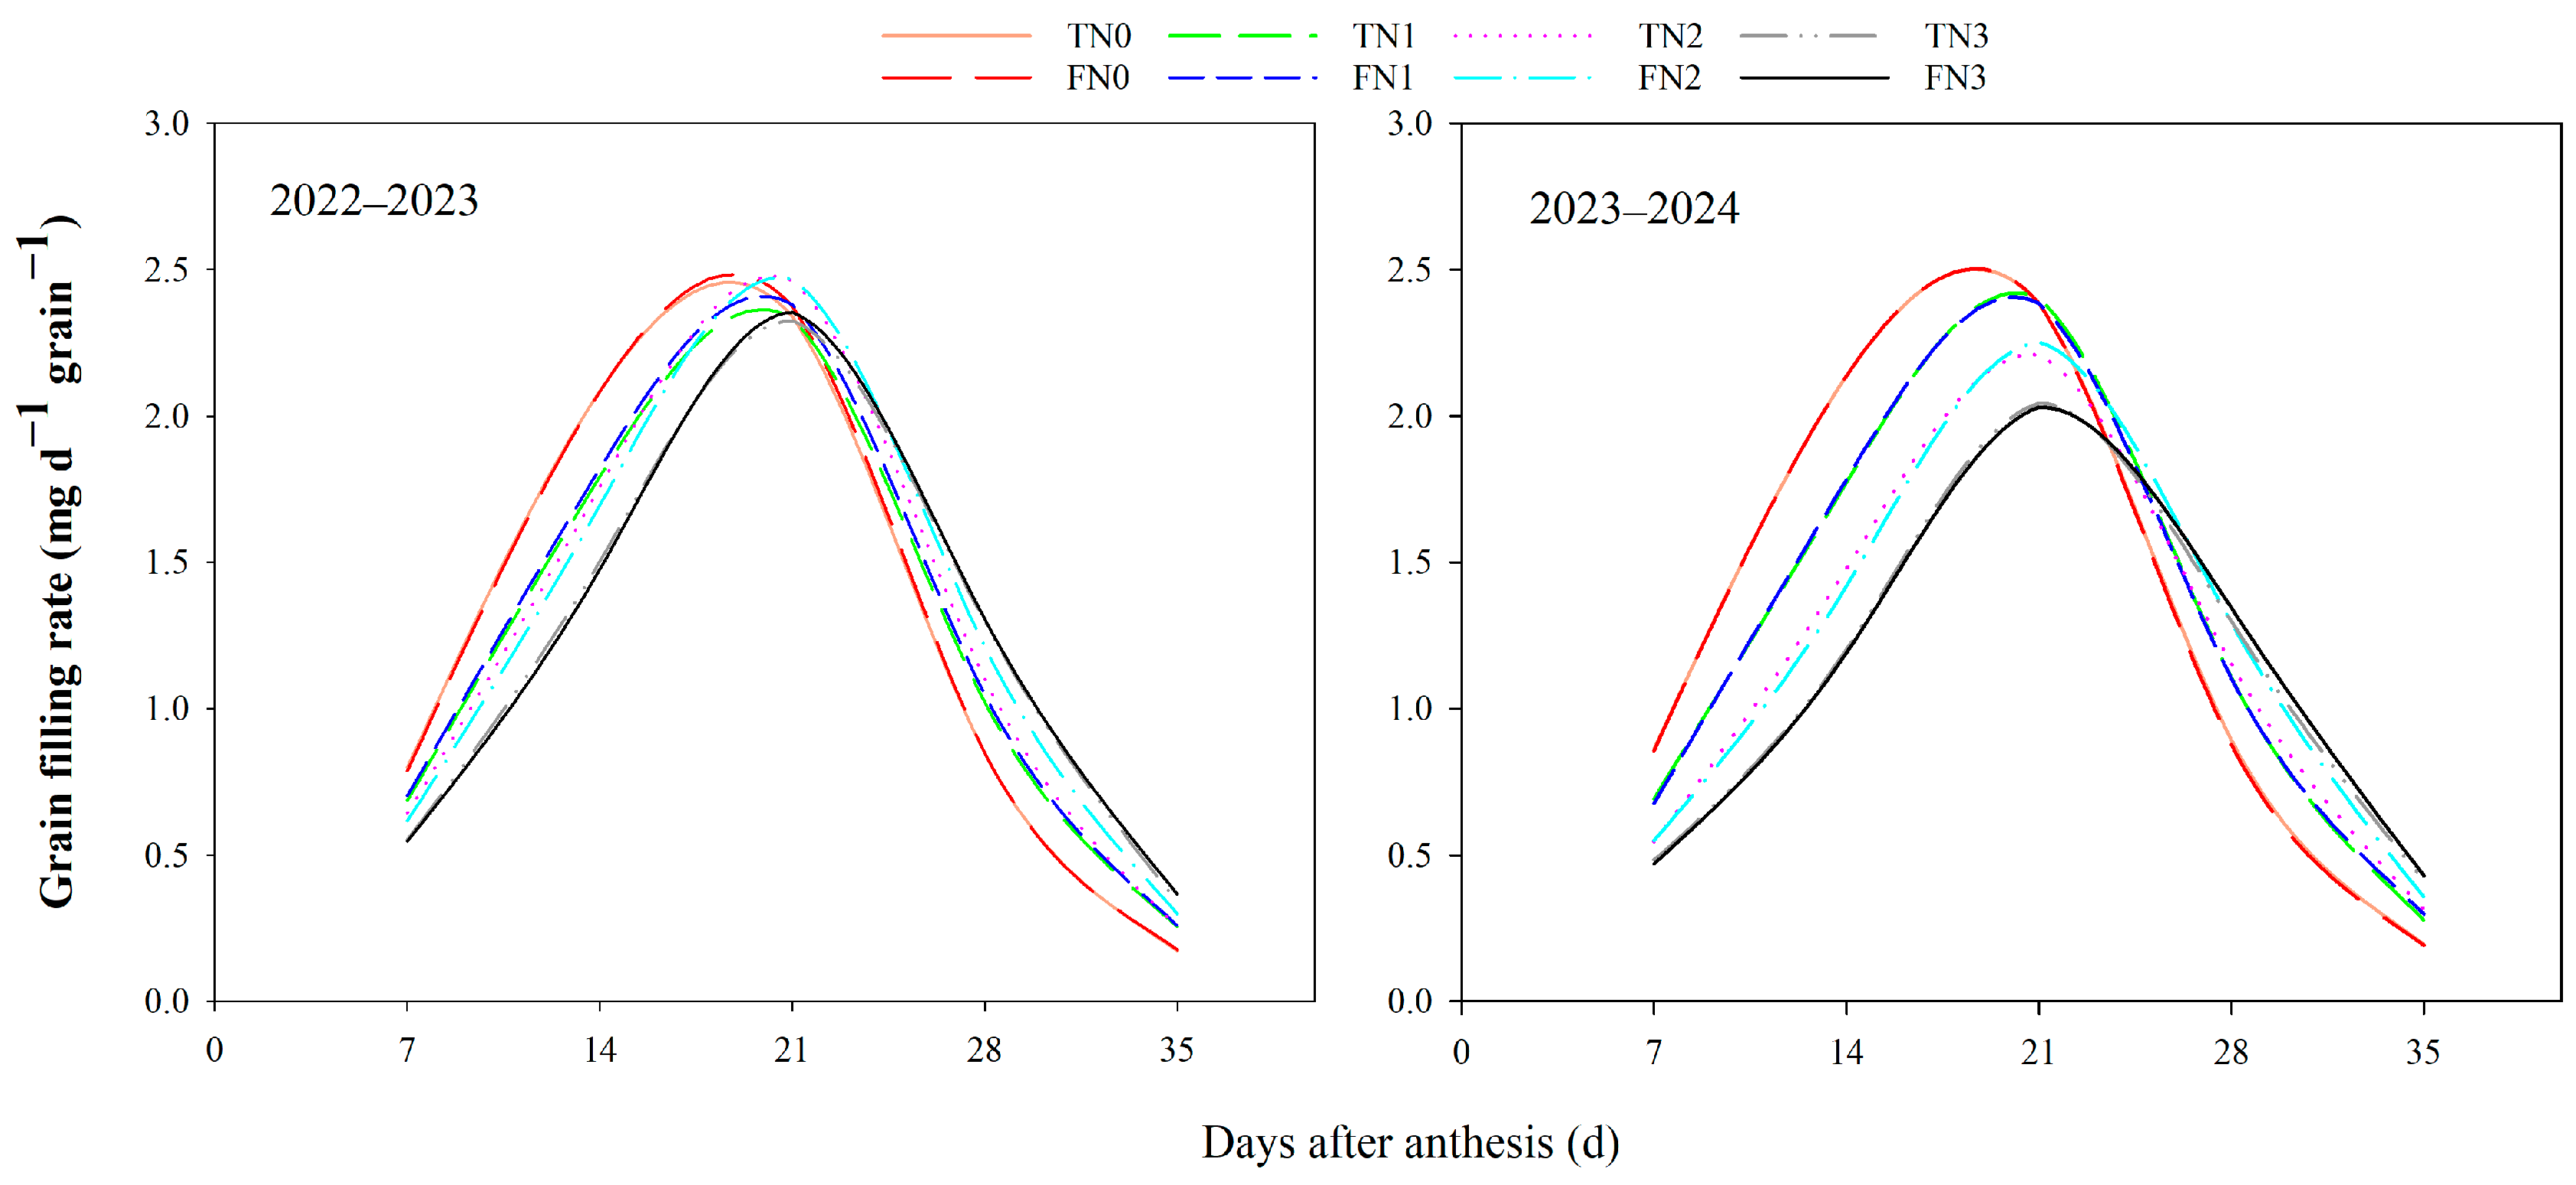
3.6. The Effect of Different N Management Practices on Grain Filling Characteristics

The grain filling rate of each treatment after anthesis showed a single peak curve (Figure 7). With the increase of N application rate, the peak appearance time was delayed, and the peak value was decreased. The results of logistic equation fitting showed that as the N application rate increased, the time required to reach the maximum grain filling rate (Tmax), the duration of grain filling (T), and the active grain filling period (D) all increased (Table 3). There were no significant differences in Tmax, T, maximum grain-filling rate (Vmax), and D between the T and F treatments during the two wheat seasons under N0 and N3 treatments. Under N1, the Vmax of the F treatment was significantly higher than that of T only in 2022–2023. The Tmax, T, and D of F treatment under N2 were significantly increased compared to that of T.

3.7. The Effect of Different N Management Practices on N Agronomic Efficiency and Water Use Efficiency

Under N1 and N2, the NAE and WUE of F treatment significantly increased, compared to that of T. There was no significant difference in NAE under N3 between T and F treatments in 2023–2024. Obviously, with the increase of N application rate, the NAE under both methods showed a trend of first increasing and then decreasing. In addition, the WUE of F treatment showed a trend of N2 > N3 > N1 > N0. Under T, only N2 treatment was significantly higher than others in 2022–2023 wheat season, while there was no significant difference between N2 and N3 treatments in 2023–2024 (Figure 8).

4. Discussion

Over the past half-century, grain yield has increased dramatically around the world. It was mainly due to the development of high-yielding varieties, the application of N fertilizers and improved agricultural production techniques [27]. However, the yield potential for further improvement and maximization of production levels has become limited. Therefore, research to break through the yield potential has increasingly become the focus of attention. Optimizing photosynthesis and improving photosynthetic use efficiency may be an important way to further increase yield [28]. In this study, we investigated the physiological mechanisms of N rates and application methods on canopy light interception to carbohydrate synthesis in a high soil fertility field with a grain yield exceeding 10,500 kg ha−1, in order to provide a basis for high-yield and efficient cultivation of wheat.

4.1. Canopy Light Interception and Photosynthetic Characteristics under N Management Practices

Canopy light interception plays a crucial role in improving wheat productivity [29,30]. Our previous research showed that under traditional fertilization, in a high soil fertility field with a grain yield of 10,500 kg ha−1, the canopy photosynthetic effective radiation interception rate was than in a high soil fertility field with a yield of 9000 kg ha−1 [31]. In this study, in a super high soil fertility field with a grain yield of 10,500 kg ha−1, the F treatment further increased the canopy photosynthetic effective radiation interception rate of after anthesis compared to the T (Figure 3). The fertigation matched the supply of water and N with the demand for wheat, reduced ineffective tillering, and promoted the production of large tillers [17]. The increase in the effective number of tillers reduced the loss of light leakage, provided a basis for better utilization of light energy during the filling stage.
The vast majority of grain yield comes from post-anthesis photosynthetic products, especially the contribution of flag leaves to the accumulation of dry matter in grains. In this study, compared to traditional fertilization method, fertigation improved the Pn, Gs, and Trof flag leaves during the mid grain filling stage, which created conditions for the formation of photosynthetic product in the later stage (Figure 4). Under two N management practices, with the increase of N rate, the Pn of flag leaf first increased and then decreased from 0 to 14 d after anthesis. It could be seen that under N2, the Pn of flag leaf was significantly higher than other treatments, which was conducive to the continuous supply of carbon assimilates at the filling stage. With the development of reproductive organs, the Pn and Gs of flag leaves in each treatment showed a decreasing trend from 14 d to 21 d after anthesis. Meanwhile, the Ci of flag leaves in N0 and N1 treatments also showed a decreasing trend, while the N2 and N3 treatments showed the opposite trend. Research has shown that when the intercellular CO2 concentration decreases along with stomatal conductance, the reduction in photosynthetic rate is mainly caused by the decrease in stomatal conductance; On the contrary, if the limiting for photosynthetic rate is non stomatal factor, it is a decrease in the photosynthetic activity of plant mesophyll cells [32]. It could be seen that the N application rate affected the photosynthetic activity of mesophyll cells, as evidenced by the results of the activity of sucrose phosphate synthase (SPS) in flag leaves in the study (Figure 5). Photosynthetic carbon assimilates in leaves mainly existed and exported outward in the form of sucrose [33]. The synthesis of sucrose in mesophyll cells can reflect the supply capacity of photosynthetic assimilates [34]. In this study, under N2, fertigation treatment increased the SPS activity and sucrose content of flag leaves after anthesis, which was beneficial for the accumulation of photosynthetic products in the mid grain filling stage.

4.2. Dry Matter Accumulation, Remobilization and Grain Filling under N Management Practices

Dry matter accumulation is an important factor affecting the formation of grain yield. Within a certain range, as the accumulation of dry matter increases, the grain yield may increase. Therefore, improving dry matter accumulation through reasonable agronomic measures is an important way to achieve high yield. In this study, N application methods and N rates had a significant impact on the total dry matter accumulation, especially in mature stem, leaf, and grain organs (Figure 6). Zhai et al. [35] found that under fertigation, the photosynthetic rate of wheat leaves at anthesis and mid grain filling stages were significantly correlated with dry matter accumulation. In this study, the F treatment increased the dry matter accumulation compared to that of T. At the same time, the Pn of flag leaves significantly increased at 14 and 21 d after anthesis, indicating a significant positive correlation between them. Zhang et al. [36] found that the accumulation of dry matter in wheat increased with the increase of N rate. This was similar to the results of T treatment in the study. However, under the F, with the increase of N application rate, the accumulation of dry matter did not further increase, and there was no significant difference when the N rates were 210 kg ha−1 (N2) and 270 kg ha−1 (N3). It could be seen that a certain threshold for the accumulation of dry matter existed, which increased with the increase of N application rate within a certain range. Further enhancing the N application rate did not increase the accumulation of dry matter. At the same time, when the N rate was 210 kg ha−1 (N2) under the F, the dry matter assimilation after anthesis was significantly higher than other treatments, and its contribution to grain was also increased (Table 2).
Grain filling is the final stage of fertilized ovaries developing into caryopses and is significantly influenced by pre-anthesis remobilization of dry matter and post-anthesis photosynthetic complex synthesis, both of which determine the final grain weight [37]. The grain filling rate and effective filling duration affect the sink strength of grain [38]. In this study, only under N2, the duration and active filling period of F were significantly higher than those of T (Table 3). This indicates that an appropriate N rate under fertigation increases the effective duration of grain filling, thereby increasing grain weight. The results of 1000-grain weight also indicated it. Under the two N application methods, as the N rate increased, the Tmax, T, and D all showed a gradually increasing trend. These results might be related to senescence characteristics, as delaying premature leaf senescence is beneficial for prolonging effective grain filling period [39]. Ma et al. [40] reported that with the increase of N application rate, the Vmax first increased and then slightly decreased. It was similar to the results of the N application treatment in 2022–2023 wheat season. However, the Vmax showed a decreasing trend with N rate in 2023–2024. The difference in results between the two the seasons might be related to precipitation at filling stage.

4.3. Grain Yield, N Agronomic Efficiency and Water Use Efficiency under N Management Practices

N application is an important factor affecting wheat yield, influenced by factors such as regions, varieties, and management measures. The results of previous studies on yield were different. A study showed that grain yield did not change significantly when the N application rate of winter wheat exceeded 120 kg ha−1 [41]. Wang et al. [42] found that the grain yield showed a trend of first increasing and then decreasing with the increase of N application. In order to obtain a yield of more than 9000 kg ha−1, the recommended N rate in the NCP was 240–277 kg N ha−1 [43]. However, in this study, in the high-fertility soil with a grain yield exceeding 10,500 kg ha−1, grain yield increased with the increase of N application rate under the T, while under the F treatment, the grain yield of N2 was significantly higher than other treatments, indicating that fertigation could reduce N application rate and achieve high grain yield (Table 1). N application method had a significant impact on grain yield. Previous studies showed that the integration of water and fertilizer had a significant impact on 1000-grain weight but had no significant effect on grain number per spike [16,44]. In this study, the result showed that under N2, the F increased the spike number and 1000-grain weight compared to T but had no significant effect on grain number per spike. However, there was no significant difference in grain number per spike and 1000-grain weight between N1 and N3. It can be seen that under micro sprinkling fertigation, an appropriate N application rate provided a good material basis for population construction and grain development and created favorable conditions for the formation of higher grain yield. The reasons may be that the F treatment resulted in a more uniform distribution of N in the soil compared to T, which was beneficial for the establishment of tillering in the population [45]. On the other hand, under the F, deep root length density was higher than that of T, which was conducive to the absorption of nitrate N and water [46,47]. Increasing N uptake was beneficial for the development of photosynthetic systems, such as chloroplasts, amino acids, and enzymes, leading to more photosynthetic assimilation transport from the green organs into the grains, thereby increasing grain yield [48]. On the contrary, excess N was stored in vacuoles and did not participate in N assimilation [49].
Therefore, high N input cannot guarantee higher grain yield and may also reduce N use efficiency, as N fertilizer input rate far exceeds crop demand [50]. In addition, due to the lack of synchronization between N demand and supply, N losses exceeded 50%, significantly decreasing N use efficiency. The nutrient absorption of crops is closely related to fertilization, irrigation, and soil conditions. An appropriate fertilization method significantly reduce N losses [51]. The integration of water and fertilizer can save 40–60% of chemical fertilizers [52]. In this study, compared with T, the F increased the NAE by 19.30% and the WUE by 3.47% (Figure 8). It could be seen that fertigation was beneficial for wheat to uptake water and N, reducing ineffective losses of soil water and N. Meanwhile, under the F, when the N application rate was 210 kg ha−1 (N2), both NAE and WUE obtained were significantly higher than in other treatments. In summary, adopting fertigation method that integrated water and fertilizer, along with the N rate of 210 kg ha−1, was the suitable management practice for wheat in high-fertility soil with the grain yield exceeding 10,500 kg ha−1.

5. Conclusions

In this study, the fertigation optimized the canopy structure of wheat population compared to the traditional fertilization method, improved the net photosynthetic rate of flag leaves after anthesis, and increased the accumulation and remobilization of plant dry matter. The combination of fertigation and appropriate N rate extended the duration of grain filling and the active grain filling period, laying the foundation for improving grain yield. At the same time, the N and water use efficiency under the combination of fertigation and appropriate N rate were significantly improved. Therefore, the fertigation with N rate was 210 kg N ha−1, which was suitable for wheat production in high-fertility soil with the grain yield exceeding 10,500 kg ha−1 and could be used as the recommended N management practice for the North China Plain.

Author Contributions

Z.M.: conceptualization; investigation; data curation; writing–original draft, and review and editing. Y.S.: conceptualization; funding acquired; and writing–review and editing. Z.Y.: conceptualization. Z.Z.: writing–review and editing. X.W.: supervision. All authors have read and agreed to the published version of the manuscript.

Funding

This study was financially supported by the National Natural Science Foundation of China (32172114); the China Agriculture Research System of MOF and MARA (CARS-03-18); and the Taishan Scholar Project Special Funds (tsqn202211094).

Data Availability Statement

The data of this study can be obtained from the corresponding author.

Acknowledgments

The authors would like to thank the reviewers for their valuable comments and suggestions for this work.

Conflicts of Interest

The authors declare no conflict of interest.

References

  1. Ma, M.Y.; Liu, Y.; Zhang, Y.W.; Qin, W.L.; Wang, Z.M.; Zhang, Y.H.; Lu, C.M.; Lu, Q.T. In situ measurements of winter wheat diurnal changes in photosynthesis and environmental factors reveal new insight into photosynthesis improvement by super-high-yield cultivation. J. Integr. Agric. 2021, 20, 527–539. [Google Scholar] [CrossRef]
  2. Liu, H.; Xiong, W.; Mottaleb, K.A.; Krupnik, T.J.; Burgueo, J.; Pequeno, D.N.L.; Wu, W.B. Contrasting contributions of five factors to wheat yield growth in China by process-based and statistical models. Eur. J. Agron. 2021, 130, 126370. [Google Scholar] [CrossRef]
  3. Yu, C.Q.; Huang, X.; Chen, H.; Godfray, H.C.J.; Wright, J.S.; Hall, J.W.; Gong, P.; Ni, S.Q.; Qiao, S.C.; Huang, G.R.; et al. Managing nitrogen to restore water quality in China. Nature 2019, 567, 516–520. [Google Scholar] [CrossRef] [PubMed]
  4. Omonode, R.A.; Halvorson, A.D.; Bernard, G.; Vyn, T.J. Achieving lower nitrogen balance and higher nitrogen recovery efficiency reduces nitrous oxide emissions in North America’s maize cropping systems. Front. Plant Sci. 2017, 8, 1080. [Google Scholar] [CrossRef]
  5. Hu, C.X.; Tian, Z.W.; Gu, S.L.; Guo, H.; Fan, Y.H.; Abid, M.; Chen, K.; Jiang, D.; Cao, W.X.; Dai, T.B. Winter and spring night warming improve root extension and soil nitrogen supply to increase nitrogen uptake and utilization of winter wheat (Triticum aestivum L.). Eur. J. Agron. 2018, 96, 96–107. [Google Scholar] [CrossRef]
  6. Shahrokhnia, M.H.; Sepaskhah, A.R. Effects of irrigation strategies, planting methods and nitrogen fertilization on yield, water and nitrogen efficiencies of safflower. Agric. Water Manag. 2016, 172, 18–30. [Google Scholar] [CrossRef]
  7. Tafteh, A.; Sepaskhah, A.R. Application of HYDRUS1D model for simulating water and nitrate leaching from continuous and alternate furrow irrigated rapeseed and maize fields. Agric. Water Manag. 2012, 113, 19–29. [Google Scholar] [CrossRef]
  8. Smith, E.N.; van Aalst, M.; Tosens, T.; Niinemets, U.; Stich, B.; Morosinotto, T.; Alboresi, A.; Erb, T.J.; Gomez-Coronado, P.A.; Tolleter, D.; et al. Improving photosynthetic efficiency toward food security: Strategies, advances, and perspectives. Mol. Plant. 2023, 16, 1674–2052. [Google Scholar] [CrossRef] [PubMed]
  9. Song, Q.; Su, R.; Chai, Y.; Goudia, B.D.; Chen, L.; Hu, Y.G. High photosynthetic capability observed in the wheat germplasm with rye chromosomes. J. Plant Physiol. 2017, 216, 202–211. [Google Scholar] [CrossRef]
  10. Plaut, Z.; Butow, B.J.; Blumenthal, C.S.; Wrigley, C.W. Transport of dry matter into developing wheat kernels and its contribution to grain yield under post-anthesis water deficit and elevated temperature. Field Crops Res. 2004, 86, 185–198. [Google Scholar] [CrossRef]
  11. Mu, H.; Jiang, D.; Wollenweber, B.; Dai, T.; Jing, Q.; Cao, W. Long-term low radiation decreases leaf photosynthesis, photochemical efficiency and grain yield in winter wheat. J. Agron. Crop Sci. 2010, 196, 38–47. [Google Scholar] [CrossRef]
  12. Tuncel, A.; Okita, T.W. Improving starch yield in cereals by overexpression of ADPglucose pyrophosphorylase: Expectations and unanticipated outcomes. Plant Sci. 2013, 211, 52–60. [Google Scholar] [CrossRef] [PubMed]
  13. Bahrani, A.; Abad, H.H.S.; Sarvestani, Z.T.; Moafpourian, G.H.; Band, A.A. Remobilization of dry matter in wheat: Effects of nitrogen application and post-anthesis water deficit during grain filling. N. Z. J. Crop Hort. 2011, 39, 279–293. [Google Scholar] [CrossRef]
  14. Wang, J.J.; Sun, X.; Hussain, S.; Yang, L.H.; Gao, S.S.; Zhang, P.; Chen, X.L.; Ren, X.L. Reduced nitrogen rate improves post-anthesis assimilates to grain and ameliorates grain-filling characteristics of winter wheat in dry land. Plant Soil 2024, 499, 91–112. [Google Scholar] [CrossRef]
  15. Roger, S.B.; Kindred, D.R. Analysing nitrogen responses of cereals to prioritize routes to the improvement of nitrogen use efficiency. J. Exp. Bot. 2009, 60, 1939–1951. [Google Scholar]
  16. Li, J.P.; Wang, Y.Q.; Zhang, M.; Liu, Y.; Xu, X.X.; Lin, G.; Wang, Z.M.; Yang, Y.M.; Zhang, Y.H. Optimized micro-sprinkling irrigation scheduling improves grain yield by increasing the uptake and utilization of water and nitrogen during grain filling in winter wheat. Agric. Water Manag. 2019, 211, 59–69. [Google Scholar] [CrossRef]
  17. Li, J.P.; Wang, Z.M.; Yao, C.S.; Zhang, Z.; Liu, Y.; Zhang, Y.H. Micro-sprinkling irrigation simultaneously improves grain yield and protein concentration of winter wheat in the North China Plain. Crop J. 2021, 9, 1397–1407. [Google Scholar] [CrossRef]
  18. Ju, X.; Xing, G.; Chen, X.; Zhang, S.; Zhang, L.; Liu, X.; Cui, Z.; Yin, B.; Christie, P.; Zhu, Z.; et al. Reducing environmental risk by improving N management in intensive Chinese agricultural systems. Proc. Natl. Acad. Sci. USA 2019, 106, 8077–8078. [Google Scholar] [CrossRef]
  19. Farmer’s Daily. The Background of Incessantly New Record in High Yielding Winter Wheat. Available online: https://szb.farmer.com.cn (accessed on 14 June 2019).
  20. Noor, H.; Yan, Z.; Sun, P.; Zhang, L.; Ding, P.; Li, L.; Ren, A.; Sun, M.; Gao, Z. Effects of Nitrogen on Photosynthetic Productivity and Yield Quality of Wheat (Triticum aestivum L.). Agronomy 2023, 13, 1448. [Google Scholar] [CrossRef]
  21. Zhang, Z.; Mao, X.M.; Zhong, W.W.; Feng, Z.B.; Zhou, X.B. Photosynthetic production of wheat under precision planting patterns in Northern China. Biosci. J. 2017, 33, 1–9. [Google Scholar] [CrossRef]
  22. O’Connell, M.G.; O’Leary, G.J.; Whitfield, D.M.; Connor, D.J. Interception of photosynthetically active radiation and radiation-use efficiency of wheat, field pea and mustard in a semi-arid environment. Field Crops Res. 2004, 85, 111–124. [Google Scholar] [CrossRef]
  23. Cabrera-Bosquet, L.; Albrizio, R.; José, L.A.; Salvador, N. Photosynthetic capacity of field-grown durum wheat under different n availabilities: A comparative study from leaf to canopy. Environ. Exp. Bot. 2009, 67, 145–152. [Google Scholar] [CrossRef]
  24. Chantal, F.; Jaleh, G.; Gabriel, C. Drought effect on nitrate reductase and sucrose-phosphate synthase activities in wheat (Triticum durum L.): Role of leaf internal CO2. J. Exp. Bot. 2007, 58, 2983–2992. [Google Scholar]
  25. Chu, P.F.; Zhang, Y.L.; Yu, Z.W.; Guo, Z.J.; Shi, Y. Winter wheat grain yield, water use, biomass accumulation and remobilisation under tillage in the North China Plain. Field Crops Res. 2016, 193, 43–53. [Google Scholar] [CrossRef]
  26. Wang, D.; Yu, Z.W.; White, P.J. The effect of supplemental irrigation after jointing on leaf senescence and grain filling in wheat. Field Crops Res. 2013, 151, 35–44. [Google Scholar] [CrossRef]
  27. Johnson, J.M.; Ibrahim, A.; Dossou-Yovo, E.R.; Senthilkumar, K.; Tsujimoto, Y.; Asai, H.; Saito, K. Inorganic fertilizer use and its association with rice yield gaps in sub-Saharan Africa. Glob. Food Secur. 2023, 38, 100708. [Google Scholar] [CrossRef]
  28. Zhu, X.G.; Long, S.P.; Ort, D.R. Improving photosynthetic efficiency for greater yield. Annu. Rev. Plant Biol. 2010, 61, 235–261. [Google Scholar] [CrossRef] [PubMed]
  29. Zhang, H.Z.; Zhao, Q.; Wang, Z.; Wang, L.H.; Li, X.R.; Fan, Z.R.; Zhang, Y.Q.; Li, J.F.; Gao, X.; Shi, J.; et al. Effects of nitrogen fertilizer on photosynthetic characteristics, biomass, and yield of wheat under different shading conditions. Agronomy 2021, 11, 1989. [Google Scholar] [CrossRef]
  30. Xiong, S.P.; Cao, W.B.; Zhang, Z.Y.; Ma, X.M. Effects of row spacing and sowing rate on vertical distribution of photosynthetically active radiation, biomass, and grain yield in winter wheat canopy. Chin. J. Appl. Ecol. 2021, 32, 1298–1306. [Google Scholar]
  31. Zheng, X.J.; Yu, Z.W.; Yu, F.X.; Shi, Y. Grain-filling characteristics and yield formation of wheat in two different soil fertility fields in the Huang-Huai-Hai Plain. Front. Plant Sci. 2022, 13, 932821. [Google Scholar] [CrossRef]
  32. Dai, Y.J.; Shen, Z.G.; Liu, Y.; Wang, L.L.; Hannaway, D.; Lu, H.F. Effects of shade treatments on the photosynthetic capacity, chlorophyll fluorescence, and chlorophyll content of Tetrastigma hemsleyanum Diels et Gilg. Environ. Exp. Bot. 2009, 65, 177–182. [Google Scholar] [CrossRef]
  33. Reynolds, M.; Foulkes, J.; Furbank, R.; Griffiths, S.; King, J.; Murchie, E.; Parry, M.; Slafer, G. Achieving yield gains in wheat. Plant Cell Environ. 2012, 35, 1799–1823. [Google Scholar] [CrossRef]
  34. Wang, B.S.; Ma, M.Y.; Lu, H.G.; Meng, Q.W.; Li, G.; Yang, X.H. Photosynthesis, sucrose metabolism, and starch accumulation in two NILs of winter wheat. Photosynth. Res. 2015, 126, 163–173. [Google Scholar] [CrossRef] [PubMed]
  35. Zhai, L.C.; LU, L.H.; Dong, Z.Q.; Zhang, L.H.; Zhang, J.T.; Jia, X.L.; Zhang, Z.B. The water-saving potential of using micro-sprinkling irrigation for winter wheat production on the North China Plain. J. Integr. Agric. 2021, 20, 1687–1700. [Google Scholar] [CrossRef]
  36. Zhang, J.H.; Liu, J.L.; Zhang, J.B.; Zhao, F.T.; Cheng, Y.N.; Wang, W.P. Effects of nitrogen application rates on translocation of dry matter and utilization of nitrogen in rice and wheat. Acta Agron. Sin. 2010, 36, 1736–1742. [Google Scholar] [CrossRef]
  37. Yan, S.C.; Wu, Y.; Fan, J.L.; Zhang, F.C.; Qiang, S.C.; Zheng, J.; Xiang, Y.Z.; Guo, J.J.; Zou, H.Y. Effects of water and fertilizer management on grain filling characteristics, grain weight and productivity of drip-fertigated winter wheat. Agric. Water Manag. 2019, 213, 983–995. [Google Scholar] [CrossRef]
  38. Liang, W.; Zhang, Z.; Wen, X.; Liao, Y.; Liu, Y. Effect of non-structural carbohydrate accumulation in the stem pre-anthesis on grain filling of wheat inferior grain. Field Crops Res. 2017, 211, 66–76. [Google Scholar] [CrossRef]
  39. Luo, Y.L.; Tang, Y.H.; Zhang, X.; Li, W.Q.; Chang, Y.L.; Pang, D.W.; Xu, X.; Li, Y.; Wang, Z.L. Interactions between cytokinin and nitrogen contribute to grain mass in wheat cultivars by regulating the flag leaf senescence process. Crop J. 2018, 6, 538–551. [Google Scholar] [CrossRef]
  40. Ma, Q.; Sun, Q.; Zhang, X.B.; Li, F.J.; Ding, Y.G.; Tao, R.R.; Zhu, M.; Ding, J.F.; Li, C.Y.; Guo, W.S.; et al. Controlled-release nitrogen fertilizer management influences grain yield in winter wheat by regulating flag leaf senescence post-anthesis and grain filling. Food Energy Secur. 2022, 11, e361. [Google Scholar] [CrossRef]
  41. Fan, M.; Jiang, R.; Liu, X.; Zhang, F.; Lu, S.; Zeng, X. Interactions between non-flooded mulching cultivation and varying nitrogen inputs in rice-wheat rotations. Field Crops Res. 2005, 91, 307–318. [Google Scholar] [CrossRef]
  42. Wang, L.; Liu, S.; Ma, G.; Wang, C.; Sun, J. Soil organic carbon and nitrogen storage under a wheat (Triticum aestivum L.)-maize (Zea mays L.) cropping system in Northern China was modified by nitrogen application rates. PeerJ 2022, 10, e13568. [Google Scholar] [CrossRef] [PubMed]
  43. Zhang, M.M.; Dong, B.D.; Qiao, Y.Z.; Shi, C.H.; Yang, H.; Wang, Y.K.; Liu, M.Y. Yield and water use responses of winter wheat to irrigation and nitrogen application in the North China Plain. J. Integr. Agric. 2018, 17, 1194–1206. [Google Scholar] [CrossRef]
  44. Zhang, Y.T.; Wang, H.Y.; Lei, Q.L.; Luo, J.F.; Lindsey, S.; Zhang, J.Z.; Zhai, L.M.; Wu, S.X.; Zhang, J.S.; Liu, X.X.; et al. Optimizing the nitrogen application rate for maize and wheat based on yield and environment on the Northern China Plain. Sci. Total Environ. 2018, 618, 1173–1183. [Google Scholar] [CrossRef]
  45. Lu, J.S.; Hu, T.T.; Geng, C.M.; Cui, X.L.; Fan, J.L.; Zhang, F.C. Response of yield, yield components and water-nitrogen use efficiency of winter wheat to different drip fertigation regimes in Northwest China. Agric. Water Manag. 2021, 255, 107034. [Google Scholar] [CrossRef]
  46. Ju, C.; Buresh, R.J.; Wang, Z.; Zhang, H.; Liu, L.; Yang, J.C.; Zhang, J.H. Root and shoot traits for rice varieties with higher grain yield and higher nitrogen use efficiency at lower nitrogen rates application. Field Crops Res. 2015, 175, 47–55. [Google Scholar] [CrossRef]
  47. Nehe, A.S.; Misra, S.; Murchie, E.H.; Chinnathambi, K.; Singh, T.B.; Foulkes, M.J. Nitrogen partitioning and remobilization in relation to leaf senescence, grain yield and protein concentration in Indian wheat cultivars. Field Crops Res. 2020, 251, 107778. [Google Scholar] [CrossRef] [PubMed]
  48. Wang, Y.Y.; Hsu, P.K.; Tsay, Y.F. Uptake, allocation and signaling of nitrate. Trends Plant Sci. 2012, 17, 458–467. [Google Scholar] [CrossRef] [PubMed]
  49. Li, J.P.; Xu, X.X.; Lin, G.; Wang, Y.Q.; Liu, Y.; Zhang, M.; Zhou, J.Y.; Wang, Z.M.; Zhang, Y.H. Micro-irrigation improves grain yield and resource use efficiency by co-locating the roots and n-fertilizer distribution of winter wheat in the North China Plain. Sci. Total Environ. 2018, 643, 367–377. [Google Scholar] [CrossRef] [PubMed]
  50. Zhang, X.; Gu, B.; van Grinsven, H.; Lam, S.K.; Liang, X.; Bai, M.; Chen, D. Societal benefits of halving agricultural ammonia emissions in China far exceed the abatement costs. Nat. Commun. 2020, 11, 4357. [Google Scholar] [CrossRef]
  51. Crusciol, C.A.C.; Almeida, D.S.; Alves, C.J.; Soratto, R.P.; Krebsky, E.O.; Spolidorio, E.S. Can micronized sulfur in urea reduce ammoniacal nitrogen volatilization and improve maize grain yield? J. Soil Sci. Plant Nutr. 2019, 19, 701–711. [Google Scholar] [CrossRef]
  52. Abubakar, S.A.; Hamani, A.; Chen, J.; Traore, A.; Abubakar, N.A.; Ibrahim, A.U.; Wang, G.S.; Gao, Y.; Duan, A. Optimized drip fertigation scheduling improves nitrogen productivity of winter wheat in the North China Plain. J. Soil Sci. Plant Nutr. 2022, 22, 2955–2968. [Google Scholar] [CrossRef]
Figure 1. Meteorological conditions during the growth stage of wheat.
Agronomy 14 02197 g001
Figure 2. The design of field plots and N management practices.
Agronomy 14 02197 g002
Figure 3. Effect of N management practices on canopy photosynthetic effective radiation interception rate. N0, no N application; N1, N application rate of 150 kg ha−1; N2, N application rate of 210 kg ha−1; N3, N application rate of 270 kg ha−1; T, traditional fertilization method; F, fertigation. Different letters indicate statistically significant differences (p < 0.05).
Agronomy 14 02197 g003
Figure 4. Photosynthetic parameters of wheat flag leaves after anthesis under different treatments. Net photosynthetic rate of flag leaves in 2022–2023 (a) and 2023–2024 (b); Stomatal conductance of flag leaves in 2022–2023 (c) and 2023–2024 (d); Transpiration rate of flag leaves in2022–2023 (e) and 2023–2024 (f); Intercellular CO2 concentration of flag leaves in 2022–2023 (g) and 2023–2024 (h). N0, no N application; N1, N application rate of 150 kg ha−1; N2, N application rate of 210 kg ha−1; N3, N application rate of 270 kg ha−1; T, traditional fertilization method; F, fertigation. Different letters indicate statistically significant differences (p < 0.05).
Agronomy 14 02197 g004
Figure 5. Sucrose content (a) and sucrose phosphate synthase activity (b) of wheat flag leaves after anthesis under different treatments. N0, no N application; N1, N application rate of 150 kg ha−1; N2, N application rate of 210 kg ha−1; N3, N application rate of 270 kg ha−1; T, traditional fertilization method; F, fertigation. Different letters indicate statistically significant differences (p < 0.05).
Agronomy 14 02197 g005
Figure 6. Dry matter accumulation at maturity under different treatments in 2022–2023 (a) and 2023–2024 (b). N0, no N application; N1, N application rate of 150 kg ha−1; N2, N application rate of 210 kg ha−1; N3, N application rate of 270 kg ha−1; T, traditional fertilization method; F, fertigation. Different letters indicate statistically significant differences (p < 0.05).
Agronomy 14 02197 g006
Figure 7. Grain filling characteristics under different treatments. N0, no N application; N1, N application rate of 150 kg ha−1; N2, N application rate of 210 kg ha−1; N3, N application rate of 270 kg ha−1; T, traditional fertilization method; F, fertigation.
Agronomy 14 02197 g007
Figure 8. The N agronomic efficiency and water use efficiency under different treatments. N0, no N application; N1, N application rate of 150 kg ha−1; N2, N application rate of 210 kg ha−1; N3, N application rate of 270 kg ha−1; T, traditional fertilization method; F, fertigation. Different letters indicate statistically significant differences (p < 0.05).
Agronomy 14 02197 g008
Table 1. Yield components and grain yield under different treatments.
YearTreatmentGrain YieldSpike NumberGrain Number per Spike1000-Grain Weight
(kg ha−1)(×104 ha−1) (g)
2022–2023TN06656.04 ± 155.77 g488.07 ± 15.89 e35.61 ± 0.54 e43.51 ± 0.09 a
FN06672.03 ± 112.55 g485.33 ± 2.31 e35.60 ± 0.53 e43.50 ± 0.23 a
TN18265.19 ± 89.28 f532.08 ± 4.00 d38.89 ± 0.35 d43.24 ± 0.12 a
FN18696.97 ± 10.89 e524.00 ± 4.00 d40.61 ± 0.54 c43.37 ± 0.12 a
TN29963.57 ± 53.08 d592.00 ± 4.00 c43.26 ± 0.13 a42.41 ± 0.02 b
FN211,019.41 ± 17.71 a637.33 ± 4.62 a b43.56 ± 0.51 a43.44 ± 0.07 a
TN310,256.69 ± 56.82 c628.00 ± 0.00 b42.00 ± 0.05 b41.91 ± 0.22 c
FN310,669.20 ± 14.49 b646.67 ± 4.62 a42.90 ± 0.46 a41.92 ± 0.27 c
2023–2024TN06964.04 ± 28.55 f373.33 ± 2.31 e42.24 ± 0.08 e48.80 ± 0.22 a
FN06989.93 ± 53.04 f380.00 ± 0.00 e41.93 ± 0.12 e48.92 ± 0.22 a
TN19299.09 ± 21.61 e511.33 ± 2.31 d43.70 ± 0.26 d47.18 ± 0.02 b
FN19698.86 ± 87.46 d512.00 ± 2.00 d45.13 ± 0.12 c47.50 ± 0.19 b
TN211,052.48 ± 122.29 c585.33 ± 2.31 c46.83 ± 0.58 b44.83 ± 0.20 d
FN212,493.13 ± 129.73 a650.67 ± 4.16 a47.33 ± 0.31 a45.45 ± 0.28 c
TN311,079.95 ± 102.93 c634.00 ± 5.29 b46.63 ± 0.23 b41.65 ± 0.34 e
FN311,356.57 ± 31.92 b657.33 ± 3.06 a46.60 ± 0.10 b41.59 ± 0.23 e
F-value
R713.13 **336.86 **83.02 **13.16 *
M3572.08 **2921.27 **316.06 **1247.94 **
R × M203.14 **29.10 **25.95 **22.40 **
N0, no N application; N1, N application rate of 150 kg ha−1; N2, N application rate of 210 kg ha−1; N3, N application rate of 270 kg ha−1; T, traditional fertilization method; F, fertigation; R, N rates; M, N application methods. Values followed by a different small letter were significantly different at p ≤ 0.05. Data were presented as mean values ± SD (n = 3). * Indicates significance at p level of 0.05. ** indicates significance at p level of 0.01.
Table 2. Dry matter assimilation after anthesis, remobilization of pre-anthesis stored assimilates and their contribution to grain in wheat under different treatments.
YearTreatmentRDMContribution of RDM to GrainDMAContribution of DMA to Grain
(kg ha−1)(%) (kg ha−1)(%)
2022–2023TN02277.04 ± 18.99 f34.43 ± 0.88 b4338.15 ± 147.02 e65.57 ± 0.88 d
FN02286.84 ± 69.87 f34.78 ± 1.39 b4289.16 ± 133.47 e65.22 ± 1.39 d
TN12790.68 ± 29.46 e35.65 ± 0.72 a5038.21 ± 118.75 d64.35 ± 0.72 e
FN12890.89 ± 4.67 d35.81 ± 0.77 a5185.40 ± 177.50 d64.19 ± 0.77 e
TN23110.27 ± 16.80 b32.74 ± 0.07 c6388.96 ± 38.92 c67.26 ± 0.07 c
FN23214.79 ± 27.11 a30.47 ± 0.42 d7336.88 ± 93.44 a69.53 ± 0.42 ab
TN32976.45 ± 7.76 c31.02 ± 0.33 d6618.68 ± 106.76 b68.98 ± 0.33 b
FN33014.96 ± 55.07 c29.63 ± 0.30 e7161.22 ± 50.16 a70.37 ± 0.30 a
2023–2024TN02904.39 ± 46.72 f43.13 ± 1.09 a3830.28 ± 110.29 g56.87 ± 1.09 d
FN02932.01 ± 37.69 f42.99 ± 0.83 a3888.50 ± 82.18 g57.01 ± 0.83 d
TN13166.92 ± 35.08 e34.33 ± 1.01 b6057.01 ± 65.36 f65.67 ± 1.01 c
FN13324.37 ± 46.22 d34.62 ± 1.04 b6279.48 ± 139.88 e65.38 ± 1.04 c
TN23654.47 ± 32.62 b33.98 ± 0.95 b7097.85 ± 81.64 d66.02 ± 0.95 c
FN23746.81 ± 46.83 a30.59 ± 0.47 d8501.03 ± 86.10 a69.41 ± 0.47 a
TN33405.56 ± 48.46 c31.61 ± 0.64 c7370.20 ± 146.46 c68.39 ± 0.64 b
FN33420.38 ± 13.56 c30.69 ± 1.05 d7725.89 ± 179.07 b69.31 ± 1.05 a
F-value
R31.71 **11.51 *139.15 **11.51 *
M842.54 **180.07 **1585.25 **180.07 **
R × M4.98 *6.94 *44.82 **6.94 *
N0, no N application; N1, N application rate of 150 kg ha−1; N2, N application rate of 210 kg ha−1; N3, N application rate of 270 kg ha−1; T, traditional fertilization method; F, fertigation; R, N rates; M, N application methods. Values followed by a different small letter were significantly different at p ≤ 0.05. Data were presented as mean values ± SD (n = 3). * Indicates significance at p level of 0.05. ** indicates significance at p level of 0.01.
Table 3. The grain filling process model and grain filling parameters under different treatments.
YearTreatmentGrowth Curve EquationTmax
(d)
T
(d)
Vmax
(mg grain−1 d−1)
D
(d)
2022–2023TN0Y = 43.88/(1 + 43.46 × e−0.26x)14.64 ± 0.00 e32.42 ± 0.01 d2.82 ± 0.00 a23.23 ± 0.01 d
FN0Y = 44.05/(1 + 44.94 × e−0.26x)14.64 ± 0.01 e32.42 ± 0.07 d2.85 ± 0.01 a23.13 ± 0.10 d
TN1Y = 42.89/(1 + 45.56 × e−0.24x)15.65 ± 0.01 d34.44 ± 0.10 c2.62 ± 0.01 d24.54 ± 0.14 bc
FN1Y = 43.75/(1 + 45.41 × e−0.24x)15.65 ± 0.01 d34.44 ± 0.07 c2.67 ± 0.01 c24.54 ± 0.08 b
TN2Y = 43.89/(1 + 51.88 × e−0.25x)15.95 ± 0.05 c34.44 ± 0.06 c2.71 ± 0.02 b24.24 ± 0.12 c
FN2Y = 44.46/(1 + 52.25 × e−0.24x)16.36 ± 0.01 b35.35 ± 0.10 b2.69 ± 0.02 bc24.74 ± 0.12 b
TN3Y = 42.72/(1 + 53.11 × e−0.23x)16.96 ± 0.04 a36.56 ± 0.20 a2.50 ± 0.02 e25.55 ± 0.21 a
FN3Y = 42.91/(1 + 54.47 × e−0.23x)17.07 ± 0.06 a36.66 ± 0.11 a2.51 ± 0.00 e25.55 ± 0.06 a
2023–2024TN0Y = 45.46/(1 + 40.21 × e−0.25x)14.63 ± 0.01 e32.83 ± 0.09 e2.87 ± 0.02 a23.76 ± 0.10 e
FN0Y = 45.29/(1 + 40.82 × e−0.25x)14.62 ± 0.03 e32.72 ± 0.10 e2.87 ± 0.01 a23.64 ± 0.09 e
TN1Y = 44.09/(1 + 45.95 × e−0.24x)15.87 ± 0.06 d34.93 ± 0.10 d2.66 ± 0.01 b24.88 ± 0.06 d
FN1Y = 44.01/(1 + 45.91 × e−0.24x)15.90 ± 0.01 d34.99 ± 0.04 d2.65 ± 0.00 b24.93 ± 0.05 d
TN2Y = 40.34/(1 + 51.49 × e−0.24x)16.65 ± 0.02 c36.07 ± 0.28 c2.39 ± 0.01 c25.35 ± 0.36 c
FN2Y = 41.76/(1 + 51.66 × e−0.23x)17.12 ± 0.05 b37.05 ± 0.09 b2.41 ± 0.01 c26.03 ± 0.06 b
TN3Y = 38.86/(1 + 52.41 × e−0.22x)17.76 ± 0.05 a38.37 ± 0.07 a2.17 ± 0.01 d26.91 ± 0.10 a
FN3Y = 39.10/(1 + 53.02 × e−0.22x)17.94 ± 0.01 a38.70 ± 0.07 a2.16 ± 0.01 d27.11 ± 0.10 a
F-value
R 325.10 **65.04 **4.56 *13.68 *
M 18,284.11 **3480.31 **3135.92 **694.36 **
R × M 126.84 **39.37 **1.8913.17 **
N0, no N application; N1, the N application rate of 150 kg ha−1; N2, the N application rate of 210 kg ha−1; N3, the N application rate of 270 kg ha−1; T, traditional fertilization method; F, fertigation; R, N rates; M, N application methods. Values followed by a different small letter were significantly different at p ≤ 0.05. Data were presented as mean values ± SD (n = 3). * Indicates significance at p level of 0.05. ** indicates significance at p level of 0.01.
Disclaimer/Publisher’s Note: The statements, opinions and data contained in all publications are solely those of the individual author(s) and contributor(s) and not of MDPI and/or the editor(s). MDPI and/or the editor(s) disclaim responsibility for any injury to people or property resulting from any ideas, methods, instructions or products referred to in the content.

