Article

The Genetic Diversity Assessment of Broomcorn Millet (Panicum miliaceum) and the Construction of a Mini-Core Collection

1
College of Biological Sciences and Technology, Yili Normal University, Yili 835000, China
2
Institute of Crop Sciences, Chinese Academy of Agricultural Sciences, Beijing 100081, China
3
College of Agriculture, Chifeng University, Chifeng 024000, China
*
Authors to whom correspondence should be addressed.
These authors contributed equally to this work.
Agronomy 2024, 14(10), 2226; https://doi.org/10.3390/agronomy14102226
Submission received: 29 July 2024 / Revised: 23 September 2024 / Accepted: 24 September 2024 / Published: 27 September 2024
(This article belongs to the Section Crop Breeding and Genetics)

Abstract

:
Broomcorn millet (Panicum miliaceum L.) is a crop with a good ability to adapt to the environment. Over 8800 accessions have been collected in the national gene bank of China. The huge quantity of germplasms made it difficult for analysis and evaluation. Although a broomcorn millet core collection (CC) comprising 780 accessions was established, the number is still too large for researchers to explore in depth. In this study, the genetic diversity of 634 broomcorn millet accessions from the core collection was analyzed based on SSR markers. A mini-core collection (MC) containing 256 accessions was extracted. The mini-core collection accounted for less than half of the original core collection and only about 2.8% of the total resources but still provided a good representation. In addition, the results of this study validated that Shanxi is the origin of broomcorn millet, and accessions from the South region may contain novel genes. In conclusion, this study provides a comprehensive characterization of the genetic diversities of broomcorn millet core collection in China. Moreover, an MC may aid in reasonably and efficiently selecting materials for broomcorn millet breeding as researchers could screen for aimed genetic characters within a smaller scope.

1. Introduction

Broomcorn millet (Panicum miliaceum L.) has been cultivated as a grain crop for more than 10,000 years [1]. The production of broomcorn millet is known as Xiaomi, a common coarse cereal, with plenty of dietary fiber, hypoallergenic proteins, and various essential amino acids for the human body [2]. It can be used to enrich people’s dietary structure. Broomcorn millet has a short growth cycle and low water and nutrient requirements, as well as high drought and salt resistance, allowing it to be cultivated at a wide range of altitudes, even on marginal agricultural land where other cereals do not succeed [3,4,5]. Therefore, broomcorn millet is very important for ensuring food supply and the sustainable development of the rural economy, especially in arid areas [6]. In addition, broomcorn millet can serve as a precious reserve of stress resistance genes as it shows resistance to severe environmental conditions and should be highly considered in crop breeding. China is the center of origin of broomcorn millet and has the largest germplasm collection of broomcorn millet in the world [7]. In China, the main production area of broomcorn millet is a zone along the Great Wall, including Inner Mongolia, Shaanxi, Shanxi, Gansu, Heilongjiang, and Ningxia provinces [8], and the total plant area has been maintained at about 1.5 million ha in recent decades with an average output at about 1955 kg/ha [9]. Inner Mongolia hosts the largest production area, which is about 330,000 ha [10].
At present, the national gene bank of China has collected more than 8800 accessions of broomcorn millet. Abundant germplasm resources provide a broad genetic foundation for breeding programs and genetic research. However, huge quantities of germplasm also render its preservation, evaluation, and utilization problematic and restrict its practical utilization in breeding [11]. The proposal for core collection provides a strategy to solve this problem. Core collections have been established for many crops [12], such as rice [13], barley [14], peanut [15], soybean [16], and faba bean [17]. This approach involves the selection of a subset from the entire germplasm collection and using a specific sampling method, which can represent the maximum phenotypic diversity, genetic diversity, and geographic distribution of total germplasm [18]. The number of accessions in a core collection usually accounts for 10–15% of the entire germplasm, but for some crops, it may still be too large for detailed identification and analyses. A mini-core collection extracted from the core collection often accounts for 1–2% of the complete germplasm collection and can still represent about 80–85% of the genetic diversity [19]. Mini-core collections have been extracted in studies of pigeon pea [20], sorghum [21], rice [22], and chickpea [19] and have been used to promote the detailed evaluation of morphological and genetic diversity of these crops.
For broomcorn millet, a core germplasm collection comprising 780 accessions has been established on the basis of 11 phenotypic traits, representing 9.73% of the original materials [23]. The main purpose for constructing the broomcorn millet core collection was to enable more efficient utilization of this germplasm. However, the number of broomcorn millet accessions in this core collection is still too large for researchers to explore it in depth. Until now, only a study of genetic diversity analysis of 118 accessions from the core collection using simple sequence repeat (SSR) markers has been reported [24]. But this study covered only about 15% of the core collection and its representativeness of the whole broomcorn millet germplasm was unknown. Other studies, including detailed identification of morphological traits and extensive analysis of molecular genetic diversity within the core collection, are still lacking. Therefore, more extensive studies are needed to evaluate the core collection and establish a mini-core collection to provide a theoretical basis for further research and make the utilization of broomcorn millet germplasm more practical.
In the present study, we first analyzed the genetic diversity among accessions from the broomcorn millet core collection in China using SSR markers. A total of 634 accessions were used in this study and accounted for more than 80% of the core collection. The aim was to comprehensively explore the characteristics of genetic diversity at the molecular level and provide a theoretical foundation for the effective conservation and utilization of broomcorn millet genetic resources. In addition, a mini-core collection consisting of 256 accessions (Table S1) was extracted from the core collection based on the SSR marker data. Mini-core collection will play an important role in future breeding programs and support the exploration of novel genes within the broomcorn millet genome.

2. Materials and Methods

2.1. Plant Materials

A total of 634 accessions of the broomcorn millet germplasm core collection in China were used in this study. Among these accessions, 622 of China landraces originated from 17 provinces that belong to seven agro-ecological zones, namely the Northeast ecotype (86), Mongolia Plateau (100), Northwest (84), North China Plain (75), Loss Plateau (257), Qinghai–Tibetan Plateau (16), and South ecotype (4). The remaining accessions came from foreign regions, including the Soviet Union (2), Poland (2), India (2), and USA (6). The accessions were divided into 17 groups according to their origin. Detailed information on the accessions is listed in Table 1.

2.2. DNA Extraction, PCR Amplification, and Electrophoresis

All accessions were reproduced for two generations at the Datong experimental station in order to obtain genetically pure seeds. The seeds were sown in plastic pots (10 cm diameter) and grown under greenhouse conditions. The total genomic DNA of each accession was extracted from young healthy leaves using the cetyltrimethylammonium bromide (CTAB) method. The DNA quality and concentration were evaluated on a NanoDrop ND-1000 spectrophotometer (NanoDrop, Wilmington, DE, USA). The final concentration of each DNA sample was adjusted to 30 ng µL−1.
Two hundred pairs of SSR primers that were developed in our laboratory were synthesized by Dingguo Gene Co. (Beijing, China) and used in this study. Polymerase chain reaction (PCR) amplification was conducted in 10 µL volumes containing 1 µL of 30 ng µL−1 genomic DNA, 0.5 µL of 5 µM solution of each primer, 1.6 µL of 10× PCR buffer (containing 20 mM Mg2+), 0.2 µL of each 10 mM dNTP, 0.1 µL of 5 U µL−1 Taq DNA polymerase, and 6.1 µL of ddH2O. Reactions were carried out in a PTC-100 Thermo-Cycler (MJ Research, Waltham, MA, USA). The PCR protocol consisted of initial denaturation at 94 °C for 5 min, followed by 39 cycles of denaturation at 94 °C for 45 s, annealing at 55 °C for 50 s, and extension at 72 °C for 1 min, and a final extension at 72 °C for 10 min.
The PCR products were size separated by 8% polyacrylamide gel electrophoresis, with DNA bands visualized by staining with silver nitrate in accordance with the protocol of Lin et al. [25]. Allele sizes were determined using a 50 bp DNA ladder (Tiangen, Beijing, China).

2.3. Molecular Data Analysis

Amplified DNA fragments were scored as 1 or 0 depending on the presence or absence of the band, respectively. The genetic parameters were calculated to estimate the genetic diversity, including the observed number of alleles (Na), the effective number of alleles (Ne), observed heterozygosity (Ho), expected heterozygosity (He), Nei’s gene diversity (H) [26], and the Shannon–Weaver index (I), which were calculated with POPGENE 1.31 [27]. The polymorphism information content (PIC) was calculated using PIC-CALC 0.6 software. An unweighted pair–group method with arithmetic averages (UPGMA) dendrogram was constructed using PowerMarker 3.25 and visualized with MEGA 4.1 [28]. The Factorial Correspondence Analysis (FCA) was assessed using Genetix version 4.03 [29].

2.4. Construction of the Mini-Core Collection from the Core Collection

According to the UPGMA cluster analysis result, a stratified sampling method was adopted based on the number of accessions and origin of each cluster in conjunction with pooling to construct the mini-core collection. The resulting mini-core collection was compared with the original core collection to assess its homogeneity as follows. The values of Na, Ne, H, I, and He for the mini-core collection were calculated, and the significance of differences in the genetic diversity parameters between the mini-core collection and the core collection was determined by pairwise Student’s t-tests.

3. Results

3.1. SSR Characterization of Broomcorn Millet Core Collection

Using 34 polymorphic SSR primer pairs (Table S2) selected from the preliminary screening, we detected a total of 101 alleles among the 634 studied accessions from the broomcorn millet core collection. Of these SSR markers, tri-allelic markers were the most frequent (13 SSR markers) and accounted for 38.2% of the total alleles scored after amplification (Table 2). Di-allelic SSRs were the second most frequent marker type and accounted for 35.3% of the total alleles. For seven markers, four alleles were detected, and for two SSR markers (LMX1072 and LMX2734), five alleles were detected. Details of polymorphism detected among the tested SSRs are given in Table 3. The average observed number of alleles (Na) per locus was 2.971, with a range of 2 (LMX334) to 5 (LMX1072). The mean effective number of alleles (Ne) was 2.209 per locus, with a range of 1.194 (LMX1940) to 4.141 (LMX1072), which accounted for 74.4% of the total observed alleles. Values of the Shannon–Weaver index (I) varied from 0.301 (LMX1940) to 1.487 (LMX1072) per locus, with an average of 0.843. The values of He and Ho ranged from 0.000 to 0.994 (mean = 0.334) and 0.463 to 0.759 (mean = 0.505), respectively. In the analyzed samples, the values of Na and Ne per locus were most strongly correlated with PIC (r = 0.966–0.993, p < 0.05), followed by I, He, and Ho.

3.2. Genetic Diversity of the Broomcorn Millet Core Collection

To estimate the genetic diversity of accessions in the broomcorn millet core collection, 634 analyzed accessions were subdivided into 17 groups on the basis of their provenance. The genetic parameters that were used for the evaluation of population diversity are listed in Table 4. The variation in Na between groups was relatively narrow and ranged from 1.546 (accessions from the Soviet Union) to 2.941 (accessions from Inner Mongolia and Gansu), with a mean of 2.496. Overall, the Na of domestic accessions (mean 2.710) was often higher than those that come from foreign sources (mean 1.800). The rank order of Ne in different populations was the Soviet Union < Poland < South region < USA < India < Qingzang < Xinjiang < Liaoning < Ningxia < Shaanxi < Gansu < Shandong < Hebei < Shanxi < Inner Mongolia < Heilongjiang < Jilin. The mean Ne value was 1.961 and foreign accessions often had lower Ne values than domestic accessions. The Shannon’s information index (I) values ranged from 0.3464 (the Soviet Union) to 0.8336 (Inner Mongolia), with a mean of 0.679. The I values of domestic accessions (mean 0.742) were significantly higher than those of exotic accessions (mean 0.463), which showed that the domestic accessions contained more abundant genetic diversity than the foreign accessions. The minimum and maximum observed heterozygosity (Ho) was 0.2279 from the South region and 0.4545 from India, and the range of expected heterozygosity (He) was 0.3333 from the Soviet Union to 0.5114 from Jilin, respectively. Overall, the Ho values of foreign accessions were higher than those of domestic accessions, whereas the He values showed the opposite pattern. The PIC values ranged between 0.088 (Gansu) and 0.556 (South region) with a mean of 0.421. The PIC values of all domestic accessions were higher than 0.421, whereas the PIC values of all foreign accessions were lower than 0.421. Among the domestic provenances, the rank order based on PIC was Gansu < Ningxia < Xinjiang < Shanxi < Hebei < Qingzang < Inner Mongolia < Shaanxi < Liaoning < Heilongjiang < Shandong < Jilin < South region. For foreign accessions, the rank order based on PIC was the Soviet Union < India < Poland and the USA.
The values of Na, Ne, I, and PIC were consistently higher for domestic provenances compared with those of foreign provenances. However, discordance in the variation patterns in Ho and He between domestic and foreign provenances was apparent. Overall, the parameters Na, Ne, Ho, and He revealed different aspects of the genetic characteristics of the provenances, whereas the parameters I and PIC were general estimates of the genetic diversity of the provenances. On the basis of these parameters, we concluded that the domestic populations contained more abundant genetic diversity than the foreign populations.

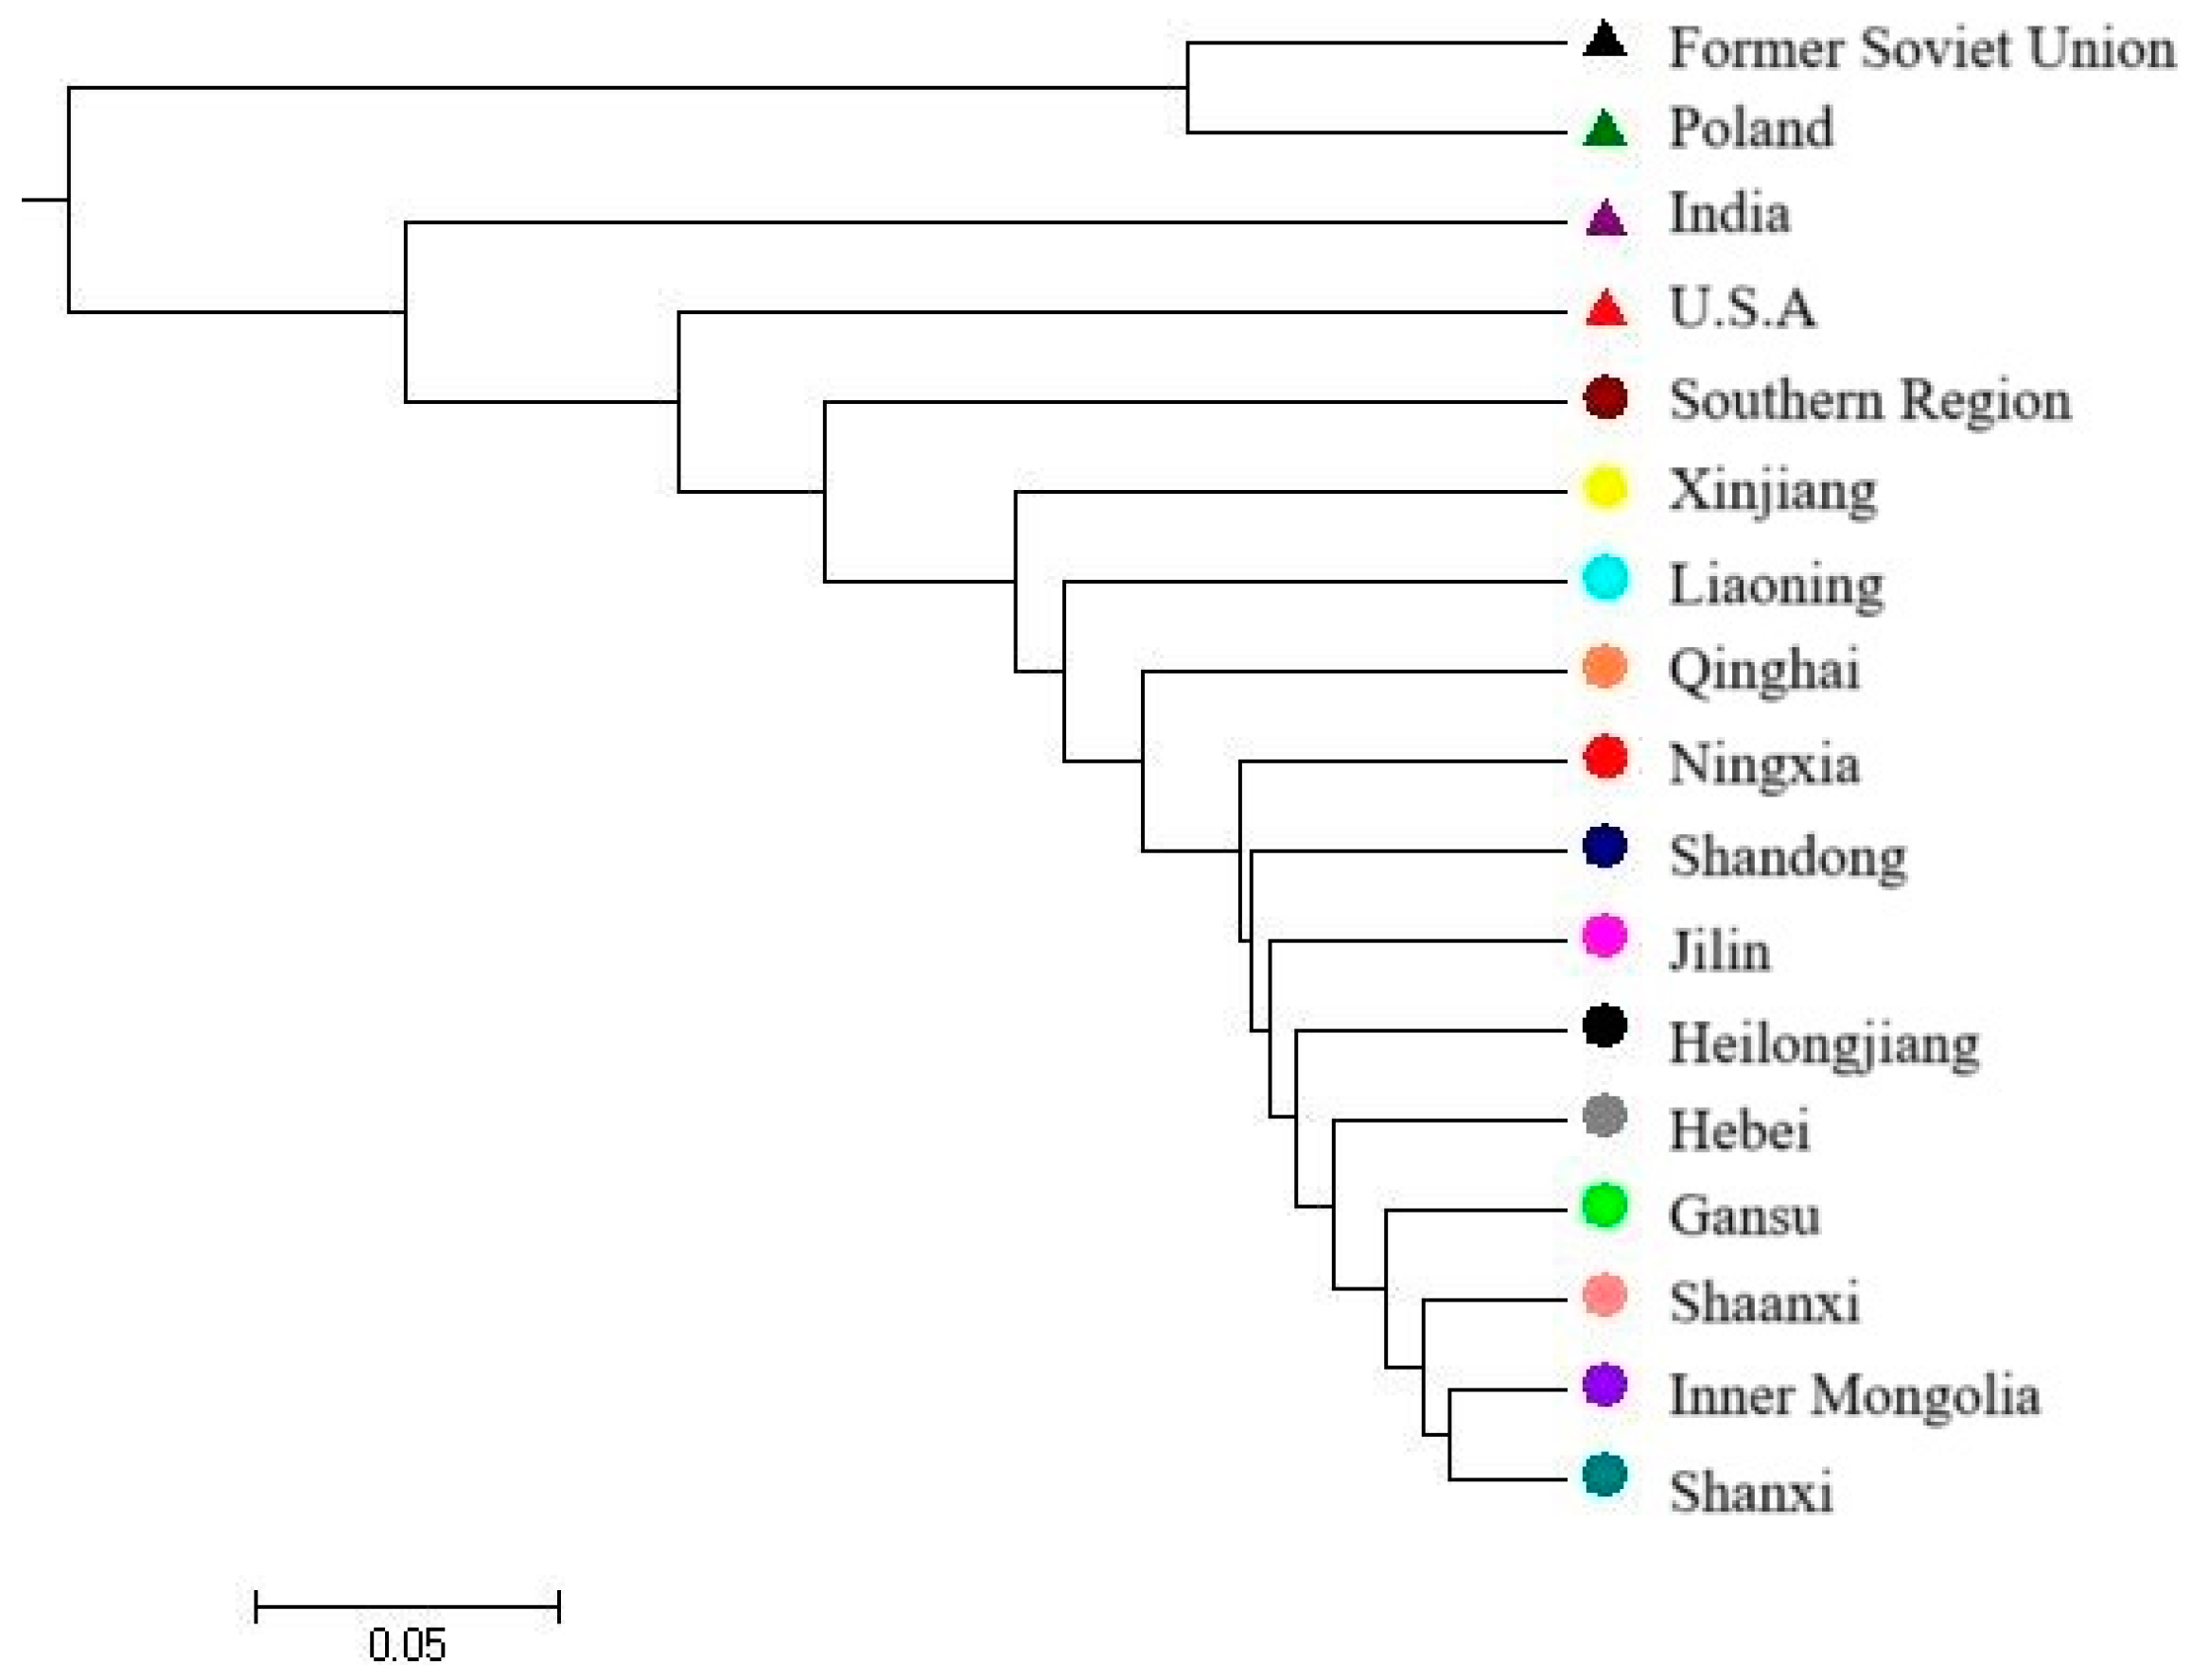
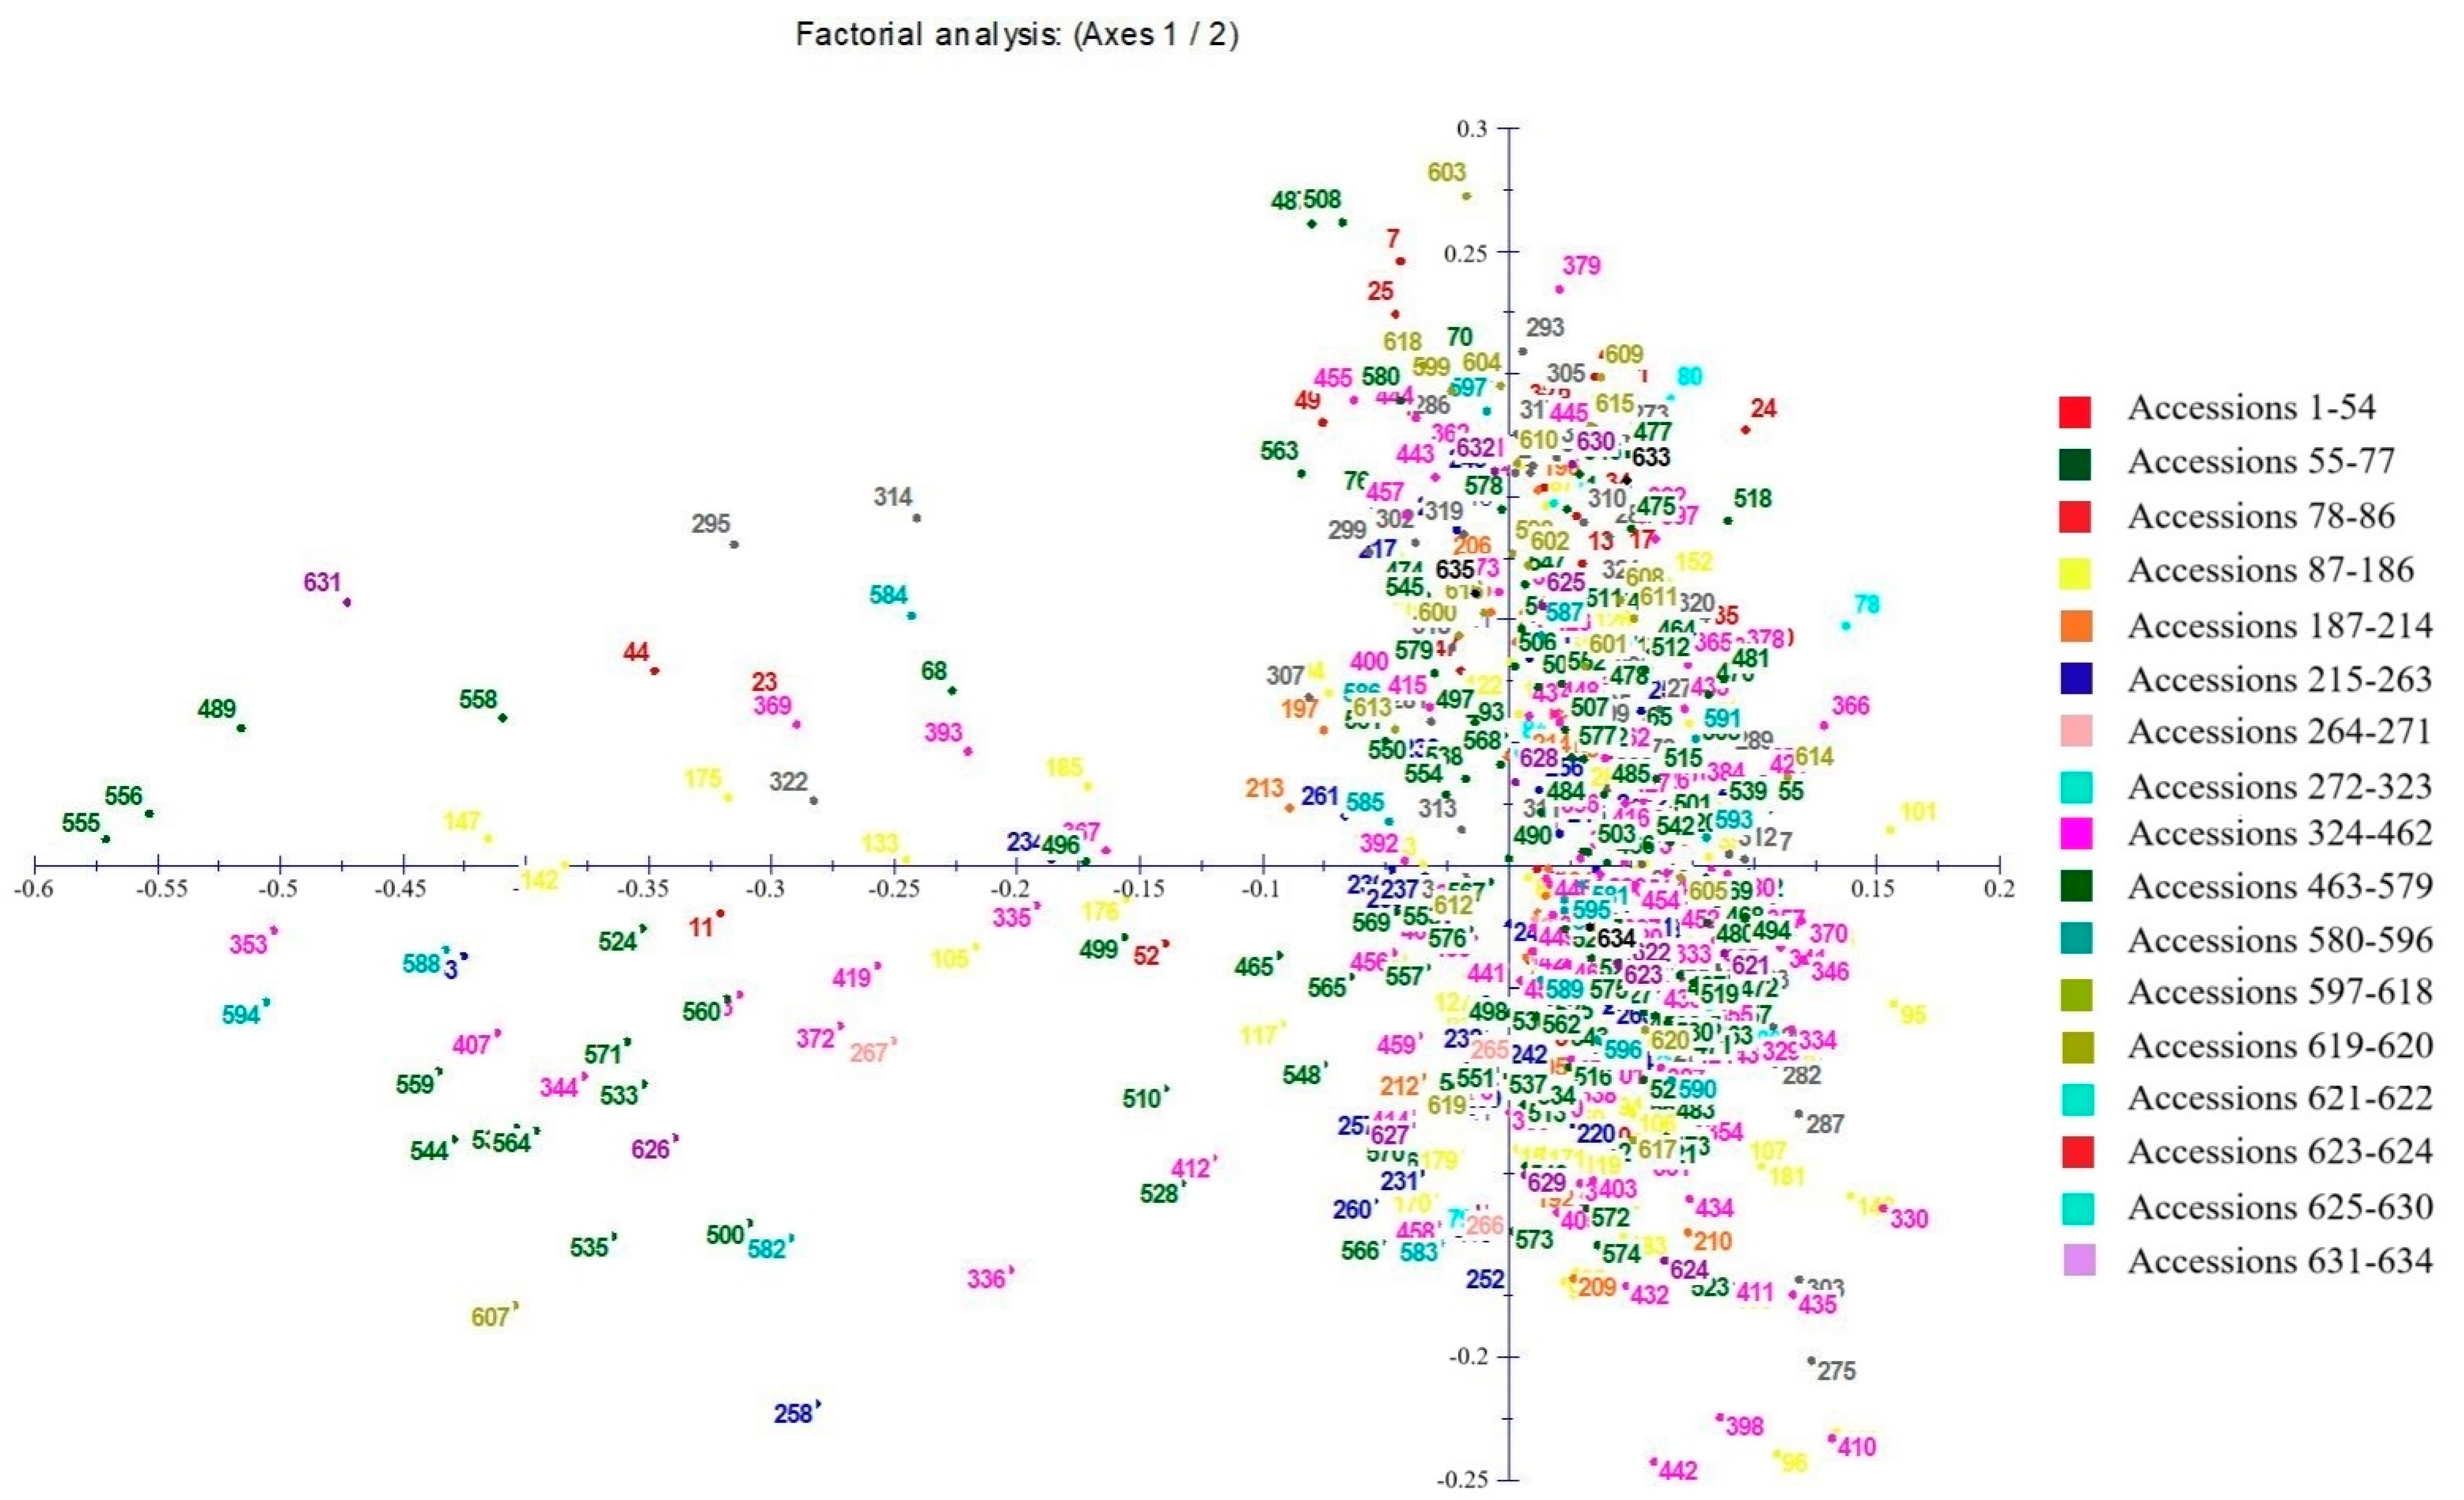
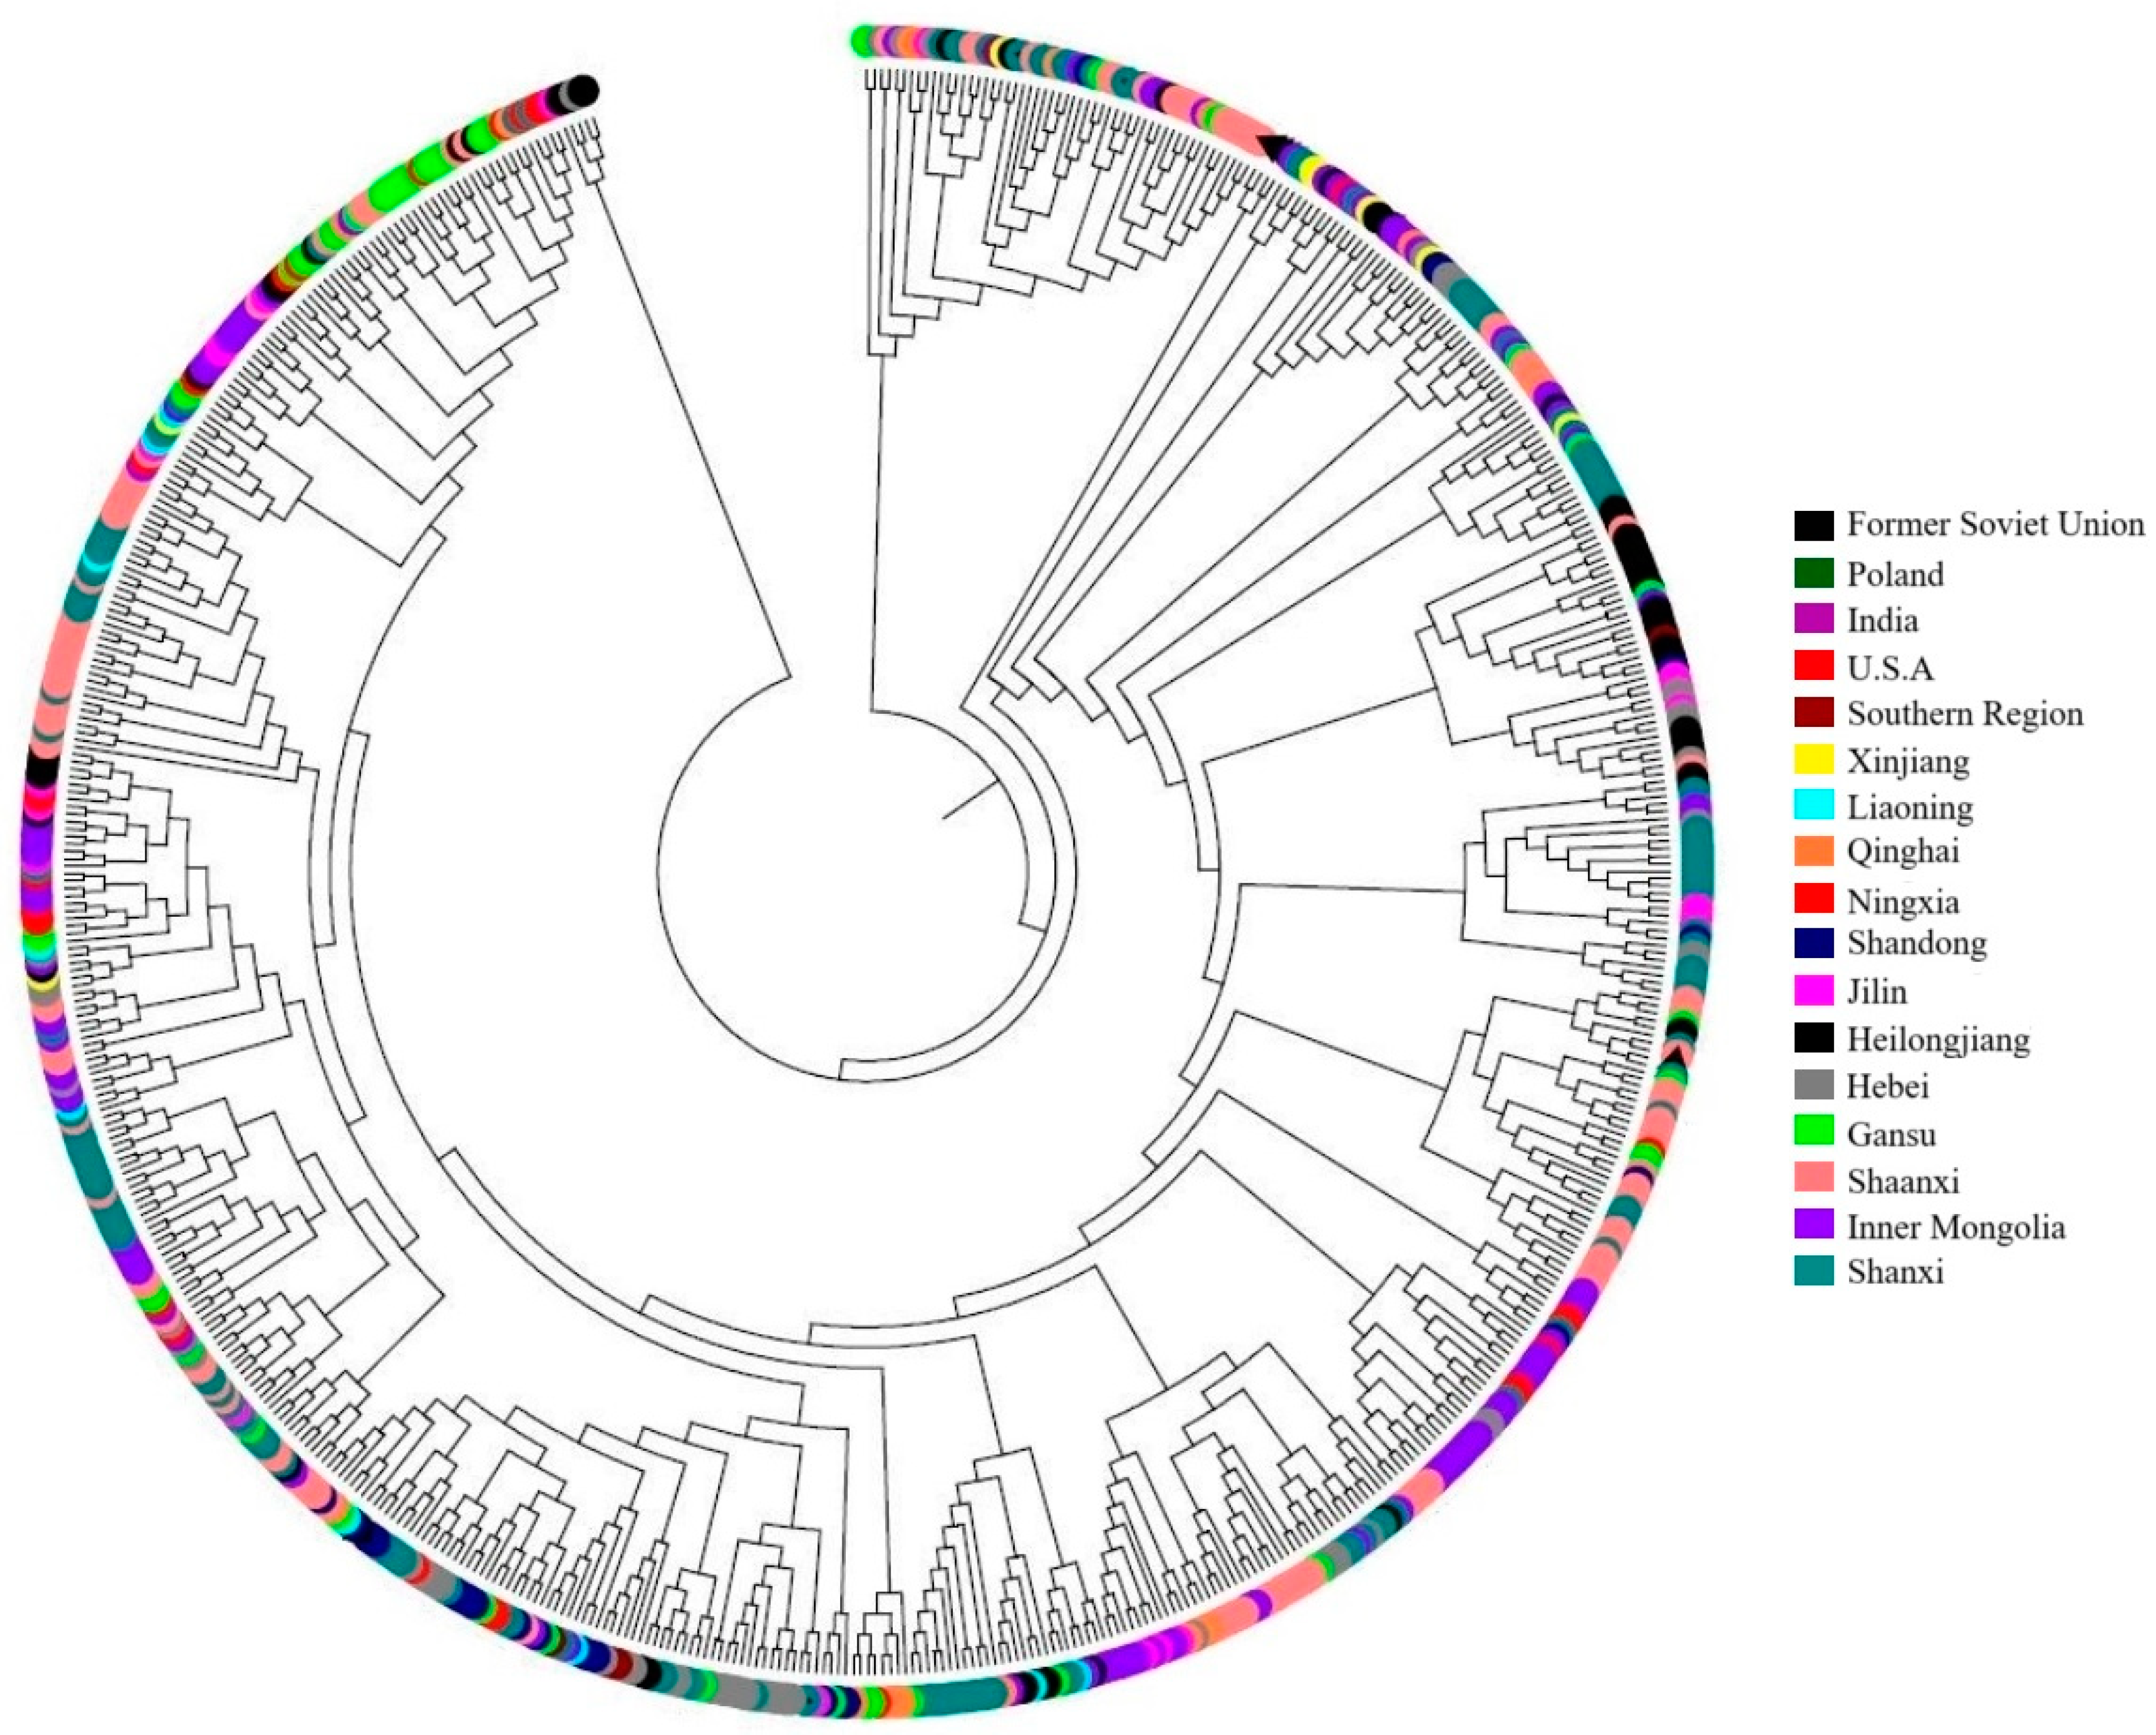
3.3. Genetic Similarity and Cluster Analysis of the Broomcorn Millet Core Collection

Genetic similarity and genetic distance were calculated to further elucidate the genetic relationships among accessions (Table 5). The average genetic similarity and average genetic distance among the 17 populations were 0.822 and 0.214, with ranges of 0.379–0.975 and 0.025–0.970, respectively. The greatest genetic distance was observed between the South region and Poland, followed by the distance between the South region and the Soviet Union. The smallest genetic distance was observed between Gansu and Ningxia and revealed the closest genetic relationship of accessions from the two provinces. The majority of genetic distance between domestic populations was less than 0.1 (except for values between the South region and other provinces, and the values between Xinjiang and Liaoning, Ningxia, Gansu, Qinghai, and Shandong, as well as values between Heilongjiang and Liaoning and Ningxia). In contrast, the genetic distance between domestic and foreign populations was dramatically higher, some of which are even as high as 0.6778 (between Heilongjiang and Poland). These results showed that much greater genetic distances existed between domestic and foreign populations than among domestic populations.
The UPGMA cluster analysis based on genetic similarity values was employed to construct a dendrogram of the 17 populations (Figure 1). The analyzed populations were divided into two discrete groups (groups I and II) at the genetic distance value of 0.065. Group I included Poland and the Soviet Union, and group II included all domestic populations as well as the Indian and USA populations. Group II was further subdivided into subgroup A (India), subgroup B (USA), subgroup C (South region), and subgroup D (other domestic populations). According to the result of the cluster, we found that the South region population and other domestic populations are the farthest genetically distinct; however, the Shanxi and Inner Mongolia populations showed the closest genetic relationship. This conclusion was in accordance with the geographic origin of these populations.
To study the spatial distribution of genetic variability among the 634 accessions of broomcorn millet core collection, factorial correspondence analysis (FCA) was undertaken (Figure 2). Most accessions were grouped on the right of the axis, and the distribution region is very narrow. The remaining accessions were distributed on the left of the axis dispersedly and evenly. This spatial distribution indicated the narrow genetic background of broomcorn millet germplasm. Moreover, accessions with the same geographic origin (collected from the same province) are not clustered together in the factorial correspondence analysis (FCA). This may be due to the selection of the accessions that have been carried out based on geographic distribution and can better represent all kinds of genetic variance of this crop. The UPGMA cluster analysis of the 634 accessions showed obscure clusters between populations, which was in accordance with the FCA results (Figure 3).

3.4. Mini-Core Collection Construction and Comparison with Core Collection

On the basis of the molecular marker data, a UPGMA dendrogram for all analyzed accessions of the core collection was constructed. The accessions were grouped into 35 clusters. According to the number and geographic origin of accessions in each cluster, about 30–50% of the accessions were selected and pooled to form the mini-core collection (Table 6). The composition of the mini-core collection was compared with that of the core collection. The percentage of populations in the mini-core collection was in accordance with those in the core collection. The mini-core collection comprised 256 accessions, including 18 accessions from Heilongjiang, 11 accessions from Jilin, 7 accessions from Liaoning, 35 accessions from Inner Mongolia, 16 accessions from Ningxia, 24 accessions from Gansu, 7 accessions from Xinjiang, 21 accessions from Hebei, 48 accessions from Shanxi, 37 accessions from Shaanxi, 9 accessions from Shandong, 12 accessions from Qingzang, 2 accessions from the South region and 9 accessions from foreign sources (consisting of 2 from the Soviet Union, 2 from Poland, 2 from India, and 3 from the USA).
A total of 100 observed alleles (Na) were amplified in the 256 accessions of the mini-core collection using 34 SSR markers, with a mean of 2.941 per marker, which was slightly lower than that observed in the core collection (Table 3). The mean effective number of alleles (Ne) in the mini-core collection was 2.250 per locus, which is higher than in the core collection and accounted for 76.5% of the total observed number of alleles. The values of I for the mini-core collection ranged from 0.333 (LMX1940) to 1.482 (LMX1072) per locus, with a mean of 0.861, and He and Ho ranged from 0.186 to 0.758 (mean = 0.516) and 0.186 to 0.760 (mean = 0.517), respectively. Differences in the genetic parameters between the core and mini-core collections were compared (Figure 4). The results of Student’s t-tests (Table 7) showed that Na, Ne, and I did not differ significantly (p = 0.893, 0.808, and 0.797, respectively) between the core and mini-core collections. Thus, the mini-core collection constructed here can represent more than 80% of the genetic diversity represented in the core collection.
The population genetic diversity of the mini-core collection was analyzed and compared with the core collection (Table 4). The observed number of alleles and effective number of alleles among mini-core collection ranged from 1.546 (the Soviet Union) to 2.912 (Shaanxi) and from 1.449 (the Soviet Union) to 2.249 (Jilin), respectively, which were similar to the values observed for the core collection. The I and PIC values in the mini-core collection were 0.668 and 0.421, respectively. Genetic diversity within the core and mini-core collections was compared (Figure 5). In addition, Student’s t-tests of differences in population genetic diversity showed no significant differences between the core and mini-core collections (Table 7). These results further validated the representativeness of the mini-core collection.

4. Discussion

In this present study, the genetic diversity value of accessions from Shanxi province was higher than that from most other provinces in China. This result is consistent with the study of Hu et al. [24], which indicated that Shanxi province may be the initial center of broomcorn millet, which then expanded to other regions. Accessions from the South region showed the highest genetic distance from other domestic groups. Therefore, broomcorn millet accessions from the South region may contain genetic resources that differ from other populations.
This current study extracted a mini-core collection of broomcorn millet from the core collection. The extraction method of mini-core collection varies widely among species. Kim et al. (2007) developed the PowerCore program using a heuristic algorithm to select a subset of accessions that show high genetic diversity and can represent the total coverage of marker alleles in the entire collection [30]. Zhao et al. (2009) selected 50 rice accessions from Korea, China, and Japan using the PowerCore program to construct a mini-core collection and analyzed the genetic diversity and population structure [31]. Zhang et al. (2012) used the PowerCore program to extract a sesame mini-core collection containing 184 accessions and the resulting collection was compared with that obtained by random selection [18]. An alternative strategy is to select accessions within clusters derived from the analysis of SSR or morphological marker data. For crops that contain abundant genetic resources, Spagnoletti and Qualset proposed that sampling randomly within clusters based on SSR marker data is the best sampling strategy [32]. Jiang et al. (2014) sampled 129 Chinese and 63 foreign faba bean genotypes randomly from clusters of a dendrogram that included 1075 genotypes to construct a mini-core collection [17]. In this present study, we also adopted the cluster sampling strategy and selected about 10% of accessions from each of the 35 clusters derived from SSR marker data. A total of 256 accessions were selected from the core collection to form a mini-core collection. The sample size was 68% smaller than the core collection and only accounted for 2.8% of the total resource.
For the mini-core collection, which is composed of the minimum number of accessions but retains the maximum genetic diversity represented in the core collection, it is necessary to evaluate and compare the genetic diversity within the core and mini-core collections. With developments in biotechnology, an increasing number of molecular markers are used for the validation of the mini-core collection. Li et al. (2003) considered that a genetic diversity index, frequency variance of phenotype and genotype, as well as the genotype retention ratio are the most important parameters to measure representativeness [33]. Jiang et al. (2014) used Na, Ne, and I as evaluation indices to validate the representativeness of a faba bean mini-core collection [17]. In the current study, the values of Na, Ne, and I of the broomcorn millet mini-core collection covered 98.9%, 101.9%, and 102.1% of the primary geographic core collection, respectively. No significant differences in genetic diversity between the primary geographic core collection and the mini-core collection were observed, which validated the representativeness of the mini-core collection.
The ultimate purpose for the construction of a core collection is to efficiently and effectively utilize crop genetic resources. Screening of elite germplasm from a core collection has been reported, such as the selection of germplasm for high aphid resistance from a rape core collection [34], downy mildew resistant germplasm from a bean core collection [35], and powdery mildew resistant germplasm from a cabbage-type rape core collection [36]. The construction of different ration core collections can provide multiple choices for different research purposes [37]. Thus, a core collection can provide guidance for the selection of suitable samples from the total germplasm resources to study a certain character. Core collections have been constructed for diverse applications, such as a mosaic virus core collection of soybeans [38], and a high protein content core collection of peanuts [39]. In the present study, a mini-core collection of broomcorn millet consisting of 256 accessions was extracted from a core collection. We envisage that this mini-core collection will play a vital role in the identification of characters, exploration of novel genes, genetic diversity analysis, and molecular marker-assisted breeding of broomcorn millet.

5. Conclusions

The results of this study supported that Shanxi is the origin of broomcorn millet and has the highest genetic diversity. Thus, broomcorn millet populations in Shanxi showed the highest potential values in crop breeding application. In addition, accessions from the South region may contain novel genes differing from other domestic populations. Therefore, the protection of germplasm from the South region is also important. A mini-core collection containing 256 accessions was extracted from the core collection. The mini-core collection accounted for less than half of the original core collection and only about 2.8% of the total resources but still provided a good representation. The development of a mini-core subset enables future detailed studies of the genetic variability of broomcorn millet as researchers could screen their aimed resources from a much smaller collection set.

Supplementary Materials

The following supporting information can be downloaded at: https://www.mdpi.com/article/10.3390/agronomy14102226/s1, Table S1: The list of the mini-core set; Table S2: Information of 34 SSR markers used in this study.

Author Contributions

Conceptualization, J.R., M.L. and J.X.; methodology, J.R. and X.W.; investigation, X.Y., Y.W., X.X., R.W. and Y.Z.; validation, X.Y., Y.W., X.X., R.W. and Y.Z.; data curation, X.Y., J.R., X.W., Y.W., X.X., R.W. and Y.Z.; visualization, X.Y.; writing—original draft. X.Y., review and editing, J.R.; formal analysis, X.W.; funding acquisition, M.L. and J.X.; project administration, M.L. and J.X.; resources, M.L. and J.X.; supervision, M.L. and J.X. All authors have read and agreed to the published version of the manuscript.

Funding

This research was funded by the Xinjiang Tianchi Talents Introduction Program, Yili Normal University Special Project for Introducing High-level Talents (2023RCYJ07), Natural Science Foundation of Inner Mongolia Autonomous Region (2023JQ10), National Key Research and Development Program Project (2023YFD1202703-2), National Natural Science Foundation of China (32241041).

Data Availability Statement

Data will be made available upon request.

Conflicts of Interest

The authors declare no conflicts of interest. The funders had no role in the design of the study; in the collection, analyses, or interpretation of data; in the writing of the manuscript; or in the decision to publish the results.

References

  1. Crawford, G.W. Agricultural origins in North China pushed back to the Pleistocene–Holocene boundary. Proc. Natl. Acad. Sci. USA 2009, 106, 7271–7272. [Google Scholar] [CrossRef] [PubMed]
  2. Gu, S.; Liu, S. Study on protein content and amino acid composition of Chinese foxtail millet. Acta Agric. Boreali-Sin. 1989, 4, 8–15. (In Chinese) [Google Scholar]
  3. Lágler, R.; Gyulai, G.; Humphreys, M.; Szabó, Z.; Horváth, L.; Bittsánszky, A.; Kiss, J.; Holly, L.; Heszky, L. Morphological and molecular analysis of common millet (P. miliaceum) cultivars compared to a DNA sample from the 15th century (Hungary). Euphytica 2005, 146, 77–85. [Google Scholar] [CrossRef]
  4. Liu, M.X.; Zhang, Z.W.; Wu, B.; Lu, P. Evaluation of Mixed Salt-Tolerance at Germination Stage and Seedling Stage and the Related Physiological Characteristics of Panicum miliaceum L. Sci. Agric. Sin. 2012, 18, 3733–3743. [Google Scholar]
  5. Liu, M.X.; Qiao, Z.J.; Zhang, S.; Wang, Y.Y.; Lu, P. Response of broomcorn millet (Panicum miliaceum L.) genotypes from semiarid regions of China to salt stress. Crop J. 2015, 3, 57–66. [Google Scholar] [CrossRef]
  6. Diao, X.M. Production and genetic improvement of minor cereals in China. Crop J. 2017, 5, 103–114. [Google Scholar] [CrossRef]
  7. Hunt, H.V.; Badakshi, F.; Romanova, O.; Howe, C.J.; Jones, M.K.; Heslop-Harrison, J.S.P. Reticulate evolution in Panicum (Poaceae): The origin of tetraploid broomcorn millet, P. miliaceum. J. Exp. Bot. 2014, 65, 3165–3175. [Google Scholar] [CrossRef]
  8. Wang, L.; Wang, X.Y.; Wen, Q.F. Research and utilization of proso millet germplasm resource in China. J. Plant Genet. Resour. 2005, 6, 471–474. [Google Scholar]
  9. Xiang, J.; Zhang, H.; Liu, H.; Suo, L.; Ja, S.; Zhang, Y.; Shi, J.; Hu, L.; Cal, Y. Comparison of phenotypic traits of foxtail millet germplasm resources in different ecological regions. J. Agric. Sci. Technol. 2020, 22, 31–41. (In Chinese) [Google Scholar]
  10. Dong, Y.C.; Zheng, D.S. Crops and Their Wild Relatives in China; China Agriculture Press: Beijing, China, 2006; pp. 331–359. [Google Scholar]
  11. Holden, J.H.W. The second ten years. In Crop Genetic Resources Conservation and Evaluation; Allen & Unwin: London, UK, 1984; pp. 277–285. [Google Scholar]
  12. Frankel, O.H. Genetic Manipulation: Impact on Man and Society; Cambridge University Press: Cambridge, UK, 1984; pp. 161–170. [Google Scholar]
  13. Zhang, H.L.; Zhang, D.L.; Wang, M.X.; Sun, J.L.; Qi, Y.W.; Li, J.J.; Wei, X.H.; Han, L.Z.; Qiu, Z.E.; Tang, S.X.; et al. A core collection and mini core collection of Oryza sativa L. in China. Theor. Appl. Genet. 2011, 122, 49–61. [Google Scholar] [CrossRef]
  14. Hintum, T.J.L. Comparison of marker systems and construction of a core collection in a pedigree of European spring barley. Theor. Appl. Genet. 1995, 89, 991–997. [Google Scholar] [CrossRef]
  15. Upadhyaya, H.D.; Ortiz, R.; Bramel, P.J.; Singh, S. Development of a groundnut core collection using taxonomical, geographical and morphological descriptors. Genet. Resour. Crop Evol. 2003, 50, 139–148. [Google Scholar] [CrossRef]
  16. Wang, L.X.; Guan, Y.; Guan, R.X.; Li, Y.H.; Ma, Y.S.; Dong, Z.M.; Liu, X.; Zhang, H.Y.; Zhang, Y.Q.; Liu, Z.X.; et al. Establishment of Chinese soybean (Glycine max) core collections with agronomic traits and SSR markers. Euphytica 2006, 151, 215–223. [Google Scholar] [CrossRef]
  17. Jiang, J.Y.; Yang, T.; Wang, F.; Fang, L.; Zhong, W.W.; Guan, J.P.; Zong, X.X. Genetic Diversity Analysis of Germplasm Resources and Construction of Mini-core Collections for Vicia faba L. at Home and Abroad. Acta Agron. Sin. 2014, 40, 1311–1319. [Google Scholar] [CrossRef]
  18. Zhang, Y.X.; Zhang, X.R.; Che, Z.; Wang, L.H.; Wei, W.L.; Li, D.H. Genetic diversity assessment of sesame core collection in China by phenotype and molecular markers and extraction of a mini-core collection. BMC Genet. 2012, 13, 102–115. [Google Scholar] [CrossRef]
  19. Upadhyaya, H.D.; Ortiz, R. A mini core subset for capturing diversity and promoting utilization of chickpea genetic resources in crop improvement. Theor. Appl. Genet. 2001, 102, 1292–1298. [Google Scholar] [CrossRef]
  20. Upadhyaya, H.D.; Reddy, L.J.; Gowda, C.L.L.; Reddy, K.N.; Singh, S. Development of a mini core subset for enhanced and diversified utilization of pigeon pea germplasm resources. Crop Sci. 2006, 46, 2127–2132. [Google Scholar] [CrossRef]
  21. Upadhyaya, H.D.; Pundir, R.P.S.; Dwivedi, S.L.; Gowda, C.L.L.; Reddy, V.G.; Singh, S. Developing a minicore collection of sorghum for diversified utilization of germplasm. Crop Sci. 2009, 49, 1769–1780. [Google Scholar] [CrossRef]
  22. Agrama, H.A.; Yan, W.G.; Lee, F.; Fjellstrom, R.; Chen, M.H.; Jia, M.; McClung, A. Genetic assessment of a mini–core subset developed from the USDA rice Genebank. Crop Sci. 2009, 49, 1336–1346. [Google Scholar] [CrossRef]
  23. Hu, X.Y.; Wang, L.; Zhang, Z.W.; Lu, P.; Zhang, H.S. Establishment of Broomcorn Millet Core Collection in China. Sci. Agric. Sin. 2008, 41, 3489–3502. [Google Scholar]
  24. Hu, X.Y.; Wang, J.F.; Lu PZhang, H.S. Assessment of genetic diversity in broomcorn millet (Panicum miliaceum L.) using SSR markers. J. Genet. Genom. 2009, 36, 491–500. [Google Scholar] [CrossRef] [PubMed]
  25. Lin, Z.X.; He, D.H.; Zhang, X.L.; Nie, Y.C.; Guo XPFeng, C.D.; Stewart, J.M. Linkage map construction and mapping QTL for cotton fiber quality using SRAP, SSR and RAPD. Plant Breed. 2005, 124, 180–187. [Google Scholar] [CrossRef]
  26. Nei, M. Analysis of gene diversity in subdivided populations. Proc. Natl. Acad. Sci. USA 1973, 70, 3321–3323. [Google Scholar] [CrossRef] [PubMed]
  27. Yeh, F.C.; Yang, R.C.; Boyle, T. POPGENE Software Package Version 1.31 for Population Genetic Analysis; University of Alberta: Edmonton, AB, Canada, 1999. [Google Scholar]
  28. Kumar, S.; Tamura, K.; Nei, M. MEGA3: Integrated software for molecular evolutionary genetics analysis and sequence alignment. Brief. Bioinform. 2004, 5, 150–163. [Google Scholar] [CrossRef] [PubMed]
  29. Belkhir, K.; Borsa, P.; Chikhi, L.; Raufaste, N.; Bonhomme, F. Genetix Version 4.05.2. 2001. Available online: http://www.univ-montp2.fr/*genetix/genetix/genetix.htm (accessed on 5 May 2004).
  30. Kim, K.W.; Chung, H.K.; Cho, G.T.; Ma, K.H.; Chandrabalan, D.; Gwag, J.G.; Kim, T.S.; Cho, E.G.; Park, Y.J. PowerCore: A program applying the advanced M strategy with a heuristic search for establishing core sets. Bioinformatics 2007, 23, 2155–2162. [Google Scholar] [CrossRef]
  31. Zhao, W.G.; Chung, J.W.; Ma, K.H.; Kim, T.S.; Kim, S.M.; Shin, D.I.; Kim, C.H.; Koo, H.M.; Park, Y.J. Analysis of genetic diversity and population structure of rice cultivars from Korea, China and Japan using SSR markers. Genes Genom. 2009, 31, 283–292. [Google Scholar] [CrossRef]
  32. Spagnoletti, Z.P.L.; Qualset, C.Q. Geographical diversity for quantitative spike characters in a worked collection of durum wheat. Crop Sci. 1987, 27, 235–241. [Google Scholar] [CrossRef]
  33. Li, Y.C.; Korol, A.B.; Fathima, T.; Belles, A.; Nevo, E. Microsatellites: Genomic distribution, putative functions and mutational mechanisms: A review. Mol. Ecol. 2002, 11, 2453–2465. [Google Scholar] [CrossRef]
  34. Ellis, P.R.; Pink, D.A.C.; Phelps, K.; Jukes, P.L.; Breeds, S.E.; Pinnegar, A.E. Evaluation of a core collection of Brassica oleracea accessions for resistance to Brevicoryne brassicae, the cabbage aphid. Euphytica 1998, 103, 149–160. [Google Scholar] [CrossRef]
  35. Miklas, P.N.; Delorme, R.; Hannan, R.; Dickson, M.H. Using a sub sample of the core collection to identify new sources of resistance to white mold in common bean. Crop Sci. 1999, 39, 569–573. [Google Scholar] [CrossRef]
  36. Santos, M.R.; Dias, J.S. Evaluation of a core collection of Brassica oleracea accessions for resistance to white rust of crucifers (Albugo candida) at the cotyledon stage. Genet. Resour. Crop Evol. 2004, 51, 713–722. [Google Scholar] [CrossRef]
  37. Qiu, L.J.; Li, Y.H.; Guan, R.X.; Liu, Z.X.; Wang, L.X.; Chang, R.Z. Establishment, representative testing and research progress of soybean core collection and mini core collection. Acta Agron. Sin. 2009, 35, 571–579. [Google Scholar] [CrossRef]
  38. Mi, S.J.; Qiu, L.J.; Chang, R.Z.; Hao, Z.B.; Guan, R.X. Genetic diversity analysis of varieties of Glycine max (L.) merr resistant to Soybean mosaic virus by SSR fingerprints. Acta Phytopathol. Sin. 2004, 34, 244–253. [Google Scholar] [CrossRef]
  39. Jiang, H.F.; Ren, X.P.; Liao, B.S.; Huang, J.Q.; Lei, Y.; Chen, B.Y.; Guo, B.Z.; Holbrook, C.C.; Upadhyaya, H.D. Peanut core collection established in China and compared with ICRISAT mini core collection. Acta Agron. Sin. 2008, 34, 25–30. [Google Scholar] [CrossRef]
Figure 1. UPGMA dendrogram of the 17 populations in the broomcorn millet core collection based on 34 SSR markers.
Agronomy 14 02226 g001
Figure 2. The factorial correspondence analysis (FCA) and its pattern of spatial distribution of genetic variability among 634 accessions of broomcorn millet core collection.
Agronomy 14 02226 g002
Figure 3. UPGMA dendrogram of the 634 accessions in the broomcorn millet core collection based on 34 SSR markers.
Agronomy 14 02226 g003
Figure 4. Genetic parameter comparison of 34 SSR markers in core collection and min-core collection.
Agronomy 14 02226 g004
Figure 5. Genetic diversity indices compare in core collection and mini-core collection.
Agronomy 14 02226 g005
Table 1. Information on the broomcorn millet core collection used in this study.
GroupAcc. No.OriginEcotype
154HeilongjiangNortheast
223JilinNortheast
39LiaoningNortheast
4100Inner MonogoliaMongolian Plateau
528NingxiaNorthwest
648GansuNorthwest
78XinjiangNorthwest
852Hebei, BeijingNorth China Plain
9139ShanxiLoess Plateau
10118ShannxiLoess Plateau
1116QingHai, XizangQinghai–Tibetan Plateau
1223ShandongNorth China Plain
132The Soviet UnionForeign
142PolandForeign
152IndiaForeign
166USAForeign
174Anhui, Jiangsu, HubeiSouth region
Table 2. Distribution of allelic variation in 34 polymorphic simple sequence repeat (SSR) loci.
Number of AllelesNumber of SSR LociPolymorphic Loci (%)
21235.3
31338.2
4720.6
525.9
Table 3. Genetic parameters of the 34 polymorphic simple sequence repeat markers used in core and mini-core collection of broomcorn millet.
SSR Primer PairNa aNe bI cHo dHe e
CCMCCCMCCCMCCCMCCCMC
lmx3342.0002.0001.7461.7350.6180.6150.0640.4250.4280.424
lmx5033.0003.0002.8232.8751.0691.0780.1260.6540.6470.652
lmx5103.0003.0002.3942.3880.9810.9780.2760.5830.5830.581
lmx5154.0003.0001.6661.7300.7220.7460.0780.4230.4000.422
lmx6193.0003.0001.2181.2820.3650.4430.0530.2210.1790.220
lmx6213.0003.0001.8992.0020.8260.8660.3670.5020.4740.501
lmx6303.0003.0002.1812.2260.8990.9170.6310.5520.5420.551
lmx6323.0003.0001.3991.5020.5540.6290.1360.3350.2860.334
lmx7463.0003.0001.7571.9710.7710.8570.1720.4940.4310.493
lmx7802.0002.0001.9761.9880.6870.6900.2530.4980.4940.497
lmx8363.0003.0002.0702.0890.8310.8570.0370.5220.5170.521
lmx8453.0003.0002.2042.2580.8750.9020.0450.5580.5470.557
lmx10653.0003.0002.2062.2950.9090.9300.2570.5660.5470.564
lmx10725.0005.0004.1414.1321.4871.4820.9920.7600.7590.758
lmx10804.0004.0002.0402.2210.8920.9600.0460.5510.5100.550
lmx13802.0002.0001.8591.9000.6550.6670.0140.4750.4630.474
lmx14292.0002.0002.0001.9970.6930.6920.0000.5000.5000.499
lmx15534.0004.0003.5933.6331.3271.3350.8830.7260.7220.725
lmx16102.0002.0001.9891.9990.6900.6930.2060.5010.4980.500
lmx16252.0002.0001.9811.9640.6880.6840.3970.4920.4960.491
lmx16724.0004.0003.0513.0941.2241.2350.8820.6780.6730.677
lmx17034.0004.0003.3833.4251.2951.3040.1080.7100.7050.708
lmx17614.0004.0002.7052.6831.1231.1150.9940.6290.6310.627
lmx19402.0002.0001.1941.2280.3010.3330.0000.1860.1630.186
lmx19593.0003.0002.2772.3140.8950.9110.1650.5690.5610.568
lmx20684.0004.0002.8962.8641.1771.1700.9530.6530.6550.651
lmx20742.0002.0001.6001.5230.5620.5270.0410.3440.3750.343
lmx22392.0002.0001.7601.7930.6230.6340.2430.4430.4320.442
lmx22812.0002.0001.6521.7330.5840.6140.0040.4240.3950.423
lmx22883.0003.0002.8662.8811.0761.0790.9790.6540.6520.653
lmx25512.0002.0001.2401.2930.3440.3870.1170.2270.1940.227
lmx27345.0005.0003.2433.3511.3361.3570.8740.7030.6920.702
lmx27822.0002.0002.0002.0000.6930.6930.8480.5010.5000.500
lmx29793.0003.0002.1052.1480.8930.9030.1190.5360.5250.535
Total101.000100.00075.11476.51528.66529.28111.36017.59317.17617.553
Mean2.9712.9412.2092.2500.8430.8610.3340.5170.5050.516
St.0.9040.8860.6980.6910.2940.2860.3580.1420.1500.141
Note: a, Na = observed number of alleles; b, Ne = effective number of alleles; c, I = Shannon’s Information index; d, Ho = observed heterozygosity; e, He = expected heterozygosity.
Table 4. Estimates of genetic diversity within 17 populations of core collection and mini-core collection.
PopulationNa *Ne *I *HoHeNei **PIC
CCMCCCMCCCMCCCMCCCMCCCMCCCMC
Heilongjiang2.7942.6772.2092.1650.7990.7850.3270.3430.4840.4900.4790.4750.5420.568
Jilin2.8242.7652.2252.2490.8210.8290.3430.3550.5110.5330.5000.5060.5490.565
Liaoning2.6182.5591.9982.0060.7150.7110.2960.3150.4560.4660.4300.4310.5260.522
Inner Mongolia2.9412.9122.1812.1450.8340.8270.3320.3500.5090.5100.5070.5010.4730.506
Ningxia2.7062.6772.0042.0370.7160.7370.3130.3170.4390.4610.4310.4450.1320.132
Gansu2.9412.8532.0652.1140.7750.7950.3570.3610.4700.4910.4640.4800.0880.088
Xinjiang2.6182.5881.9791.9870.7290.7230.3920.3760.4830.4830.4450.4420.1990.199
Heibei2.8822.7352.1372.2160.7990.8250.3120.3110.4880.5250.4830.5090.4160.315
Shanxi2.9122.8242.1412.2000.8070.8240.3460.3580.4860.5030.4840.4970.2500.200
Shannxi2.9122.9122.0412.0590.7720.7830.3370.3340.4640.4760.4610.4680.5210.525
Qingzang2.4712.4411.9511.9570.6790.6770.3320.3470.4380.4430.4200.4190.4220.422
Shandong2.7352.5002.1122.1250.7860.7530.2930.3020.4900.5000.4770.4720.5480.566
The Soviet Union1.5461.5461.4491.4490.3460.3460.3640.3640.3330.3330.2420.2420.4410.439
Poland1.5941.5941.5441.5440.3740.3740.4060.4060.3540.3540.2580.2580.5060.550
India2.0002.0001.8751.8750.5600.5600.4550.4550.4800.4800.3600.3600.4800.469
USA2.0631.7241.8041.6120.5700.4330.3280.3100.4110.4090.3640.2900.5060.543
South region1.8821.6471.6191.5180.4660.3740.2280.2010.3450.3010.2980.2490.5560.554
Mean2.4962.4091.9611.9560.6790.6680.3390.3410.4490.4560.4180.4140.4210.421
Note: Na, observed number of alleles; Ne, effective number of alleles; I, Shannon’s Information index; Ho, observed heterozygosity; He, expected heterozygosity; Nei, Nei’s genetic diversity; PIC, polymorphism information content; *, p < 0.05 (among populations); **, p < 0.01 (among populations).
Table 5. Nei’s genetic identity and genetic distance of 17 populations.
Pop ID1234567891011121314151617
1 0.95920.90040.93260.88920.92580.9150.9270.9390.91070.920.91430.590.5080.750.8570.8928
20.0417 0.92720.97330.93750.95180.9320.9460.9550.9390.9390.9370.6210.5610.7970.84920.8645
30.10490.0755 0.9390.93710.92950.8920.9450.9610.9550.920.94040.5960.5680.8090.77860.8173
40.06980.02710.063 0.9650.96980.9410.9540.9620.9640.9450.93770.6310.5910.820.84710.8434
50.11740.06460.0650.0356 0.97490.8780.9140.9290.97010.9320.93670.5470.510.8050.80730.8382
60.07710.04940.07310.03060.0254 0.90.9210.9380.97270.950.93480.6090.5590.8160.84570.86
70.08930.07080.11430.0610.13020.1051 0.9180.9350.91520.870.87290.6680.6190.7590.84580.7801
80.07610.05550.05640.04720.09050.08250.086 0.9520.93730.9460.94520.6110.5760.8210.83690.8717
90.06290.04610.04020.03910.07370.06360.0670.049 0.95820.9180.93960.6370.5750.7730.84580.8479
100.09350.06290.0460.03660.03030.02770.0890.0650.043 0.9240.94150.6140.5840.7950.83360.8506
110.08320.06350.08330.05680.07080.05170.140.0560.0850.079 0.93570.5980.5310.8220.83310.8418
120.08960.06510.06140.06440.06540.06740.1360.0560.0620.06030.066 0.6330.5950.8210.82530.8824
130.52790.47630.51710.45990.60290.49590.4040.4920.4510.48710.5140.4578 0.9470.6250.5290.4389
140.67780.57850.56570.52530.67430.58150.480.5510.5530.53850.6330.51960.055 0.6280.51260.3791
150.28730.22680.21210.19890.21660.20290.2760.1970.2570.22890.1960.19770.4690.465 0.67760.6937
160.15430.16350.25020.1660.2140.16760.1680.1780.1680.1820.1830.1920.6370.6680.389 0.8436
170.11340.14560.20180.17040.17650.15080.2480.1370.1650.16180.1720.12510.8230.970.3660.1701
Note: Nei’s genetic identity (above diagonal) and genetic distance (below diagonal).
Table 6. Material number, percentage, and origin of core collection and mini-core collection.
GroupCore CollectionMini-Core Collection
NumberPercentage in CC (%)NumberPercentage in MC (%)Percentage in Population of CC (%)
Heilongjiang548.49 188.837.0
Jilin233.62 113.939.1
Liaoning91.42 71.844.4
Inner Mongolia10015.72 3514.934.0
Ningxia284.40 164.839.3
Gansu487.55 248.339.6
Xinjiang81.26 72.675.0
Hebei528.18 218.336.5
Shanxi13921.86 4819.331.7
Shannxi11818.55 3716.231.4
Qingzang162.52 123.550.0
Shandong233.62 93.939.1
The Soviet
Union
20.31 20.450.0
Poland20.31 20.450.0
India20.31 20.450.0
USA60.94 30.933.3
South region40.63 21.375.0
Total634100%256100%
Table 7. T test for genetic parameter of SSR populations between CC and MC.
Genetic
Parameter
tdfp-ValueMean DifferenceSe Value95% Confidence Interval
Lower LimitLimit
SSRNa0.13666.00.8930.0290.217−0.4040.463
Ne−0.24466.00.808−0.0410.169−0.3780.295
I−0.25866.00.797−0.0180.070−0.1580.122
Ho−2.77566.00.007−0.1830.066−0.315−0.051
He−0.31466.00.754−0.0110.035−0.0820.059
Nei2.69566.00.0090.0950.0350.0250.165
PopulationNa0.52032.00.6070.0870.168−0.2550.430
Ne0.05132.00.9590.0040.085−0.1700.178
I0.19532.00.8460.0110.058−0.1060.129
Ho−0.14932.00.882−0.0030.018−0.0380.033
He−0.31832.00.753−0.0070.021−0.0500.037
Nei0.11032.00.9130.0030.031−0.0600.066
PIC0.11032.00.9130.0030.031−0.0600.066
Disclaimer/Publisher’s Note: The statements, opinions and data contained in all publications are solely those of the individual author(s) and contributor(s) and not of MDPI and/or the editor(s). MDPI and/or the editor(s) disclaim responsibility for any injury to people or property resulting from any ideas, methods, instructions or products referred to in the content.

