1. Introduction
Nitrous oxide (N
2O), the third most important greenhouse gas, is also an important indicator of biological nitrogen transformations [
1]. Because of the uncertainty regarding the sources of N
2O, an imbalance has long existed between estimates of N
2O sources and sinks in the Global Greenhouse Gas Inventory [
2,
3]. In the agroecosystem, soils are the main source of N
2O, which originates from microbial nitrification and denitrification, and are also regarded as the main N
2O source in inventory calculations of global N
2O emissions. Conversely, plants and mammals are considered uncertain sources of N
2O.
Li and Chen first provided an evidence that soybean plants could generate a considerable amount of N
2O during growth [
4,
5]. Since then, the N
2O fluxes from 17 species of plants were investigated by Hakata and colleagues, with 16 species of tested plants showing a tiny amount of N
2O emission [
6]. However, although plant-derived N
2O emission has been observed for years, plant-sourced N
2O had been always absent from the N
2O emission inventory [
1,
7].The reason is that the denitrification pathway and the source of N
2O generation in plant cell were still not completely understood [
4,
8].
In earlier literature, two hypotheses of plant N
2O emission were proposed. One hypothesis is that plants serve as a conduit of soil-sourced N
2O [
9], and the second hypothesis is that NO
2− assimilation by plants is the source of plant N
2O [
10]. Since nitrite is toxic to plants, plant NO
2− reduction probably occurs in the biochemical reaction sequence of “NO
2-NO-N
2O-N
2”, which provide a possibility for plants to emit N
2O [
11]. Studies have also clearly demonstrated that plants could potentially undertake denitrification to form N
2O from nitrate or nitrite [
12,
13].
Nevertheless, whether there is a complete denitrification pathway in plants has been a controversial topic [
14]. Evidence shows that the NO
2− level in plant cells is critical for the emission of N
2O from plants [
12]. However, a complete NO
2− reduction pathway in plant has not been recognized and characterized. In plant cells, nitrate could be reduced by the plant’s nitrate reductase (nr) and nitrite reductase (nir) to generate NO. Whereas, plant cells do not seem to have the ability to further reduce NO into N
2O. Evidences shows that no single gene encoding NO reductase (nor) was found in any plant genome [
15]. Previous results have also found that the fungal nitric oxide reductase gene (P450-
nor)-transfected tobacco BY-2 cell emits N
2O at a level 59 times higher than compared to the wild-type cell [
15]. This finding indicates that plant cell cultures are not capable of generating N
2O, except those under the help of an alien NO reductase.
However, plants are not unicellular organisms. Nowadays, plant holobiont is defined as a symbiont composed of microbial cells and plant cells. Microorganisms abundantly colonize all plant organs and tissues [
16]. Thus, the contribution to N
2O emissions by plant-associated microbes should be accounted for plant-based N
2O emissions. In this context, it has been shown that ammonia-oxidizing bacteria (AOB) on grass leaves may be an unrecognized source of N
2O, converting 0.02–0.42% of NH
3 to N
2O [
17]. This is the first report that in vitro microbes contribute to plant N
2O emissions. However, no study has been performed to discuss the relationship between plant endophytes and plant N
2O emissions so far.
It is currently postulated that plant tissues could provide denitrifying bacteria with an appropriate in vivo anaerobic environment [
18]. There are also earlier pieces of evidence showing that leaves of wheat (
Triticum aestivum L.) reduce nitrite and release N
2 [
14,
19], which suggests that plants may have denitrification ability and are thus capable of emitting N
2O as a final product. This prompted us to ask whether endophytic bacteria could help plant cells to establish a NO–N
2O reduction pathway by using their bacterial NO reductase and thus enabling N
2O emission. If this is so, then the existence of the endophytic denitrifying bacteria offers a possible explanation for denitrification in plants.
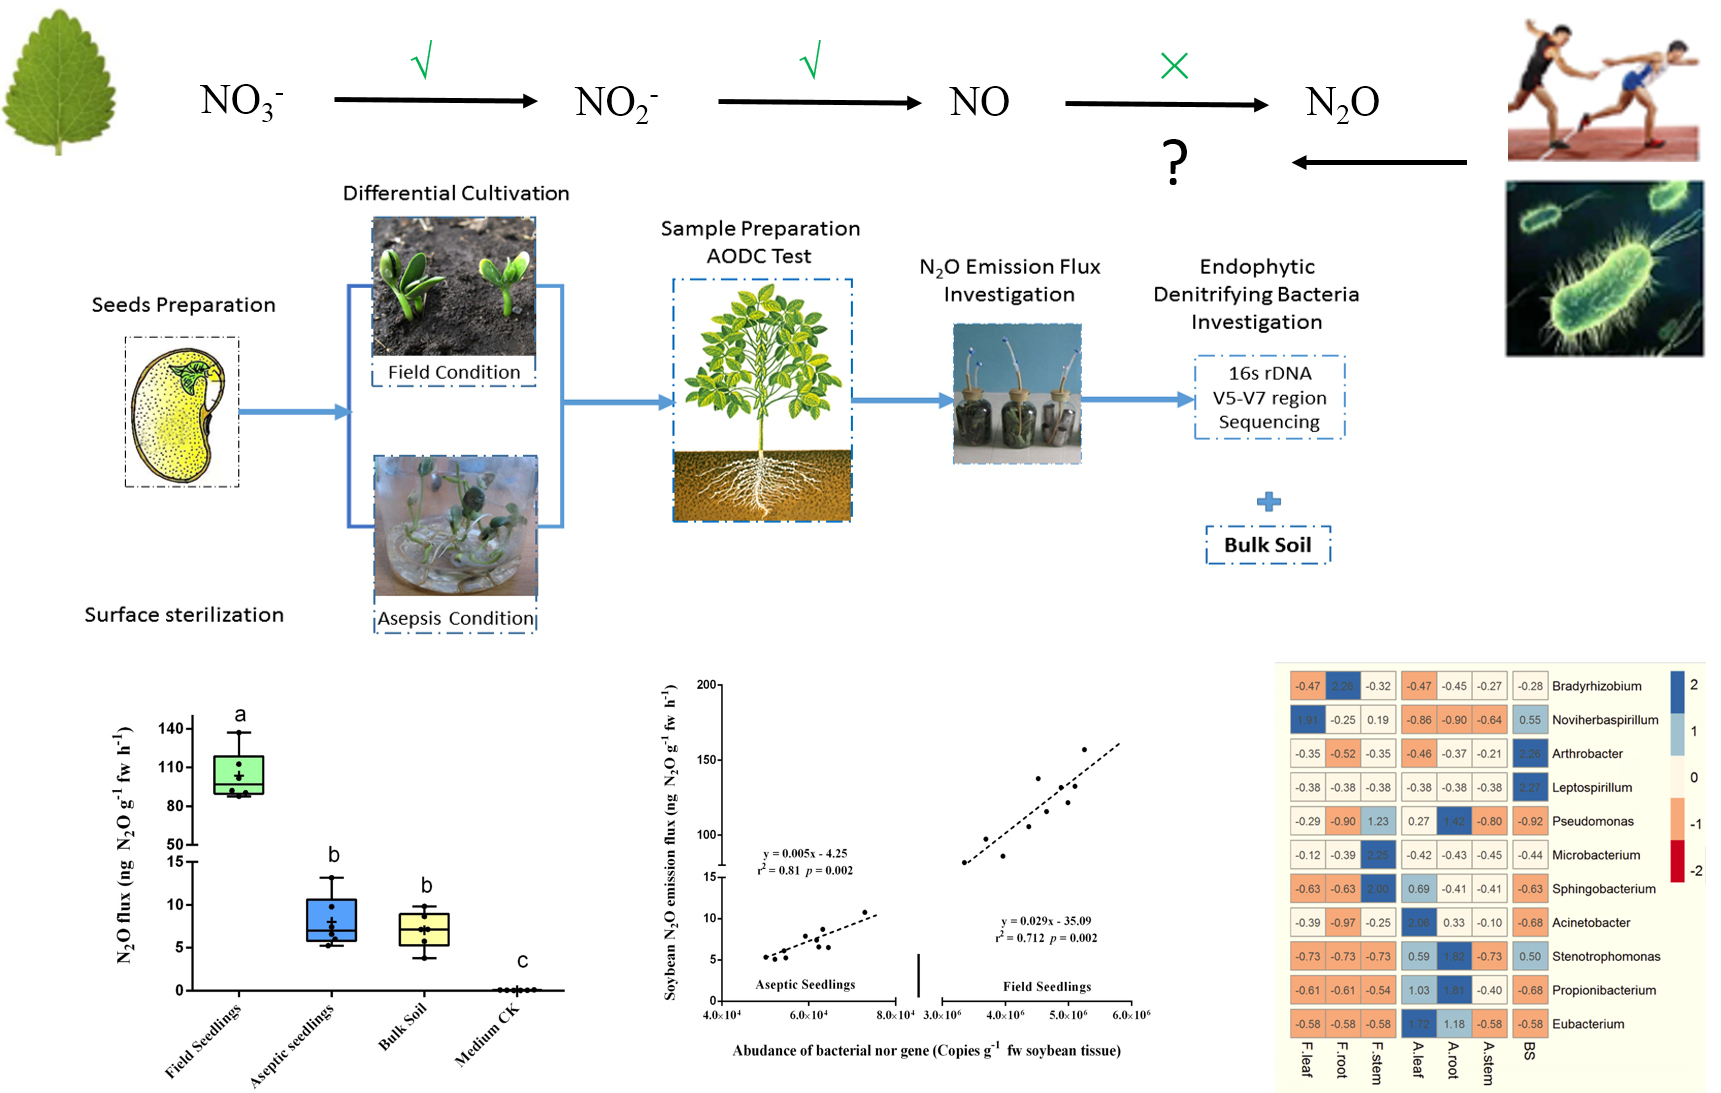
Based on all the above findings, we hypothesized that endophytic denitrifying microorganisms probably play a critical rule in the N2O emission of plant holobionts. Specifically, the N2O flux from plants may be affected by the abundance and composition of the endophytic denitrifying bacteria. To test this hypothesis, field-cultured soybean seedlings and aseptic seedlings were used to perform measurements on the plant holobiont with different endophytic microbiota. The N2O fluxes of young seedlings were measured and the composition and population of the endophytic denitrifying bacteria were investigated by 16s rDNA metagenomics sequencing. Finally, the abundance of the endophytic bacterial norB gene in plant cells was analyzed by using the real-time polymerase chain reaction (PCR). Correlation analysis was performed to test the relationship of the above factors.
2. Experiments
2.1. Plant Cultivation
Field-cultured seedlings were used to investigate the N2O flux from soybean plants under the intervention of soil microorganisms. Soil samples were collected before seeding from land being sown to serve as background controls. Surface-sterilized seedlings (surface-sterilized seeds were cultured in sterile soil under aseptic conditions) were grown to perform measurements of N2O flux from soybeans with only endophytic microbiota.
The experimental design is shown in
Figure 1 and was performed using the soybean variety “Tie Feng 31”, which is widely cultivated in northeast China. Field cultivation was performed at the Institute of Shenyang National Field Observation and Research Station of Shenyang Agroecosystem (41°31′ N, 123°24′ E). Soybeans were grown in brown earth soil (soil pH: 6.4, organic matter: 16.17 g·kg
−1, soil moisture: 45%, and total nitrogen: 0.67 g·kg
−1) and the average temperature of the sampled plot was 14–18 °C.
Aseptic seedlings were prepared as follows: First, all seeds were surface-sterilized, and the final wash buffer was tested by the Acridine Orange Direct Count (AODC) method to ensure that no viable microbes were left [
20]. Subsequently, the surface-sterilized seeds were aseptically transplanted into a germ-free potted system (diameter × height: 20 × 10 cm) that had been heat-sterilized at 121 °C for 45 min. Seedlings were then aseptically cultured and watered in a germ-free room that received purified air, 16 h of light at 25 °C and 8 h of dark at 20 °C at a relative humidity of 45%.
2.2. Sample Preparation and Determination of Plant Nitrite and N2O Emission
Surface soils (0–10 cm) of the field experiment zone were collected before seedling and marked as “BS” samples. Plant samples were collected on the 20th day after sowing. Field seedlings and the aseptic seedlings were freshly collected synchronously. In the latter, aseptic techniques were strictly followed to prevent the plant from being contaminated. To remove the plant-surface microorganisms, all plant samples were washed and surface sterilized immediately according to the method described by Xiao [
21]. The final wash buffer was tested by AODC to confirm all samples were superficially germ-free [
20]. Before the gas collection, sterilized plants were aseptically moved into a chamber unit which contained 0.5 kg of sterilized soil [
22]. This was to ensure the consistency of the N background for each test while eliminating soil microbes and their interference with N
2O emission. The gas samples in the chamber were collected and analyzed for N
2O concentration by gas chromatography (GC) on an Agilent 7890D platform [
23]. The flux of N
2O was measured using the methods previously described [
9]. The bacterial counts and the N
2O emission rate of the sterilized soil were independently tested by AODC and GC, respectively, to verify sample cleanliness and emission background.
The plant NO
2−-N concentrations in all samples were determined via a spectrophotometric method [
24] using an Multiskan FC Microplate Reader (Thermo Fisher Scientific, Waltham, MA, USA), while the NO
3−-N contents were analyzed through alkaline distillation.
2.3. Quantitative Real-Time PCR
After the determination N2O Emission, all plant samples were aseptically cut into three different parts: stem, leaf, and root. Subsequently, metagenomics’ DNA of all samples (plants and bulk soil) was all extracted using the Power Soil™ DNA Isolation Kit (Qiagen, Valencia, CA, USA).
The copy number of genes encoding bacterial nitric oxide reductase was determined in triplicate for the different samples by applying real-time Q-PCR using a Rotor-Gene 3000 real-time PCR system (Corbett Research Pty Ltd, Mortlake, Australia). Target sequences were amplified using the primer
norB-2F (5-GAC AAG NNN TAC TGG TGG T-3) and
norB-6R (5-GAA NCC CCA NAC NCC NGC T-3) [
25]. The thermal cycling program was as follows: 94 °C for 2 min, followed by 30 cycles of 94 °C for 30 s, 60 °C for 30 s, and 72 °C for 40 s. A total of 40 cycles were run using the annealing temperatures.
Each reaction was performed in 25 mL volume containing 1–10 ng of total DNA, 0.2 mM of each primer, and 12.5 mL of 2 × QuantiNova qPCR SYBR Green Master mix (Qiagen, Duesseldorf, Germany). Product specificity was tested and confirmed using melting curve analysis (65–95 °C, 0.5 °C per read, 2 s hold) and re-visualised on agarose gels, which showed specific product bands at the expected size of 400 ± 10 bps.
The target genes were subsequently connected with the pEASYTM-T5 plasmid vector (Transgene, Shenzhen, China) and then amplified in the E. coli host. Extracted plasmid vectors containing the target gene inserts were chosen as the standards for real-time PCR. The concentration of the extracted plasmid was measured using a NanoDrop spectrophotometer (Thermofisher, Waltham, MA, USA). The abundance of genes encoding bacterial nor were calculated from the concentration of extracted plasmid DNA. Ten-fold serial dilutions of a plasmid with a known copy number of the norB gene clones were generated to set up the standard curve (from 6.13 × 10³ to 6.13 × 10⁹ copies). High amplification efficiencies of 92.5% to 102.4% were obtained, with R2 = 0.99 and slopes from −2.8 to −3.2. The cycle threshold parameter (Ct) was determined as the cycle number at which a statistically significant increase in the reporter fluorescence was detected.
2.4. Investigation of the Denitrifying Bacteria
Denitrifying bacteria were measured by 16s rDNA metagenomics sequencing. The whole plant was crushed and mixed for DNA extraction. In addition, seedlings were also aseptically cut into 3 parts (i.e., stem, leaf, and root) to investigate the composition of denitrifying bacteria in the different organs. Total DNA of all samples was extracted using the PowerSoil™ DNA Isolation Kit (Qiagen, Valencia, CA, USA).
The hypervariable V5–V7 region of the 16s rRNA gene was chosen as the detection region in order to minimize the contamination from the chloroplast DNA homologue [
26]. Target sequences were amplified using the primer 799F (5′-AACMGGATTAGATACCCKG-3′) and 1193r (5′-ACGTCATCCCCACCTTCC-3′) [
26]. The thermal cycling program was as follows: 94 °C for 2 min, followed by 25 cycles of 94 °C for 30 s, 55 °C for 30 s, 72 °C for 1 min, with a final extension of 72 °C for 10 min. All libraries were sequenced on an Illumina Miseq 300PE platform at Allwegene Technology Inc. (
http://www.allwegene.com/, Beijing, China). High-quality sequences from all samples were clustered into Operational Taxonomic Units (OTUs) at 97% sequence similarity (OTU97) using the default QIIME pipeline. The representative sequences in each OTU97 were assigned to taxonomic groups using the SILVA classifier with an 80% confidence threshold.
The genera of denitrifying bacteria-related species were selected according to previous studies [
27]. Gap analysis and correlation analysis were performed by GraphPad 6 software (GraphPad Software Inc., San Diego, CA, USA), and the “Pheatmap” (v1.0.8) package in R (v3.0.3) software (The University of Auckland, Auckland, New Zealand) was used for heat map visualization. The sequencing data from this study was deposited in the European Nucleotide Archive under the study accession number PRJEB25047.
4. Discussion
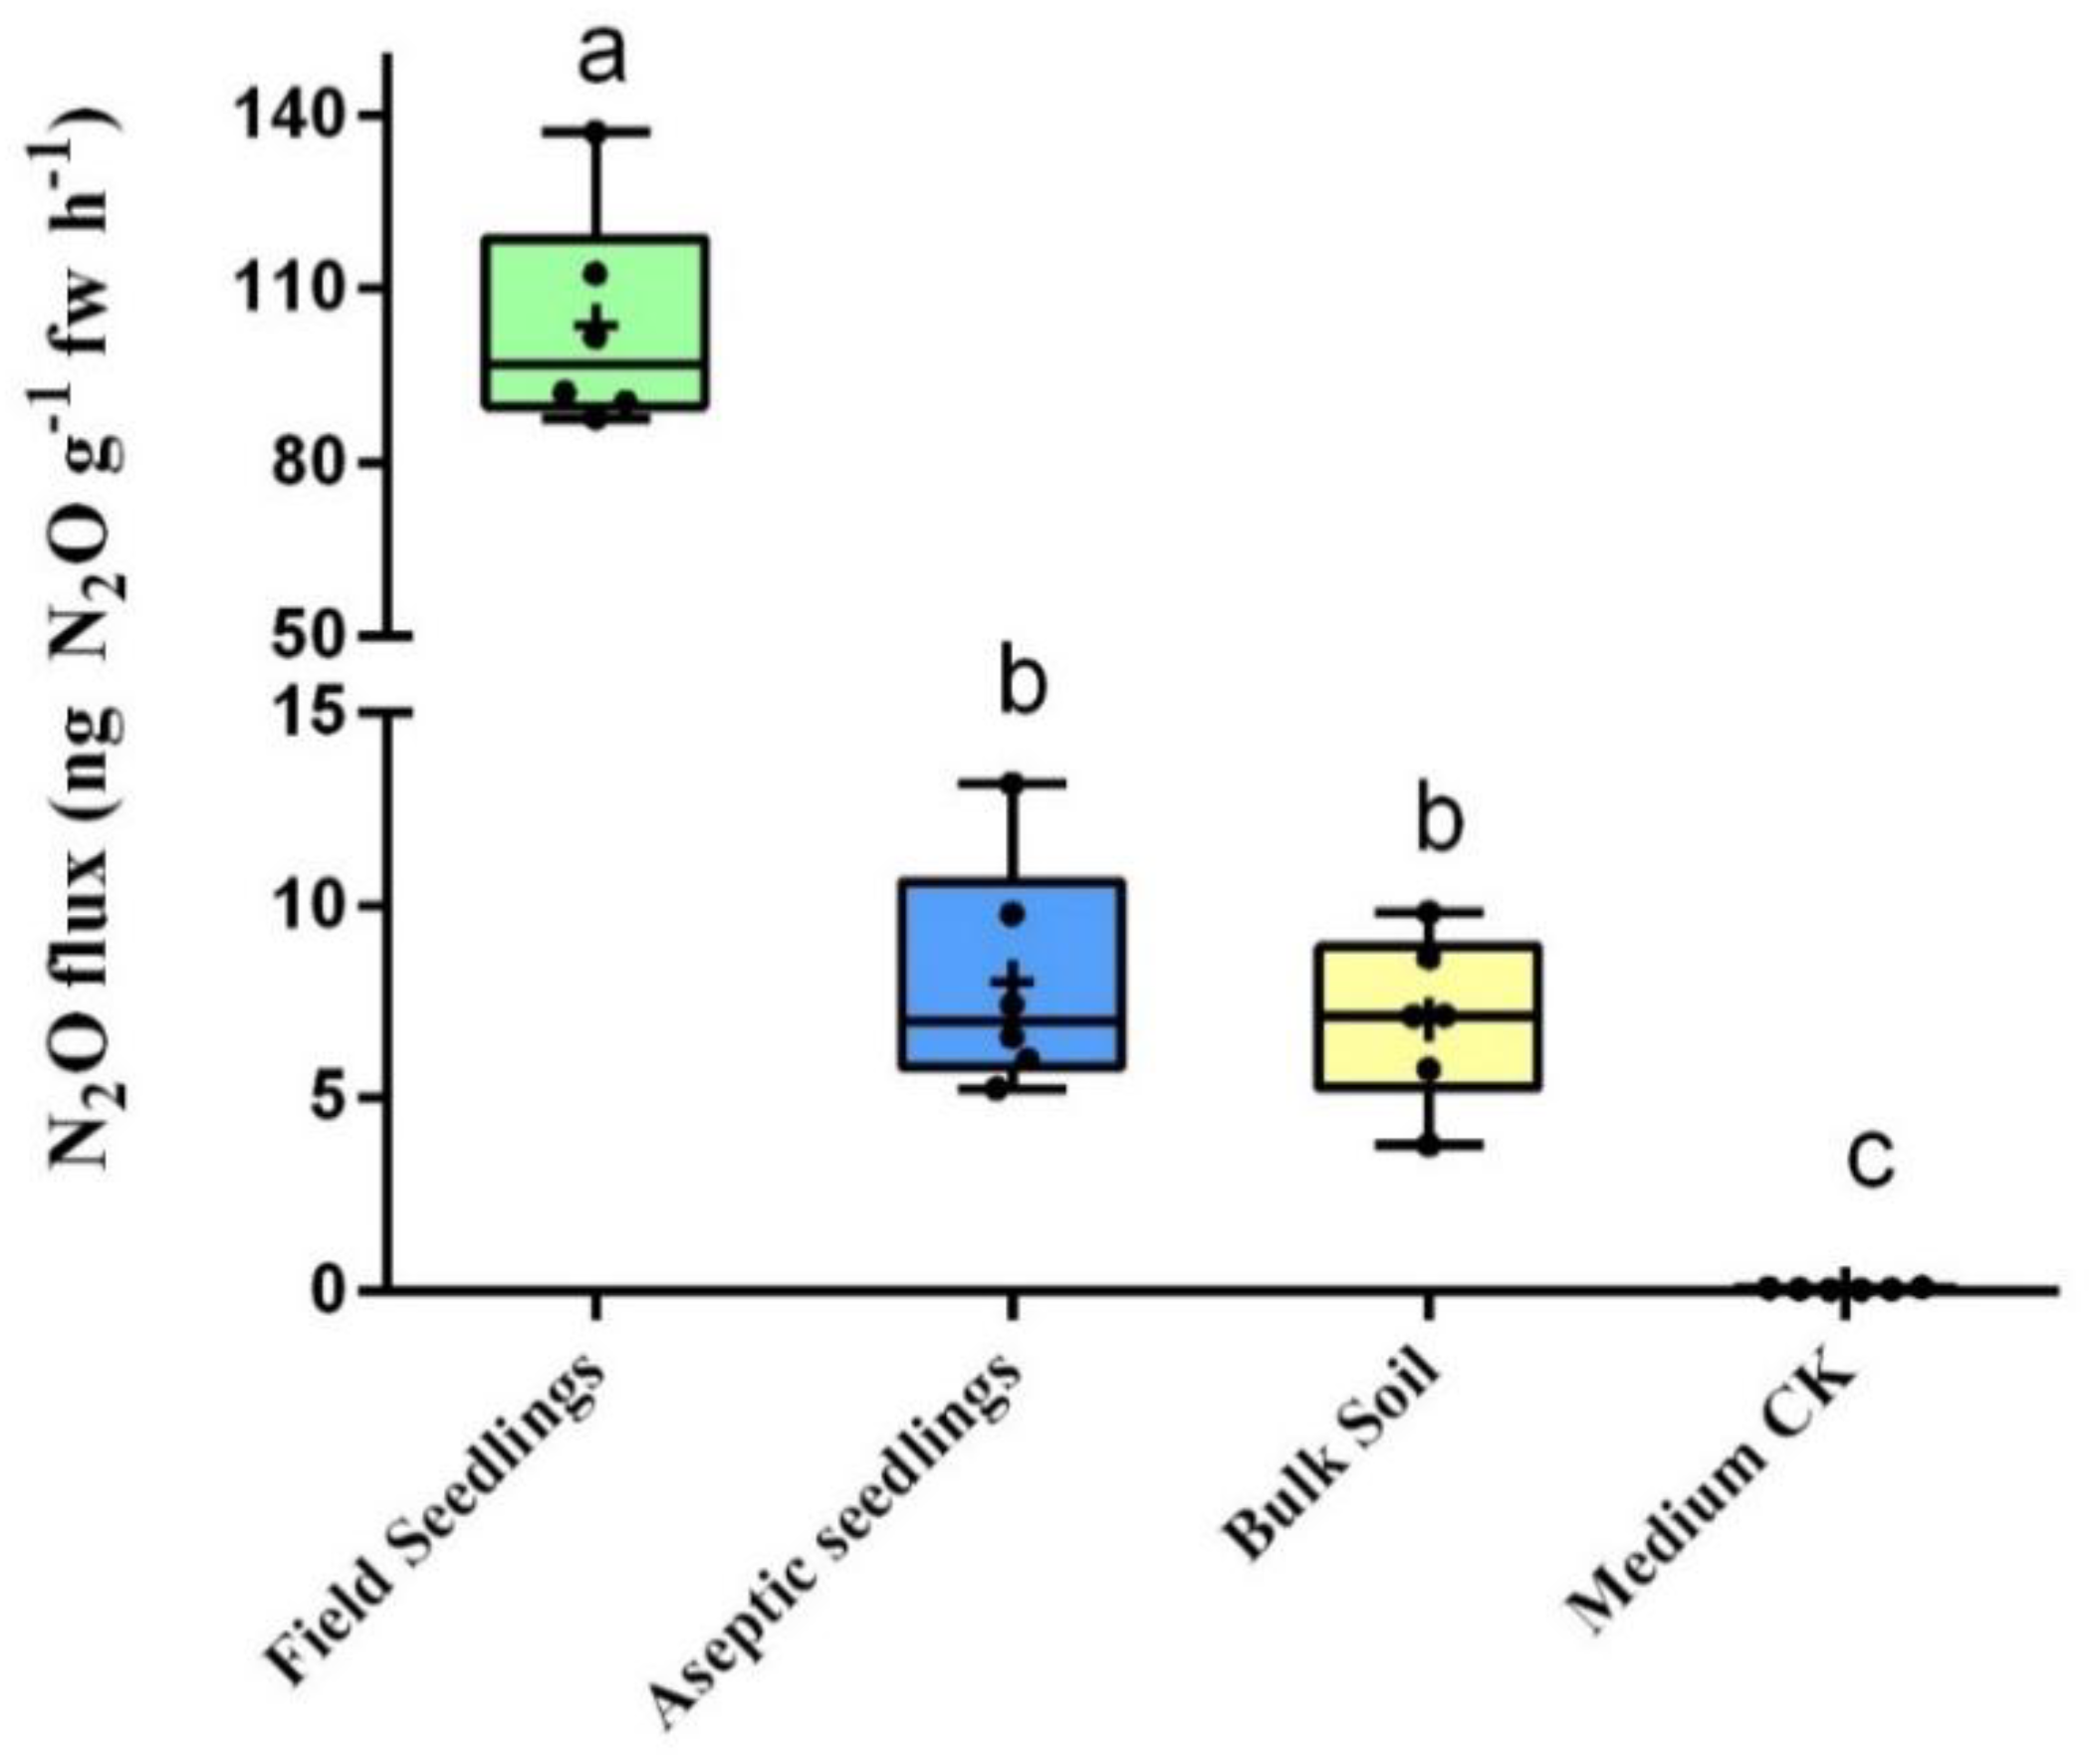
Firstly, in this study, more than a 10-fold variation of N
2O flux was observed between field seedlings and aseptic seedlings. This result suggests that endophytic microbiota may play a critical role in plant N
2O emission. In our work, the N
2O flux that we observed from field seedlings was similar to that observed in previous studies, however, the flux from aseptic seedlings was quite different [
4]. Contrary to our observations, Hakata and colleagues previously showed that the highest value for N
2O emission was obtained with aseptic
Hibiscus cannabinus seedlings (0.45 ± 0.20 ng N
2O/g fw and week
−1) [
6]. Hence, the latter study proposes that the activity to convert nitrate nitrogen to N
2O is limited in plants. However, the flux we obtained in this work in aseptic seedlings (8.56 ± 2 ng N
2O g
−1 fw h
−1) was 100 times higher than what was found in that study [
6]. Tracing it to its cause, the different cultivation of plants is what ought to be taken into consideration. While Hakata and colleagues [
6] aseptically cultured the plants on the MS medium, we cultured the aseptic seedlings in sterilized soil. The physicochemical properties of the medium will seriously affect the development of plants [
28]. This indicates that abiotic factors seriously affected the plant N
2O observation, different culture conditions can lead to different observations. Furthermore, we considered that the N
2O flux of plants is not negligible like what was described in previous studies [
6,
29]. In fact, the N
2O flux from field soybean seedlings observed in our study was significantly higher than that from the soil from the same field. This suggests that plant-generated N
2O emissions may significantly contribute to the total emissions from the agricultural system.
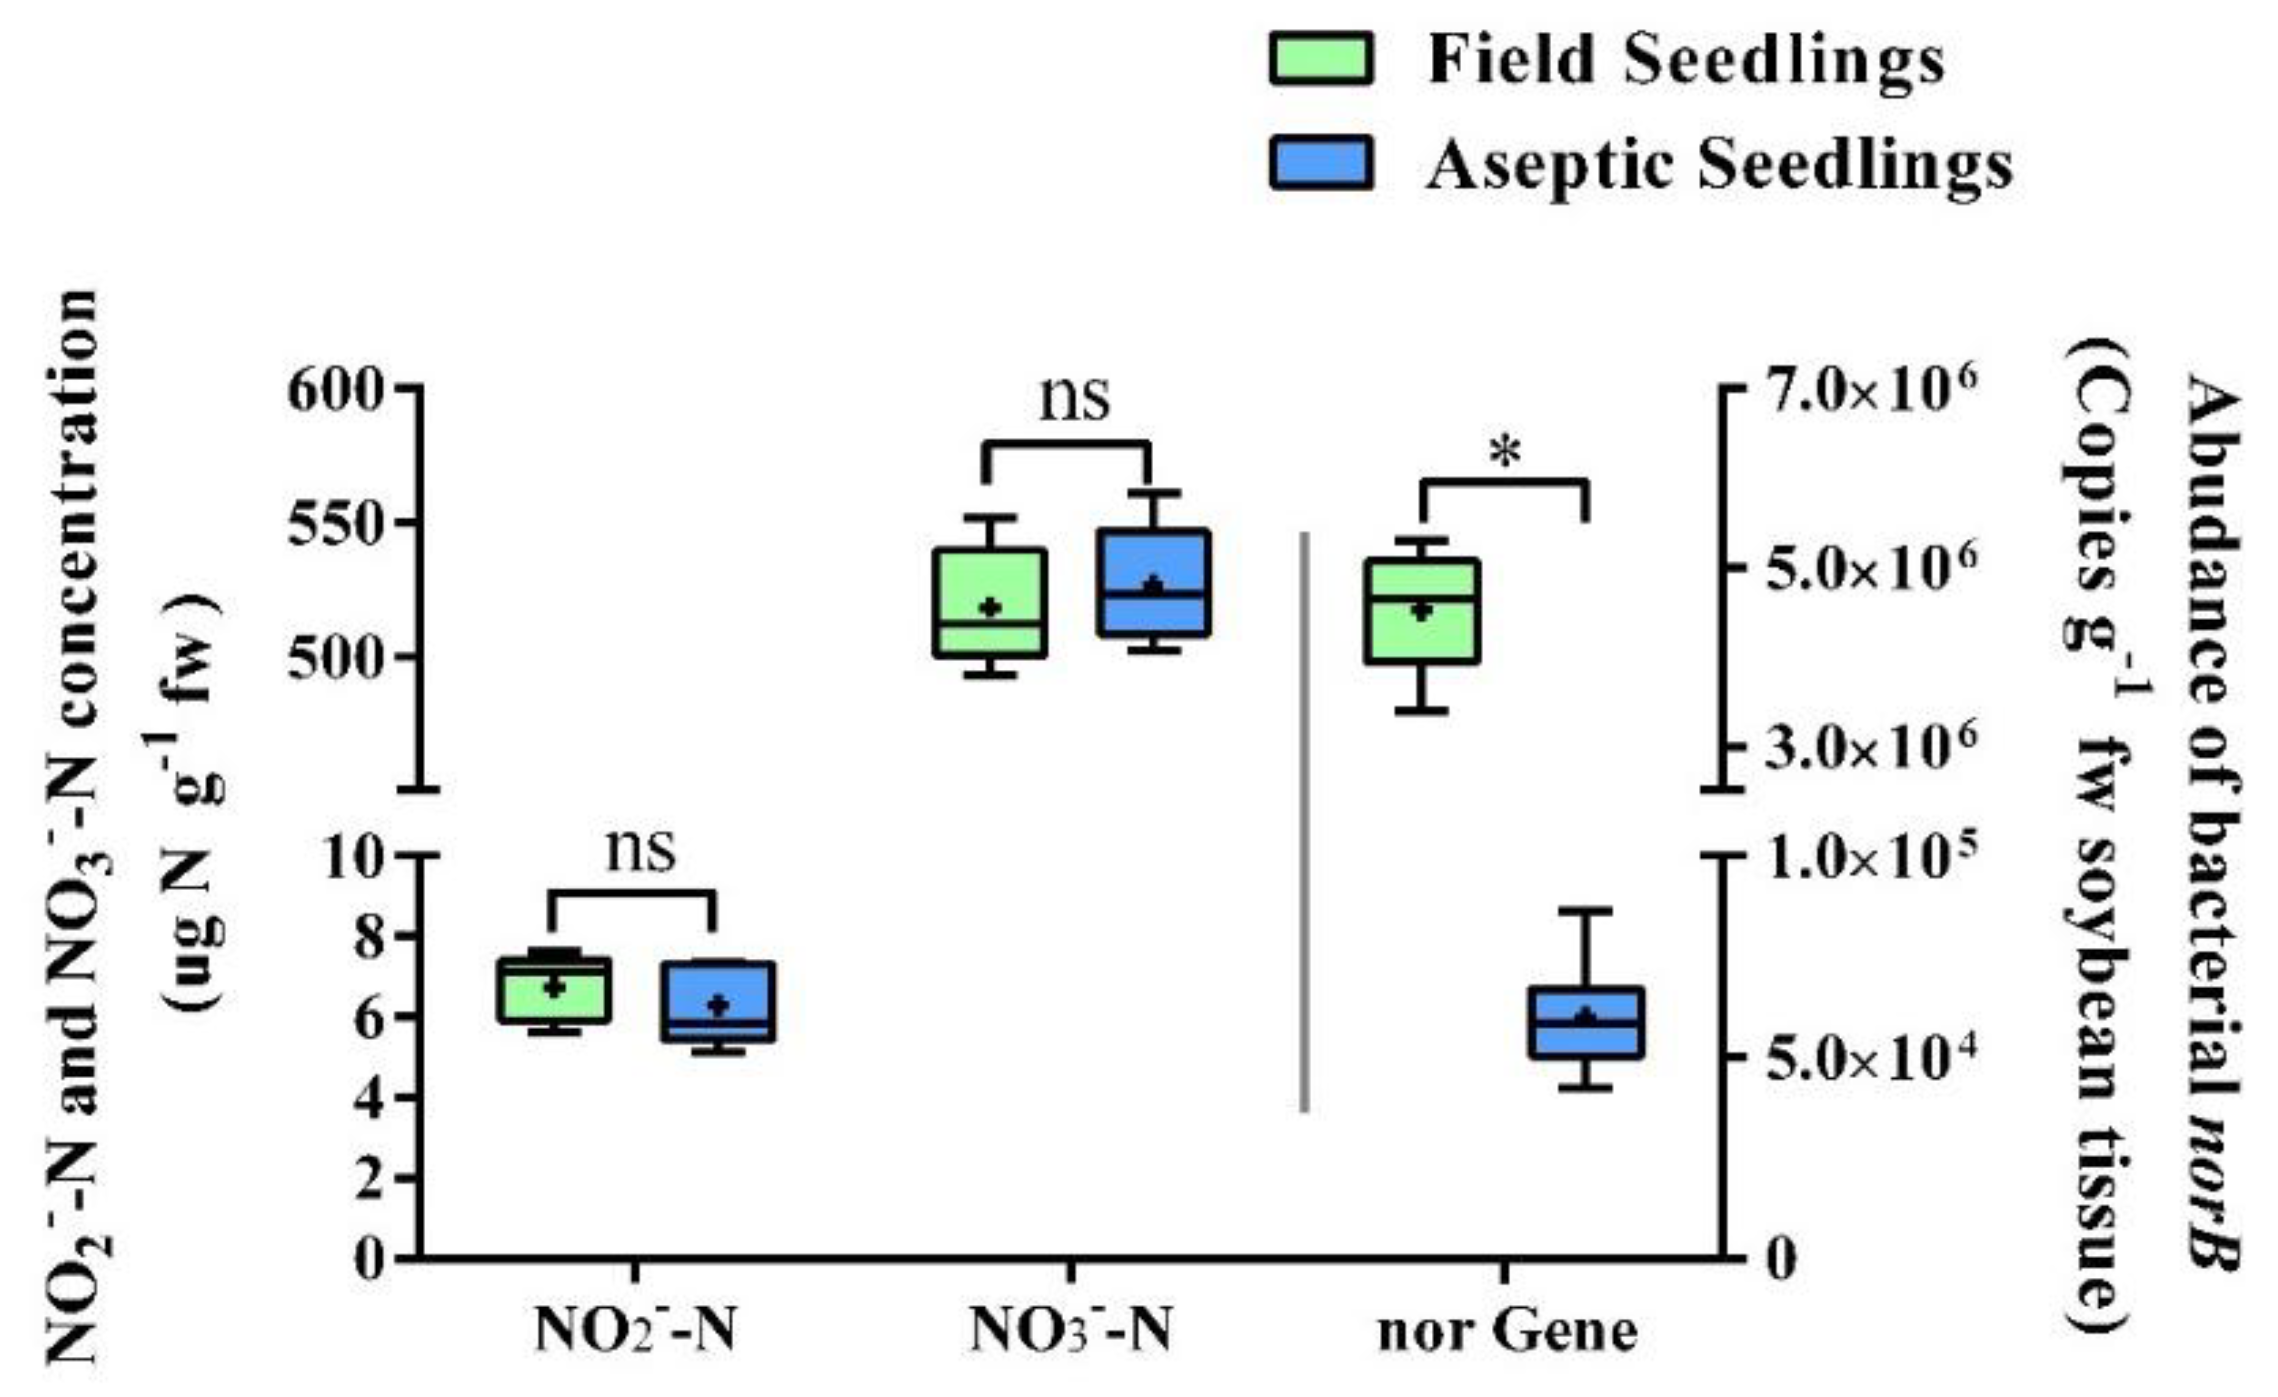
Nitrite, the substrate of plant N
2O, is closely related to the plant N
2O emission rate [
12]. Previous studies of plant N
2O generation suggested that plants may have different N
2O fluxes under different NO
2− accumulation rates [
12,
30]. In our study, field seedlings and aseptic seedlings showed similar NO
2− concentrations. This demonstrates that, under similar abiotic factors, soybean nitrite accumulation was not related to the endophytic microbiota. In other words, nitrite accumulation is mainly accomplished by the plant cell itself and is not affected by endophytic microorganisms. What is more surprising is that under similar nitrite concentrations, field seedlings and aseptic seedlings presented a 10-fold difference in their N
2O fluxes. This is an indication that endophytic microbes may affected plant N
2O emission only by means of contributing to their nitrite conversion activity.
Nevertheless, the nitrite conversion pathway of plant cells is still unrecognized [
29]. Specifically, while nitrite can be reduced to NO, plant cells, however, do not seem to have the ability to further reduce NO into N
2O. The plant derived NO reductase and its encoding gene is the key but is lost in plant cells. In this context, Abdel and his colleagues engineered the NO reduction pathway in plant cells by incorporating the fungus-derived P450-
nor gene, thus enabling N
2O emission [
31]. Thus, the purpose of our work is to prove whether there is an exogenous NO reductase in wild plants holobiont, which has similar function to the incorporated P450-
nor gene.
Results from a Q-PCR assay firmly proved that the bacteria-derived norB exists in the plant holobiont. Further, the correlation analysis presented shows that plant N2O emissions were significantly correlated with the abundance of bacterial norB gene. This indicates that although the function of NO reduction in the plant cell is defective, the endophytes filled this functional gap, thus enabling the plant N2O emission. Besides, our results also suggest that bacterial denitrification quantitively affect plant N2O generation by taking over the NO-N2O reduction process. Specifically, plant nitrite accumulation is done by plant cell. The rate of plant nitrite directly affected plant NO concentration, which is a substrate of N2O production. Subsequently, bacterial NO-N2O reduction is the final speed limit step of plant N2O generation. To sum, compared with P450-nor gene transfected plant cell cultures, plant holobionts also tackle the N2O generation pathway with the assistance of endophytic microbes. To the best of our knowledge, this is the first time that a cooperative interaction between the denitrifying bacteria and nitrogen dissimilation in plants has been reported.
Soybean endophytic denitrifying bacteria and its distribution in various organs were determined. Anaerobic and aerobic denitrifying bacterial species were both observed in soybean endophytic microbiota. Similar denitrifying species were observed in field seedlings and aseptic seedlings (
Figure 5b,
Table S2, Supporting information), which indicates that seed-borne microbiota cover most denitrifying bacterial species and enable to colonize in aseptic-cultured seedlings. In contrast, field seedlings show significantly high abundance of denitrifying bacteria than that in aseptic seedlings (
Figure 5a). These observations suggest that soil contact improves the abundance of denitrifying bacteria in all soybean organs. In addition, the genera of denitrifying species (
Propionibacterium,
Eubacterium and Sphingobacterium) were specificially observed in plants, and all of those denitrifying species constituted a sizably higher proportion of the plant microbiota than in soil. The reason is that plants probably provide better anaerobic conditions for endophytic microbes, which ensures the recruitment of more in vivo denitrifying bacteria in plants [
32,
33]. Thus, we propose that the plant is a more powerful N
2O bioreactor than the soil system. This may explain why plants emit more N
2O than soil samples (
Figure 5).
According to the sequencing data, field seedlings were enriched by 5 times higher abundance of denitrifying bacteria than that of aseptic seedlings. These data can be related to the plant N
2O flux data in which field seedlings showed 10 times higher N
2O flux than that of aseptic seedlings (
Figure 5). However, at this point, we have not yet definitively proven that sum of total denitrifying bacteria is the only key factor in plant N
2O generation because endophytic microbes may affect plant N
2O emissions from multiple pathways. For instance, the distribution and composition of nitrogen metabolism-related species (e.g.,
Bradyrhizobium) also showed great differences in field seedlings and aseptic seedlings. We found that
Bradyrhizobium was 100 times more enriched in the roots of field seedlings than that in aseptic seedlings (
Figure 5b,
Table S2, Supporting information). The biological functions of
Bradyrhizobium operate in both nitrogen fixation and the denitrification process [
33], which are both considered as the source of plant N
2O generation [
10,
34]. The quantitative variation of
Bradyrhizobium may significantly affect nitrogen accumulation, including ammonium, nitrate and nitrite accumulation in plants, and successively affect the emission rate of plant N
2O. Therefore, we propose that the contribution of endophytic bacteria to plant-sourced N
2O generation may not be limited to those directly involved in the NO reduction process.
Regrettably, we are not capable of establishing the germ-free soybean seedlings which are more worthy of observation. Tissue culture techniques used to be the way to establish germ-free plants. However, evidence has shown that shoot-tip bacteria are also detected in the plant tissue cultures [
35]. Therefore, germ-free seedlings are not established due to this technical limitations. In addition, due to the technical limitations, we were not able to establish a plant-sample queue containing quantitatively different levels of total endophytic bacteria. For these reasons, we are currently incapable of studying the plant N
2O flux in the plant samples with zero endophyte and endophyte gradient. Further, the involvement of endophytic fungi in plant N
2O emission and its potential denitrification activity [
36] were not determined in our work. All of this will be addressed in future studies.


