1. Introduction
Multiple myeloma (MM) is a haematological malignancy characterised by the proliferation and the accumulation of clonal plasma cells in the bone marrow. Tumour cells overproduce a monoclonal immunoglobulin or a light chain that, ultimately cause immunodeficiency, renal failure, recurrent infections, and bone lesions [
1]. The introduction of proteasome inhibitors (PIs), including bortezomib (BTZ) and carfilzomib (CFZ), has led to a significant benefit for the treatment of MM patients [
2].
The 26S proteasome is the main protein degradation machinery in cell [
3]. It is composed of the 20S catalytic core that directs peptide bond cleavage and the 19S complex that recognises ubiquitinylated substrates. PIs target, either irreversibly (BTZ) or reversibly (CFZ, ixazomib), the β5 catalytic subunit of the 20S core complex. Due to their rapid and elevated production of immunoglobulins, MM cells are hypersensitive to proteasome inhibition [
4]. By inhibiting the proteasome machinery and preventing the degradation of misfolded proteins, PIs induce an endoplasmic reticulum (ER) stress and an unfolded protein response (UPR), leading tumour cells to apoptosis. Unfortunately, most MM patients relapse due to innate or acquired resistance [
5]. Several mechanisms sustain BTZ/CFZ resistance such as: mutation within the
PSMB5 gene encoding the β5 subunit [
6], paradoxical knockdown of 19S regulatory components [
7,
8], activation of the aggresome-autophagy pathway [
9], up-regulation of heat-shock proteins and ER stress sensors [
10], overexpression of the multi-drug transporter ABCB1 [
11]. Furthermore, the interactions between MM cells and their microenvironment participate in PIs resistance through soluble factors (interleukin (IL)-6, vascular endothelial growth factor) and exosomes, adhesion proteins of the integrins family, and/or specific miRNAs [
5]. A comparative proteomic profiling of refractory/relapsed MM patients has confirmed four types of biomarkers for BTZ resistance. They belong to proteins involved in: (a) proteasome function, (b) response towards oxidative stress, (c) defence response, and (d) apoptotic process [
12].
All MM cells express one of the three cyclin D proteins and almost 50% of them express cyclin D1. Besides the regulation of cell cycle and cell proliferation, we previously reported that the overexpression of cyclin D1 unbalances the MM redox status by producing reactive oxygen species (ROS) in a NADPH oxidase (NOX)-dependent manner [
13]. Moreover, cyclin D1 sensitises cells to CFZ by activating the UPR pathway [
14]. The targeting of tumour cells by a ROS-mediated mechanism has been described as a fruitful approach [
15]. We report here that VAS3947 (VAS), a pan-inhibitor of NOX, as single-agent, is potent to induce MM cells death but fails to synergise with BTZ. In contrast, auranofin (AUR), an inhibitor of the antioxidant thioredoxin reductase shows a strong anti-MM activity, synergises with BTZ, and alleviates BTZ intrinsec insensitivity as well as cell tumour microenvironment (TME)-mediated cell resistance. The efficacy of drugs combination was confirmed in primary samples from MM patients cultured in suspension, in coculture, or in 3-D. The question of whether to antagonise or otherwise promote an oxidative stress in a therapeutic anti-MM strategy is, at least, partially solved by our data.
2. Materials and Methods
2.1. Drugs
VAS3947 (VAS), a selective inhibitor of NOX, was purchased from Calbiochem (#532336, San Diego, CA, USA); bortezomib (or PS-341) was purchased from SelleckChem (S1013, Houston, TX, USA). N-acetyl-l-cysteine (NAC), an antioxidant, bafilomycin A1 (BafA1), an inhibitor of maturation of autophagic vacuoles, and auranofin (AUR), a selective thioredoxin reductase inhibitor, were purchased from Sigma-Aldrich (A7250, B1793, and A6733, respectively, Saint Louis, MO, USA). Stock solutions (10 mM) were made using dimethylsulfoxide (DMSO) or ethanol (EtOH) as solvents. In turn, depending on the drugs, 0.01% DMSO or EtOH were used as vehicles.
2.2. Cell Lines and Culture Models
Nine MM cell lines belonging to various molecular subgroups were used in this study (
Table S1). Cell line authentication was done by short tandem repeat (STR) profiling (DSMZ, Leibniz Institute). Cells were maintained in culture in RPMI 1640 medium supplemented with 10% foetal calf serum (FCS), 2 mM
l-glutamine, and antibiotics (Lonza, Basel, Switzerland). Each batch of cells was maintained less than 2–3 months in culture. Mycoplasma infection was tested regularly by PCR.
Ninety-six-well plates were coated overnight at room temperature with fibronectin (FBN, 10 µg/mL in PBS, 100 µL/well, Sigma-Aldrich), then extensively washed before MM cells seeding. The human stromal cell line HS-5, obtained from the ATCC (CRL-11882), was maintained in Dulbecco’s modified Eagle’s medium containing antibiotics, l-glutamine, and 10% FCS (Lonza). For coculture experiments, HS-5 cells (9 × 10⁴ cells) were seeded in each well of 24-well plates and cultured for four days. MM cells (105 cells/well) were seeded at that time directly on the monolayer for drug treatments. Plates were incubated for 1 h at 37 °C to allow MM cells’ attachment to the layer and cells were treated thereafter.
The method for 3-D culture was adapted from [
16]. Briefly, 24-well plates were coated with 200 μL of reconstituted endosteum obtained by a mixture of FBN (77 μg/mL) and collagen I (29 μg/mL). MM cells (10
6 cells in a volume of 40 μL of PBS) were suspended in a mixture of Matrigel (Corning), 1 mg/mL FBN, and 2 mg/mL collagen IV with a 4/2.5/1 ratio. Two hundred μL of this matrix were added to each well and incubated at 37 °C for 1 h before addition of complete medium. Drugs were added directly into the wells. For the dissociation of spheroids that formed in this 3-D culture, cells were incubated with a solution containing 5 mM EDTA, 1 mM sodium vanadate, and 1.5 mM sodium fluoride, then analysed.
2.3. Primary Samples, Treatments, and CD138 Expression Analyses
Primary neoplastic plasma cells were obtained at diagnosis from four patients of
Centre Hospitalo-Universitaire of Caen. MM diagnosis was made in accordance with the International Myeloma Working Group criteria [
17]. Informed consent was obtained from each patient in accordance with the guidelines of the local ethics policy and the Declaration of Helsinki. The clinical characteristics of MM patients are listed in
Table S2. Mononuclear cells from bone marrow samples were isolated by Ficoll and directly cultured for 24 h in RPMI 1640 medium containing 10% FCS and 3 ng/mL recombinant IL6 (R&D Systems). Cells were then treated with AUR (0.25–5 μM) alone or in combination with BTZ (2.5–5 nM). Due to the limited number of tumour cells, experiments were not always performed in triplicate; the number of samples is clarified in the figure legend. After treatments, tumour cells were co-stained using a V450-conjugated anti-CD38 antibody (Ab, Clone HB7, #646852, BD Horizon) and a phycoerythrin(PE)-conjugated anti-CD138 Ab (A54190, IOTest, Beckman Coulter, Brea, CA, USA). CD38-positive cells were selected and cell death was measured by the loss of CD138 staining as described previously [
18]. In two cases, we had enough CD38/CD138-positive primary cells to culture them in coculture with the HS-5 feeder layer as described previously (Pts # 3 and 4); in another one, we could maintain primary cells in spheroids (Pt # 1). In that case, purified mononuclear cells were cultured for six days then treated with drugs for 24 h. In these culture conditions, cell death was measured by the loss of CD138 staining after spheroid dissociation.
2.4. Cell Viability Assay
MM cell lines (5 × 10
4 cells per condition) were seeded in 96-well plates and incubated for 48 h with vehicle, as a control, or drugs at the indicated doses. Cell viability was quantified with the CellTiter96
® Aqueous One Solution (MTS assay, Promega, Madison, WI, USA), according to the manufacturer’s instructions. The IC
50 (index of cytotoxicity) that is the drug concentration that kills 50% of the cells after a 48 h-treatment, was calculated with the Prism software (v8.0, GraphPad, San Diego, CA, USA) and verified with the CompuSyn software (
http://www.combosyn.org). This software was also used to calculate the Chou-Talalay combination index (CI) [
19].
2.5. Assessment of Apoptosis
MM cells were treated with drugs (or vehicle) as indicated, then stained with 5 μg/mL Hoechst 33,342 (910–3015, ChemoMetec, Allerod, Denmark), 5 μg/mL propidium iodide (PI, 910-3016, ChemoMetec) and fluorescein isothiocyanate (FITC)-conjugated Annexin V (IM3546, Beckman Coulter), then analysed using the NucleoCounter NC-3000 image cytometer (ChemoMetec). Hoechst 33,342 stains the total cell population, annexin V stains both apoptotic and necrotic cells. Early apoptotic cells exclude PI, while late apoptotic cells stain positively for both annexin V and PI. The pan-caspase inhibitor Q-VD-OPh [quinoyl-valyl-O-methylaspartyl-(2,6-difluorophenoxy)-methyl ketone] was purchased from Sigma-Aldrich (SML0063). Cells were treated with 10 μM Q-VD-OPh for 1 h before the treatment with apoptosis inducers. At least 104 cells were analysed for each set of culture condition. The experiment was carried out three times for LP1 cells and four times for KMS-12-PE with triplicate samples.
For each culture condition, MM cells were fixed in EtOH, then stained with DAPI (4′,6-diamidino-2-phenylindole) (910-3012, ChemoMetec), analysed for cell cycle distribution with the NucleoCounter NC-3000 using a pre-loaded protocol (two-step cell cycle analysis). Data were processed with the NucleoView software (ChemoMetec), exported, and analysed with the Kaluza software (Beckman Coulter). Cells with a sub-G1 DNA content were considered as apoptotic. At least 104 cells were analysed for each set of culture condition and the experiment was carried out three times for each cell line with triplicate samples.
MM cells were treated with drugs or vehicle as before, stained with a PE-conjugated anti-APO2.7 Ab (IM2088U, IOTest, Beckman Coulter), and analysed by flow cytometry. For coculture experiments, HS-5 and MM cells were stained with APO2.7-PE and CD10-allophycocyanin (APC)-conjugated (B49223, IOTest, Beckman Coulter) Abs. Only CD10-negative cells corresponding to MM cells were analysed with the CytoFlex cytometer and the CytExpert software (Beckman Coulter). At least 104 cells were analysed for each culture condition, the experiment has been done three times for each cell line with triplicate samples.
2.6. ROS Production Measurement
Intracellular ROS levels were measured with the oxidation-sensitive fluorescent CellROX™ Deep Red reagent (C10422, Invitrogen, Carlsbad, CA, USA) according to the manufacturer’s instructions. Treated cells were incubated with 5 μM reagent for 30 min at 37 °C and then analysed with the NucleoCounter NC-3000. We used a home-made protocol created on the FlexiCyte framework (ChemoMetec). Data were processed with the NucleoView software and analysed with the Kaluza software. The experiment was performed three times for all cell lines, except for LP1, only twice.
2.7. Immunoblotting
Cells were lysed with a lysis buffer containing 1% NP40, 10% glycerol, 0.05 M Tris pH7.5, 0.15 M NaCl, and a cocktail of protease and phosphatase inhibitors. Insoluble material was discarded and soluble proteins were recovered and quantified. The methods used for immunoblotting (IB) have been described in details elsewhere [
20].
Activated (cleaved) caspase 3 is a hallmark of apoptosis induction. The cleavage of caspase 3 was analysed with anti-cleaved caspase 3 Abs (ab214430 from abcam, Cambridge, UK; or #9664 from Cell Signaling Technology, Danvers, MA, USA). To test for the induction of autophagy, we analysed the conversion from LC3B-I to LC3B-II with a specific Ab (ab51520, abcam). An anti-β-actin Ab (#4970, Cell Signaling Tech.) was used as a control of protein loading and transfer. The level of relevant proteins was estimated by densitometry (ChemiDoc XRS+, ImageLab software, Bio-Rad, Hercules, CA, USA) and normalised to the level of β-actin on three independent blots.
2.8. Semi-Quantitative RT-PCR Analyses
Semi-quantitative RT-PCR analyses was performed as previously described in Bustany et al. [
13]. Total RNA was purified from cultured MM cell lines with the Trizol reagent (Invitrogen) according to the manufacturer’s instructions. The RNA was reverse-transcribed using the SuperScript
® VILO cDNA Synthesis Kit (Invitrogen). PCR primers and Universal Probe Libriray (UPL) probes were designed using ProbeFinder software (v1.5.1, Roche Applied Software, Penzberg, Germany) (
Table S3). cDNAs, primers, probe, and LightCycler
® TaqMan
® Master mix were mixed in a final volume of 10 μL and PCR-amplified in a LightCycler
® 480 Instrument II (Roche) according to the manufacturer’s instructions. The Ct means of human
GAPDH,
ACTB, and
RPL13A genes were used as endogenous control to normalise the expression of target genes. Each reaction condition was performed in triplicate. Relative gene expression was evaluated by the ΔCt method.
2.9. Statistical Analyses
The Student’s t-test was used to determine the significance of differences between two experimental groups. In some experiments comparing more than two groups, a one-way ANOVA test was performed. Data were analysed with the Prism software, with p < 0.05 (*) considered to be significant.
The Mann-Whitney test was used to determine the significance of GEP in MM patients according to their molecular sub-groups. Data were analysed with the Prism software, with p < 0.05 (*) considered to be significant.
4. Discussion
In eukaryotic cells including cancer cells, ROS are generated by various endogenous and exogenous sources during various cell processes, including oxidative metabolism. To maintain ROS at physiological concentrations, their production and availability are finely regulated [
29]. In cancer cells, the level of ROS determines their effects. When present at low or intermediate levels, ROS control proliferation, invasion, angiogenesis, and drug response. At high levels, ROS induce irreversible DNA damage and ultimately cell death [
30]. Due to their hypoxic environment in the bone marrow, MM cells produce high levels of ROS but are adapted to this generated chronic oxidative stress. Nevertheless, the current standards of care for newly diagnosed MM are BTZ-containing regimens [
31] and BTZ-mediated cell death is due, at least in part, to the production of intracellular ROS [
32]. Our findings confirmed that any modification of the balance between ROS production and scavenging triggers MM cell death.
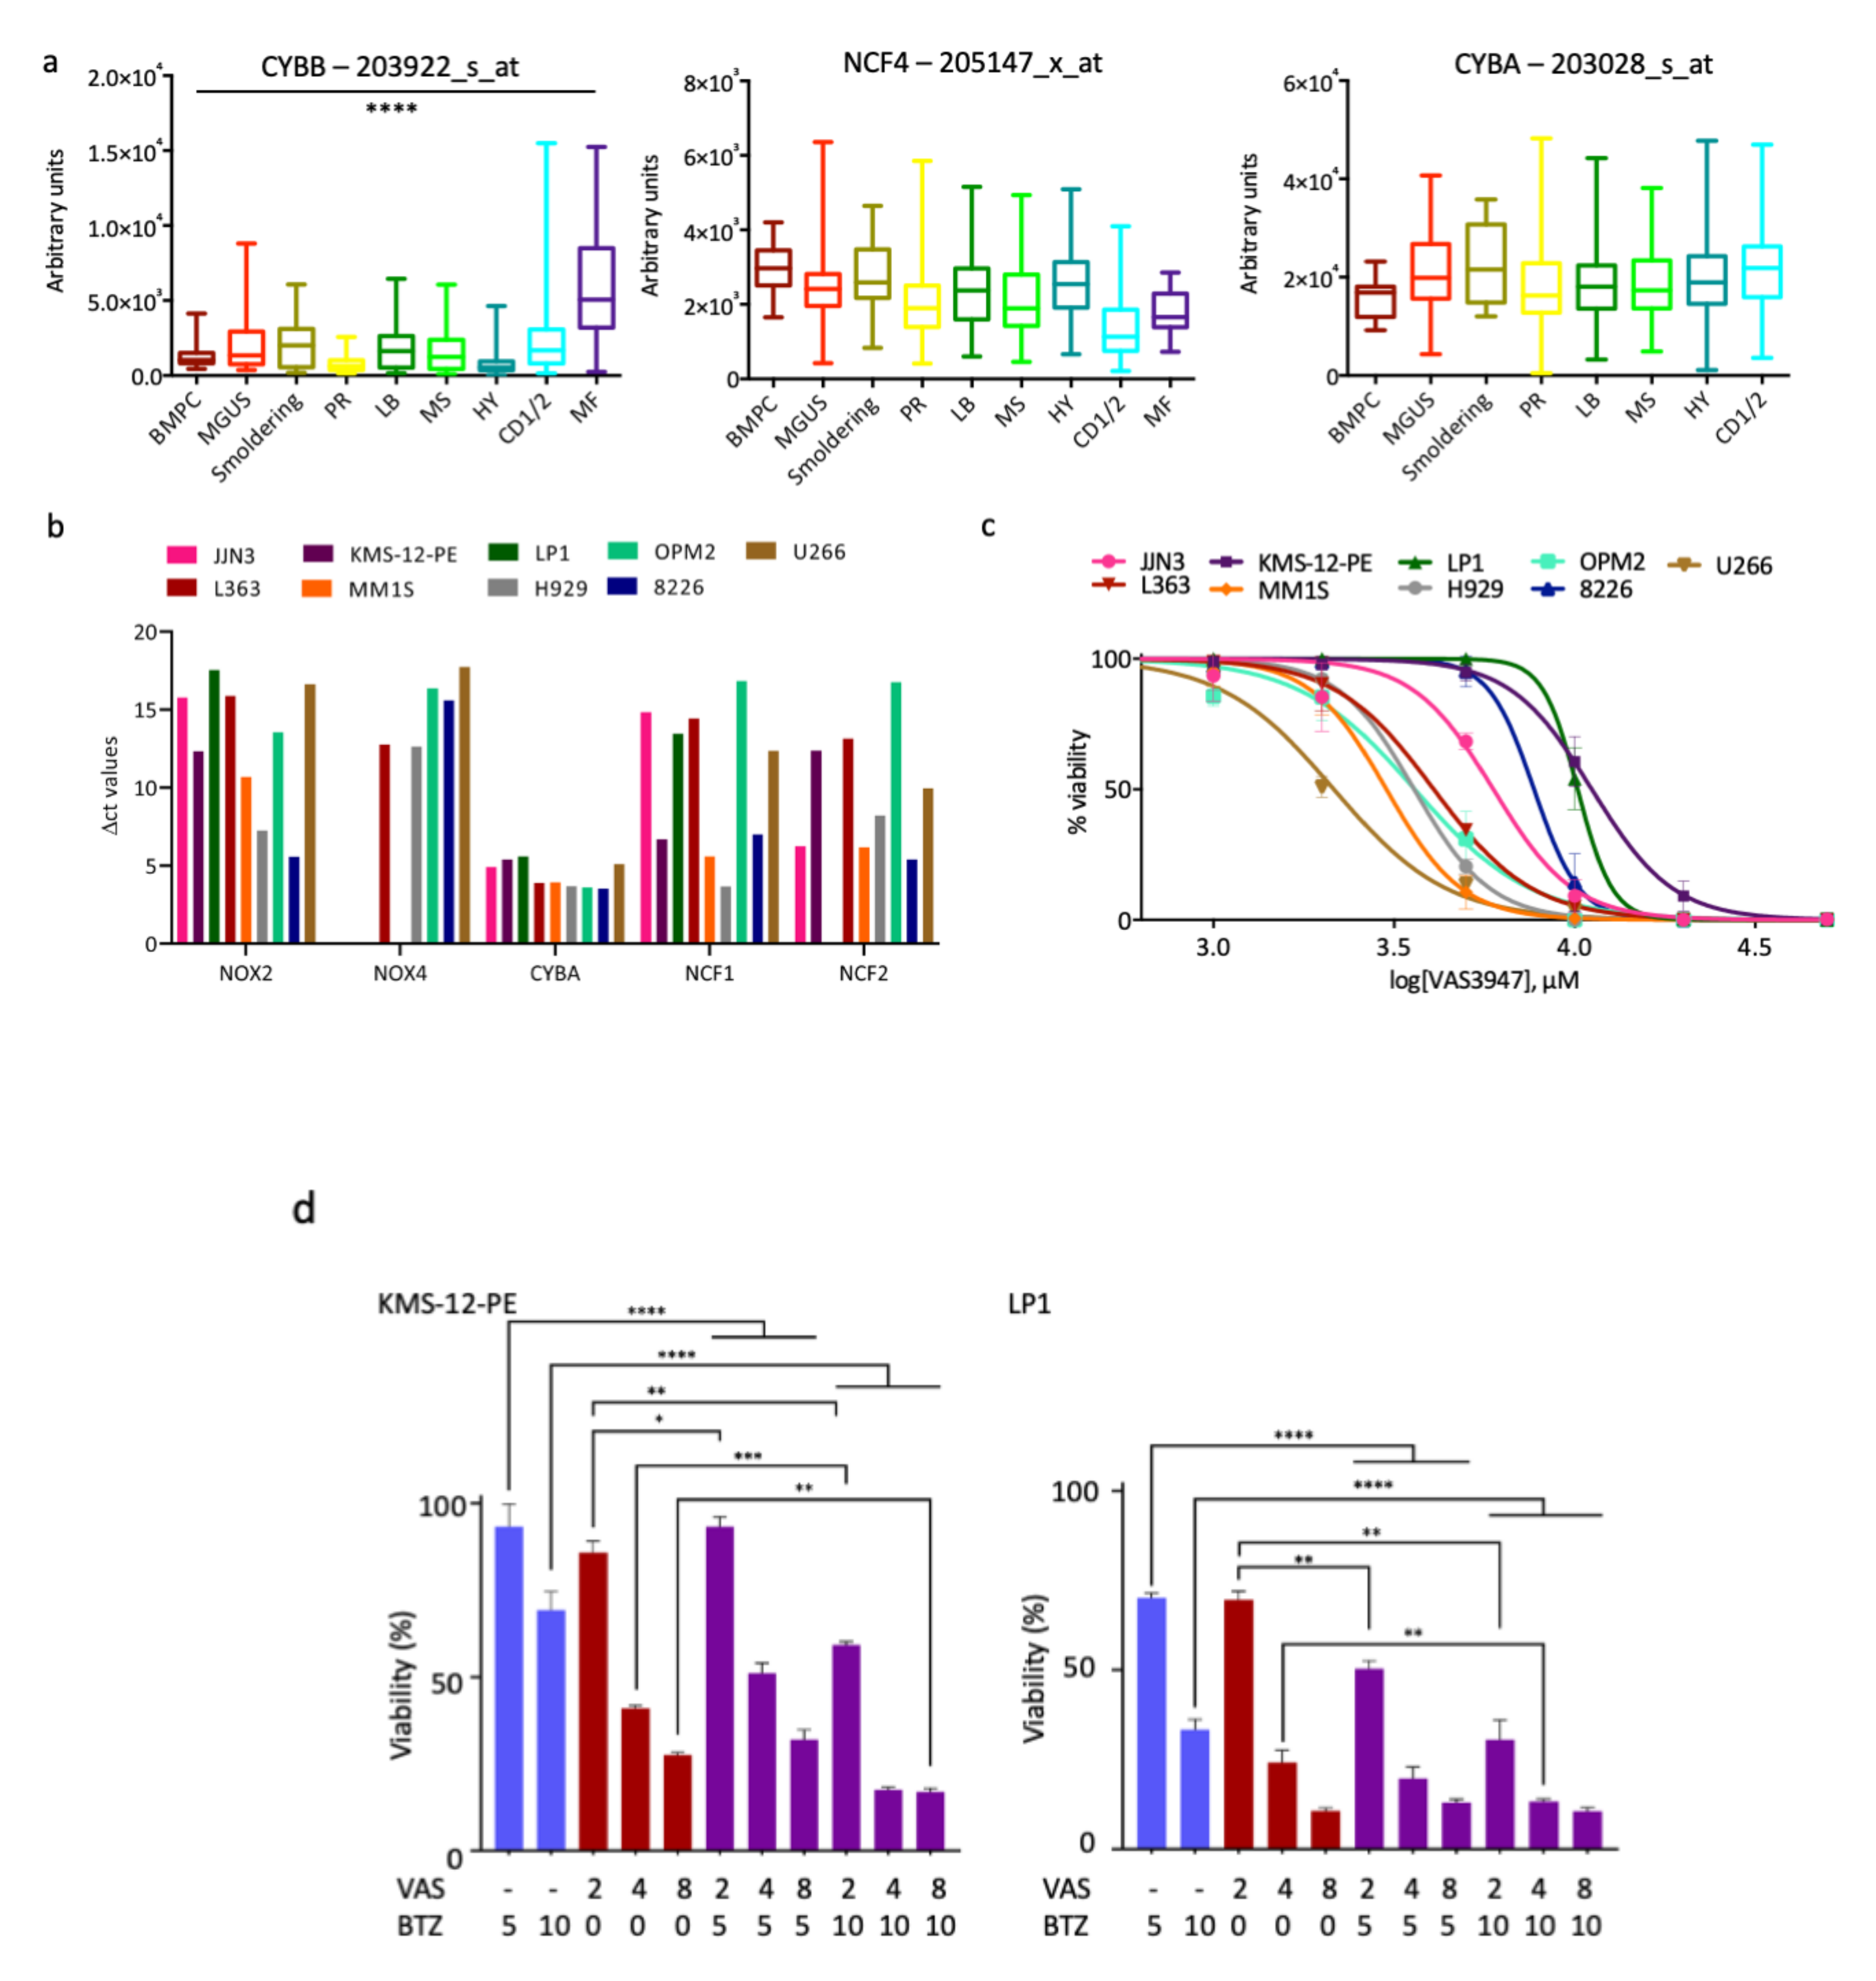
We first inhibited ROS production by inhibiting the NADPH oxidase NOX2. NOX2 is the sole catalytic subunit of NADPH oxidase expressed in MM cells (
Figure 1a) and produces ROS as its main function [
33]. The inhibition of NOX2 with VAS3947, a pan-NOX inhibitor, has a cytotoxic effect, at least in responsive cells (
Figure 1c). However, its association with BTZ appears to be inefficient and could even be deleterious for MM patients (
Figure 1d,
Table 1 and
Table 2). Since the inhibition of ROS production does not show the expected effects, we decided to modify the redox equilibrium by increasing ROS production. We successfully did that by inhibiting engagement of detoxifying factors. We report that AUR, an inhibitor of TXNRD1, acts in synergy with BTZ in sensitive and insensitive cell lines and primary cells to induce MM cell death (
Table 3,
Figure 3,
Figure 4,
Figure 5 and
Figure 6). Moreover, AUR/BTZ combination alleviates BTZ-resistance in several in vitro settings (
Figure 6,
Figures S6 and S7). Indeed, AUR/BTZ was efficient on MM cells and primary cells cultured on a layer of HS-5 stromal cells and in a 3-D model mimicking the bone marrow niche (
Figure 6a,b and
Figure 7). The interactions of malignant MM cells with TME facilitate a drug-resistant phenotype [
34]. We observed that it was obviously the case when cells were cultured on FBN-coated plates, in coculture with mesenchymal cells, or in spheroids (
Figure 6 and
Figure 7;
Figures S6 and S7). In turn, studies in such models could be more representative of the response of MM cells towards drugs. Although the efficacy of AUR has been reported previously for MM cell lines and patients [
26,
35], its effect on TME-induced resistance to BTZ was not. Therefore, we propose considering the combination AUR/BTZ for refractory and relapse (R/R) MM patients. Importantly, the combination is effective in MM cells having a distinct genetic background and in particular, exhibiting either an abnormal or a wild-type
TP53 status (e.g., H929 vs. L363 cell lines,
Table S1); this is an important point since MM cells frequently exhibit an inactivation of the p53 pathway [
35]. The anti-MM activity of AUR varies among cell lines (
Table 1) and MM patients (
Figure 7) likely because they possess intrinsic differential sensitivities to oxidative stress and antioxidant capacities.
We observed that
TXN and
TXNRD1 coding for antioxidant enzymes are both overexpressed in MM compared to normal plasma cells (
Figure 2) thereby confirming a previous report [
26]. Furthermore, we provided evidence that other antioxidant enzymes such as [Cu-Zn] superoxide dismutase (SOD1), glutaredoxin 2/3 (GLRX2/3), and peroxiredoxin 6 (PRDX6) are also overexpressed (
Figure 2). Moreover, according to the molecular classification of MM [
21], the proliferating (PR) molecular subtype that is associated with a poor prognosis and a bad response to treatments, is characterized by an overexpression of
GLRX2/3 and
PRDX6 mRNAs (
Figure S2). Although the inhibition of TXNRD1 alone overcomes BTZ-resistance, cross-talk between other detoxifying enzymes may occur, in turn, limiting cell death. To our knowledge, the effects of GLRX2/3 and PRDX6 inhibitors in MM have not been reported so far. However, interestingly, the pharmacological inhibition of SOD1 by disulfiram enhances BTZ toxicity [
36]. As a whole, antioxidant enzymes may be considered as potent targets for R/R patients and the targeting of more than one enzyme may be a suitable option.
Mechanistic studies showed that AUR produces ROS (
Figure 3c) and that ROS trigger apoptosis through the activation of executioner caspase 3 (
Figure 5a). More interestingly, besides this apoptotic component, cell death proceeds also through autophagy (
Figure 5b). Zheng et al. reported recently that PX12, an inhibitor of TXN, induces mitophagy in MM cells [
23]. Mitophagy is an autophagic process of mitochondria capture and degradation by lysosomes. Moreover, the process of autophagy seems a general response to AUR or more generally to TXNRD1 inhibition in solid cancers [
37,
38,
39]. MM cells synthesize large amounts of immunoglobulins and autophagy is a process by which MM cells protect themselves from unfolded or misfolded proteins. Compromising the UPR cascade induces an autophagic cell death in MM cells [
29]. Our data confirm that ROS overproduction and subsequent redox unbalance also trigger an autophagic cell death in MM.
Current MM treatments involves proteasome inhibitors, immunomodulators, an alkylating agent melphalan, and high-dose dexamethasone [
1]. Gourzones et al. reported that melphalan induces ROS and antioxidants involved in glutathione synthesis and regeneration protect cells from melphalan-induced cell death [
40]. However, other antioxidant drugs have no effect on melphalan-mediated toxicity while protecting cells from BTZ. These data underline that all ROS-producing agents do not target the same systems, complexifying our understanding of the redox control. Since MM cells are particularly responsive to ROS inducers agents, a better knowledge of this redox control is essential for adapting new therapeutic protocols. This point is reinforced by the observation that the level of mRNA of two antioxidant genes
PRDX6 and
SOD1 are directly correlated with the overall survival of MM patients at diagnosis (
Figure S3).
MM cells show complex redox and energy metabolism changes that account for chemoresistance [
41]. However, we successfully induce MM cell death and alleviate chemoresistance by combining BTZ that induces an oxidative stress, and AUR that inhibits the TXNRD1 antioxidant enzyme and further perturbs the redox balance. This was achieved in in vitro models mimicking the tumour niche. AUR is FDA-approved for the treatment of rheumatoid arthritis and is currently assessed in clinical trials for ovarian cancers, lung cancers, and chronic lymphocytic leukaemia (
ClinicalTrials.gov). Since AUR is selectively toxic for MM cells and spares CD34+ progenitors, B cells [
24] and normal plasma cells [
26], our preclinical findings open new perspectives for R/R MM patients. Importantly, the efficiency of CFZ, a new-generation proteasome inhibitor, which seems more potent for MM patients, is enhanced when associated with resveratrol that generates ROS [
42].
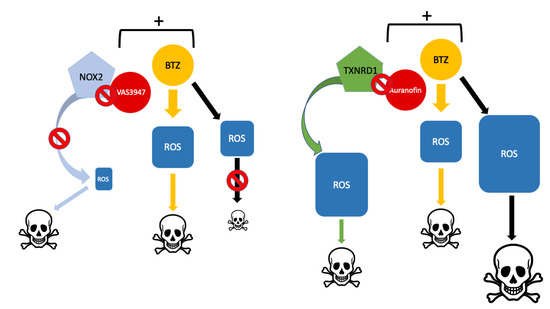
To conclude, BTZ generates ER stress and activates the UPR pathway, and, in turn, increases the level of intracellular ROS in myeloma cells. However, the unbalance of ROS levels through UPR activation with BTZ and inhibition of NOX with VAS, although both cytotoxic on myeloma cells as single agents, could have deleterious effects when combined. In contrast, the overproduction of ROS by the inhibition of the TXNRD1 antioxidant enzyme with AUR, on one hand, and the activation of UPR with BTZ, on the other, could efficiently be combined. This association is potent on MM cell lines, primary MM cells and reverses, at least in part, TME-mediated drug resistance.

 ,
, 


