
Validity and Prognostic Value of a Polygenic Risk Score for Parkinson’s Disease

 ,
,  , , , ,
Abstract
:1. Introduction
2. Materials and Methods
2.1. Samples
2.2. Genotyping, Genotype Imputation and Quality Control
2.3. Analysis of Parkinson’s Disease Polygenic Risk Score (PD-PRS)
2.4. Identification of Most Relevant PD-PRS SNPs
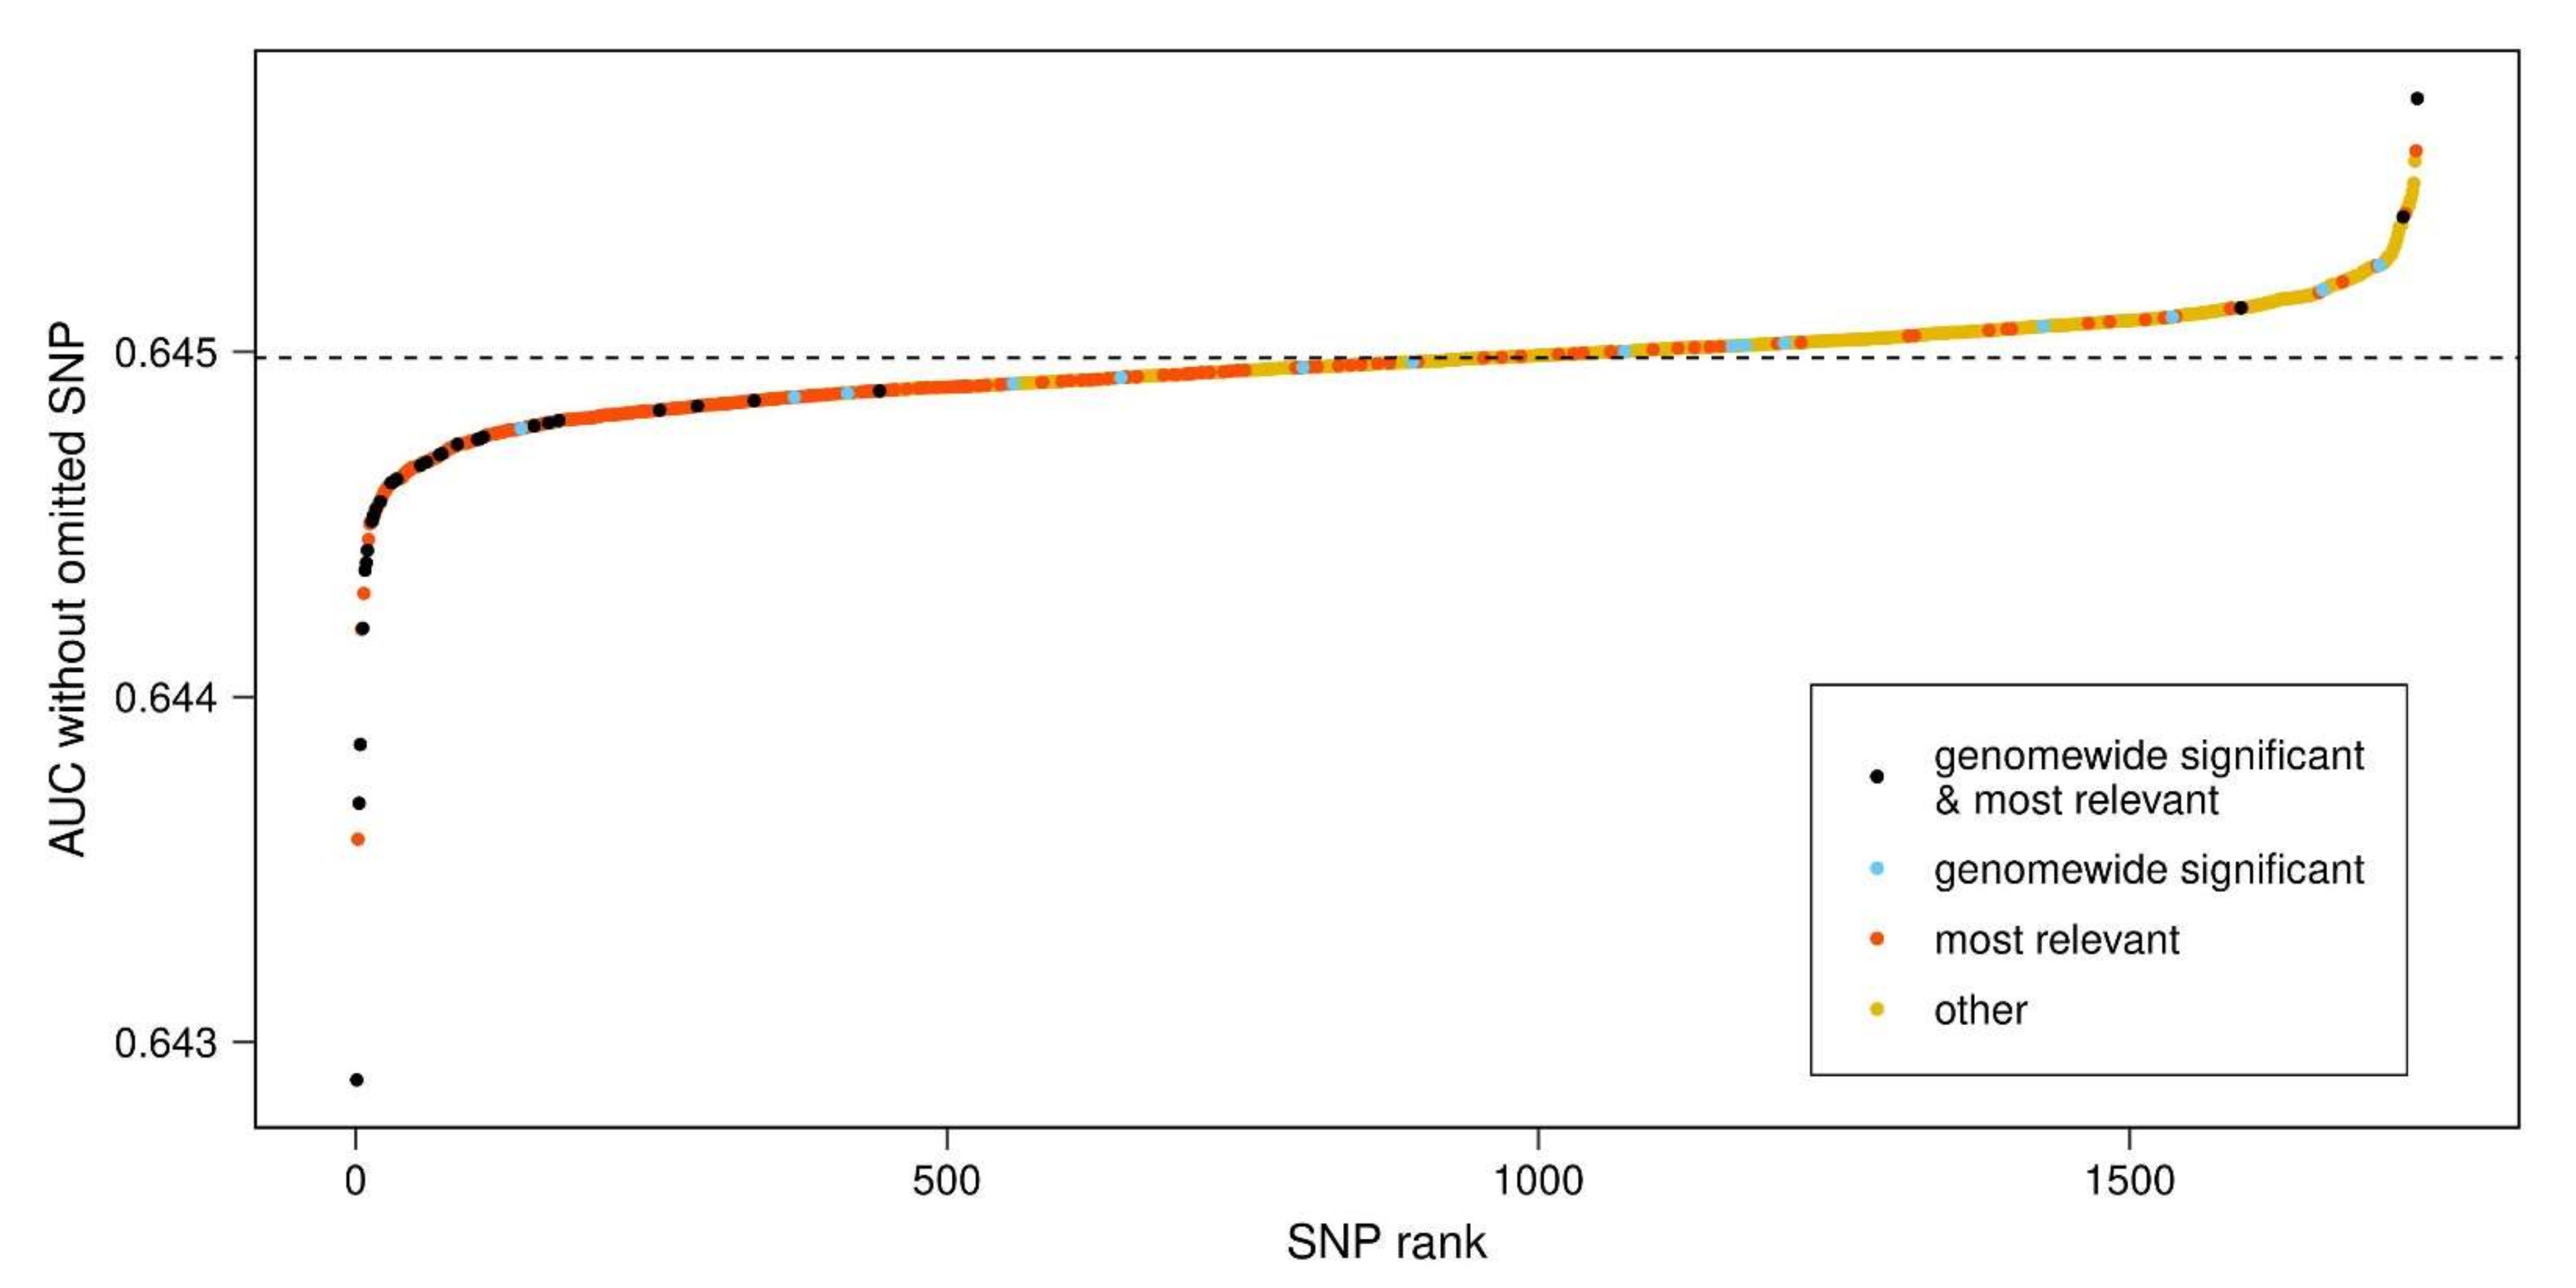
- The PD-PRS was repeatedly calculated, excluding one SNP each time, and determining the AUC of the PD-PRS without the SNP. These AUCs will be referred to as ‘AUC-SNP’ values.
- SNPs were sequentially removed from the PD-PRS based upon the steepest decline of the AUC of the remaining SNPs, until the 95% confidence interval of the residual AUC included 0.5. This set of removed SNPs will be referred to as ‘most relevant SNPs’.
- The results from step 1 and step 2 were combined in a single plot, relating the AUC-SNP values of SNPs (y axis) to their AUC-SNP-based rank (x axis) and color-coding the set of most relevant SNPs from step 2 together with the set of 47 genome-wide significant SNPs identified by Nalls et al. [2] and included in our PD-PRS.
2.5. Prognostic Value of PD-PRS
3. Results
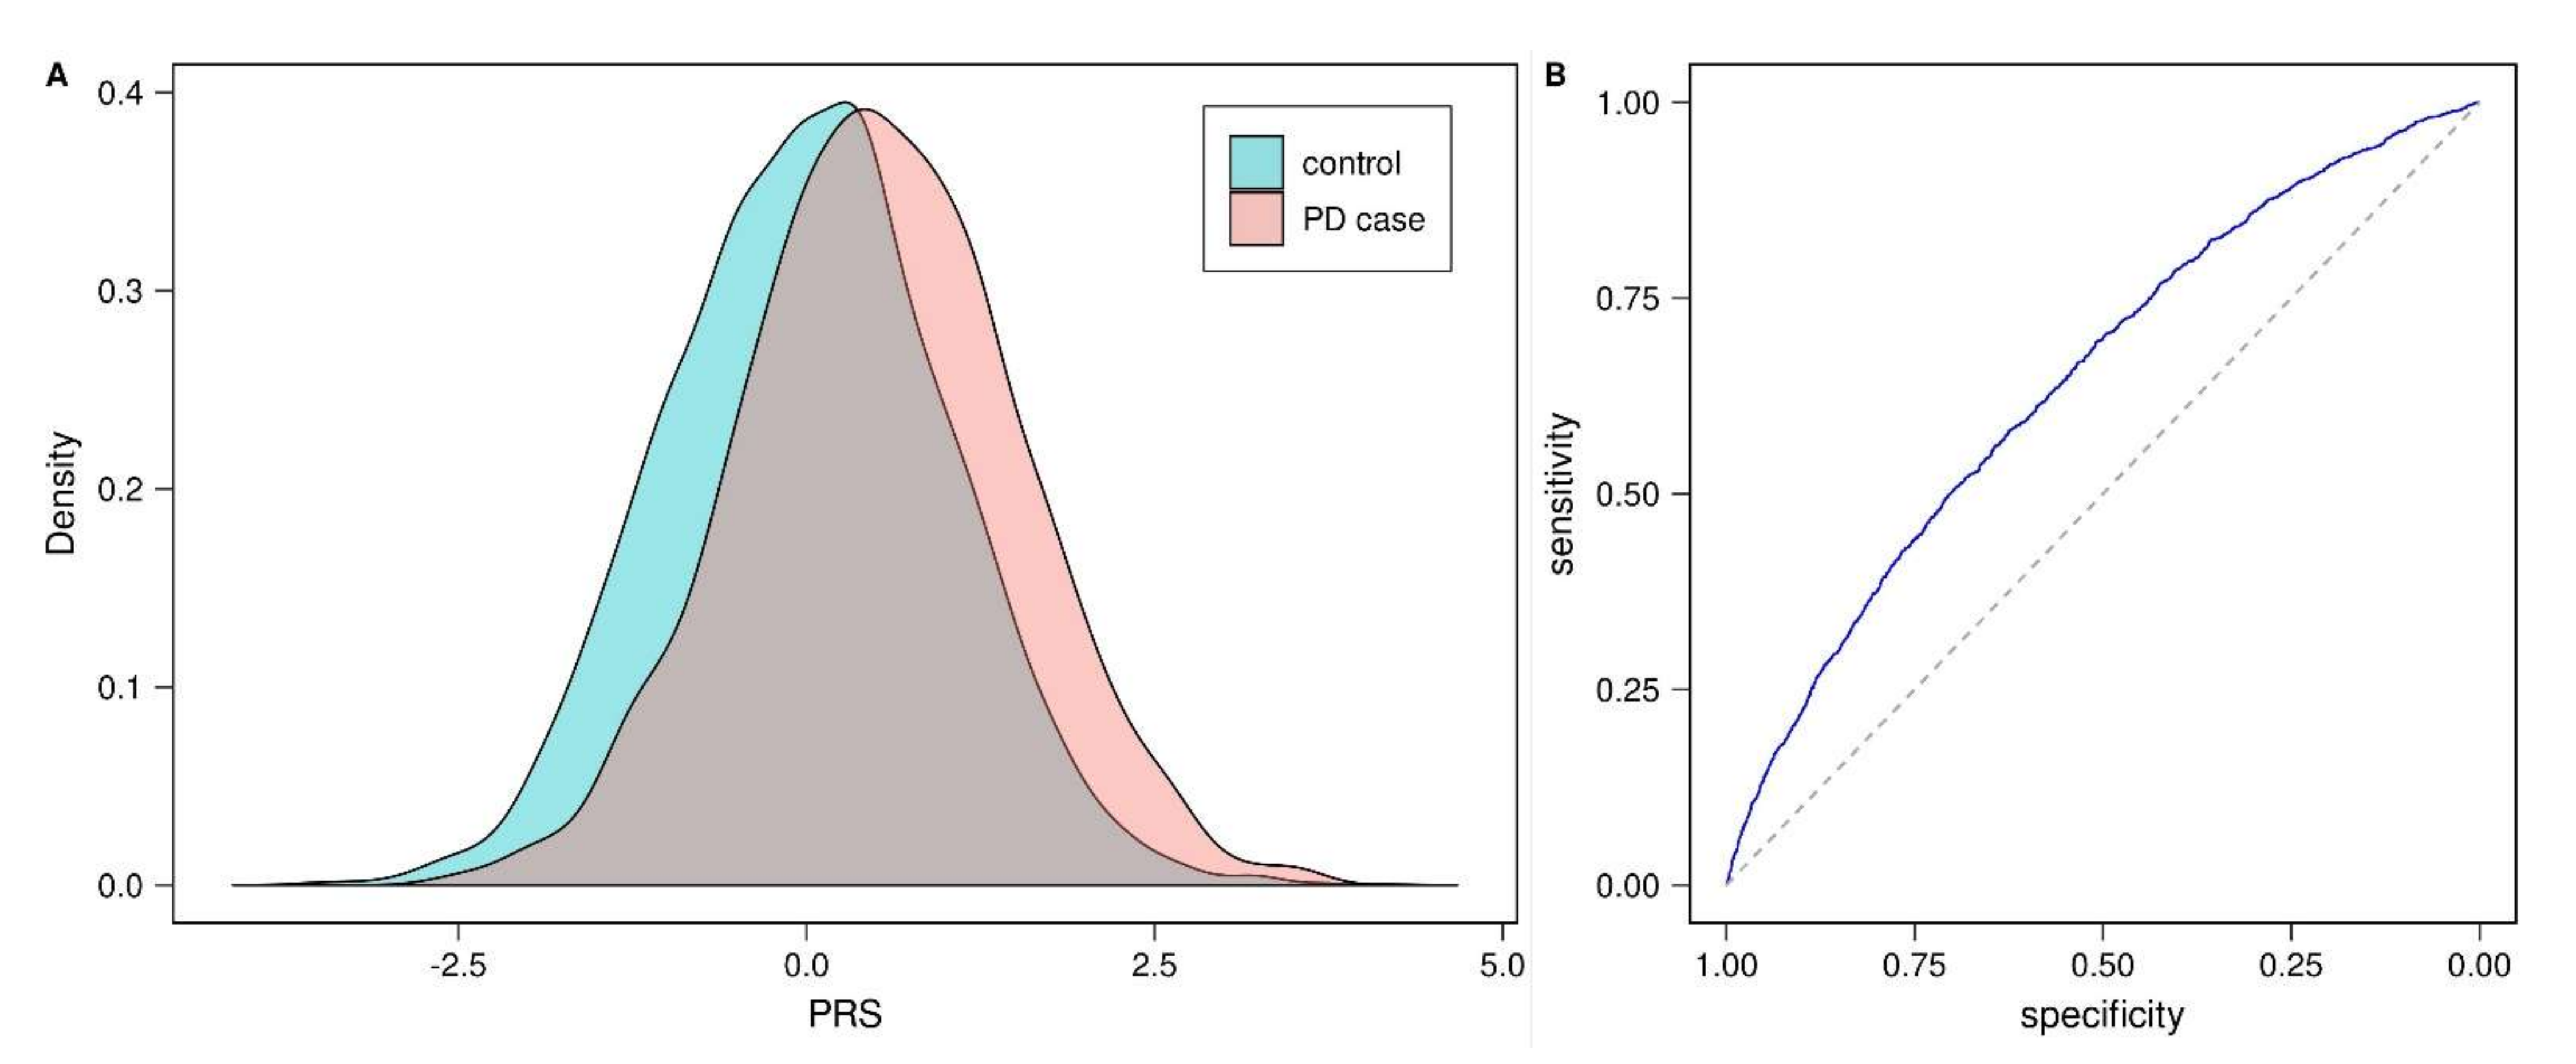
3.1. Validation of Published Parkinson’s Disease Polygenic Risk Score (PD-PRS)
3.2. Most Relevant SNPs in PD-PRS
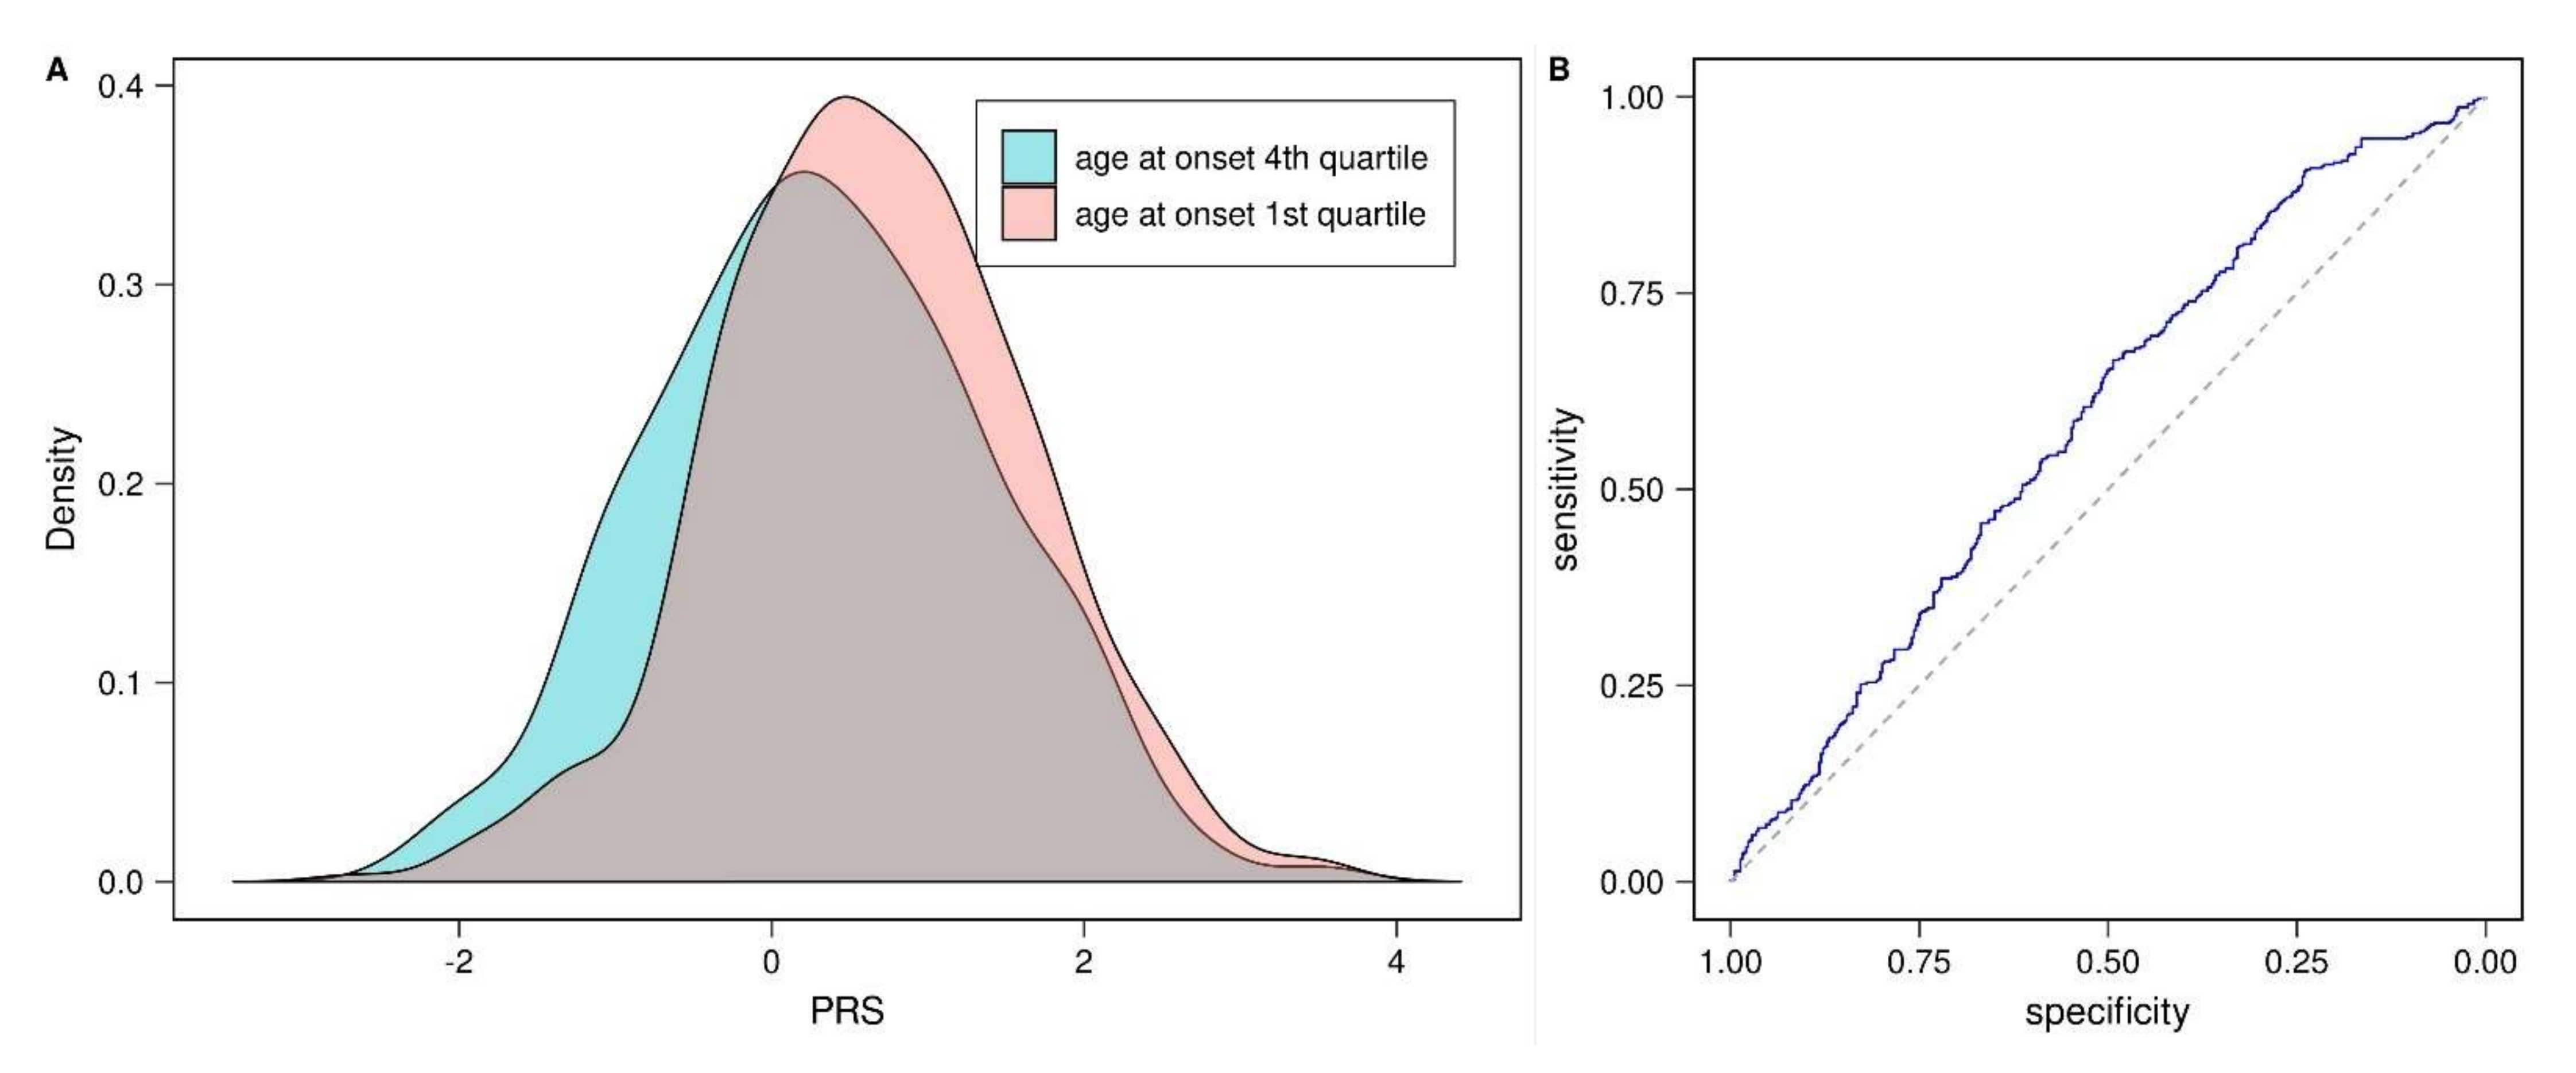
3.3. Prognostic Value of PD-PRS
4. Discussion
5. Conclusions
Author Contributions
Funding
Institutional Review Board Statement
Informed Consent Statement
Data Availability Statement
Acknowledgments
Conflicts of Interest
Appendix A
Appendix A.1. Removal of Related Individuals
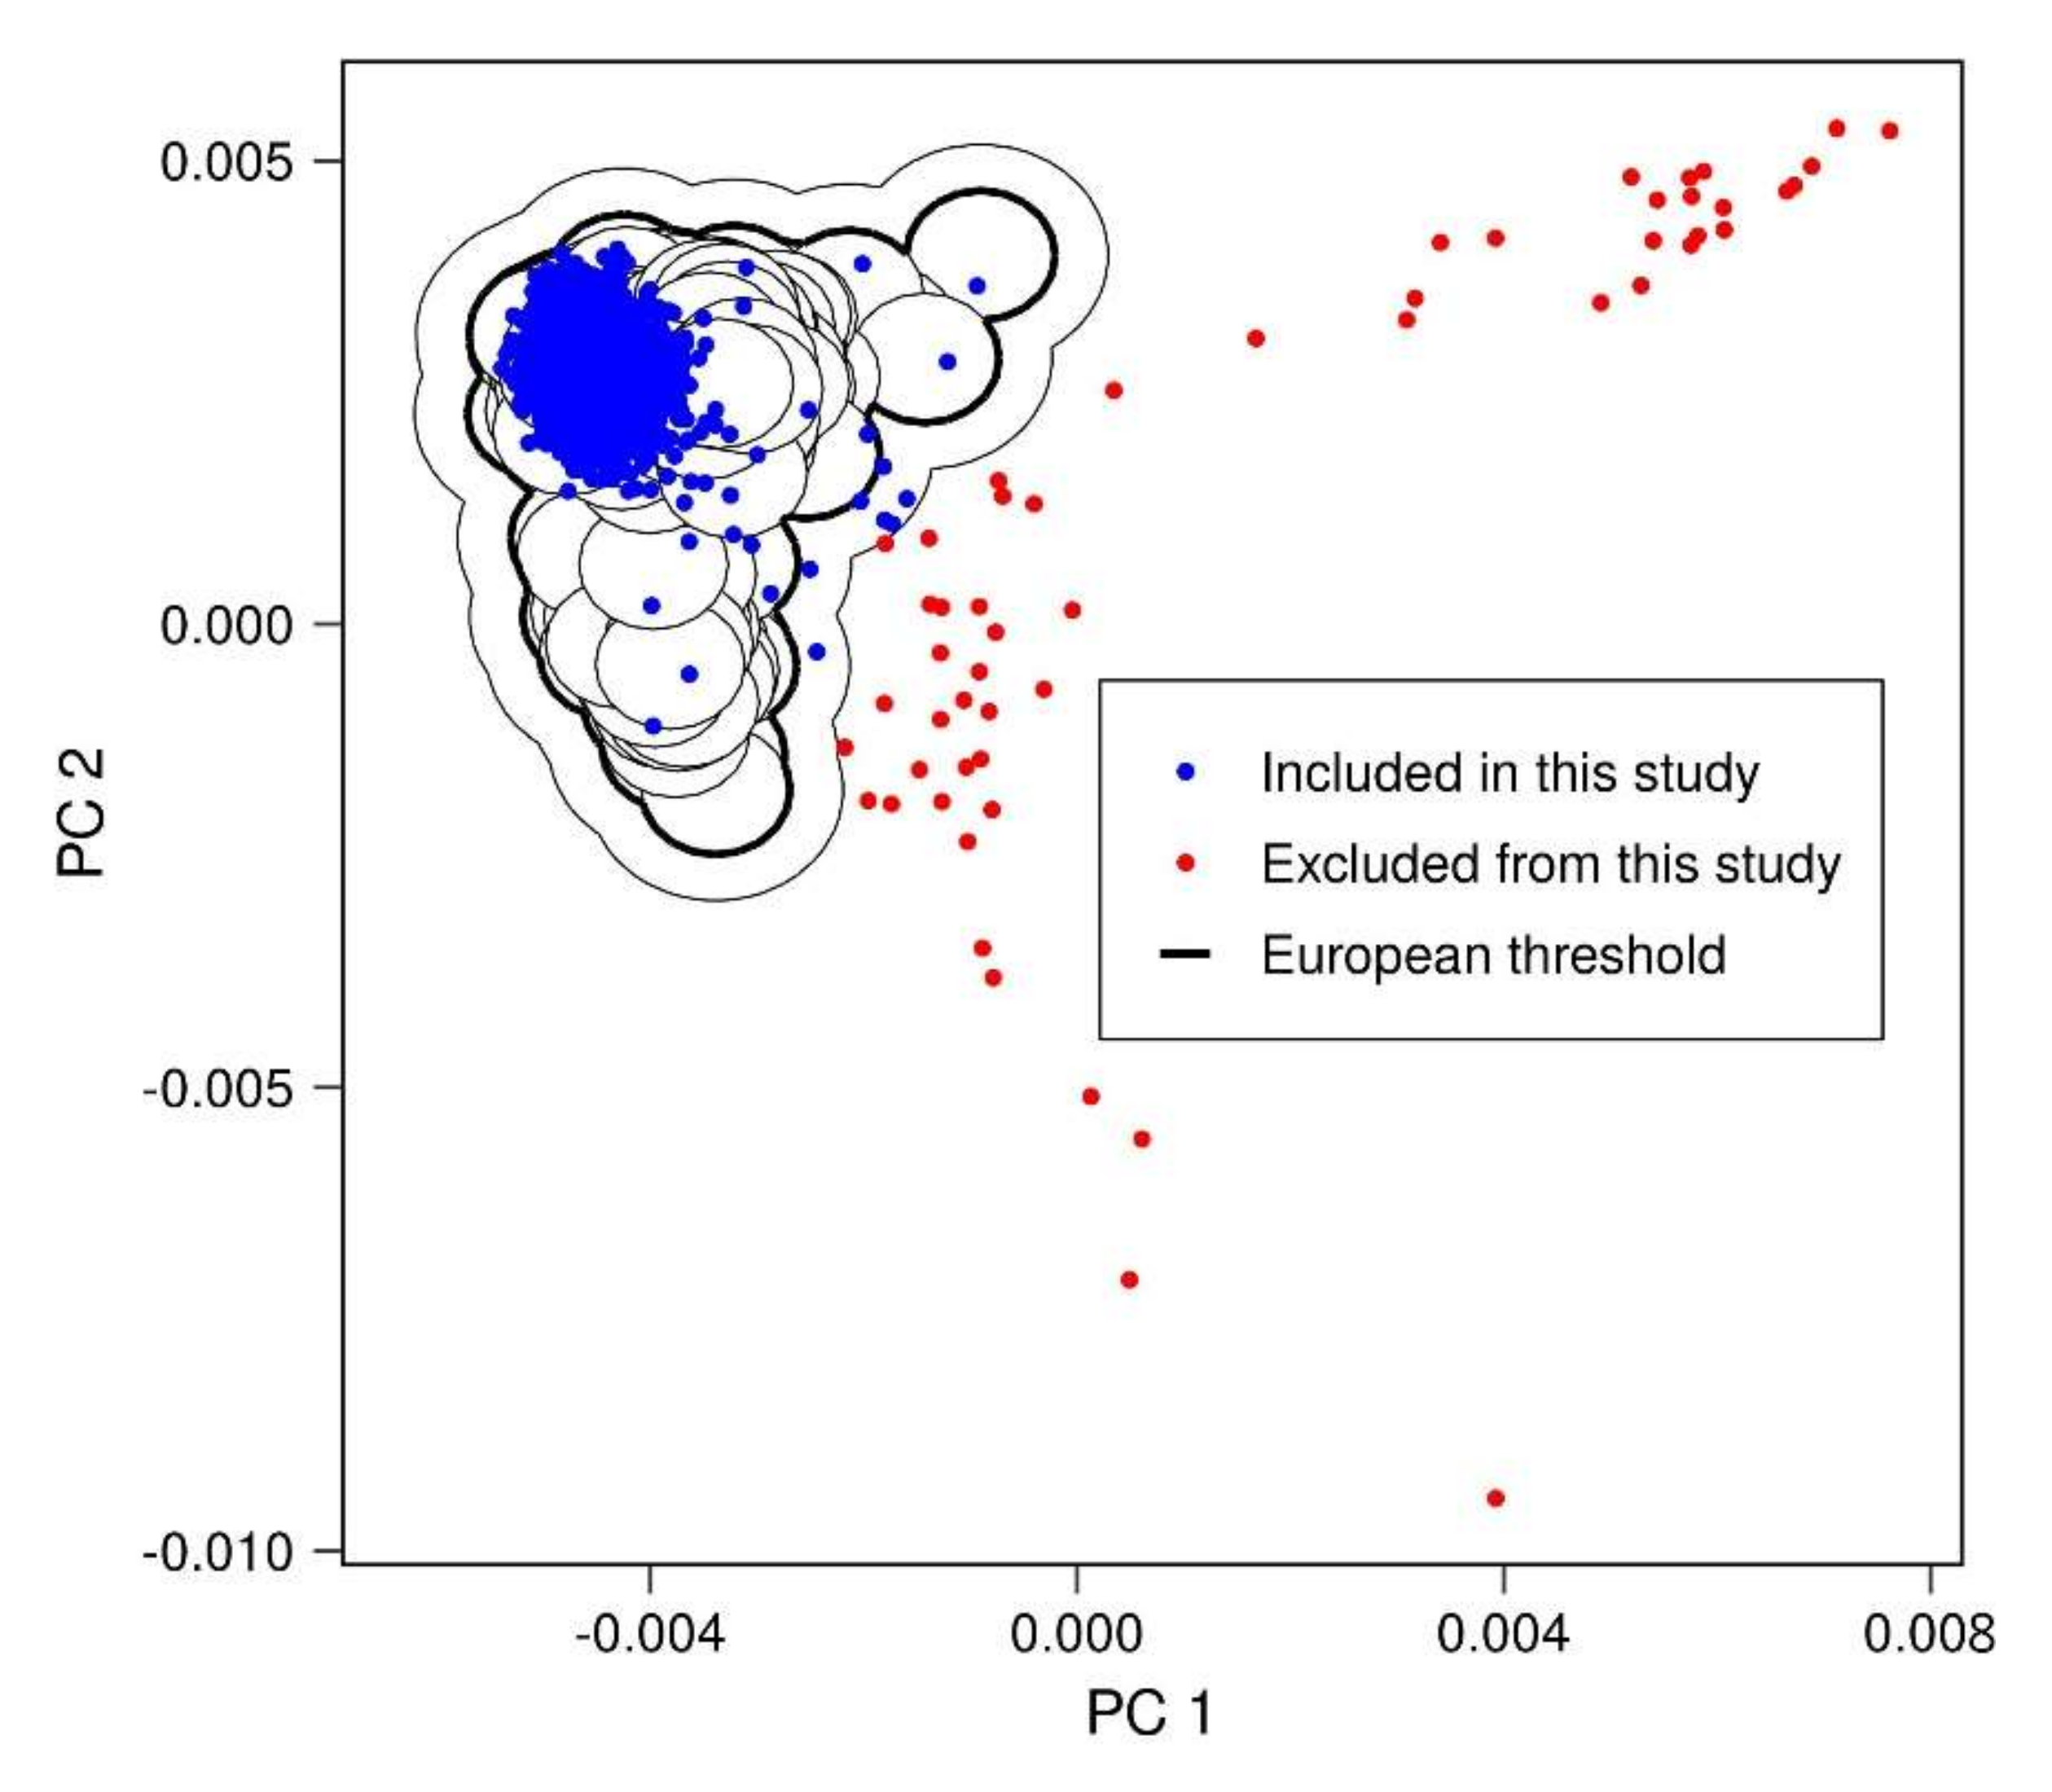
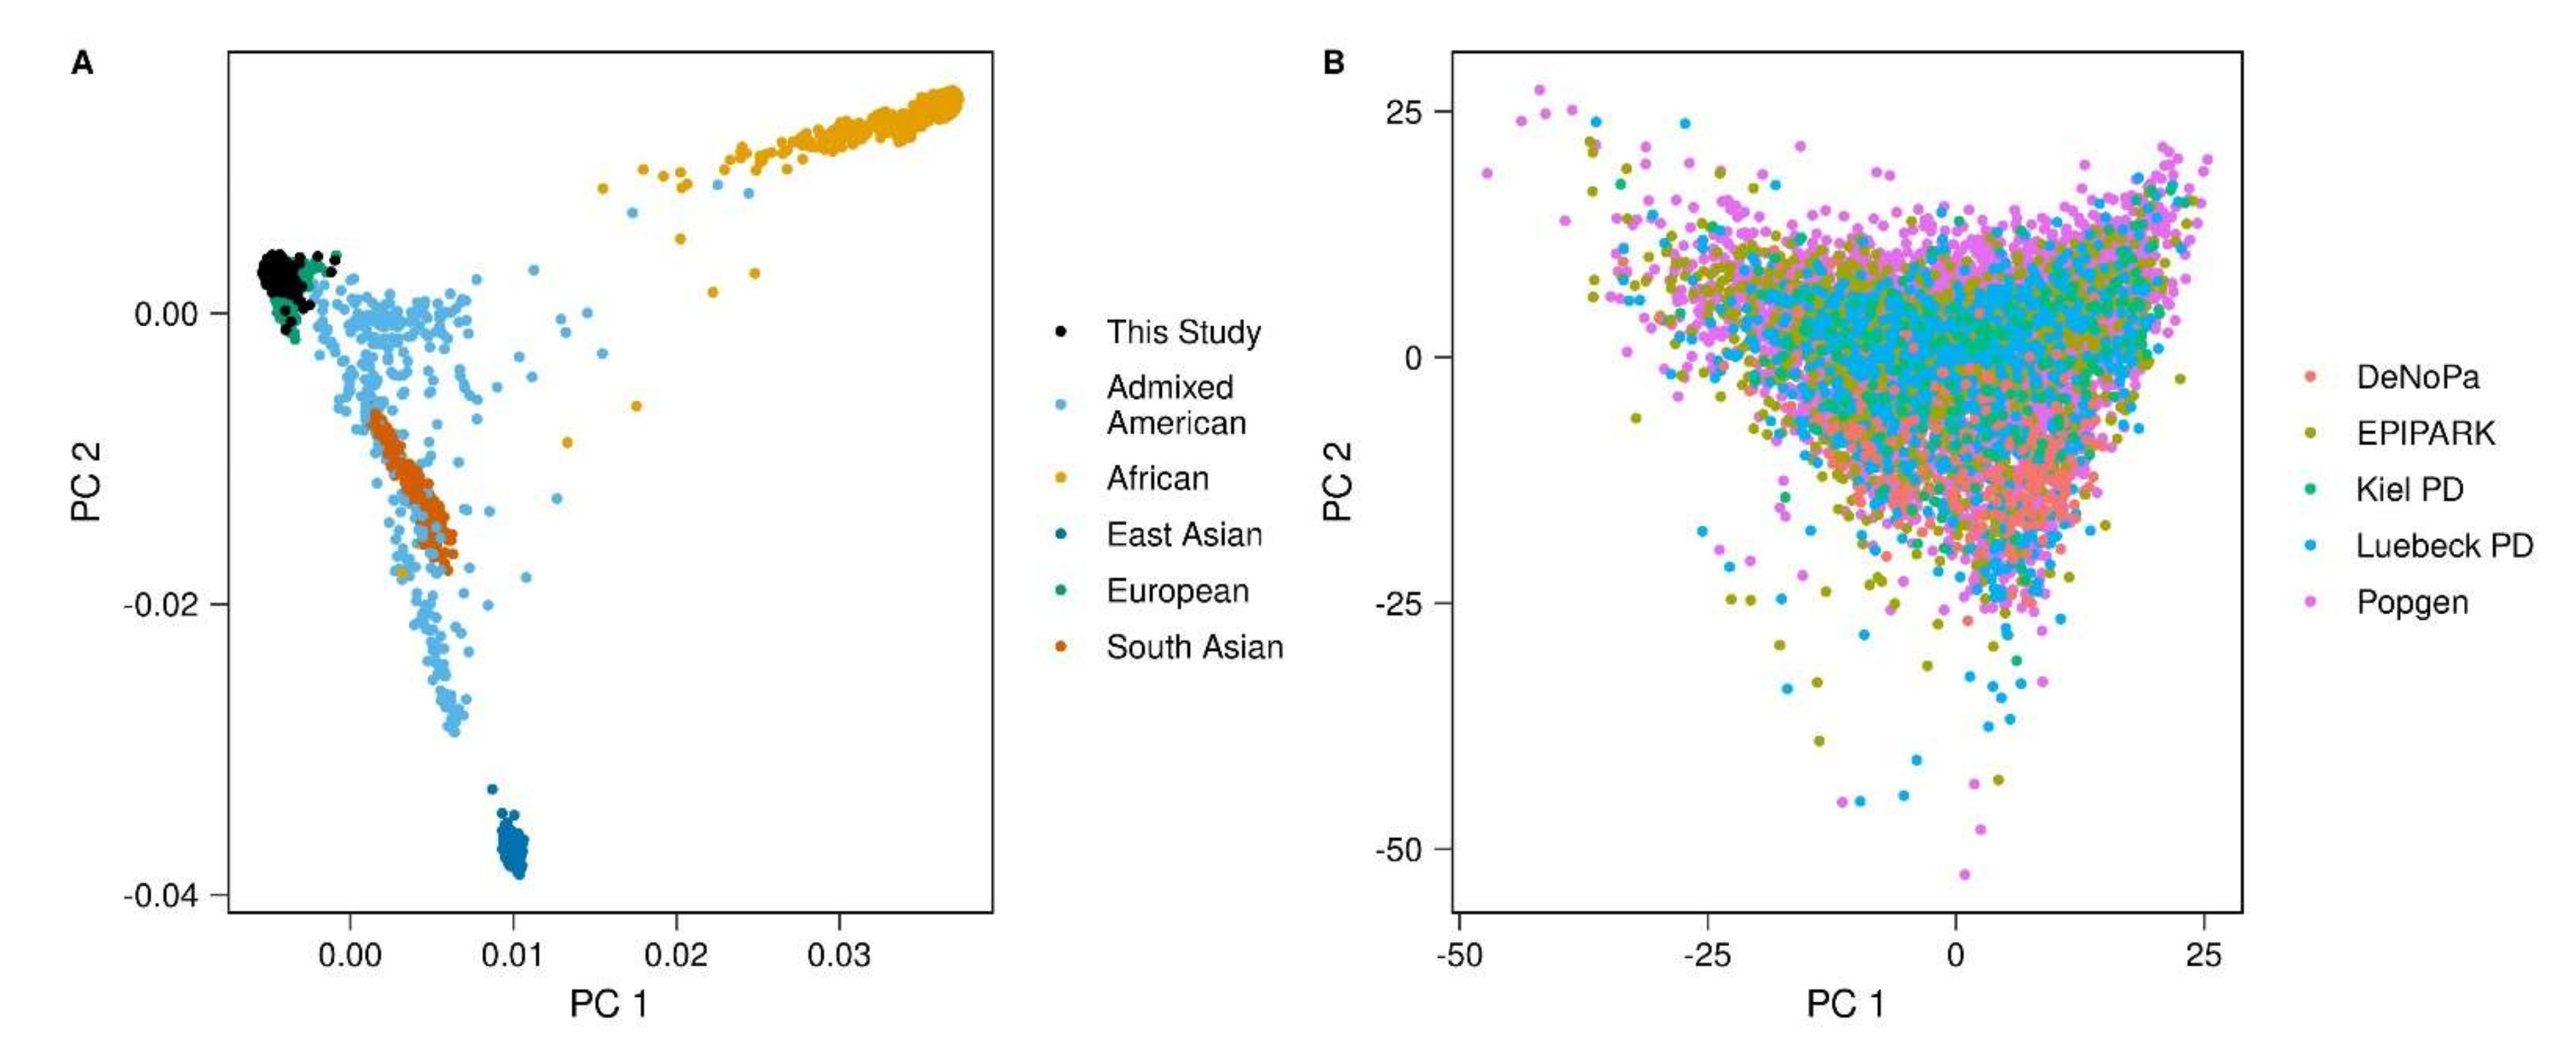
Appendix A.2. Removal of Population Outliers


| Cohort | N | N Cases | N Controls | N Female Cases | N Female Controls | Age-at-Sampling Cases 1 | Age-at-Sampling Controls 1 | Age-at-Onset Cases 1 |
|---|---|---|---|---|---|---|---|---|
| Kiel PD | 184 | 184 | 0 | 59 (32%) | 0 | 68 [61–76] | - | 58 [48–68] |
| Luebeck PD | 928 | 395 | 533 | 139 (35%) | 323 (61%) | 68 [57–75] | 44 [35–48] | 60 [51–68] |
| EPIPARK [13] | 1271 | 525 | 746 | 205 (39%) | 353 (47%) | 69 [60–76] | 67 [61–71] | 60 [52–70] |
| DeNoPa [14] | 241 | 149 | 92 | 52 (35%) | 32 (35%) | 67 [59–73] | 67 [62–70] | 67 [59–73] |
| Popgen [15,16] | 3754 | 661 | 3093 | 262 (40%) | 1527 (49%) | 71 [66–77] | 54 [41–65] | 64 [56–71] |
| SNP Location 1 | Beta 2 | GS 3 | MAF 4 |
|---|---|---|---|
| 1:1,186,833 | −0.4394 | no | 0.0178 |
| 1:145,716,763 | 0.0448 | no | not imputed |
| 1:154,837,939 | 0.2467 | no | 0.0052 |
| 1:155,205,634 | 0.7662 | yes | 0.0022 |
| 1:232,161,497 | −0.2638 | no | 0.0087 |
| 1:62,675,673 | 0.317 | no | 0.0134 |
| 2:100,906,427 | 0.1534 | no | 0.0098 |
| 2:102,368,870 | 0.2332 | no | 0.0048 |
| 2:102,655,773 | 0.2056 | no | 0.0046 |
| 2:136,388,639 | −0.0656 | no | 0.0513 |
| 2:191,364,828 | 0.2497 | no | 0.0079 |
| 2:63,783,507 | 0.173 | no | 0.0094 |
| 3:112,245,295 | −0.1391 | no | 0.9907 |
| 3:48,406,286 | 0.0789 | no | 0.0398 |
| 3:96,921,359 | 0.1607 | no | 0.0069 |
| 3:97,799,541 | 0.1819 | no | 0.0062 |
| 4:133,792,853 | 0.1797 | no | 0.0057 |
| 4:77,645,873 | −0.2104 | no | 0.0096 |
| 4:90,603,678 | −0.203 | no | 0.0087 |
| 4:90,673,143 | −0.3266 | no | 0.0032 |
| 4:90,810,340 | 0.3754 | no | 0.0062 |
| 4:90,955,553 | 0.2561 | no | 0.0052 |
| 4:90,967,340 | 0.2829 | no | 0.0081 |
| 4:91,033,047 | 0.3361 | no | 0.0078 |
| 4:91,278,545 | 0.3511 | no | 0.0022 |
| 5:112,288,617 | 0.2085 | no | 0.0076 |
| 5:141,311,896 | 0.1052 | no | 0.0434 |
| 5:177,972,560 | 0.1641 | no | 0.0080 |
| 5:60,150,889 | 0.1637 | no | 0.0069 |
| 6:109,972,453 | 0.1744 | no | 0.0071 |
| 6:27,483,385 | 0.1698 | no | 0.0072 |
| 6:32,036,055 | −0.1716 | no | 0.0063 |
| 6:34,800,390 | −0.2314 | no | 0.0029 |
| 6:48,781,938 | 0.2449 | no | 0.0087 |
| 7:6,070,199 | 0.1652 | no | 0.0096 |
| 9:116,138,770 | 0.2529 | no | 0.0042 |
| 9:139,566,889 | −0.0812 | no | 0.1093 |
| 10:102,056,734 | 0.3817 | no | 0.0019 |
| 10:103,373,463 | 0.1323 | no | 0.0099 |
| 10:103,941,875 | 0.1667 | no | 0.0080 |
| 10:105,038,008 | 0.1579 | no | 0.0076 |
| 10:27,198,118 | 0.2103 | no | 0.0012 |
| 10:48,433,720 | 0.0481 | no | 0.1562 |
| 11:93,561,149 | 0.1769 | no | 0.0041 |
| 12:123,341,500 | 0.2448 | no | 0.0064 |
| 12:123,923,612 | 0.2771 | no | 0.0077 |
| 12:40,734,202 | 2.4354 | yes | 0.0001 |
| 12:72,179,446 | 0.2839 | no | 0.0156 |
| 14:103,351,731 | 0.1973 | no | 0.0046 |
| 16:429,926 | 0.2396 | no | 0.0077 |
| 16:71,451,526 | 0.2423 | no | 0.0065 |
| 17:43,516,175 | −0.2917 | no | 0.0130 |
| 17:43,559,955 | −0.2548 | no | 0.0098 |
| 17:43,857,449 | −0.3906 | no | 0.0162 |
| 17:44,687,696 | −0.5875 | no | 0.0172 |
| 17:44,914,558 | −0.1824 | no | 0.0095 |
| 17:44,916,533 | 0.2253 | no | 0.0095 |
| 17:8,209,654 | −0.1341 | no | 0.0131 |
| 19:11,084,467 | 0.2043 | no | 0.0083 |
| 19:38,222,914 | 0.1495 | no | 0.0085 |
| 19:39,756,425 | −0.1751 | no | 0.0092 |
| 20:31,687,446 | 0.2054 | no | 0.0080 |
| median [IQR] omitted 62 SNPs | 0.207 [0.166, 0.262] 5 | 0.0080 [0.0062, 0.0098] | |
| median [IQR] 1743 SNPs used in this study | 0.056 [0.042, 0.091] 5 | 0.1916 [0.0102, 0.4407] |
| Age Interval in Years | Incidence 1 | Survival 2 | Residual Lifetime Incidence 3 |
|---|---|---|---|
| 50–54 | 0.0002 | 0.994 | 0.017 |
| 55–59 | 0.0005 | 0.992 | 0.017 |
| 60–64 | 0.0009 | 0.987 | 0.018 |
| 65–69 | 0.0016 | 0.983 | 0.018 |
| 70–74 | 0.0034 | 0.974 | 0.018 |
| 75–79 | 0.0051 | 0.958 | 0.016 |
| 80–84 | 0.0067 | 0.929 | 0.014 |
| 85–89 | 0.0072 | 0.874 | 0.011 |
| 90–94 | 0.0056 | 0.782 | 0.007 |
| 95+ | 0.0052 | 0.654 | 0.005 |
| HGNC Symbol 1 | Chr | AUC | Start 2 | End 3 | SNP Position 4 | A1 5 | A2 6 | GS 7 |
|---|---|---|---|---|---|---|---|---|
| ENSG00000251095 | 4 | 0.643 | 90,472,507 | 90,647,654 | 90,626,111 | G | A | yes |
| SNCA | 4 | 0.641 | 9,0645,250 | 90,759,466 | 90,684,278 | A | G | no |
| HIP1R | 12 | 0.640 | 123,319,000 | 123,347,507 | 123,326,598 | G | T | yes |
| TMEM175 | 4 | 0.639 | 926,175 | 952,444 | 951,947 | T | C | yes |
| SNCA | 4 | 0.638 | 90,645,250 | 90,759,466 | 90,757,294 | A | C | no |
| ASH1L | 1 | 0.637 | 155,305,059 | 155,532,598 | 155,437,711 | G | A | no |
| UBQLN4 | 1 | 0.634 | 156,005,092 | 156,023,585 | 156,007,988 | G | A | no |
| ENSG00000225342 | 12 | 0.633 | 40,579,811 | 40,617,605 | 40,614,434 | C | T | yes |
| LRRK2 | 12 | 0.633 | 40,590,546 | 40,763,087 | 40,614,434 | C | T | yes |
| STX1B | 16 | 0.632 | 31,000,577 | 31,021,949 | 31,004,169 | T | C | no |
| INPP5F | 10 | 0.631 | 121,485,609 | 121,588,652 | 121,536,327 | G | A | yes |
| CCSER1 | 4 | 0.631 | 91,048,686 | 92,523,064 | 91,164,040 | C | T | no |
| SLC2A13 | 12 | 0.630 | 40,148,823 | 40,499,891 | 40,388,109 | C | T | no |
| FBXL19 | 16 | 0.630 | 30,934,376 | 30,960,104 | 30,943,096 | A | G | no |
| ENSG00000251095 | 4 | 0.629 | 90,472,507 | 90,647,654 | 90,619,032 | C | T | no |
| CAB39L | 13 | 0.629 | 49,882,786 | 50,018,262 | 49,927,732 | T | C | yes |
| STK39 | 2 | 0.628 | 168,810,530 | 169,104,651 | 168,979,290 | C | T | no |
| CCT3 | 1 | 0.628 | 156,278,759 | 156,337,664 | 156,300,731 | T | C | no |
| ENSG00000225342 | 12 | 0.627 | 40,579,811 | 40,617,605 | 40,614,656 | A | G | no |
| LRRK2 | 12 | 0.627 | 40,590,546 | 40,763,087 | 40,614,656 | A | G | no |
| SH3GL2 | 9 | 0.627 | 17,579,080 | 17,797,127 | 17,726,888 | C | T | no |
| LRRK2 | 12 | 0.626 | 40,590,546 | 40,763,087 | 40,713,899 | T | C | no |
| ENSG00000251095 | 4 | 0.625 | 90,472,507 | 90,647,654 | 90,573,396 | G | A | no |
| ASXL3 | 18 | 0.625 | 31,158,579 | 31,331,156 | 31,304,318 | G | T | yes |
| SH3GL2 | 9 | 0.624 | 17,579,080 | 17,797,127 | 17,579,690 | T | G | yes |
| ENSG00000259675 | 15 | 0.623 | 61,931,548 | 62,007,370 | 61,997,385 | T | C | yes |
| RGS10 | 10 | 0.623 | 121,259,340 | 121,302,220 | 121,260,786 | A | G | no |
| CASC16 | 16 | 0.622 | 52,586,002 | 52,686,017 | 52,636,242 | C | A | yes |
| EPRS | 1 | 0.621 | 220,141,943 | 220,220,000 | 220,163,026 | C | A | no |
| BRIP1 | 17 | 0.621 | 59,758,627 | 59,940,882 | 59,918,091 | A | G | no |
| PCGF3 | 4 | 0.620 | 699,537 | 764,428 | 758,444 | C | T | no |
| ENSG00000249592 | 4 | 0.620 | 756,175 | 775,637 | 758,444 | C | T | no |
| ENSG00000233799 | 4 | 0.620 | 758,275 | 758,862 | 758,444 | C | T | no |
| NDUFAF2 | 5 | 0.620 | 60,240,956 | 60,448,853 | 60,297,500 | A | G | no |
| DLG2 | 11 | 0.619 | 83,166,055 | 85,338,966 | 83,488,901 | C | T | no |
| SEC16A | 9 | 0.618 | 139,334,549 | 139,372,141 | 139,336,813 | T | G | no |
| FCGR2A | 1 | 0.617 | 161,475,220 | 161,493,803 | 161,478,859 | T | C | no |
| SPTSSB | 3 | 0.617 | 161,062,580 | 161,090,668 | 161,077,630 | A | G | yes |
| DSCAM | 21 | 0.616 | 41,382,926 | 42,219,065 | 41,452,034 | C | T | no |
| GAK | 4 | 0.616 | 843,064 | 926,161 | 893,712 | C | T | no |
| CTSB | 8 | 0.615 | 11,700,033 | 11,726,957 | 11,707,174 | A | G | no |
| ASH1L | 1 | 0.615 | 155,305,059 | 155,532,598 | 155,347,819 | A | C | no |
| DCST1 | 1 | 0.614 | 155,006,300 | 155,023,406 | 155,014,968 | T | G | no |
| LRSAM1 | 9 | 0.614 | 130,213,765 | 130,265,780 | 130,261,113 | G | A | no |
| UBAP2 | 9 | 0.614 | 33,921,691 | 34,048,947 | 34,046,391 | C | T | yes |
| GCH1 | 14 | 0.613 | 55,308,726 | 55,369,570 | 55,348,869 | C | T | yes |
| PCGF2 | 17 | 0.613 | 36,890,150 | 36,906,070 | 36,896,751 | G | A | no |
| SETD5 | 3 | 0.612 | 9,439,299 | 9,520,924 | 9,504,099 | G | A | no |
| LRRK2 | 12 | 0.611 | 40,590,546 | 40,763,087 | 40,753,796 | T | C | no |
| PRSS3 | 9 | 0.611 | 33,750,515 | 33,799,230 | 33,778,399 | G | A | no |
| KANSL1 | 17 | 0.611 | 44,107,282 | 44,302,733 | 44,189,067 | A | G | no |
| ENSG00000214871 | 7 | 0.610 | 23,210,760 | 23,234,503 | 23,232,659 | T | C | no |
| NUPL2 | 7 | 0.610 | 23,221,446 | 23,240,630 | 23,232,659 | T | C | no |
| SEC23IP | 10 | 0.610 | 121,652,223 | 121,702,014 | 121,667,020 | T | C | no |
| ENSG00000251095 | 4 | 0.610 | 90,472,507 | 90,647,654 | 90,538,467 | A | G | no |
| SLC38A1 | 12 | 0.609 | 46,576,846 | 46,663,800 | 46,623,807 | G | A | no |
| MED12L | 3 | 0.609 | 150,803,484 | 151,154,860 | 151,112,968 | C | A | no |
| NOD2 | 16 | 0.608 | 50,727,514 | 50,766,988 | 50,736,656 | A | G | yes |
| UBTF | 17 | 0.608 | 42,282,401 | 42,298,994 | 42,294,462 | A | G | no |
| BTN2A2 | 6 | 0.608 | 26,383,324 | 26,395,102 | 26,389,926 | C | T | no |
| PGS1 | 17 | 0.607 | 76,374,721 | 76,421,195 | 76,377,458 | A | G | no |
| MRVI1 | 11 | 0.607 | 10,594,638 | 10,715,535 | 10,660,840 | G | T | no |
| TMEM163 | 2 | 0.607 | 135,213,330 | 135,476,570 | 135,443,940 | A | G | no |
| ENSG00000264031 | 17 | 0.606 | 27,887,565 | 28,034,108 | 27,897,585 | T | C | no |
| TP53I13 | 17 | 0.606 | 27,893,070 | 27,900,175 | 27,897,585 | T | C | no |
| ZNF165 | 6 | 0.606 | 28,048,753 | 28,057,341 | 28,054,198 | A | G | no |
| PCGF3 | 4 | 0.606 | 699,537 | 764,428 | 733,630 | G | A | no |
| PITPNM2 | 12 | 0.605 | 123,468,027 | 123,634,562 | 123,585,705 | C | T | no |
| PCGF3 | 4 | 0.605 | 699,537 | 764,428 | 734,351 | A | G | no |
| C10orf32-ASMT | 10 | 0.605 | 104,614,029 | 104,661,656 | 104,635,103 | G | A | no |
| AS3MT | 10 | 0.605 | 104,629,273 | 104,661,656 | 104,635,103 | G | A | no |
| ENSG00000232667 | 7 | 0.604 | 79,959,508 | 80,014,295 | 79,998,372 | T | C | no |
| RNF141 | 11 | 0.604 | 10,533,225 | 10,562,777 | 10,558,777 | A | G | yes |
| STK39 | 2 | 0.604 | 168,810,530 | 169,104,651 | 169,023,263 | T | C | no |
| CCSER1 | 4 | 0.603 | 91,048,686 | 92,523,064 | 91,057,794 | A | G | no |
| SEZ6L2 | 16 | 0.602 | 29,882,480 | 29,910,868 | 29,892,184 | G | A | no |
| VSTM5 | 11 | 0.602 | 93,551,398 | 93,583,697 | 93,576,556 | T | C | no |
| SPATA19 | 11 | 0.602 | 133,710,526 | 133,715,433 | 133,714,560 | A | C | no |
| ENSG00000251095 | 4 | 0.601 | 90,472,507 | 90,647,654 | 90,606,518 | T | G | no |
| H2AFX | 11 | 0.600 | 118,964,564 | 118,966,177 | 118,965,479 | G | A | no |
| MSTO1 | 1 | 0.599 | 155,579,979 | 155,718,153 | 155,698,425 | C | T | no |
| MSTO2P | 1 | 0.599 | 155,581,011 | 155,720,105 | 155,698,425 | C | T | no |
| DAP3 | 1 | 0.599 | 155,657,751 | 155,708,801 | 155,698,425 | C | T | no |
| GABRB1 | 4 | 0.599 | 46,995,740 | 47,428,461 | 47,372,139 | A | C | no |
| TMEM163 | 2 | 0.599 | 135,213,330 | 135,476,570 | 135,464,616 | A | G | yes |
| MFSD6 | 2 | 0.598 | 191,273,081 | 191,373,931 | 191,300,402 | A | G | no |
| AMPD3 | 11 | 0.598 | 10,329,860 | 10,529,126 | 10,525,791 | A | C | no |
| ADD1 | 4 | 0.598 | 2,845,584 | 2,931,803 | 2,901,349 | A | G | no |
| NSF | 17 | 0.597 | 44,668,035 | 44,834,830 | 44,808,902 | G | A | no |
| HCAR1 | 12 | 0.597 | 123,104,824 | 123,215,390 | 123,124,138 | T | C | no |
| NR1I3 | 1 | 0.597 | 161,199,456 | 161,208,092 | 161,205,966 | G | T | no |
| GAK | 4 | 0.596 | 843,064 | 926,161 | 903,249 | G | A | no |
| EIF3K | 19 | 0.595 | 39,109,735 | 39,127,595 | 39,116,961 | A | G | no |
| BPTF | 17 | 0.595 | 65,821,640 | 65,980,494 | 65,885,911 | C | T | no |
| FBRSL1 | 12 | 0.595 | 133,066,137 | 133,161,774 | 133,081,895 | C | T | no |
| ENSG00000260958 | 16 | 0.594 | 34,442,308 | 34,518,517 | 34,466,252 | T | C | no |
| RIT2 | 18 | 0.594 | 40,323,192 | 40,695,657 | 40,673,380 | A | G | yes |
| C10orf2 | 10 | 0.594 | 102,747,124 | 102,754,158 | 102,747,363 | G | T | no |
| MYOC | 1 | 0.593 | 171,604,557 | 171,621,823 | 171,612,267 | G | A | no |
| XPO1 | 2 | 0.592 | 61,704,984 | 61,765,761 | 61,763,207 | T | C | no |
| CRHR1 | 17 | 0.591 | 43,699,267 | 43,913,194 | 43,744,203 | C | T | yes |
| ENSG00000263715 | 17 | 0.591 | 43,699,274 | 43,893,909 | 43,744,203 | C | T | yes |
| PPP6R2 | 22 | 0.590 | 50,781,733 | 50,883,514 | 50,794,282 | C | A | no |
| NRG1 | 8 | 0.590 | 31,496,902 | 32,622,548 | 31,942,557 | G | A | no |
| NRG1-IT1 | 8 | 0.590 | 31,883,735 | 31,996,991 | 31,942,557 | G | A | no |
| LTK | 15 | 0.590 | 41,795,836 | 41,806,085 | 41,798,614 | T | C | no |
| SAA1 | 11 | 0.589 | 18,287,721 | 18,291,524 | 18,290,067 | G | T | no |
| KCNIP3 | 2 | 0.589 | 95,963,052 | 96,051,825 | 96,025,765 | A | G | no |
| PCGF3 | 4 | 0.588 | 699,537 | 764,428 | 749,620 | T | G | no |
| ART3 | 4 | 0.588 | 76,932,337 | 77,033,955 | 76,990,450 | C | T | no |
| ARL15 | 5 | 0.588 | 53,179,775 | 53,606,412 | 53,537,742 | G | A | no |
| ENSG00000272414 | 4 | 0.587 | 77,135,193 | 77,204,933 | 77,198,054 | C | T | yes |
| FAM47E | 4 | 0.587 | 77,172,874 | 77,232,282 | 77,198,054 | C | T | yes |
| FAM47E-STBD1 | 4 | 0.587 | 77,172,886 | 77,232,752 | 77,198,054 | C | T | yes |
| SCARB2 | 4 | 0.587 | 77,079,890 | 77,135,046 | 77,100,807 | T | C | no |
| WNT3 | 17 | 0.587 | 44,839,872 | 44,910,520 | 44,868,187 | G | A | no |
| DSCR9 | 21 | 0.586 | 38,580,804 | 38,594,037 | 38,593,620 | G | T | no |
| MYLK3 | 16 | 0.586 | 46,740,891 | 46,824,319 | 46,778,070 | G | A | no |
| ENSG00000251095 | 4 | 0.586 | 90,472,507 | 90,647,654 | 90,513,701 | G | A | no |
| BST1 | 4 | 0.585 | 15,704,573 | 15,739,936 | 15,737,348 | G | A | yes |
| C9orf129 | 9 | 0.585 | 96,080,481 | 96,108,696 | 96,087,807 | C | T | no |
| MMRN1 | 4 | 0.584 | 90,800,683 | 90,875,780 | 90,804,532 | C | T | no |
| MAPT-AS1 | 17 | 0.584 | 43,921,017 | 43,972,966 | 43,935,838 | T | C | no |
| MCCC1 | 3 | 0.584 | 182,733,006 | 182,833,863 | 182,760,073 | T | G | yes |
| MUC19 | 12 | 0.583 | 40,787,197 | 40,964,632 | 40,829,565 | G | A | no |
| ENSG00000258167 | 12 | 0.583 | 40,789,655 | 40,837,649 | 40,829,565 | G | A | no |
| CCNT2-AS1 | 2 | 0.583 | 135,493,034 | 135,676,280 | 135,500,179 | G | A | no |
| XKR6 | 8 | 0.583 | 10,753,555 | 11,058,875 | 10,999,583 | C | T | no |
| RCAN2 | 6 | 0.582 | 46,188,475 | 46,459,709 | 46,229,444 | C | T | no |
| ITGA8 | 10 | 0.582 | 15,555,948 | 15,762,124 | 15,563,450 | C | T | no |
| RANBP9 | 6 | 0.581 | 13,621,730 | 13,711,796 | 13,657,040 | G | A | no |
| IGF2BP3 | 7 | 0.581 | 23,349,828 | 23,510,086 | 23,462,162 | C | A | no |
| FAM47E | 4 | 0.580 | 77,135,193 | 77,204,933 | 77,202,861 | A | G | no |
| ENSG00000272414 | 4 | 0.580 | 77,172,874 | 77,232,282 | 77,202,861 | A | G | no |
| FAM47E-STBD1 | 4 | 0.580 | 77,172,886 | 77,232,752 | 77,202,861 | A | G | no |
| ENSG00000251095 | 4 | 0.579 | 90,472,507 | 90,647,654 | 90,594,987 | G | A | no |
| SCARB2 | 4 | 0.578 | 77,079,890 | 77,135,046 | 77,111,032 | C | T | no |
| ARHGAP27 | 17 | 0.578 | 43,471,275 | 43,511,787 | 43,472,507 | A | G | no |
| ZYG11B | 1 | 0.578 | 53,192,126 | 53,293,014 | 53,233,374 | T | C | no |
| ENSG00000244128 | 3 | 0.577 | 164,924,748 | 165,373,211 | 165,020,212 | A | G | no |
| PER1 | 17 | 0.577 | 8,043,790 | 8,059,824 | 8,051,639 | A | G | no |
| KCNS3 | 2 | 0.577 | 18,059,114 | 18,542,882 | 18,132,092 | C | T | no |
| HIBCH | 2 | 0.576 | 191,054,461 | 191,208,919 | 191,071,057 | G | A | no |
| RN7SL416P | 7 | 0.576 | 100,127,987 | 100,128,282 | 100,128,114 | G | A | no |
| YLPM1 | 14 | 0.575 | 75,230,069 | 75,322,244 | 75,234,329 | G | A | no |
| FGFRL1 | 4 | 0.574 | 1,003,724 | 1,020,685 | 1,008,212 | C | T | no |
| CRHR1 | 17 | 0.574 | 43,699,267 | 43,913,194 | 43,798,308 | G | A | yes |
| ENSG00000263715 | 17 | 0.574 | 43,699,274 | 43,893,909 | 43,798,308 | G | A | yes |
| HIP1R | 12 | 0.574 | 123,319,000 | 123,347,507 | 123,334,442 | C | T | no |
| MYO15B | 17 | 0.573 | 73,584,139 | 73,622,929 | 73,587,257 | A | G | no |
| PITPNM2 | 12 | 0.573 | 123,468,027 | 123,634,562 | 123,525,280 | A | G | no |
| PREX2 | 8 | 0.573 | 68,864,353 | 69,149,265 | 69,029,244 | C | A | no |
| ENSG00000255468 | 11 | 0.573 | 66,115,421 | 66,132,275 | 66,115,782 | G | T | no |
| SIPA1L2 | 1 | 0.572 | 232,533,711 | 232,697,304 | 232,664,611 | C | T | yes |
| AMPD3 | 11 | 0.571 | 10,329,860 | 10,529,126 | 10,475,856 | G | A | no |
| PAM | 5 | 0.571 | 102,089,685 | 102,366,809 | 102,363,402 | C | T | no |
| IFT140 | 16 | 0.571 | 1,560,428 | 1,662,111 | 1,593,645 | C | T | no |
| TMEM204 | 16 | 0.571 | 1,578,689 | 1,605,581 | 1,593,645 | C | T | no |
| CLIP1 | 12 | 0.570 | 122,755,979 | 122,907,179 | 122,891,863 | C | T | no |
| ABCB9 | 12 | 0.570 | 123,405,498 | 123,466,196 | 123,418,656 | G | T | no |
| ZC3H7B | 22 | 0.570 | 41,697,526 | 41,756,151 | 41,755,105 | A | G | no |
| CRHR1 | 17 | 0.569 | 43,699,267 | 43,913,194 | 43,784,228 | T | C | no |
| ENSG00000263715 | 17 | 0.569 | 43,699,274 | 43,893,909 | 43,784,228 | T | C | no |
| LRRK2 | 12 | 0.569 | 40,590,546 | 40,763,087 | 40,730,463 | C | T | no |
| ENSG00000235423 | 12 | 0.569 | 123,736,577 | 123,746,030 | 123,744,082 | C | A | no |
| MSRA | 8 | 0.568 | 9,911,778 | 10,286,401 | 10,280,818 | A | C | no |
| LYVE1 | 11 | 0.568 | 10,578,513 | 10,633,236 | 10,628,883 | G | A | no |
| MRVI1 | 11 | 0.568 | 10,594,638 | 10,715,535 | 10,628,883 | G | A | no |
| FAM162A | 3 | 0.568 | 122,103,023 | 122,131,181 | 122,109,601 | T | C | no |
| MMRN1 | 4 | 0.567 | 90,800,683 | 90,875,780 | 90,868,355 | T | C | no |
| ENSG00000236656 | 1 | 0.567 | 158,444,244 | 158,464,676 | 158,453,419 | A | C | no |
| ENSG00000235495 | 2 | 0.567 | 67,792,736 | 67,911,209 | 67,806,472 | A | G | no |
| DEFB119 | 20 | 0.566 | 29,964,967 | 29,978,406 | 29,971,435 | G | A | no |
| NGEF | 2 | 0.566 | 233,743,396 | 233,877,982 | 233,864,457 | C | T | no |
| MGAT5 | 2 | 0.566 | 134,877,554 | 135,212,192 | 135,202,455 | A | G | no |
| ASAH1 | 8 | 0.565 | 17,913,934 | 17,942,494 | 17,927,609 | C | T | no |
| CPNE8 | 12 | 0.565 | 39,040,624 | 39,301,232 | 39,174,139 | T | G | no |
| SEMA3G | 3 | 0.565 | 52,467,069 | 52,479,101 | 52,468,940 | T | C | no |
| PBRM1 | 3 | 0.564 | 52,579,368 | 52,719,933 | 52,649,748 | A | G | no |
| HMBOX1 | 8 | 0.564 | 28,747,911 | 28922281 | 28,809,951 | A | G | no |
| HMBOX1-IT1 | 8 | 0.564 | 28,807,193 | 28,813,472 | 28,809,951 | A | G | no |
| SNCA | 4 | 0.563 | 90,645,250 | 90,759,466 | 90,700,329 | T | C | no |
| MAPT | 17 | 0.563 | 43,971,748 | 44,105,700 | 44,071,851 | G | A | no |
| ENSG00000258881 | 2 | 0.563 | 71,166,448 | 71,222,466 | 71,202,989 | T | C | no |
| ENSG00000251095 | 4 | 0.562 | 90,472,507 | 90,647,654 | 90,627,967 | G | A | no |
| CRHR1 | 17 | 0.562 | 43,699,267 | 43,913,194 | 43,901,665 | T | C | no |
| ARHGEF7 | 13 | 0.562 | 111,766,906 | 111,958,084 | 111,863,720 | C | T | no |
| GNPTAB | 12 | 0.561 | 102,139,275 | 102,224,716 | 102,151,977 | C | T | no |
| FAM220A | 7 | 0.561 | 6,369,040 | 6,388,612 | 6,369,946 | A | G | no |
| BRD2 | 6 | 0.561 | 32,936,437 | 32,949,282 | 32,941,506 | C | T | no |
| ATG4D | 19 | 0.561 | 10,654,571 | 10,664,094 | 10,663,997 | C | T | no |
| KRI1 | 19 | 0.561 | 10,663,761 | 10,676,713 | 10,663,997 | C | T | no |
| FBXO34 | 14 | 0.560 | 55,738,021 | 55,828,636 | 55,801,687 | A | C | no |
| ENSG00000258455 | 14 | 0.560 | 55,792,552 | 55,806,219 | 55,801,687 | A | C | no |
| CCDC101 | 16 | 0.560 | 28,565,236 | 28,603,111 | 28,566,158 | G | T | no |
| C14orf159 | 14 | 0.560 | 91,526,677 | 91,691,976 | 91,682,844 | T | C | no |
| KIF21A | 12 | 0.560 | 39,687,030 | 39,837,192 | 39,738,666 | G | A | no |
| PRRC2C | 1 | 0.559 | 171,454,651 | 171,562,650 | 171,471,672 | T | C | no |
| RNF141 | 11 | 0.559 | 10,533,225 | 10,562,777 | 10,560,447 | A | C | no |
| SOX2-OT | 3 | 0.559 | 180,707,558 | 181,554,668 | 180,797,921 | T | G | no |
| SLC2A13 | 12 | 0.558 | 40,148,823 | 40,499,891 | 40,437,969 | A | G | no |
| RPP14 | 3 | 0.558 | 58,291,974 | 58,310,422 | 58,292,485 | G | A | no |
| DGKG | 3 | 0.557 | 185,823,457 | 186,080,026 | 185,834,290 | T | C | no |
| ENSG00000251364 | 11 | 0.557 | 7,448,497 | 7,533,746 | 7,532,175 | T | G | no |
| OLFML1 | 11 | 0.557 | 7,506,619 | 7,532,608 | 7,532,175 | T | G | no |
| ADAM15 | 1 | 0.557 | 155,023,042 | 155,035,252 | 155,033,317 | T | C | no |
| TRHDE | 12 | 0.556 | 72,481,046 | 73,059,422 | 72,714,601 | G | T | no |
| GAK | 4 | 0.556 | 843,064 | 926,161 | 852,939 | G | A | no |
| CCDC134 | 22 | 0.555 | 42,196,683 | 42,222,303 | 42,216,326 | A | G | no |
| LZTS2 | 10 | 0.555 | 10,275,6375 | 102,767,593 | 102,764,511 | G | A | no |
| SLC44A2 | 19 | 0.555 | 10,713,133 | 10,755,235 | 10,730,352 | G | A | no |
| FYN | 6 | 0.554 | 111,981,535 | 112,194,655 | 112,164,313 | G | A | no |
| RNF212 | 4 | 0.554 | 1,050,038 | 1,107,350 | 1,082,829 | T | C | no |
| CCSER1 | 4 | 0.553 | 91,048,686 | 92,523,064 | 91,383,333 | G | A | no |
| ZNF589 | 3 | 0.553 | 48,282,590 | 48,340,743 | 48,333,546 | T | C | no |
| FGF14 | 13 | 0.553 | 102,372,134 | 103,054,124 | 102,996,713 | A | G | no |
| FGF14-IT1 | 13 | 0.553 | 102,944,677 | 103,046,869 | 102,996,713 | A | G | no |
| TFRC | 3 | 0.552 | 195,754,054 | 195,809,060 | 195,775,449 | C | T | no |
| MAEA | 4 | 0.552 | 1,283,639 | 1,333,935 | 1,312,394 | C | T | no |
| ANKRD11 | 16 | 0.551 | 89,334,038 | 89,556,969 | 89,369,869 | A | G | no |
| ZZZ3 | 1 | 0.551 | 78,028,101 | 78,149,104 | 78,070,458 | C | T | no |
| DNM3 | 1 | 0.551 | 171,810,621 | 172,387,606 | 171,845,192 | G | T | no |
| LARP1B | 4 | 0.550 | 128,982,423 | 129,144,086 | 129,107,049 | T | C | no |
| STK39 | 2 | 0.550 | 168,810,530 | 169,104,651 | 169,071,190 | G | T | no |
| NEXN | 1 | 0.550 | 78,354,198 | 78,409,580 | 78,392,446 | G | A | no |
| CD38 | 4 | 0.550 | 15,779,898 | 15,854,853 | 15,829,612 | A | G | no |
| HAVCR1 | 5 | 0.549 | 156,456,424 | 156,486,130 | 156,479,424 | A | C | no |
| SCAND3 | 6 | 0.549 | 28,539,407 | 28,583,989 | 28,547,283 | T | C | no |
| APOM | 6 | 0.548 | 31,620,193 | 31,625,987 | 31,622,606 | C | A | no |
| TRIM37 | 17 | 0.548 | 57,059,999 | 57,184,282 | 57,111,269 | A | C | no |
| OR9Q1 | 11 | 0.548 | 57,791,353 | 57,949,088 | 57,870,219 | G | A | no |
| KIAA1841 | 2 | 0.547 | 61,293,006 | 61,391,960 | 61,347,469 | C | T | no |
| TATDN2 | 3 | 0.547 | 10,289,707 | 10,322,902 | 10,300,941 | A | G | no |
| ENSG00000272410 | 3 | 0.547 | 10,291,056 | 10,327,480 | 10,300,941 | A | G | no |
| ZNF320 | 19 | 0.547 | 53,367,043 | 53,400,946 | 53,399,832 | C | T | no |
| ENSG00000272657 | 21 | 0.546 | 35,445,892 | 35,732,332 | 35,677,897 | G | A | no |
| ENSG00000214955 | 21 | 0.546 | 35,577,356 | 35,697,334 | 35,677,897 | G | A | no |
| ITGAL | 16 | 0.546 | 30,483,979 | 30,534,506 | 30,520,856 | C | T | no |
| UNKL | 16 | 0.546 | 1,413,206 | 1,464,752 | 1,436,510 | G | A | no |
| FYN | 6 | 0.545 | 111,981,535 | 112,194,655 | 112,122,373 | C | T | no |
| SYBU | 8 | 0.545 | 110,586,207 | 110,704,020 | 110,644,774 | T | C | no |
| AGMO | 7 | 0.545 | 15,239,943 | 15,601,640 | 15,262,499 | G | T | no |
| MED12L | 3 | 0.544 | 150,803,484 | 151,154,860 | 151,133,211 | G | A | no |
| SYNDIG1 | 20 | 0.544 | 24,449,835 | 24,647,252 | 24,645,939 | G | A | no |
| MYO7A | 11 | 0.544 | 76,839,310 | 76,926,284 | 76,920,983 | A | G | no |
| CAPRIN2 | 12 | 0.543 | 30,862,486 | 30,907,885 | 30,895,251 | T | C | no |
| BRSK2 | 11 | 0.543 | 1,411,129 | 1,483,919 | 1,478,565 | T | C | no |
| ARID2 | 12 | 0.542 | 46,123,448 | 46,301,823 | 46,134,812 | T | C | no |
| RALYL | 8 | 0.542 | 85,095,022 | 85,834,079 | 85,772,129 | A | G | no |
| HCAR1 | 12 | 0.542 | 123,104,824 | 123,215,390 | 123,189,794 | T | C | no |
| ENSG00000256249 | 12 | 0.542 | 123,171,672 | 123,200,526 | 123,189,794 | T | C | no |
| SPPL2B | 19 | 0.541 | 2,328,614 | 2,355,099 | 2,341,047 | C | T | yes |
| RNF165 | 18 | 0.541 | 43,906,772 | 44,043,103 | 44,040,660 | T | C | no |
| HSF5 | 17 | 0.541 | 56,497,528 | 56,565,745 | 56,507,063 | C | T | no |
| ENO3 | 17 | 0.540 | 4,851,387 | 4,860,426 | 4,858,206 | A | G | no |
| WBP1L | 10 | 0.539 | 104,503,727 | 104,576,021 | 104,562,212 | C | T | no |
| ERC2 | 3 | 0.538 | 55,542,336 | 56,502,391 | 56,014,781 | A | G | no |
| MYO1H | 12 | 0.538 | 109,785,708 | 109,893,328 | 109,846,466 | G | T | no |
| MAEA | 4 | 0.538 | 1,283,639 | 1,333,935 | 1,311,933 | G | T | no |
| ENSG00000244036 | 7 | 0.538 | 129,593,074 | 129,666,391 | 129,663,496 | C | T | no |
| ZC3HC1 | 7 | 0.538 | 129,658,126 | 129,691,291 | 129,663,496 | C | T | no |
| CSMD1 | 8 | 0.537 | 2,792,875 | 4,852,494 | 3,078,351 | A | G | no |
| ENSG00000259848 | 2 | 0.537 | 95,533,231 | 95,613,086 | 95,555,581 | T | C | no |
| POU2F3 | 11 | 0.536 | 120,107,349 | 120,190,653 | 120,178,753 | T | G | no |
| HLA-DOA | 6 | 0.536 | 32,971,955 | 32,977,389 | 32,973,303 | T | C | no |
| TMPO | 12 | 0.536 | 98,909,290 | 98,944,157 | 98,939,838 | C | A | no |
| MTF2 | 1 | 0.536 | 93,544,792 | 93,604,638 | 93,570,368 | G | A | no |
| SLC16A10 | 6 | 0.535 | 111,408,781 | 111,552,397 | 111,489,059 | G | T | no |
| ENSG00000250003 | 5 | 0.535 | 38,025,799 | 38,184,034 | 38,046,354 | G | A | no |
| ENSG00000225981 | 7 | 0.534 | 1,499,573 | 1,503,644 | 1,502,497 | C | T | no |
| LRRK2 | 12 | 0.534 | 4,059,0546 | 40,763,087 | 40,707,861 | C | T | no |
| TRAPPC13 | 5 | 0.533 | 64,920,543 | 64,962,060 | 64,952,500 | C | T | no |
| METTL13 | 1 | 0.533 | 171,750,788 | 171,783,163 | 171,772,453 | T | G | no |
| ENSG00000259675 | 15 | 0.533 | 61,931,548 | 62,007,370 | 62,005,917 | C | A | no |
| AIRE | 21 | 0.532 | 45,705,721 | 45,718,531 | 45,708,277 | C | T | no |
| ENSG00000272305 | 3 | 0.532 | 53,003,135 | 53,133,469 | 53,087,621 | A | G | no |
| C6orf10 | 6 | 0.531 | 32,256,303 | 32,339,684 | 32,303,848 | G | A | no |
| HLA-DQA2 | 6 | 0.530 | 32,709,119 | 32,714,992 | 32,712,666 | C | T | no |
| XPO1 | 2 | 0.530 | 61,704,984 | 61,765,761 | 61,763,170 | C | T | no |
| HLA-DQB1 | 6 | 0.529 | 32,627,244 | 32,636,160 | 32,634,646 | T | C | no |
| LRRK2 | 12 | 0.529 | 40,579,811 | 40,617,605 | 40,607,566 | G | A | no |
| ENSG00000225342 | 12 | 0.529 | 40,590,546 | 40,763,087 | 40,607,566 | G | A | no |
| C1orf167 | 1 | 0.529 | 11,821,844 | 11,849,642 | 11,827,776 | A | G | no |
| ENSG00000249988 | 4 | 0.528 | 14,166,079 | 14,244,437 | 14,167,196 | A | G | no |
| LAMA2 | 6 | 0.528 | 129,204,342 | 129,837,714 | 129,537,858 | G | A | no |
| SOX6 | 11 | 0.528 | 15,987,995 | 16,761,138 | 16,158,420 | G | A | no |
| CCDC69 | 5 | 0.527 | 150,560,613 | 150,603,706 | 150,566,196 | C | T | no |
| ENSG00000223343 | 3 | 0.527 | 49,022,482 | 49,027,421 | 49,025,101 | A | C | no |
| MAP4K4 | 2 | 0.527 | 102,313,312 | 102,511,149 | 102,468,624 | A | G | no |
| KLHL7 | 7 | 0.526 | 23,145,353 | 23,217,533 | 23,208,043 | G | A | no |
| ENSG00000253194 | 6 | 0.526 | 119,255,950 | 119,352,706 | 119,322,992 | C | T | no |
| FAM184A | 6 | 0.526 | 119,280,928 | 119,470,552 | 119,322,992 | C | T | no |
| QRICH1 | 3 | 0.525 | 49,067,140 | 49,131,796 | 49,083,566 | G | A | no |
| SYT17 | 16 | 0.525 | 19,179,293 | 19,279,652 | 19,279,380 | T | C | no |
| CCDC62 | 12 | 0.524 | 123,258,874 | 123,312,075 | 123,296,204 | G | A | no |
| SHC4 | 15 | 0.524 | 49,115,932 | 49,255,641 | 49,174,661 | C | T | no |
| PNKD | 2 | 0.523 | 219,135,115 | 219,211,516 | 219,142,491 | C | T | no |
| TMBIM1 | 2 | 0.523 | 219,138,915 | 219,157,309 | 219,142,491 | C | T | no |
| DIP2C | 10 | 0.523 | 320,130 | 735,683 | 570,172 | T | C | no |
| SCCPDH | 1 | 0.523 | 246,887,349 | 246,931,439 | 246,893,948 | C | T | no |
| IP6K1 | 3 | 0.522 | 49,761,727 | 49,823,975 | 49,808,007 | A | G | no |
| FAM167A | 8 | 0.522 | 11,278,972 | 11,332,224 | 11,309,780 | G | A | no |
| ADCY5 | 3 | 0.521 | 123,001,143 | 123,168,605 | 123,143,272 | G | A | no |
| PCGF3 | 4 | 0.521 | 699,537 | 764,428 | 701,896 | A | G | no |
| RPRD2 | 1 | 0.520 | 150,335,567 | 150,449,042 | 150,438,362 | A | C | no |
| CARM1 | 19 | 0.520 | 10,982,189 | 11,033,453 | 11,025,817 | G | A | no |
| ENSG00000251246 | 1 | 0.519 | 155,036,224 | 155,059,283 | 155,055,863 | G | A | no |
| EFNA3 | 1 | 0.519 | 155,036,224 | 155,060,014 | 155,055,863 | G | A | no |
| MMS22L | 6 | 0.519 | 97,590,037 | 97,731,093 | 97,662,784 | G | A | no |
| C12orf40 | 12 | 0.519 | 40,019,969 | 40,302,102 | 40,042,940 | C | T | no |
| C3orf84 | 3 | 0.518 | 49,215,065 | 49,229,291 | 49,220,504 | A | C | no |
| MMRN1 | 4 | 0.518 | 90,800,683 | 90,875,780 | 90,859,279 | G | A | no |
| RILPL2 | 12 | 0.517 | 123,899,936 | 123,921,264 | 123,912,213 | T | C | no |
| CHAT | 10 | 0.517 | 50,817,141 | 50,901,925 | 50,821,191 | G | T | no |
| TMEM161B | 5 | 0.517 | 87,485,450 | 87,565,293 | 87,513,775 | C | T | no |
| BIN3 | 8 | 0.517 | 22,477,931 | 22,526,661 | 22,525,980 | T | C | yes |
| TRPM4 | 19 | 0.516 | 49,660,998 | 49,715,093 | 49,695,007 | A | G | no |
| USP8 | 15 | 0.516 | 50,716,577 | 50,793,280 | 50,741,068 | A | C | no |
| BCAR3 | 1 | 0.516 | 94,027,347 | 94,312,706 | 94,038,847 | G | A | no |
| TNXB | 6 | 0.516 | 32,008,931 | 32,083,111 | 32,062,687 | G | A | no |
References
- Kalia, L.V.; Lang, A.E. Parkinson’s disease. Lancet 2015, 386, 896–912. [Google Scholar] [CrossRef]
- Nalls, M.A.; Blauwendraat, C.; Vallerga, C.L.; Heilbron, K.; Bandres-Ciga, S.; Chang, D.; Tan, M.; Kia, D.A.; Noyce, A.J.; Xue, A.; et al. Identification of novel risk loci, causal insights, and heritable risk for Parkinson’s disease: A meta-analysis of genome-wide association studies. Lancet Neurol. 2019, 18, 1091–1102. [Google Scholar] [CrossRef]
- Chang, D.; Nalls, M.A.; Hallgrimsdottir, I.B.; Hunkapiller, J.; van der Brug, M.; Cai, F.; International Parkinson’s Disease Genomics Consortium; 23andMe Research Team; Kerchner, G.A.; Ayalon, G.; et al. A meta-analysis of genome-wide association studies identifies 17 new Parkinson’s disease risk loci. Nat. Genet. 2017, 49, 1511–1516. [Google Scholar] [CrossRef] [PubMed]
- Bloem, B.R.; Okun, M.S.; Klein, C. Parkinson’s disease. Lancet 2021, 397, 2284–2303. [Google Scholar] [CrossRef]
- Nalls, M.A.; Pankratz, N.; Lill, C.M.; Do, C.B.; Hernandez, D.G.; Saad, M.; DeStefano, A.L.; Kara, E.; Bras, J.; Sharma, M.; et al. Large-scale meta-analysis of genome-wide association data identifies six new risk loci for Parkinson’s disease. Nat. Genet. 2014, 46, 989–993. [Google Scholar] [CrossRef] [PubMed]
- Ibanez, L.; Dube, U.; Saef, B.; Budde, J.; Black, K.; Medvedeva, A.; Del-Aguila, J.L.; Davis, A.A.; Perlmutter, J.S.; Harari, O.; et al. Parkinson disease polygenic risk score is associated with Parkinson disease status and age at onset but not with α-synuclein cerebrospinal fluid levels. BMC Neurol. 2017, 17, 198. [Google Scholar] [CrossRef]
- Li, W.W.; Fan, D.Y.; Shen, Y.Y.; Zhou, F.Y.; Chen, Y.; Wang, Y.R.; Yang, H.; Mei, J.; Li, L.; Xu, Z.Q.; et al. Association of the polygenic risk score with the incidence risk of Parkinson’s disease and cerebrospinal fluid α-synuclein in a Chinese cohort. Neurotox. Res. 2019, 36, 515–522. [Google Scholar] [CrossRef]
- Escott-Price, V.; Sims, R.; Bannister, C.; Harold, D.; Vronskaya, M.; Majounie, E.; Badarinarayan, N.; Morgan, K.; Passmore, P.; Holmes, C.; et al. Common polygenic variation enhances risk prediction for Alzheimer’s disease. Brain 2015, 138, 3673–3684. [Google Scholar] [CrossRef]
- Jacobs, B.M.; Belete, D.; Bestwick, J.; Blauwendraat, C.; Bandres-Ciga, S.; Heilbron, K.; Dobson, R.; Nalls, M.A.; Singleton, A.; Hardy, J.; et al. Parkinson’s disease determinants, prediction and gene-environment interactions in the UK Biobank. J. Neurol. Neurosurg. Psychiatry 2020, 91, 1046–1054. [Google Scholar] [CrossRef] [PubMed]
- Paul, K.C.; Schulz, J.; Bronstein, J.M.; Lill, C.M.; Ritz, B.R. Association of polygenic risk score with cognitive decline and motor progression in Parkinson disease. JAMA Neurol. 2018, 75, 360–366. [Google Scholar] [CrossRef]
- Wald, N.J.; Old, R. The illusion of polygenic disease risk prediction. Genet. Med. 2019. [Google Scholar] [CrossRef] [PubMed]
- Caliebe, A.; Heinzel, S.; Schmidtke, J.; Krawczak, M. Genorakel polygene Risikoscores: Möglichkeiten und Grenzen. Dtsch. Arztebl. Int. 2021, 118, A410. [Google Scholar]
- Kasten, M.; Hagenah, J.; Graf, J.; Lorwin, A.; Vollstedt, E.J.; Peters, E.; Katalinic, A.; Raspe, H.; Klein, C. Cohort Profile: A population-based cohort to study non-motor symptoms in parkinsonism (EPIPARK). Int. J. Epidemiol. 2013, 42, 128–128k. [Google Scholar] [CrossRef] [PubMed] [Green Version]
- Mollenhauer, B.; Trautmann, E.; Sixel-Doring, F.; Wicke, T.; Ebentheuer, J.; Schaumburg, M.; Lang, E.; Focke, N.K.; Kumar, K.R.; Lohmann, K.; et al. Nonmotor and diagnostic findings in subjects with de novo Parkinson disease of the DeNoPa cohort. Neurology 2013, 81, 1226–1234. [Google Scholar] [CrossRef]
- Lieb, W.; Jacobs, G.; Wolf, A.; Richter, G.; Gaede, K.I.; Schwarz, J.; Arnold, N.; Bohm, R.; Buyx, A.; Cascorbi, I.; et al. Linking pre-existing biorepositories for medical research: The PopGen 2.0 Network. J. Community Genet. 2019, 10, 523–530. [Google Scholar] [CrossRef] [Green Version]
- Krawczak, M.; Nikolaus, S.; von Eberstein, H.; Croucher, P.J.; El Mokhtari, N.E.; Schreiber, S. PopGen: Population-based recruitment of patients and controls for the analysis of complex genotype-phenotype relationships. Community Genet. 2006, 9, 55–61. [Google Scholar] [CrossRef]
- Meyer, H. plinkQC: Genotype Quality Control with ‘PLINK’. R Package Version 0.3.4. 2021. Available online: https://cran.r-project.org/web/packages/plinkQC/index.html (accessed on 15 October 2021).
- Chang, C.C.; Chow, C.C.; Tellier, L.C.; Vattikuti, S.; Purcell, S.M.; Lee, J.J. Second-generation PLINK: Rising to the challenge of larger and richer datasets. Gigascience 2015, 4, 7. [Google Scholar] [CrossRef]
- Wigginton, J.E.; Cutler, D.J.; Abecasis, G.R. A note on exact tests of Hardy-Weinberg equilibrium. Am. J. Hum. Genet. 2005, 76, 887–893. [Google Scholar] [CrossRef] [Green Version]
- Purcell, S.; Neale, B.; Todd-Brown, K.; Thomas, L.; Ferreira, M.A.; Bender, D.; Maller, J.; Sklar, P.; de Bakker, P.I.; Daly, M.J.; et al. PLINK: A tool set for whole-genome association and population-based linkage analyses. Am. J. Hum. Genet. 2007, 81, 559–575. [Google Scholar] [CrossRef] [Green Version]
- Purcell, S.; Chang, C. PLINK 1.9. Available online: https://www.cog-genomics.org/plink (accessed on 22 November 2021).
- Purcell, S.; Chang, C. PLINK 2.0. Available online: https://www.cog-genomics.org/plink/2.0 (accessed on 22 November 2021).
- O’Connell, J.; Gurdasani, D.; Delaneau, O.; Pirastu, N.; Ulivi, S.; Cocca, M.; Traglia, M.; Huang, J.; Huffman, J.E.; Rudan, I.; et al. A general approach for haplotype phasing across the full spectrum of relatedness. PLoS Genet. 2014, 10, e1004234. [Google Scholar] [CrossRef] [PubMed] [Green Version]
- Howie, B.N.; Donnelly, P.; Marchini, J. A flexible and accurate genotype imputation method for the next generation of genome-wide association studies. PLoS Genet. 2009, 5, e1000529. [Google Scholar] [CrossRef] [Green Version]
- McCarthy, S.; Das, S.; Kretzschmar, W.; Delaneau, O.; Wood, A.R.; Teumer, A.; Kang, H.M.; Fuchsberger, C.; Danecek, P.; Sharp, K.; et al. A reference panel of 64,976 haplotypes for genotype imputation. Nat. Genet. 2016, 48, 1279–1283. [Google Scholar] [CrossRef] [PubMed] [Green Version]
- Robin, X.; Turck, N.; Hainard, A.; Tiberti, N.; Lisacek, F.; Sanchez, J.C.; Muller, M. pROC: An open-source package for R and S+ to analyze and compare ROC curves. BMC Bioinform. 2011, 12, 77. [Google Scholar] [CrossRef]
- Aragon, T. Epitools: Epidemiology Tools. R Package Version 0.5-10.1. 2012. Available online: https://cran.r-project.org/web/packages/epitools/index.html (accessed on 22 November 2021).
- Durinck, S.; Moreau, Y.; Kasprzyk, A.; Davis, S.; De Moor, B.; Brazma, A.; Huber, W. BioMart and Bioconductor: A powerful link between biological databases and microarray data analysis. Bioinformatics 2005, 21, 3439–3440. [Google Scholar] [CrossRef] [PubMed] [Green Version]
- Durinck, S.; Spellman, P.T.; Birney, E.; Huber, W. Mapping identifiers for the integration of genomic datasets with the R/Bioconductor package biomaRt. Nat. Protoc. 2009, 4, 1184–1191. [Google Scholar] [CrossRef] [Green Version]
- Howe, K.L.; Achuthan, P.; Allen, J.; Allen, J.; Alvarez-Jarreta, J.; Amode, M.R.; Armean, I.M.; Azov, A.G.; Bennett, R.; Bhai, J.; et al. Ensembl 2021. Nucleic Acids Res. 2021, 49, D884–D891. [Google Scholar] [CrossRef]
- Sherry, S.T.; Ward, M.H.; Kholodov, M.; Baker, J.; Phan, L.; Smigielski, E.M.; Sirotkin, K. dbSNP: The NCBI database of genetic variation. Nucleic Acids Res. 2001, 29, 308–311. [Google Scholar] [CrossRef] [PubMed] [Green Version]
- Nerius, M.; Fink, A.; Doblhammer, G. Parkinson’s disease in Germany: Prevalence and incidence based on health claims data. Acta Neurol. Scand. 2017, 136, 386–392. [Google Scholar] [CrossRef]
- Hoffmann, S.; Schonbrodt, F.; Elsas, R.; Wilson, R.; Strasser, U.; Boulesteix, A.L. The multiplicity of analysis strategies jeopardizes replicability: Lessons learned across disciplines. R. Soc. Open Sci. 2021, 8, 201925. [Google Scholar] [CrossRef]
- Baker, M. 1500 scientists lift the lid on reproducibility. Nature 2016, 533, 452–454. [Google Scholar] [CrossRef] [Green Version]
- Loken, E.; Gelman, A. Measurement error and the replication crisis. Science 2017, 355, 584–585. [Google Scholar] [CrossRef] [PubMed]
- Janssens, A. Validity of polygenic risk scores: Are we measuring what we think we are? Hum. Mol. Genet. 2019, 28, R143–R150. [Google Scholar] [CrossRef]
- Fullerton, J.M.; Nurnberger, J.I. Polygenic risk scores in psychiatry: Will they be useful for clinicians? F1000Research 2019, 8. [Google Scholar] [CrossRef] [PubMed] [Green Version]
- Martin, A.R.; Kanai, M.; Kamatani, Y.; Okada, Y.; Neale, B.M.; Daly, M.J. Clinical use of current polygenic risk scores may exacerbate health disparities. Nat. Genet. 2019, 51, 584–591. [Google Scholar] [CrossRef]
- Altenbuchinger, M.; Weihs, A.; Quackenbush, J.; Grabe, H.J.; Zacharias, H.U. Gaussian and Mixed Graphical Models as (multi-)omics data analysis tools. Biochim. Biophys. Acta Gene Regul. Mech. 2020, 1863, 194418. [Google Scholar] [CrossRef]
- Elliott, J.; Bodinier, B.; Bond, T.A.; Chadeau-Hyam, M.; Evangelou, E.; Moons, K.G.M.; Dehghan, A.; Muller, D.C.; Elliott, P.; Tzoulaki, I. Predictive accuracy of a polygenic risk score-enhanced prediction model vs a clinical risk score for coronary artery disease. JAMA 2020, 323, 636–645. [Google Scholar] [CrossRef]
- Landi, I.; Kaji, D.A.; Cotter, L.; Van Vleck, T.; Belbin, G.; Preuss, M.; Loos, R.J.F.; Kenny, E.; Glicksberg, B.S.; Beckmann, N.D.; et al. Prognostic value of polygenic risk scores for adults with psychosis. Nat. Med. 2021, 27, 1576–1581. [Google Scholar] [CrossRef]
- Yanes, T.; Young, M.A.; Meiser, B.; James, P.A. Clinical applications of polygenic breast cancer risk: A critical review and perspectives of an emerging field. Breast Cancer Res. 2020, 22, 21. [Google Scholar] [CrossRef] [PubMed] [Green Version]
- Heinzel, S.; Berg, D.; Gasser, T.; Chen, H.; Yao, C.; Postuma, R.B.; Disease, M.D.S.T.F.o.t.D.o.P.s. Update of the MDS research criteria for prodromal Parkinson’s disease. Mov. Disord. 2019, 34, 1464–1470. [Google Scholar] [CrossRef]
- Pebesma, E.; Bivand, R. Classes and Methods for Spatial Data in R. R. News 2005, 5, 9–13. [Google Scholar]
- Bivand, R.; Pebesma, E.; Gómez Rubio, V. Applied Spatial Data Analysis With R; Springer: New York, NY, USA, 2013. [Google Scholar]
- Bivand, R.; Rundel, C. Rgeos: Interface to Geometry Engine-Open Source (GEOS). R Package Version 0.5-8. 2021. Available online: https://cran.r-project.org/web/packages/rgeos/index.html (accessed on 22 November 2021).
- Prive, F.; Luu, K.; Blum, M.G.B.; McGrath, J.J.; Vilhjalmsson, B.J. Efficient toolkit implementing best practices for principal component analysis of population genetic data. Bioinformatics 2020, 36, 4449–4457. [Google Scholar] [CrossRef] [PubMed]
- Prive, F.; Aschard, H.; Ziyatdinov, A.; Blum, M.G.B. Efficient analysis of large-scale genome-wide data with two R packages: Bigstatsr and bigsnpr. Bioinformatics 2018, 34, 2781–2787. [Google Scholar] [CrossRef] [PubMed] [Green Version]
- Privé, F. Bigparallelr: Easy Parallel Tools. R Package Version 0.3.1. 2021. Available online: https://rdrr.io/cran/bigparallelr/man/bigparallelr-package.html (accessed on 22 November 2021).


| Data Set | Samples (N) | SNPs (N) | AUC [95% CI] | Nagelkerke’s Pseudo-R2 a | p Value b | Nagelkerke’s Pseudo-R2 c |
|---|---|---|---|---|---|---|
| This study (case/control) | 6378 | 1743 | 0.645 [0.630, 0.660] | 0.348 | <10−5 | 0.298 |
| Nalls training d (case/control) | 11,243 | 1809 | 0.640 [0.630, 0.650] | n.a. | <10−5 | n.a. |
| Nalls validation e (case/control) | 999 | 1805 | 0.692 [0.660, 0.725] | n.a. | <10−5 | n.a. |
| This study (AAO) f | 836 | 1743 | 0.590 [0.551, 0.629] | 0.039 | 1.6 × 10⁻⁵ | 0.009 |
| HGNC Symbol 1 | Chr | AUC | Start 2 | End 3 | SNP Position 4 | A1 5 | A2 6 | GS 7 | SNP Type |
|---|---|---|---|---|---|---|---|---|---|
| ENSG00000251095 | 4 | 0.643 | 90,472,507 | 90,647,654 | 90,626,111 | G | A | yes | intron |
| SNCA | 4 | 0.641 | 90,645,250 | 90,759,466 | 90,684,278 | A | G | no | intron |
| HIP1R | 12 | 0.640 | 123,319,000 | 123,347,507 | 123,326,598 | G | T | yes | intron |
| TMEM175 | 4 | 0.639 | 926,175 | 952,444 | 951,947 | T | C | yes | missense |
| SNCA | 4 | 0.638 | 90,645,250 | 90,759,466 | 90,757,294 | A | C | no | intron |
| ASH1L | 1 | 0.637 | 155,305,059 | 155,532,598 | 155,437,711 | G | A | no | intron |
| UBQLN4 | 1 | 0.634 | 156,005,092 | 156,023,585 | 156,007,988 | G | A | no | intron |
| ENSG00000225342 | 12 | 0.633 | 40,579,811 | 40,617,605 | 40,614,434 | C | T | yes | n.a. |
| LRRK2 | 12 | 0.633 | 40,590,546 | 40,763,087 | 40,614,434 | C | T | yes | n.a. |
| STX1B | 16 | 0.632 | 31,000,577 | 31,021,949 | 31,004,169 | T | C | no | synonymous |
| INPP5F | 10 | 0.631 | 121,485,609 | 121,588,652 | 121,536,327 | G | A | yes | intron |
| CCSER1 | 4 | 0.631 | 91,048,686 | 92,523,064 | 91,164,040 | C | T | no | intron |
| SLC2A13 | 12 | 0.630 | 40,148,823 | 40,499,891 | 40,388,109 | C | T | no | intron |
| FBXL19 | 16 | 0.630 | 30,934,376 | 30,960,104 | 30,943,096 | A | G | no | intron |
| ENSG00000251095 | 4 | 0.629 | 90,472,507 | 90,647,654 | 90,619,032 | C | T | no | intron |
| CAB39L | 13 | 0.629 | 49,882,786 | 50,018,262 | 49,927,732 | T | C | yes | intron |
| STK39 | 2 | 0.628 | 168,810,530 | 169,104,651 | 168,979,290 | C | T | no | intron |
| CCT3 | 1 | 0.628 | 156,278,759 | 156,337,664 | 156,300,731 | T | C | no | intron |
| ENSG00000225342 | 12 | 0.627 | 40,579,811 | 40,617,605 | 40,614,656 | A | G | no | n.a. |
| LRRK2 | 12 | 0.627 | 40,590,546 | 40,763,087 | 40,614,656 | A | G | no | n.a. |
| Costs | |||||
|---|---|---|---|---|---|
| 1 | 2 | 3 | 4 | 5 | |
| Sensitivity [95% CI] | 0.581 [0.479, 0.733] | 0.921 [0.880, 0.981] | 0.981 [0.973, 1] | 0.999 [0.983, 1] | 1 [0.996, 1] |
| Specificity [95% CI] | 0.625 [0.472, 0.725] | 0.198 [0.075, 0.289] | 0.067 [0.004, 0.096] | 0.006 [0.002, 0.082] | 0.003 [0.002, 0.034] |
| Threshold 1 | 0.330 | −0.868 | −1.507 | −2.533 | −2.667 |
| Costs | |||||||||||
|---|---|---|---|---|---|---|---|---|---|---|---|
| 1 | 2 | 3 | 4 | 5 | |||||||
| ppv | npv | ppv | npv | ppv | npv | ppv | npv | ppv | npv | ||
| Age group (Years) | 50–54 | 0.026 | 0.988 | 0.020 | 0.993 | 0.018 | 0.995 | 0.017 | 0.998 | 0.017 | 1 |
| 55–59 | 0.027 | 0.988 | 0.020 | 0.993 | 0.018 | 0.995 | 0.018 | 0.998 | 0.018 | 1 | |
| 60–64 | 0.027 | 0.988 | 0.020 | 0.993 | 0.019 | 0.995 | 0.018 | 0.998 | 0.018 | 1 | |
| 65–69 | 0.027 | 0.988 | 0.021 | 0.993 | 0.019 | 0.995 | 0.018 | 0.998 | 0.018 | 1 | |
| 70–74 | 0.027 | 0.988 | 0.020 | 0.993 | 0.019 | 0.995 | 0.018 | 0.998 | 0.018 | 1 | |
| 75–79 | 0.025 | 0.989 | 0.019 | 0.993 | 0.017 | 0.995 | 0.017 | 0.999 | 0.016 | 1 | |
| 80–84 | 0.022 | 0.990 | 0.016 | 0.994 | 0.015 | 0.996 | 0.014 | 0.999 | 0.014 | 1 | |
| 85–89 | 0.017 | 0.993 | 0.012 | 0.996 | 0.011 | 0.997 | 0.011 | 0.999 | 0.011 | 1 | |
| 90–94 | 0.011 | 0.995 | 0.008 | 0.997 | 0.008 | 0.998 | 0.007 | 0.999 | 0.007 | 1 | |
| 95+ | 0.008 | 0.996 | 0.006 | 0.998 | 0.005 | 0.999 | 0.005 | 1.000 | 0.005 | 1 | |
Publisher’s Note: MDPI stays neutral with regard to jurisdictional claims in published maps and institutional affiliations. |
© 2021 by the authors. Licensee MDPI, Basel, Switzerland. This article is an open access article distributed under the terms and conditions of the Creative Commons Attribution (CC BY) license (https://creativecommons.org/licenses/by/4.0/).
Share and Cite
Koch, S.; Laabs, B.-H.; Kasten, M.; Vollstedt, E.-J.; Becktepe, J.; Brüggemann, N.; Franke, A.; Krämer, U.M.; Kuhlenbäumer, G.; Lieb, W.; et al. Validity and Prognostic Value of a Polygenic Risk Score for Parkinson’s Disease. Genes 2021, 12, 1859. https://doi.org/10.3390/genes12121859
Koch S, Laabs B-H, Kasten M, Vollstedt E-J, Becktepe J, Brüggemann N, Franke A, Krämer UM, Kuhlenbäumer G, Lieb W, et al. Validity and Prognostic Value of a Polygenic Risk Score for Parkinson’s Disease. Genes. 2021; 12(12):1859. https://doi.org/10.3390/genes12121859
Chicago/Turabian StyleKoch, Sebastian, Björn-Hergen Laabs, Meike Kasten, Eva-Juliane Vollstedt, Jos Becktepe, Norbert Brüggemann, Andre Franke, Ulrike M. Krämer, Gregor Kuhlenbäumer, Wolfgang Lieb, and et al. 2021. "Validity and Prognostic Value of a Polygenic Risk Score for Parkinson’s Disease" Genes 12, no. 12: 1859. https://doi.org/10.3390/genes12121859