Cross Assessment of Twenty-One Different Methods for Missing Precipitation Data Estimation
Abstract
:1. Introduction
2. Material and Methods
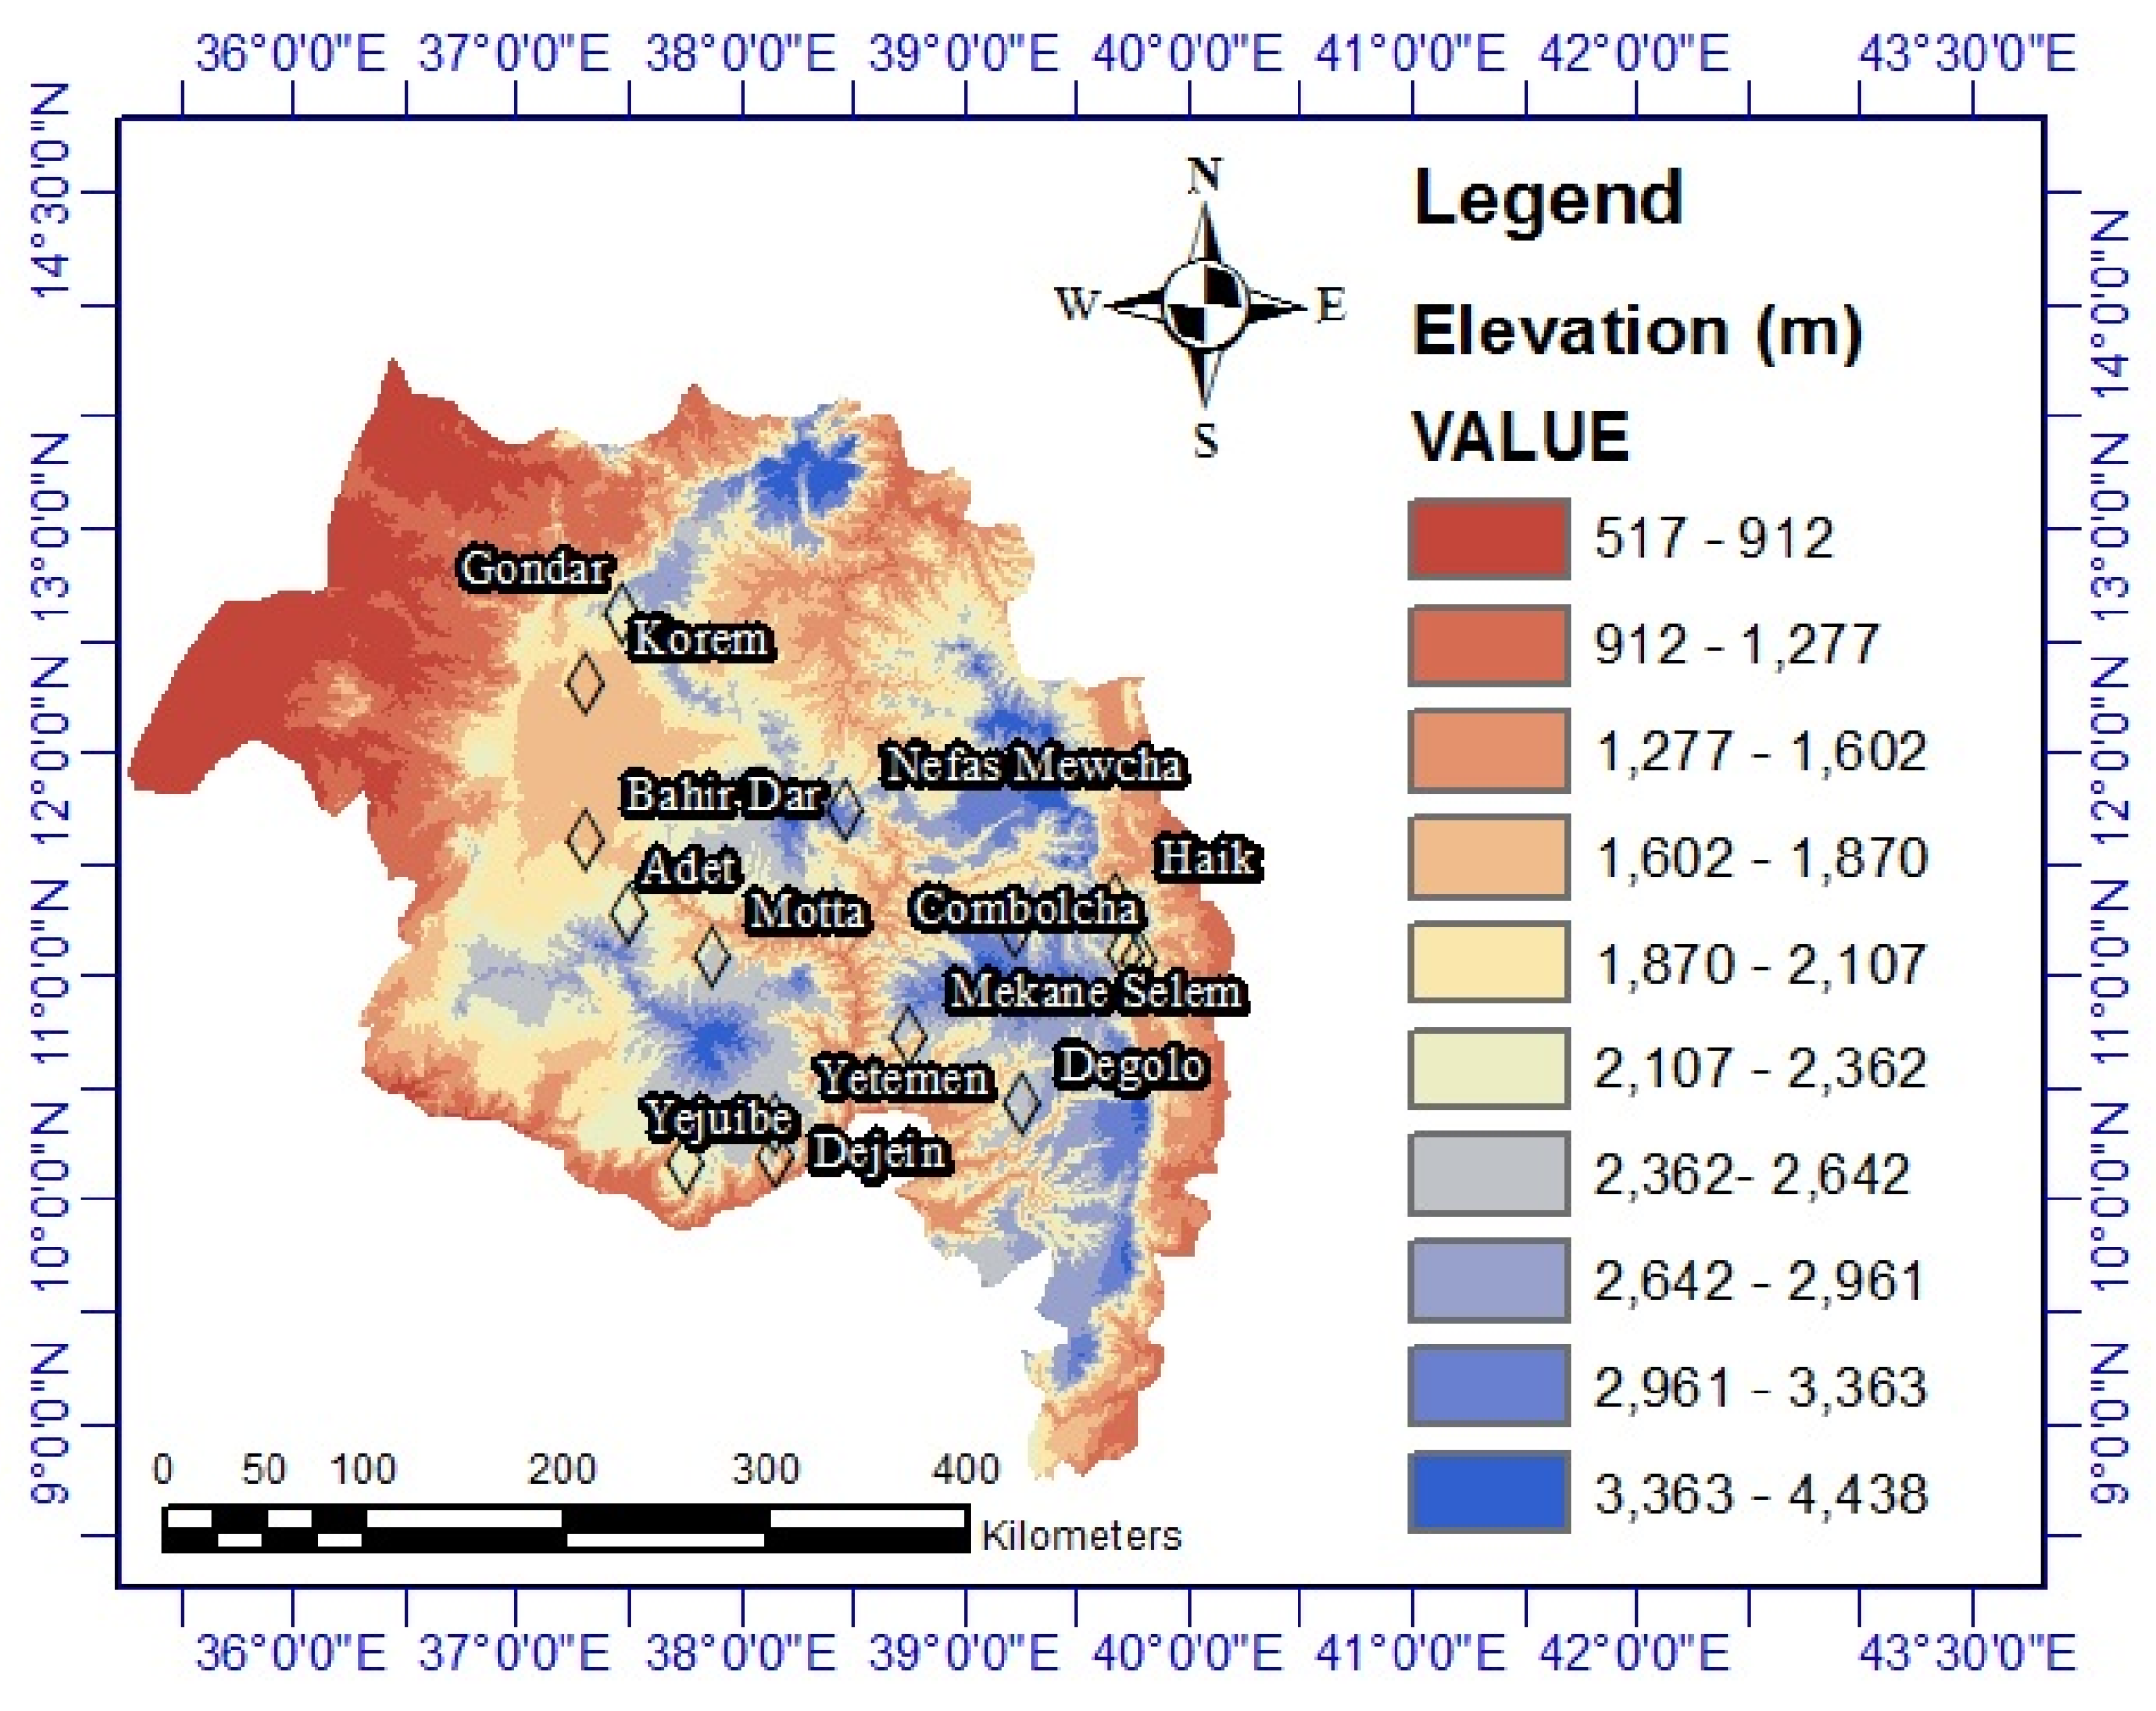
2.1. Study Area and Data Analysis
2.1.1. Simple Arithmetic Average (AA)
2.1.2. Normal Ratio (NR)
2.1.3. Geographical Coordinates (GC)
2.1.4. Normal Ratio With Geographical Coordinates (NRGC)
2.1.5. Inverse Distance Weighting (IDW)
2.1.6. Modified Inverse Distance Weighting (MIDW)
2.1.7. Correlation Coefficient Weighted (CCW)
2.1.8. Linear Regression (LR)
2.1.9. Multiple Linear Regression (MLR)
2.1.10. Multiple Imputation (MI)
2.1.11. NIPALS Algorithm for Missing Data (NIPALS)
2.1.12. UK Traditional Method (UK)
2.1.13. Expectation Maximization (EM)
2.1.14. Closest Station Method (CSM)
2.1.15. Modified Coefficient Correlation Weighting (MCCW)
2.1.16. Modified Correlation Coefficient with Inverse Distance Weighting (MCCIDW)
2.1.17. Modified Normal Ratio with Inverse Distance (NRID)
2.1.18. Modified Old Normal Ratio with Inverse Distance (ONRID):
2.1.19. Normal Ratio Inverse Distance Weighting with Correlation (NRIDC)
2.1.20. Modified Normal Ratio Based on Correlation (MNR)
2.1.21. Modified Normal Ratio Based on Square Root Distance (MNR-T):
2.2. Methods Performance
3. Results and Discussion
3.1. Accuracy of the Station Data
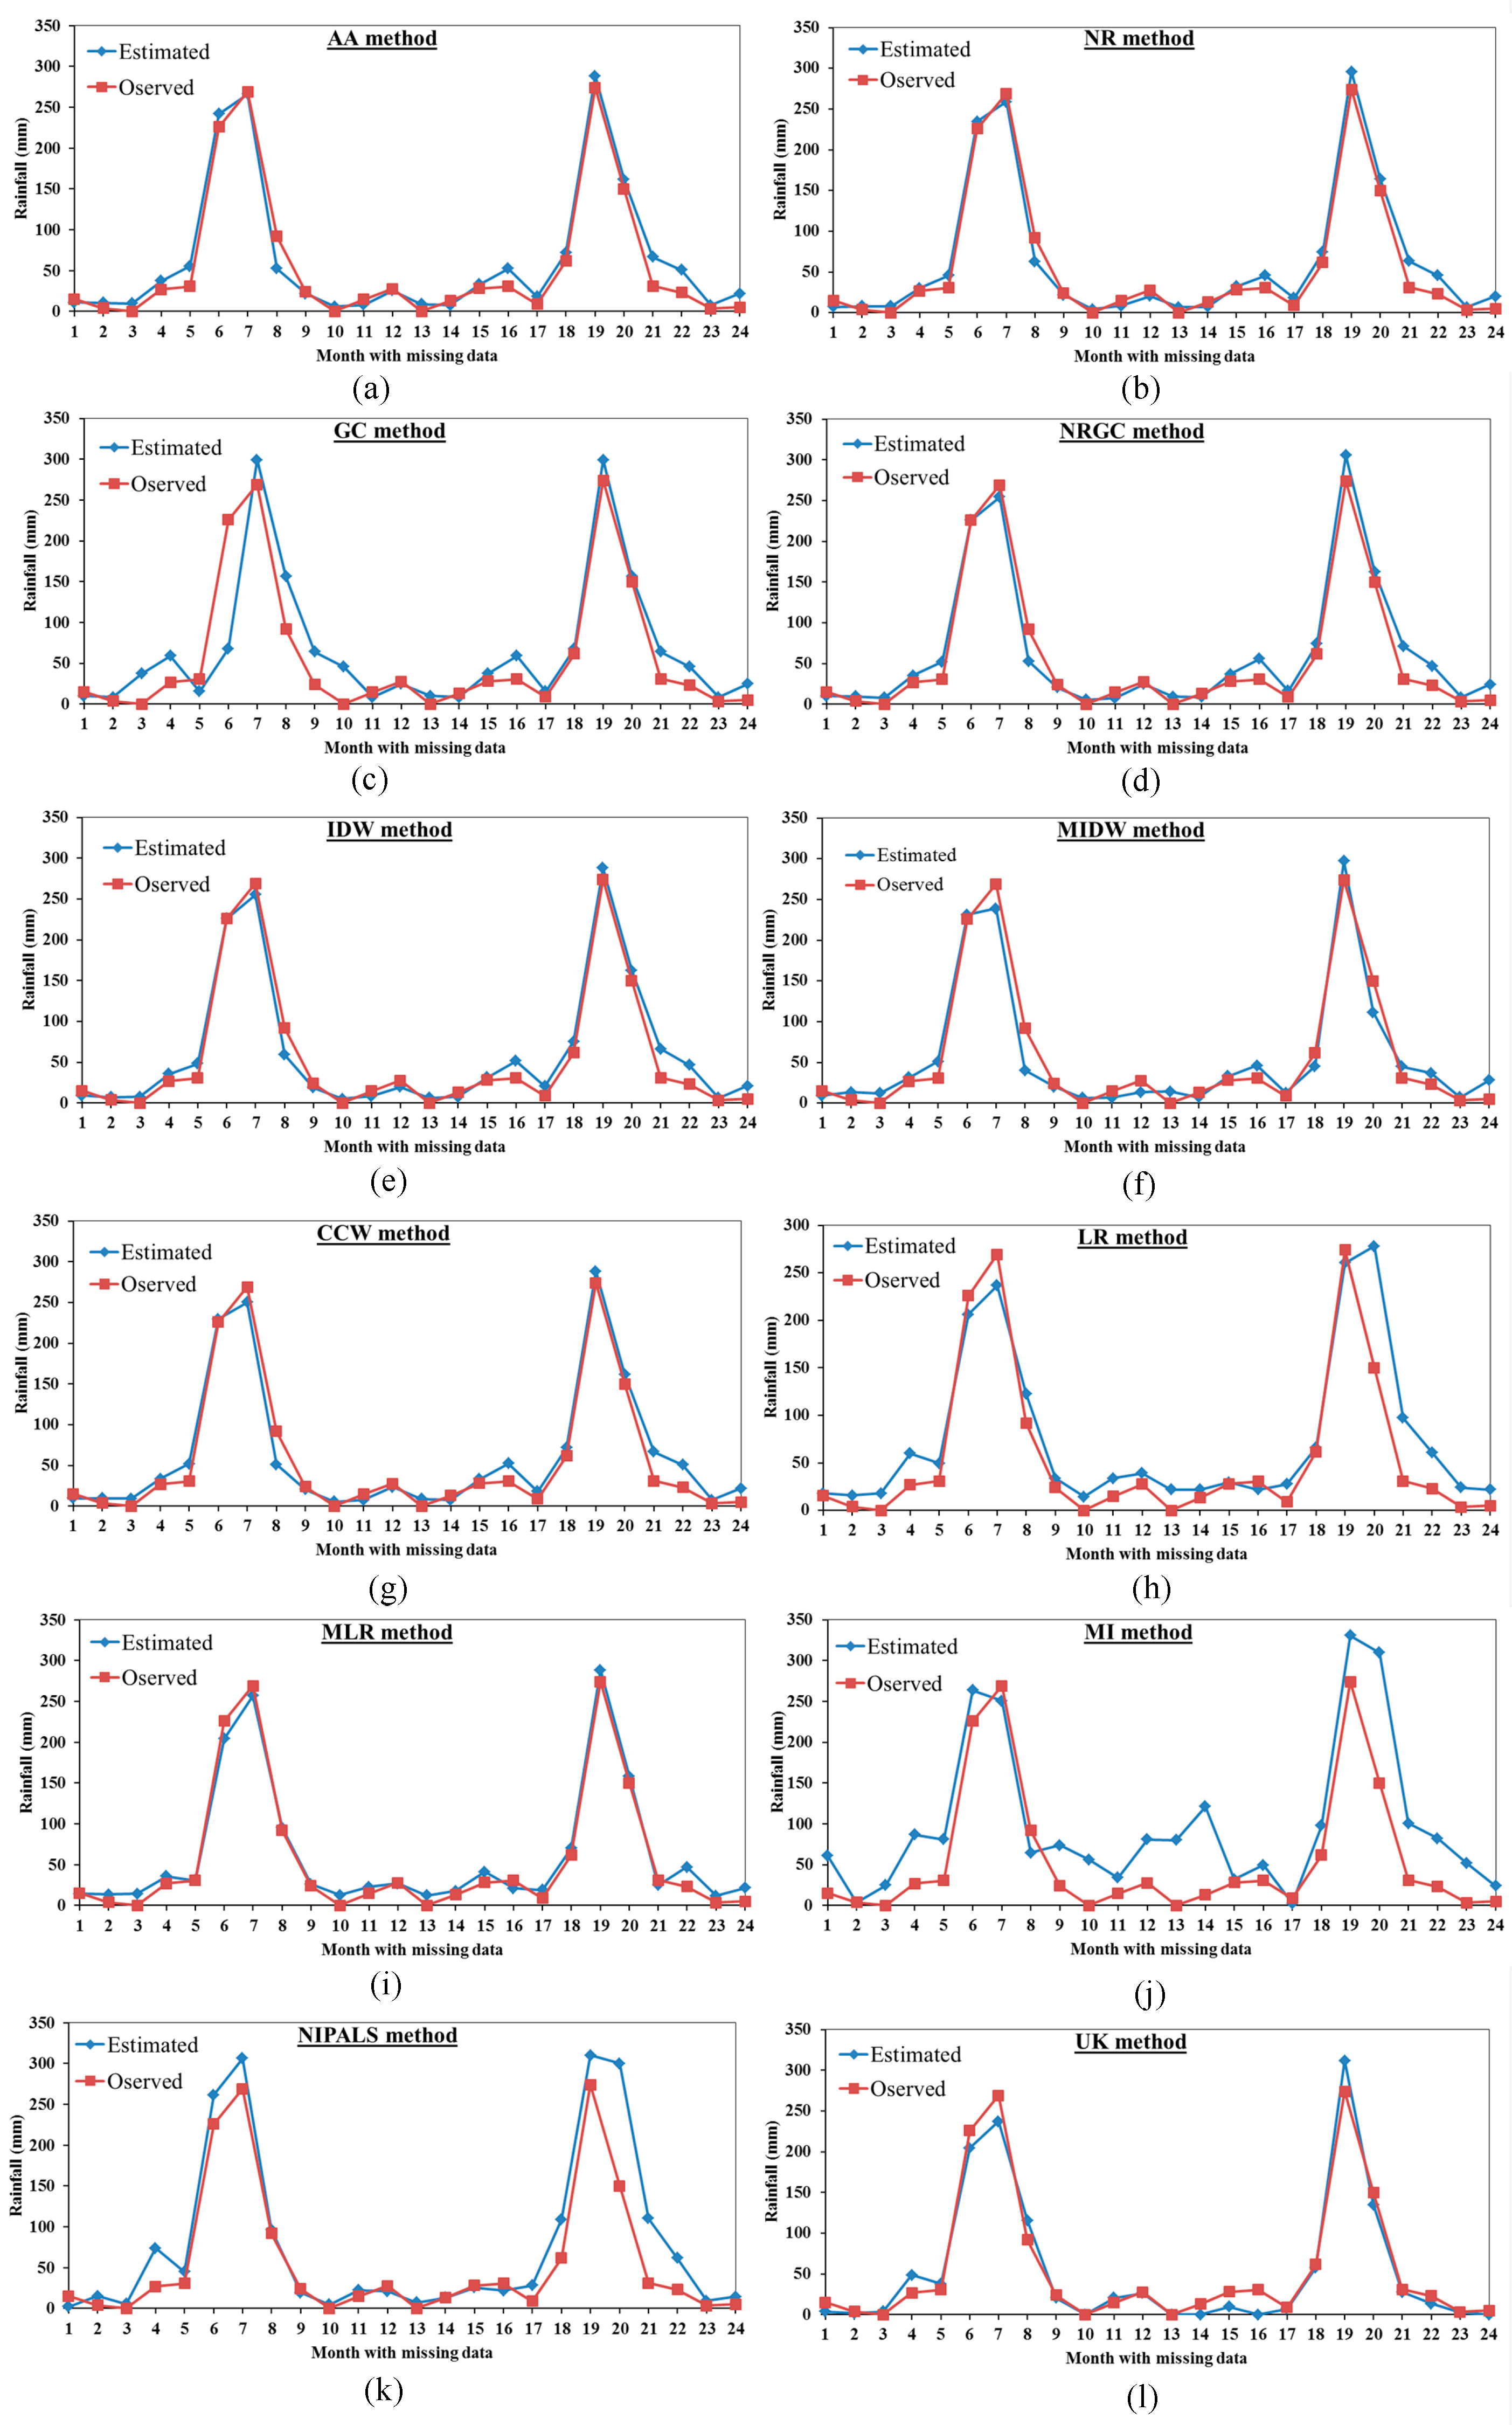
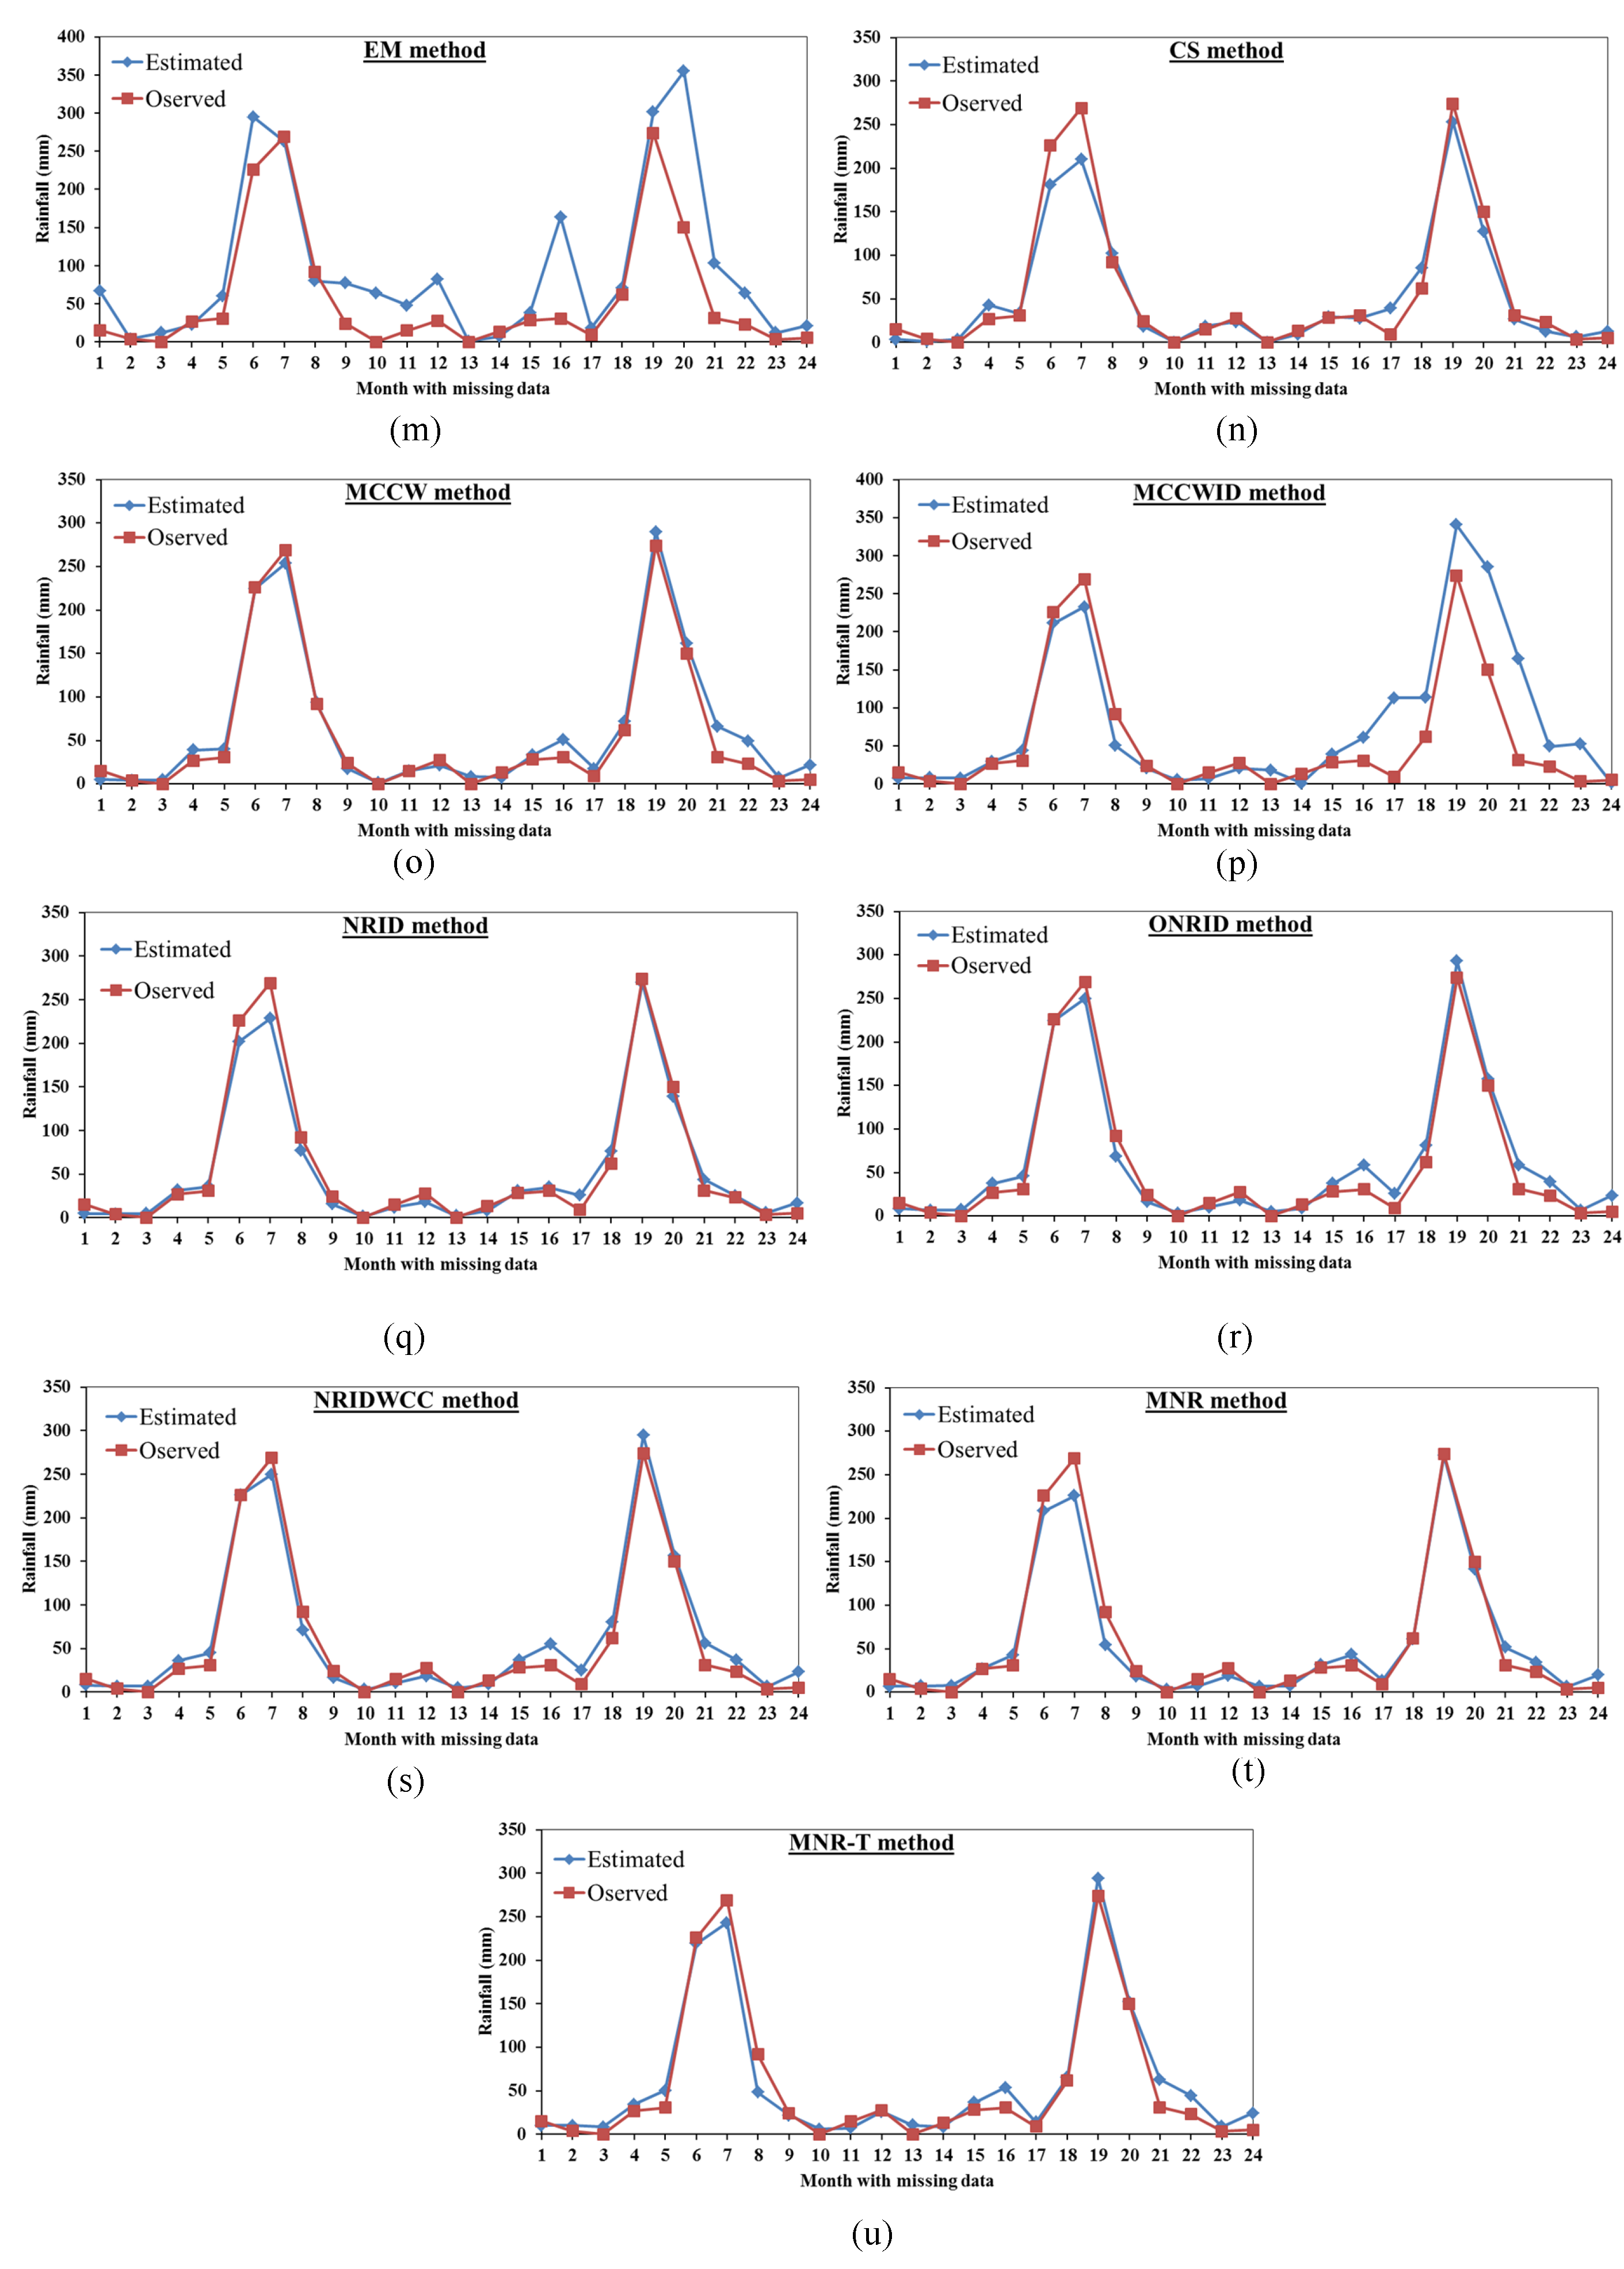
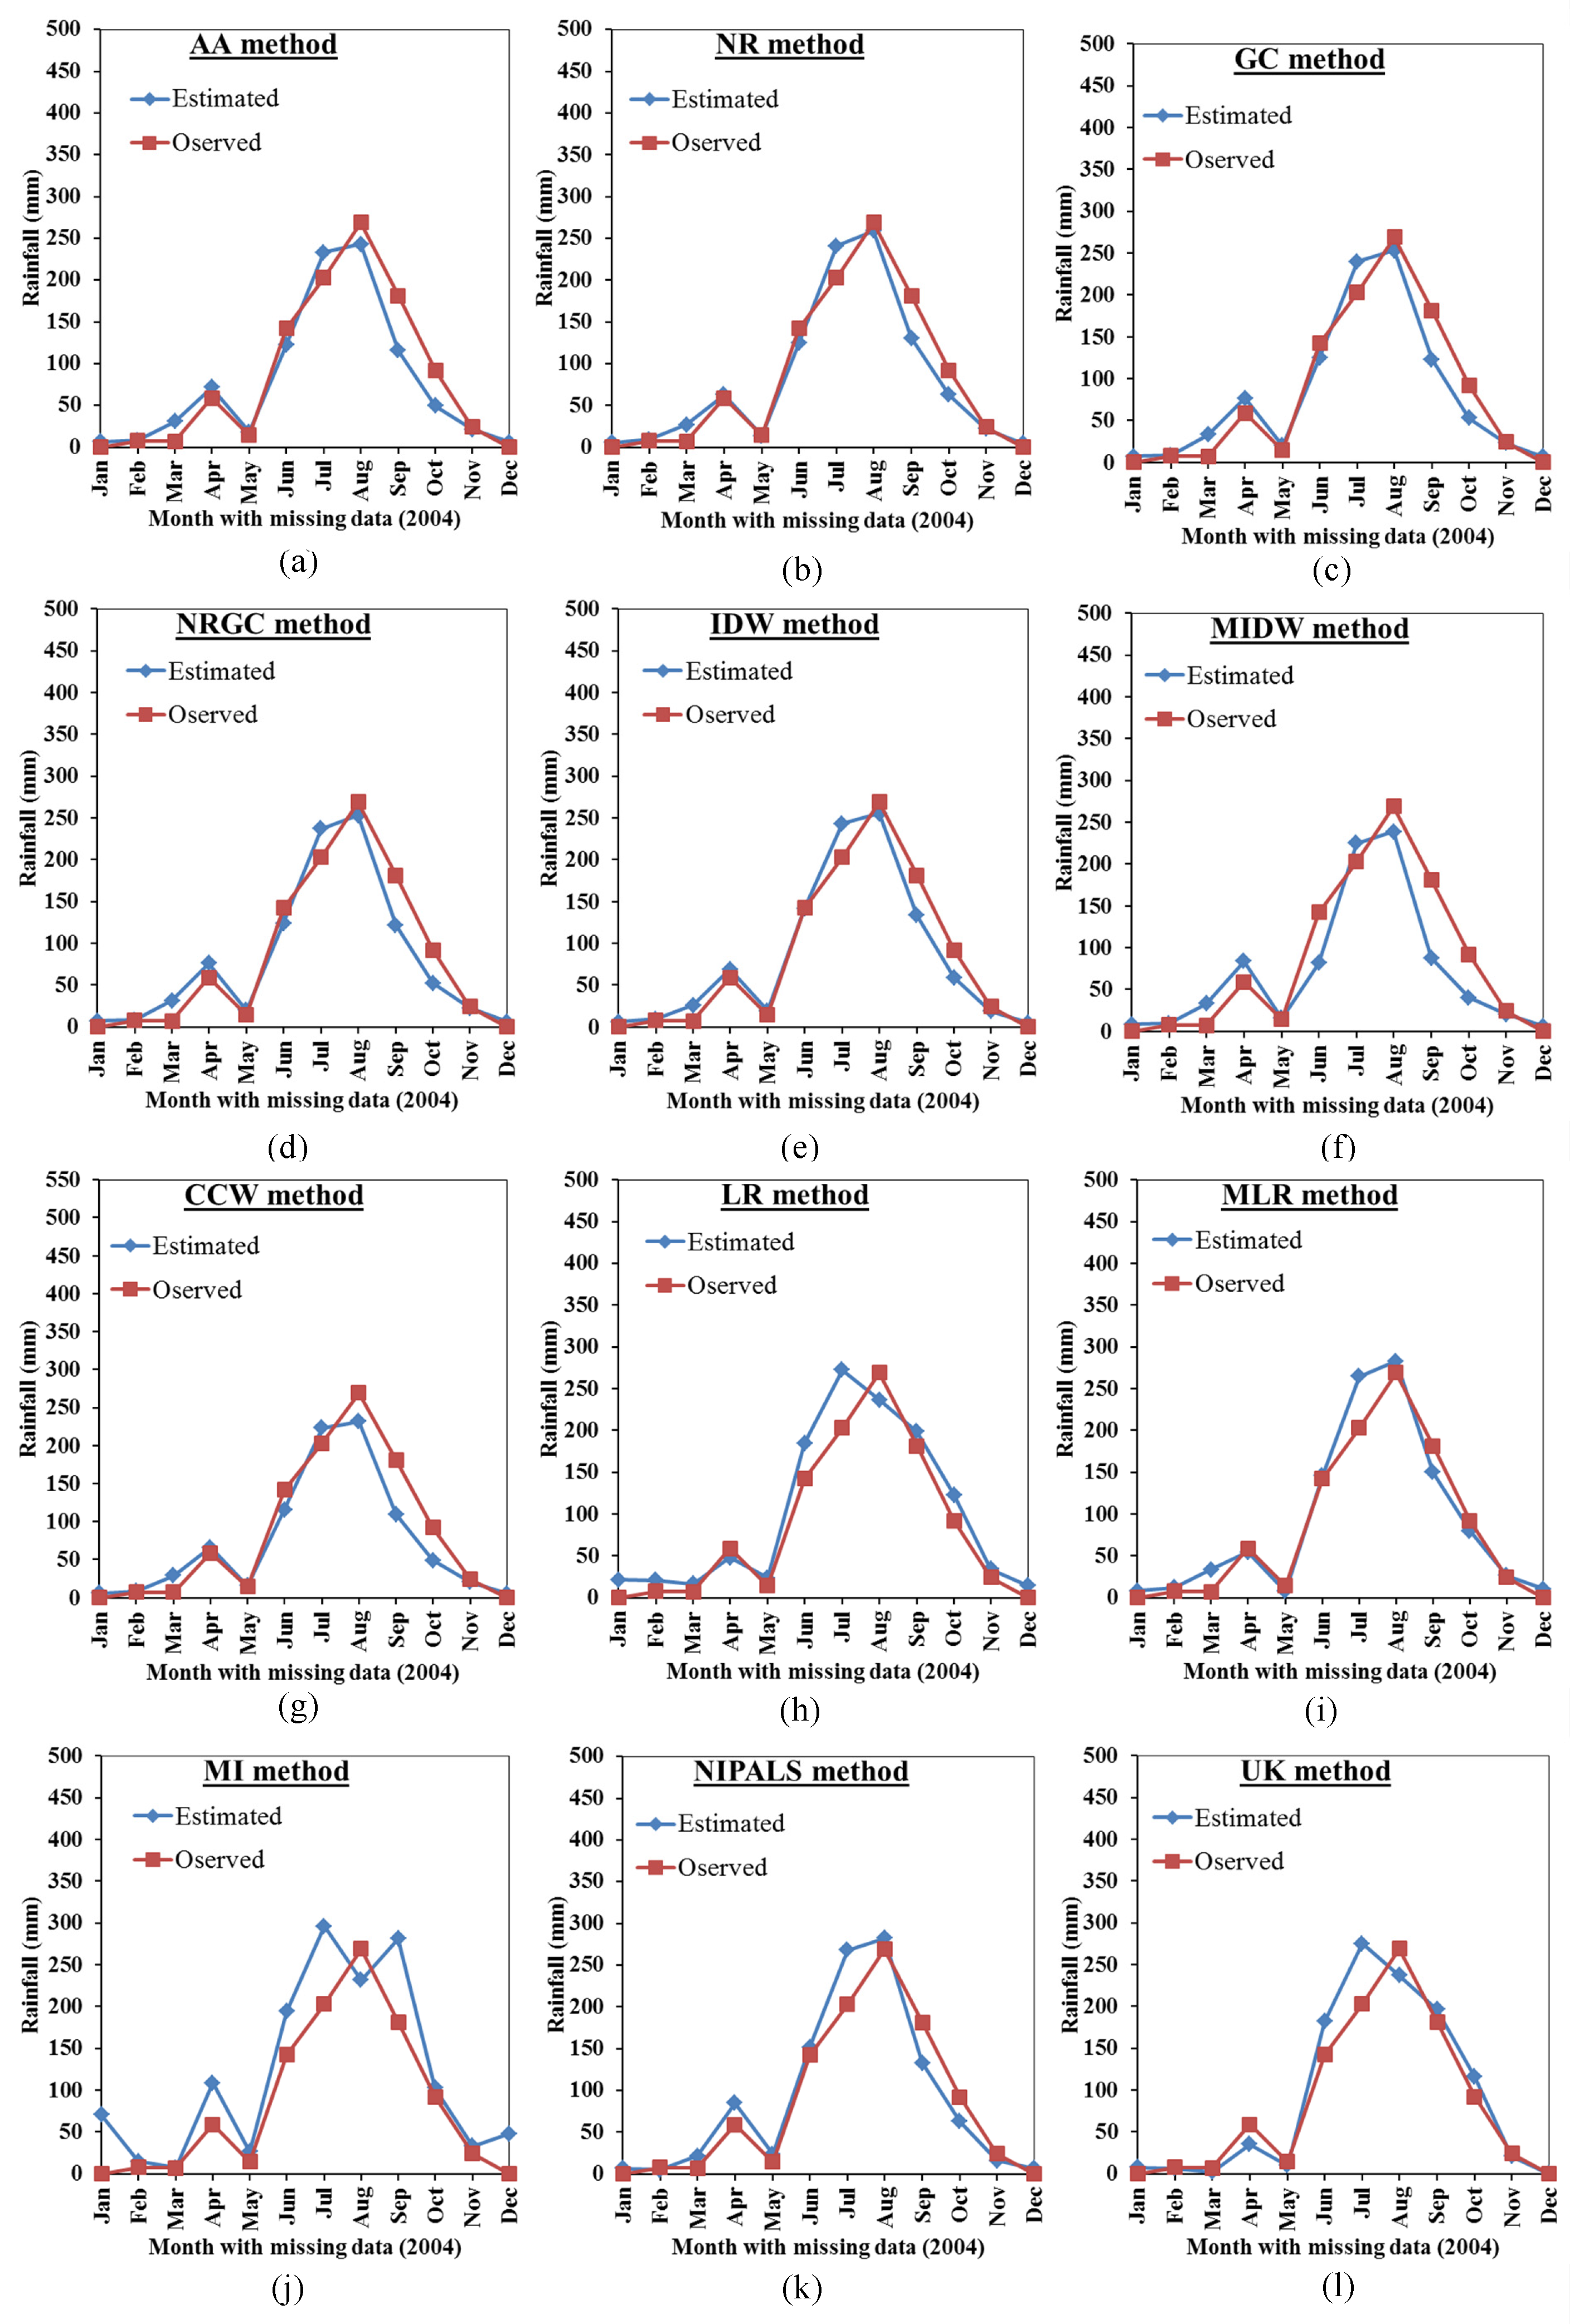
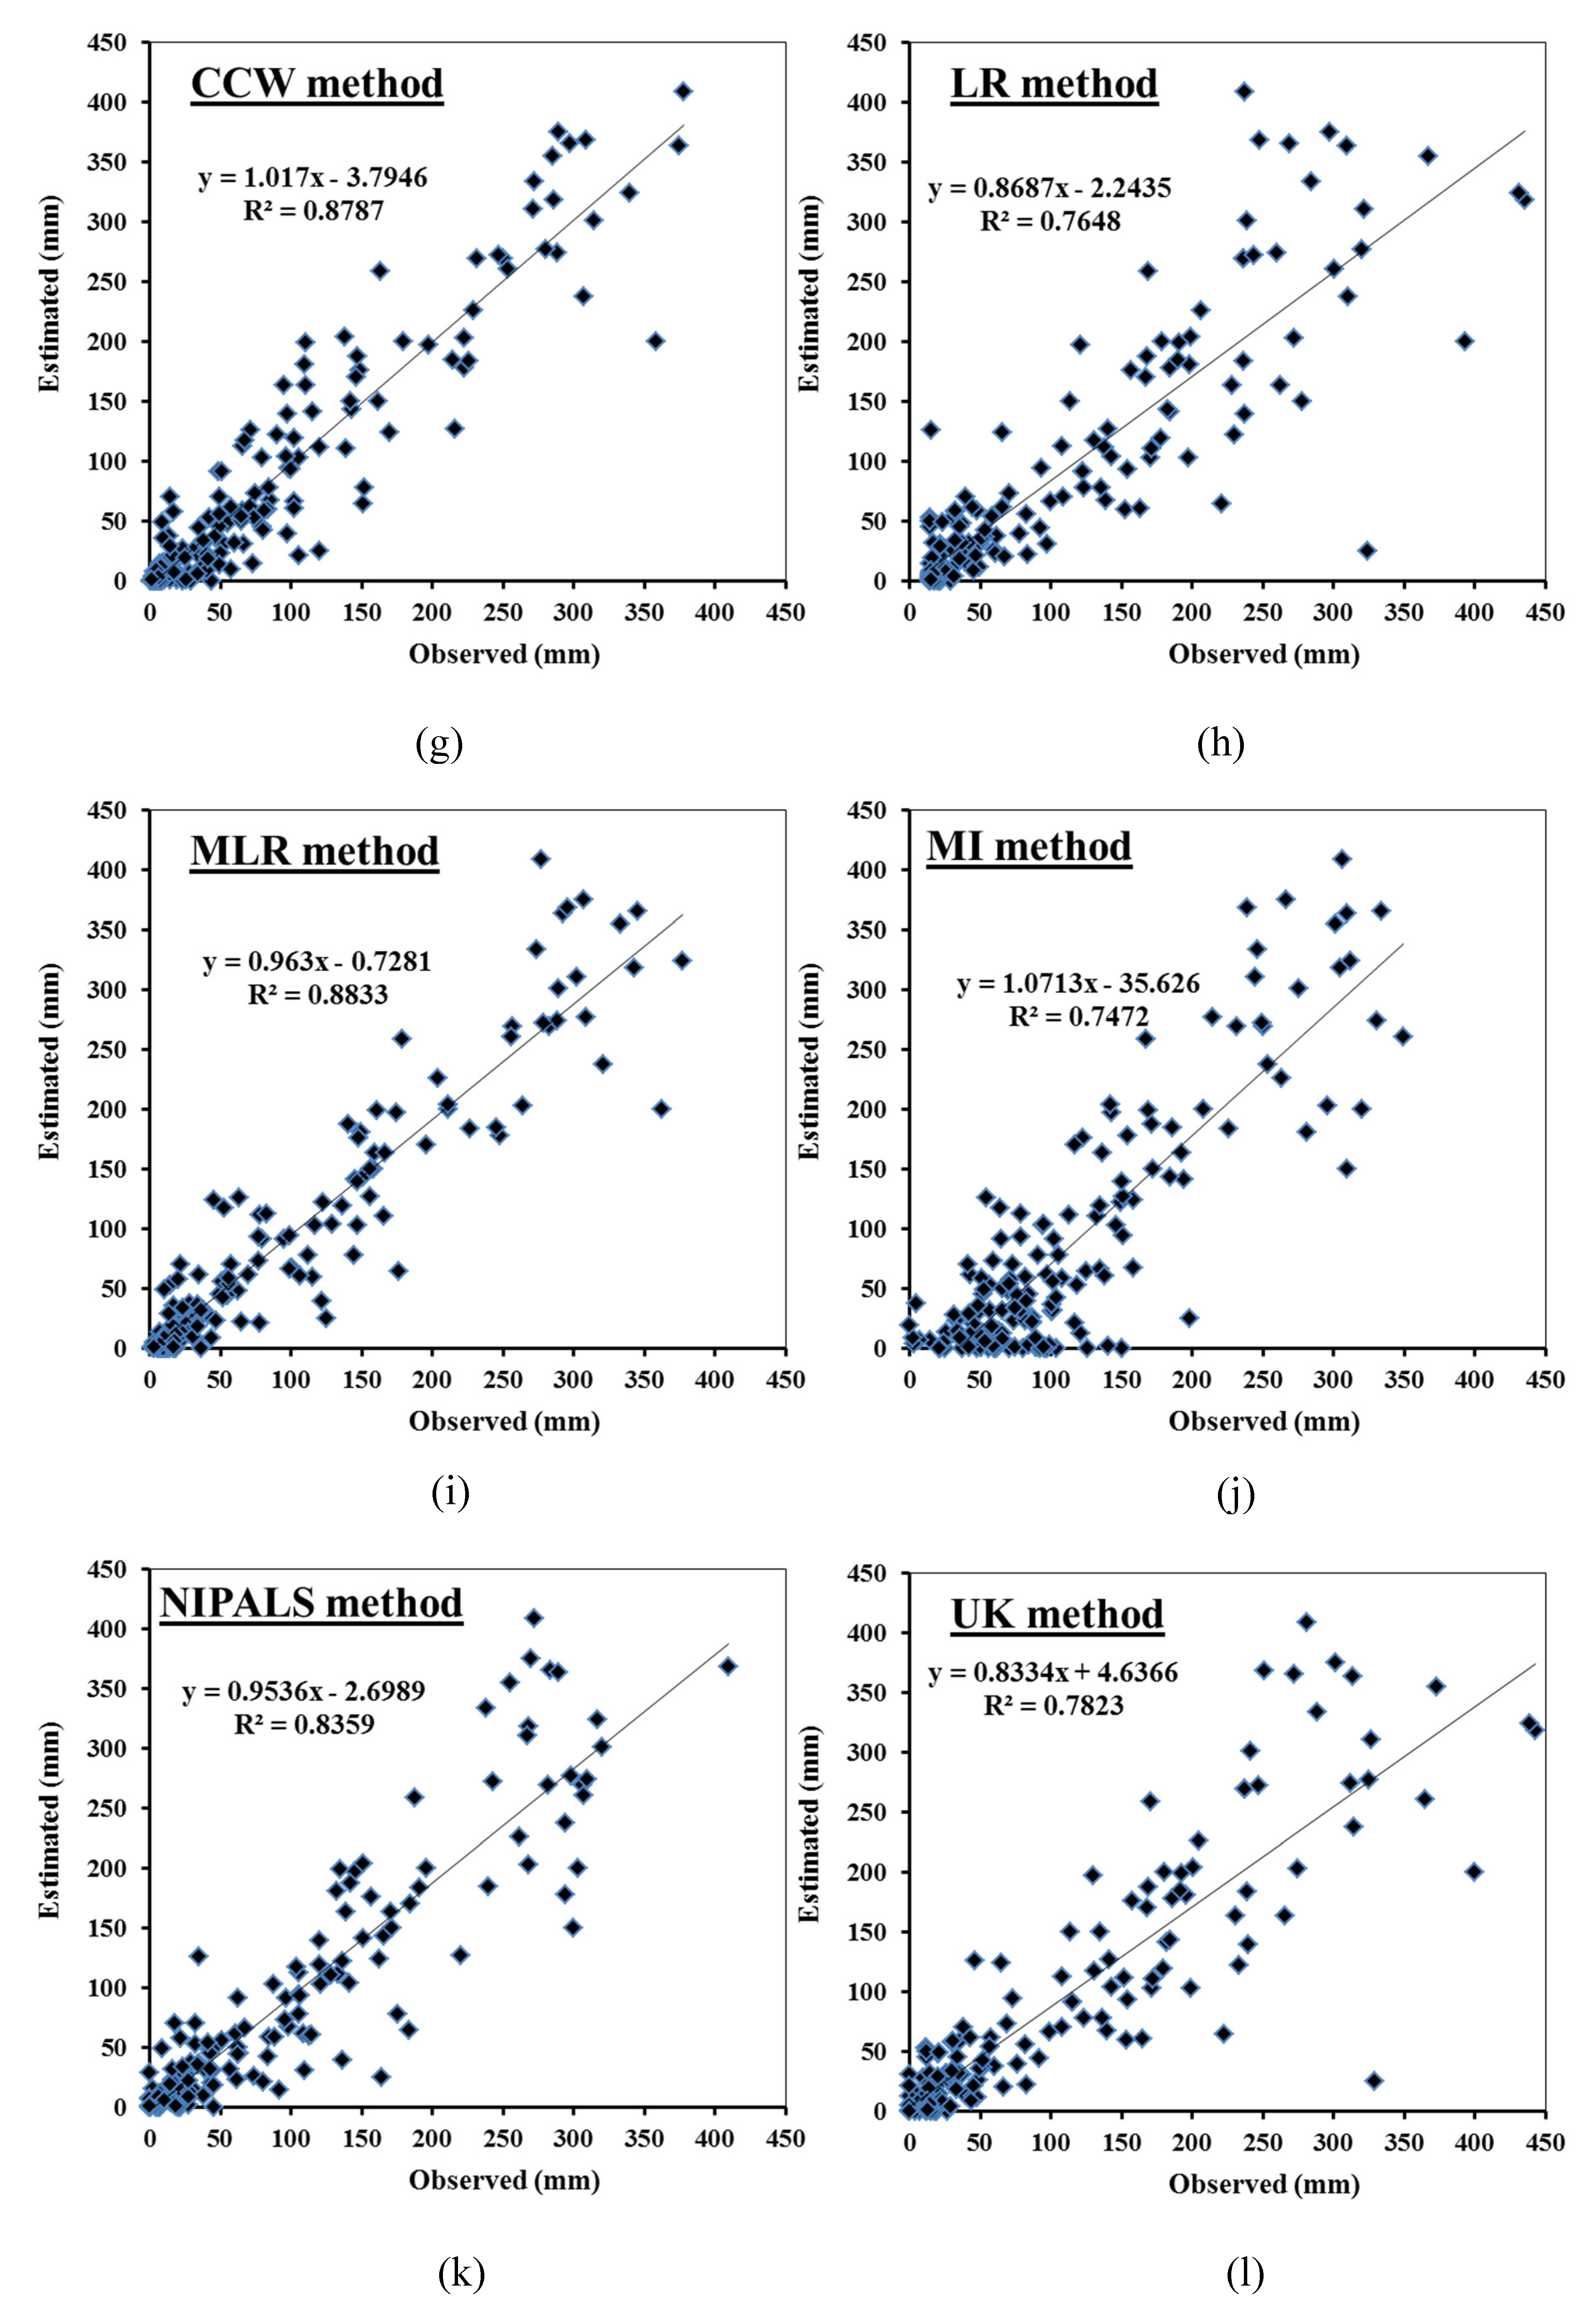
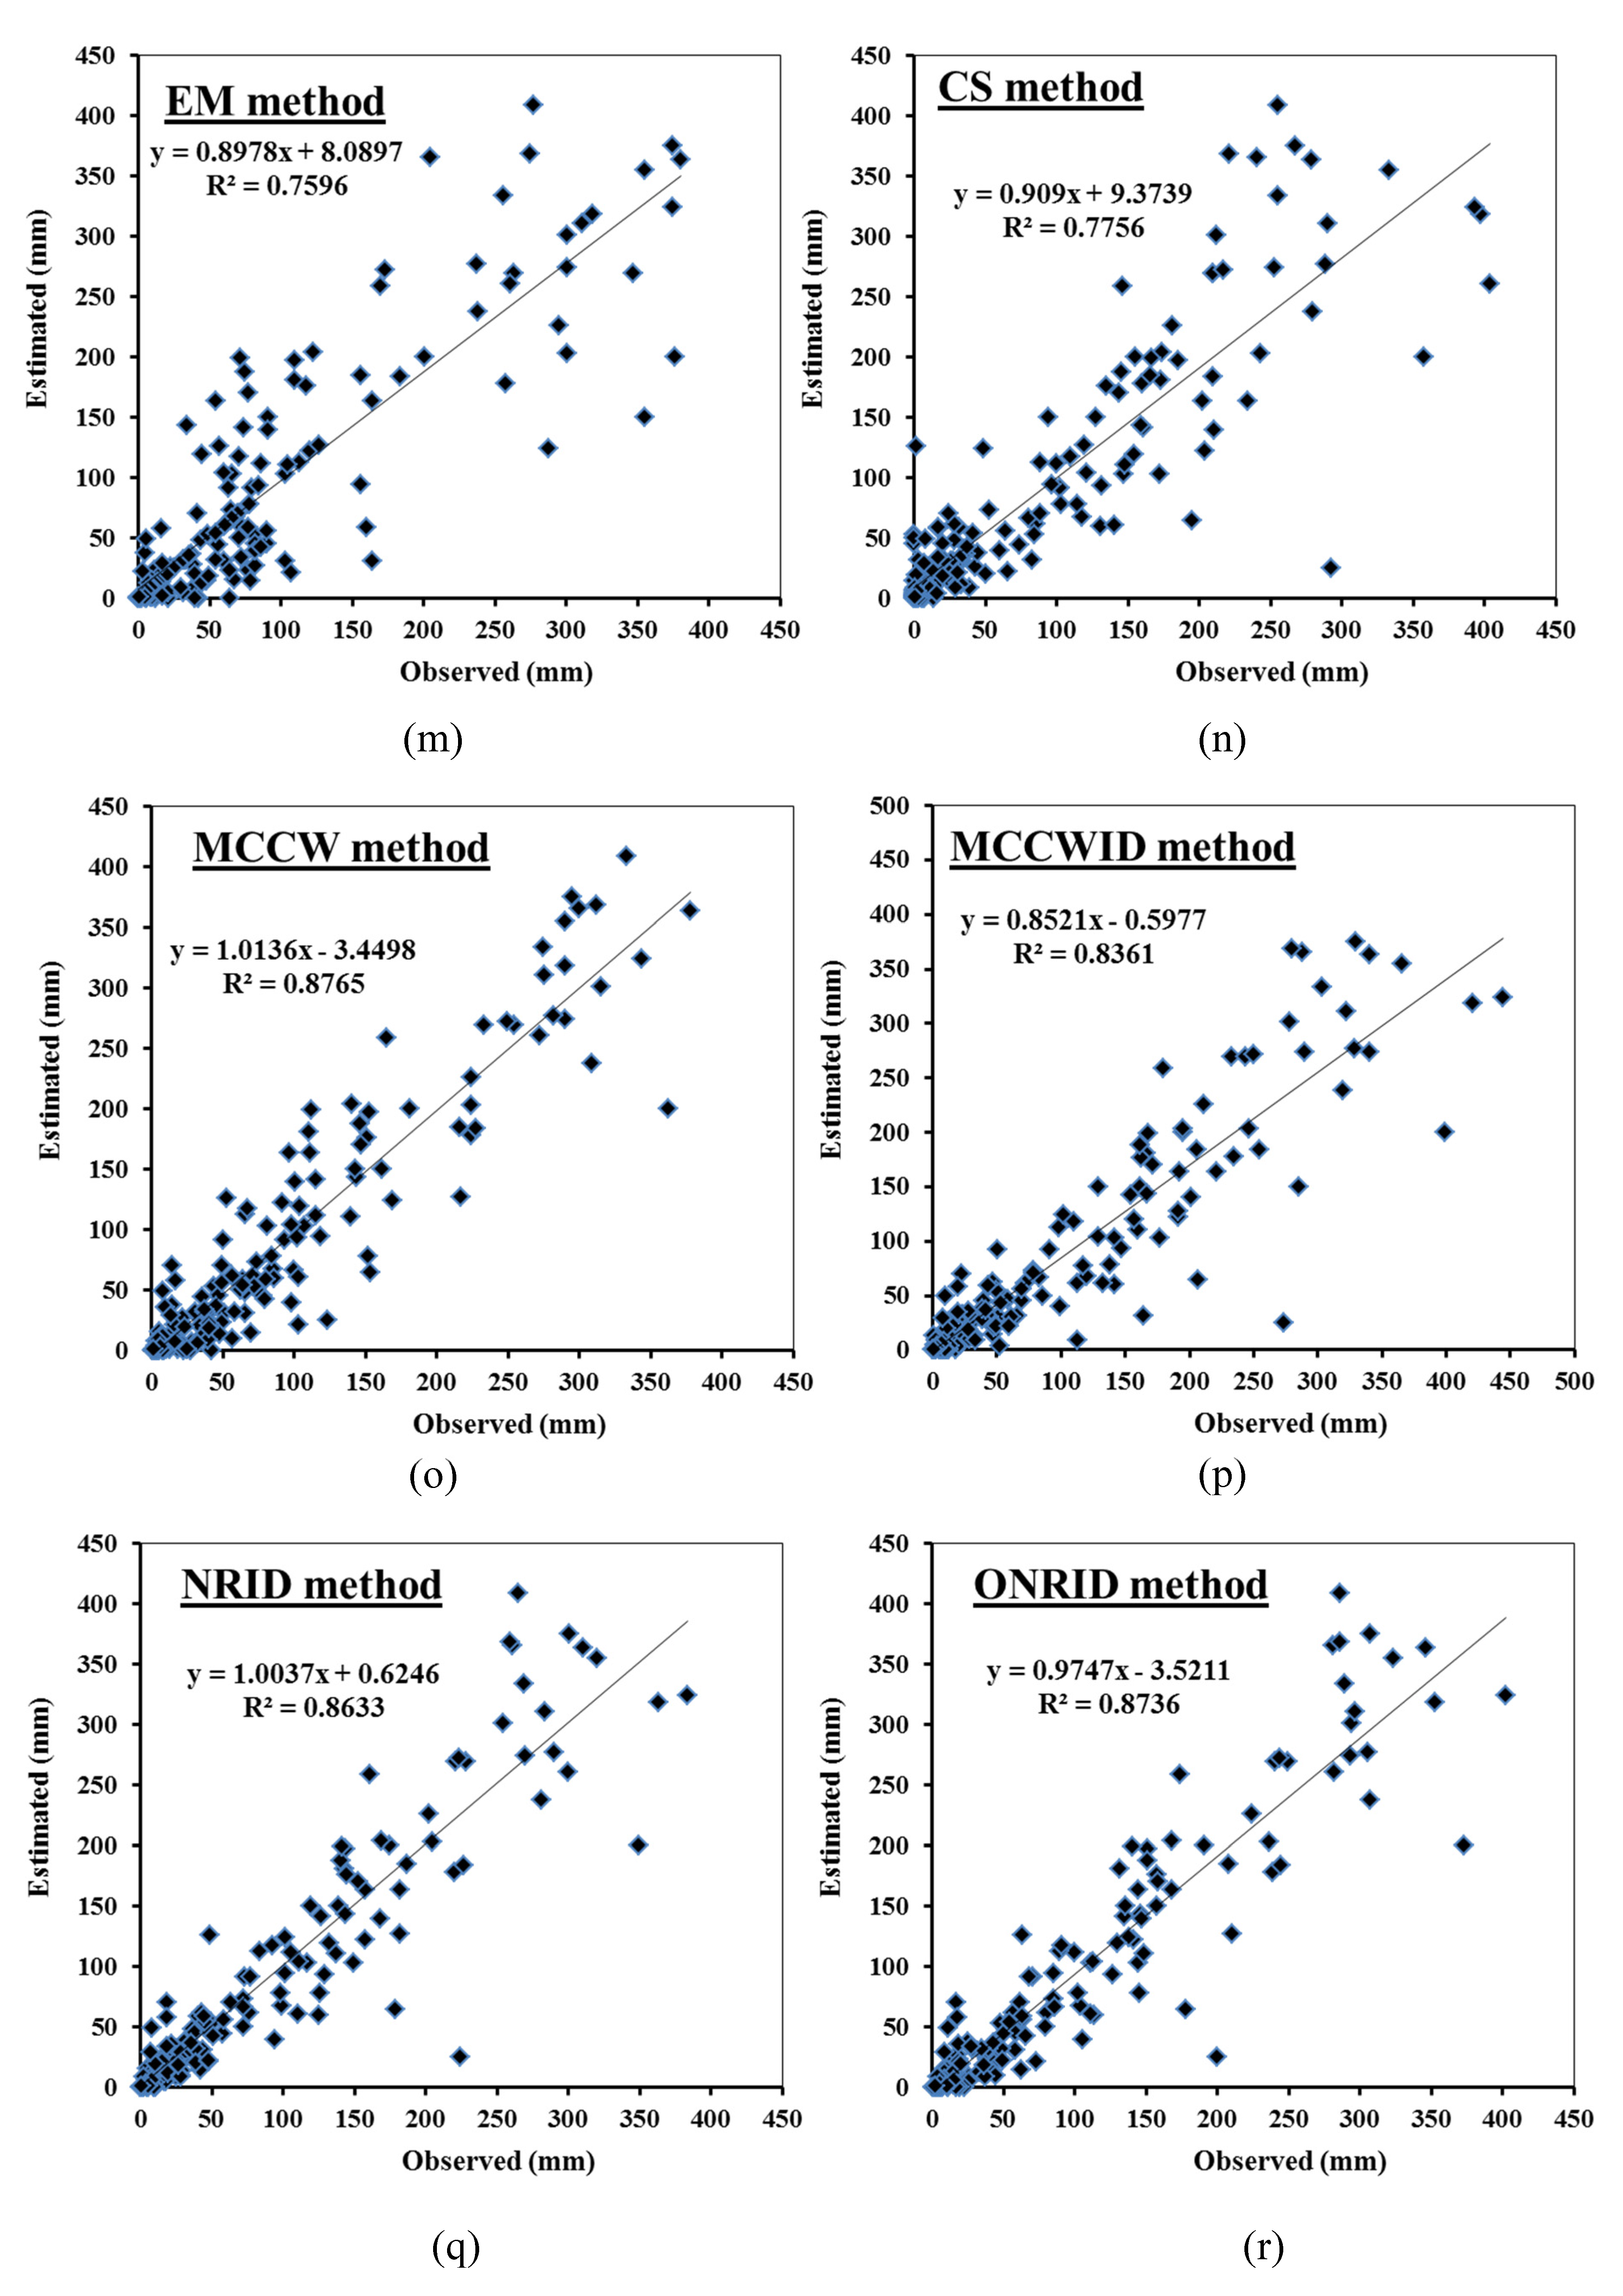
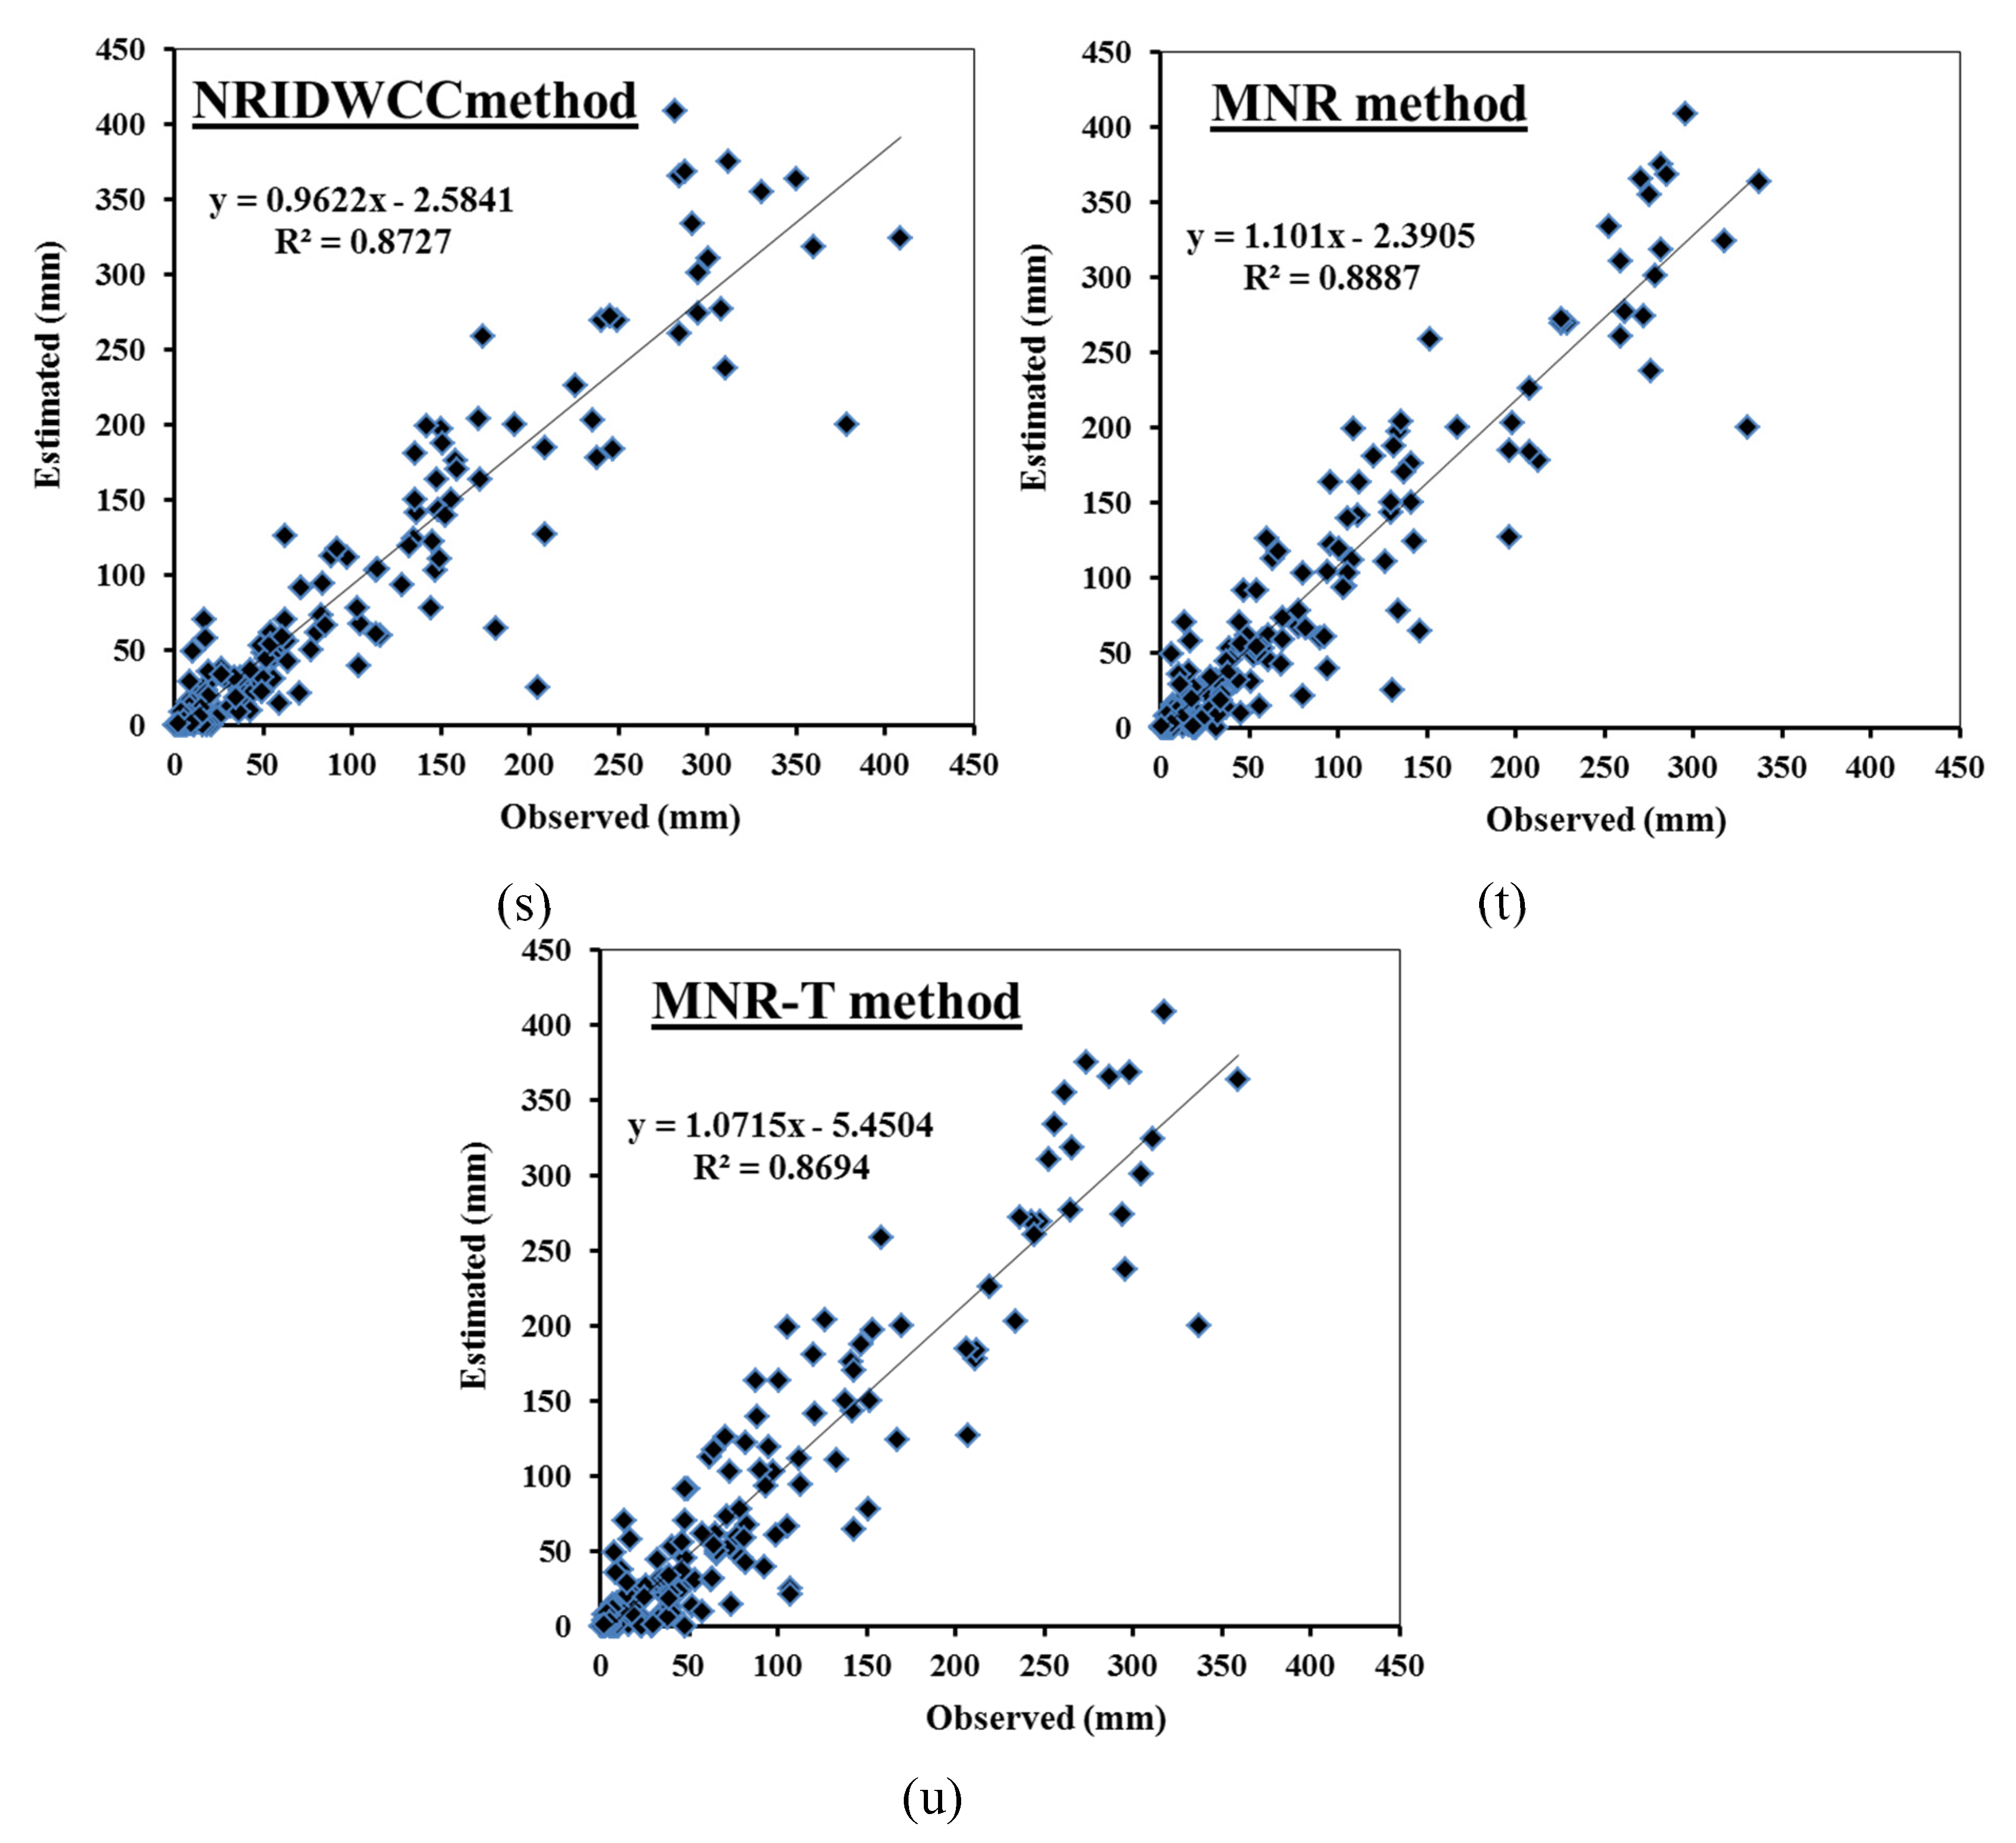
3.2. Comparison Between the Proposed Mmethods Results
4. Conclusions
Author Contributions
Funding
Conflicts of Interest
References
- Qutbudin, I.; Shiru, M.S.; Sharafati, A.; Ahmed, K.; Al-Ansari, N.; Yaseen, Z.M.; Shahid, S.; Wang, X. Seasonal drought pattern changes due to climate variability: Case study in Afghanistan. Water 2019, 11, 1096. [Google Scholar] [CrossRef] [Green Version]
- Suhaila, J.; Sayang, M.D.; Jemain, A.A. Revised spatial weighting methods for estimation of missing rainfall data. Asia-Pac. J. Atmos. Sci. 2008, 44, 93–104. [Google Scholar]
- Yaseen, Z.; Ebtehaj, I.; Kim, S.; Sanikhani, H.; Asadi, H.; Ghareb, M.; Bonakdari, H.; Wan Mohtar, W.; Al-Ansari, N.; Shahid, S. Novel hybrid data-intelligence model for forecasting monthly rainfall with uncertainty analysis. Water 2019, 11, 502. [Google Scholar] [CrossRef] [Green Version]
- Kashani, M.H.; Dinpashoh, Y. Evaluation of efficiency of different estimation methods for missing climatological data. Stoch. Environ. Res. Risk Assess. 2012, 26, 59–71. [Google Scholar] [CrossRef]
- Kim, J.W.; Pachepsky, Y.A. Reconstructing missing daily precipitation data using regression trees and artificial neural networks for SWAT streamflow simulation. J. Hydrol. 2010, 394, 305–314. [Google Scholar] [CrossRef]
- Xia, Y.; Fabian, P.; Stohl, A.; Winterhalter, M. Forest climatology: Estimation of missing values for Bavaria, Germany. Agric. For. Meteorol. 1999, 96, 131–144. [Google Scholar] [CrossRef] [Green Version]
- Campozano, L.; Sánchez, E.; Avilés, Á.; Samaniego, E. Evaluation of infilling methods for time series of daily precipitation and temperature: The case of the ecuadorian andes. Maskana 2014, 5, 99–115. [Google Scholar] [CrossRef]
- Wagner, P.D.; Fiener, P.; Wilken, F.; Kumar, S.; Schneider, K. Comparison and evaluation of spatial interpolation schemes for daily rainfall in data scarce regions. J. Hydrol. 2012, 464, 388–400. [Google Scholar] [CrossRef]
- Xiao, W.; Nazario, G.; Wu, H.; Zhang, H.; Cheng, F. A neural network based computational model to predict the output power of different types of photovoltaic cells. PLoS ONE 2017, 12, e0184561. [Google Scholar] [CrossRef] [Green Version]
- Yaseen, Z.M.; Sulaiman, S.O.; Deo, R.C.; Chau, K.-W. An enhanced extreme learning machine model for river flow forecasting: State-of-the-art, practical applications in water resource engineering area and future research direction. J. Hydrol. 2018, 569, 387–408. [Google Scholar] [CrossRef]
- Tang, W.Y.; Kassim, A.H.M.; Abubakar, S.H. Comparative studies of various missing data treatment methods-Malaysian experience. Atmos. Res. 1996, 42, 247–262. [Google Scholar] [CrossRef]
- Eischeid, J.K.; Pasteris, P.A.; Diaz, H.F.; Plantico, M.S.; Lott, N.J. Creating a serially complete, national daily time series of temperature and precipitation for the western United States. J. Appl. Meteorol. 2000, 39, 1580–1591. [Google Scholar] [CrossRef]
- De Silva, R.P.; Dayawansa, N.D.K.; Ratnasiri, M.D. A comparison of methods used in estimating missing rainfall data. J. Agric. Sci. 2007, 3. [Google Scholar] [CrossRef]
- Radi, N.F.A.; Zakaria, R.; Azman, M.A. Estimation of missing rainfall data using spatial interpolation and imputation methods. In AIP conference proceedings; American Institute of Physics: College Park, MD, USA, 2015; Volume 1643, pp. 42–48. [Google Scholar]
- Yozgatligil, C.; Aslan, S.; Iyigun, C.; Batmaz, I. Comparison of missing value imputation methods in time series: The case of Turkish meteorological data. Theor. Appl. Climatol. 2013, 112, 143–167. [Google Scholar] [CrossRef]
- Willmott, C.J.; Robeson, S.M. Climatologically aided interpolation (CAI) of terrestrial air temperature. Int. J. Climatol. 1995, 15, 221–229. [Google Scholar] [CrossRef]
- Little, R.J.A.; Rubin, D.B. Factored likelihood methods, ignoring the missing-data mechanism. Stat. Anal. Missing Data 2002, 133–163. [Google Scholar] [CrossRef]
- Gyau-Boakye, P.; Schultz, G.A. Filling gaps in runoff time series in West Africa. Hydrol. Sci. J. 1994, 39, 621–636. [Google Scholar] [CrossRef]
- Salih, S.Q.; Sharafati, A.; Ebtehaj, I.; Sanikhani, H.; Siddique, R.; Deo, R.C.; Bonakdari, H.; Shahid, S.; Yaseen, Z.M. Integrative stochastic model standardization with genetic algorithm for rainfall pattern forecasting in tropical and semi-arid environments. Hydrol. Sci. J. 2020, 1–13. [Google Scholar] [CrossRef]
- Willmott, C.J.; Robeson, S.M.; Feddema, J.J. Estimating continental and terrestrial precipitation averages from rain-gauge networks. Int. J. Climatol. 1994, 14, 403–414. [Google Scholar] [CrossRef] [Green Version]
- Teegavarapu, R.S.V.; Chandramouli, V. Improved weighting methods, deterministic and stochastic data-driven models for estimation of missing precipitation records. J. Hydrol. 2005, 312, 191–206. [Google Scholar] [CrossRef]
- Pizarro, R.; Ausensi, P.; Aravena, D.; Sangüesa, C.; León, L.; Balocchi, F. Evaluación de métodos hidrológicos para la completación de datos faltantes de precipitación en estaciones de la región del Maule, Chile. Aqua-Lac 2009, 1, 172–185. [Google Scholar]
- Alfaro, R.; Pacheco, R. Aplicación de algunos métodos de relleno a series anuales de lluvia de diferentes regiones de Costa Rica. Tópicos Meteorológicos y Oceanográficos 2000, 7, 1–20. [Google Scholar]
- Dastorani, M.T.; Moghadamnia, A.; Piri, J.; Rico-Ramirez, M. Application of ANN and ANFIS models for reconstructing missing flow data. Environ. Monit. Assess. 2009, 166, 421–434. [Google Scholar] [CrossRef] [PubMed]
- Bhagat, S.K.; Welde, W.; Tesfaye, O.; Tung, T.M.; Al-Ansari, N.; Salih, S.Q.; Yaseen, Z.M. Evaluating physical and fiscal water leakage in water distribution system. Water 2019, 11, 2091. [Google Scholar] [CrossRef] [Green Version]
- De Martonne, E. Aridité et indices d’aridité. Académie Des Sci. Comptes Rendus 1923, 182, 1935–1938. [Google Scholar]
- Te, C.V.; Maidment, D.R.; Mays, L.W. Applied hydrology. In Water Resources Handbook; McGraw-Hill: New York, NY, USA, 1988; ISBN 978-0070108103. [Google Scholar]
- Paulhus, J.L.H.; Kohler, M.A. Interpolation of missing precipitation records. Mon. Weather Rev. 1952, 80, 129–133. [Google Scholar] [CrossRef] [Green Version]
- Young, K.C. A Three-way model for interpolating for monthly precipitation values. Mon. Weather Rev. 1992, 120, 2561–2569. [Google Scholar] [CrossRef]
- Singh, V.P. Elementary Hydrology; Prentice-hall Of India Pvt Ltd.: Delhi, India, 1994. [Google Scholar]
- Wei, E.C.; McGuiness, J.L.N. Reciprocal Distance Square Method: A Computer Technique for Estimating Areal Precipitation; US Department of Agriculture (USDA): Washington, DC, USA, 1973.
- Vieux, B.E. Distributed Hydrologic Modeling Using GIS, 2nd ed.; Kluwer Academic Publishers: Dordrecht, The Netherlands, 2001; pp. 1–17. [Google Scholar]
- Golkhatmi, N.S.; Sanaeinejad, S.H.; Ghahraman, B.; Pazhand, H.R. Extended modified inverse distance method for interpolation rainfall. Int. J. Eng. Invent. 2012, 3, 57–65. [Google Scholar]
- Viale, M.; Garreaud, R. Orographic effects of the subtropical and extratropical Andes on upwind precipitating clouds. J. Geophys. Res. Atmos. 2015, 120, 4962–4974. [Google Scholar] [CrossRef]
- Yan, X.; Su, X. Linear Regression Analysis: Theory and Computing; World Scientific: Singapore, 2009; ISBN 9812834109. [Google Scholar]
- Teegavarapu, R.S.V. Estimation of missing precipitation records integrating surface interpolation techniques and spatio-temporal association rules. J. Hydroinform. 2009, 11, 133–146. [Google Scholar] [CrossRef]
- Rubin, D.B. An overview of multiple imputation. In Proceedings of the Survey Research Methods Section of the American Statistical Association; American Statistical Association: Alexandria, VA, USA, 1988; pp. 79–84. [Google Scholar]
- Little, R.J.A.; Rubin, D.B. Statistical Analysis with Missing Data; John Wiley & Sons: Hoboken, NJ, USA, 2019; Volume 793, ISBN 0470526793. [Google Scholar]
- Schafer, J.L. Multiple imputation: A primer. Stat. Methods Med Res. 1999, 8, 3–15. [Google Scholar] [CrossRef] [PubMed]
- Schafer, J.L.; Graham, J.W. Missing data: Our view of the state of the art. Psychol. Methods 2002, 7, 147–177. [Google Scholar] [CrossRef] [PubMed]
- Myers, T.A. Goodbye, listwise deletion: Presenting hot deck imputation as an easy and effective tool for handling missing data. Commun. Methods Meas. 2011, 5, 297–310. [Google Scholar] [CrossRef]
- Wold, H.O.A. Nonlinear Estimation by Iterative Least Square Procedures; Research Papers in Statistics; David, F., Ed.; Wiley: New York, NY, USA, 1968; pp. 411–444. [Google Scholar]
- Tenenhaus, M. La Régression PLS: Théorie et Pratique; Editions Technip: Paris, France, 1998; ISBN 2710807351. [Google Scholar]
- Dempster, A.P.; Laird, N.M.; Rubin, D.B. Maximum likelihood from incomplete data via the EM algorithm. J. R. Stat. Soc. Ser. B (Methodol.) 1977, 39, 1–22. [Google Scholar]
- Schneider, T. Analysis of incomplete climate data: Estimation of mean values and covariance matrices and imputation of missing values. J. Clim. 2001, 14, 853–871. [Google Scholar] [CrossRef]
- Eskelson, B.N.I.; Temesgen, H.; Lemay, V.; Barrett, T.M.; Crookston, N.L.; Hudak, A.T. The roles of nearest neighbor methods in imputing missing data in forest inventory and monitoring databases. Scand. J. For. Res. 2009, 24, 235–246. [Google Scholar] [CrossRef] [Green Version]
- Bárdossy, A.; Pegram, G. Infilling missing precipitation records—A comparison of a new copula-based method with other techniques. J. Hydrol. 2014, 519, 1162–1170. [Google Scholar] [CrossRef]
- Kanda, N.; Negi, H.S.; Rishi, M.S.; Shekhar, M.S. Performance of various techniques in estimating missing climatological data over snowbound mountainous areas of Karakoram Himalaya. Meteorol. Appl. 2017, 25, 337–349. [Google Scholar] [CrossRef]
- Hubbard, K.G. Spatial variability of daily weather variables in the high plains of the USA. Agric. For. Meteorol. 1994, 68, 29–41. [Google Scholar] [CrossRef]
- Azman, M.A.; Zakaria, R.; Ahmad Radi, N.F. Estimation of missing rainfall data in Pahang using modified spatial interpolation weighting methods. In Proceedings of the AIP Conference Proceedings, Yogyakarta, Indonesia, 11–13 November 2015. [Google Scholar]
- Willmott, C.J.; Matsuura, K.; Robeson, S.M. Ambiguities inherent in sums-of-squares-based error statistics. Atmos. Environ. 2009, 43, 749–752. [Google Scholar] [CrossRef]
- Tung, T.M.; Yaseen, Z.M. A survey on river water quality modelling using artificial intelligence models: 2000–2020. J. Hydrol. 2020, 585, 124670. [Google Scholar]
- Savage, N.H.; Agnew, P.; Davis, L.S.; Ordóñez, C.; Thorpe, R.; Johnson, C.E.; O’Connor, F.M.; Dalvi, M. Air quality modelling using the met office unified model (AQUM OS24-26): Model description and initial evaluation. Geosci. Model Dev. 2013, 6, 353–372. [Google Scholar] [CrossRef] [Green Version]
- Chai, T.; Kim, H.-C.; Lee, P.; Tong, D.; Pan, L.; Tang, Y.; Huang, J.; McQueen, J.; Tsidulko, M.; Stajner, I. Evaluation of the united states national air quality forecast capability experimentalreal-time predictions in 2010 using air quality system ozone and NO2 measurements. Geosci. Model Dev. 2013, 6, 1831–1850. [Google Scholar] [CrossRef] [Green Version]
- Chai, T.; Draxler, R.R. Root mean square error (RMSE) or mean absolute error (MAE)?—Arguments against avoiding RMSE in the literature. Geosci. Model Dev. 2014, 7, 1247–1250. [Google Scholar] [CrossRef] [Green Version]
- Willmott, C.J. On the validation of models. Phys. Geogr. 1981, 2, 184–194. [Google Scholar] [CrossRef]
- Libonati, R.; Trigo, I.; DaCamara, C.C. Correction of 2 m-temperature forecasts using Kalman Filtering technique. Atmos. Res. 2008, 87, 183–197. [Google Scholar] [CrossRef]
- Porto de Carvalho, J.R.; Assad, E.D.; Pinto, H.S. Kalman filter and correction of the temperatures estimated by PRECIS model. Atmos. Res. 2011, 102, 218–226. [Google Scholar] [CrossRef]
- Carvalho, J.R.P.D.; Nakai, A.M.; Monteiro, J.E.B.A. Spatio-temporal modeling of data imputation for daily rainfall series in homogeneous zones. Rev. Bras. de Meteorol. 2016, 31, 196–201. [Google Scholar] [CrossRef] [Green Version]
- Afan, H.A.; Allawi, M.F.; El-Shafie, A.; Yaseen, Z.M.; Ahmed, A.N.; Malek, M.A.; Koting, S.B.; Salih, S.Q.; Mohtar, W.H.M.W.; Lai, S.H. Input attributes optimization using the feasibility of genetic nature inspired algorithm: Application of river flow forecasting. Sci. Rep. 2020, 10, 1–15. [Google Scholar] [CrossRef]
- Alexandersson, H. A homogeneity test applied to precipitation data. J. Climatol. 1986, 6, 661–675. [Google Scholar] [CrossRef]
- Hoeffding, W.; Kendall, M.G. Rank correlation methods. Econometrica 1957, 25, 181. [Google Scholar] [CrossRef]
- Gilbert, R.O. Statistical methods for environmental pollution monitoring. Biometrics 1988, 44, 319. [Google Scholar] [CrossRef] [Green Version]
- Mann, H.B. Nonparametric tests against trend. Econometrica 1945, 13, 245. [Google Scholar] [CrossRef]
- Sattari, M.-T.; Rezazadeh-Joudi, A.; Kusiak, A. Assessment of different methods for estimation of missing data in precipitation studies. Hydrol. Res. 2017, 48, 1032–1044. [Google Scholar] [CrossRef]
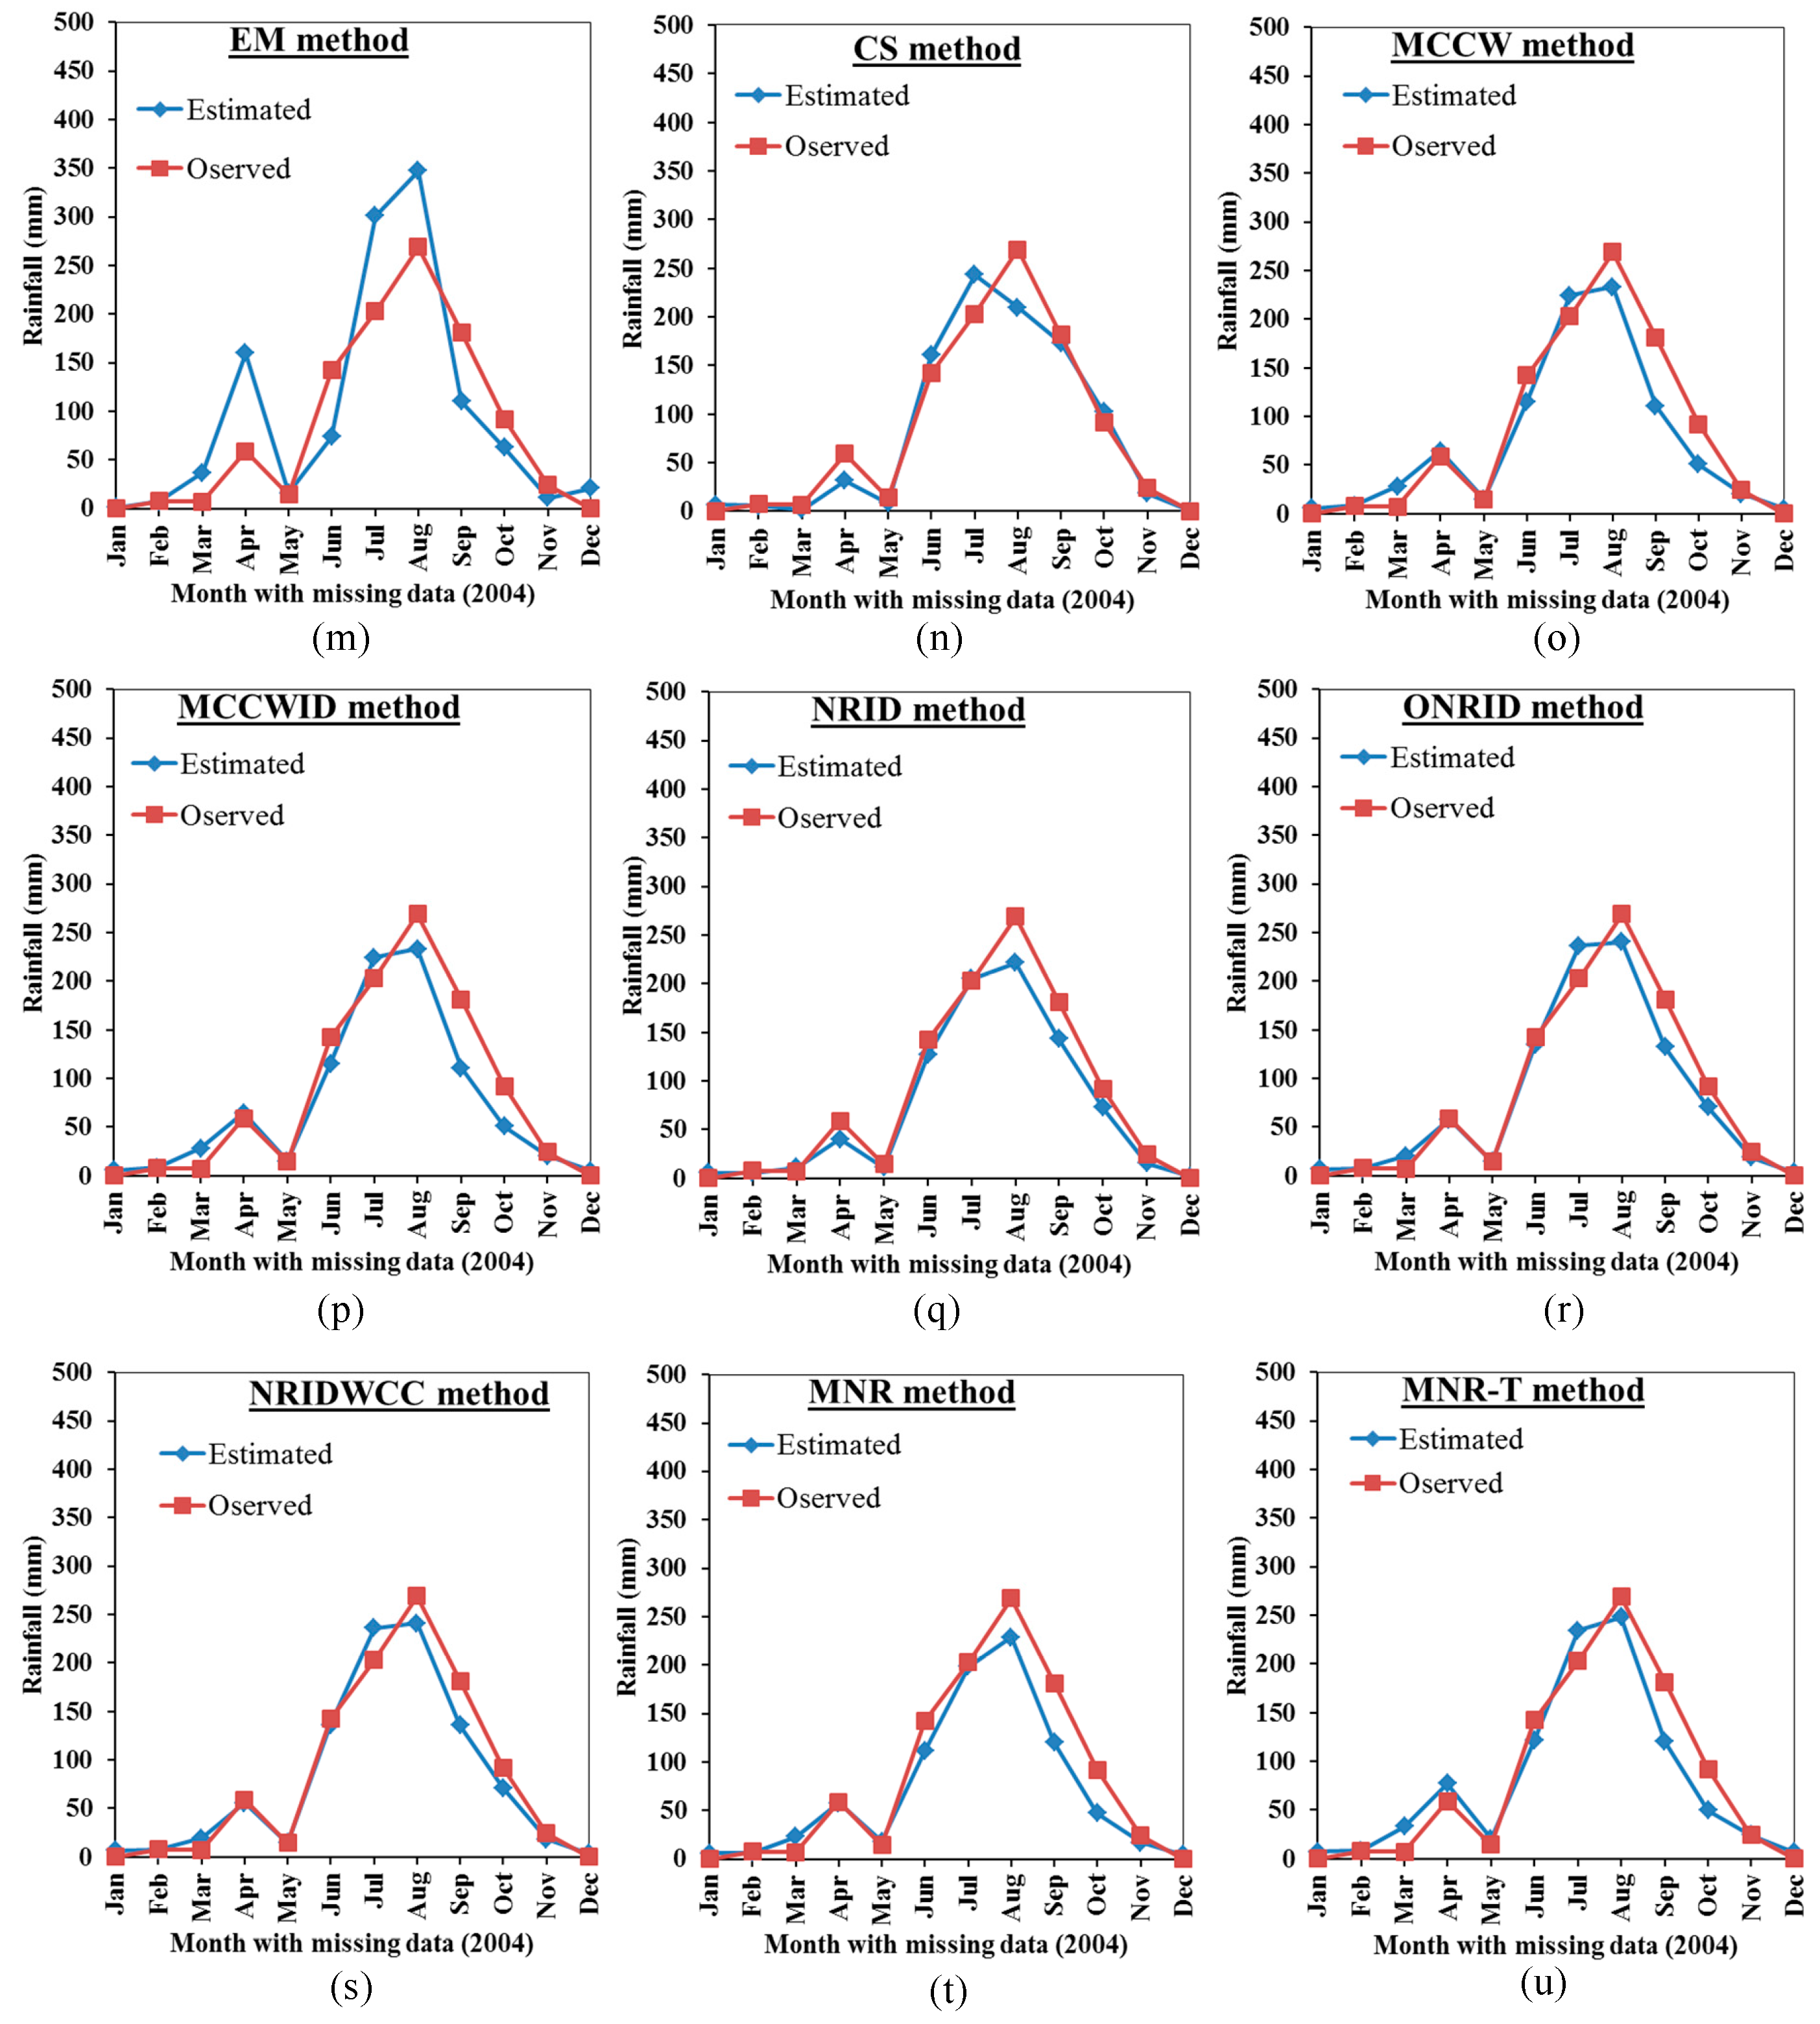
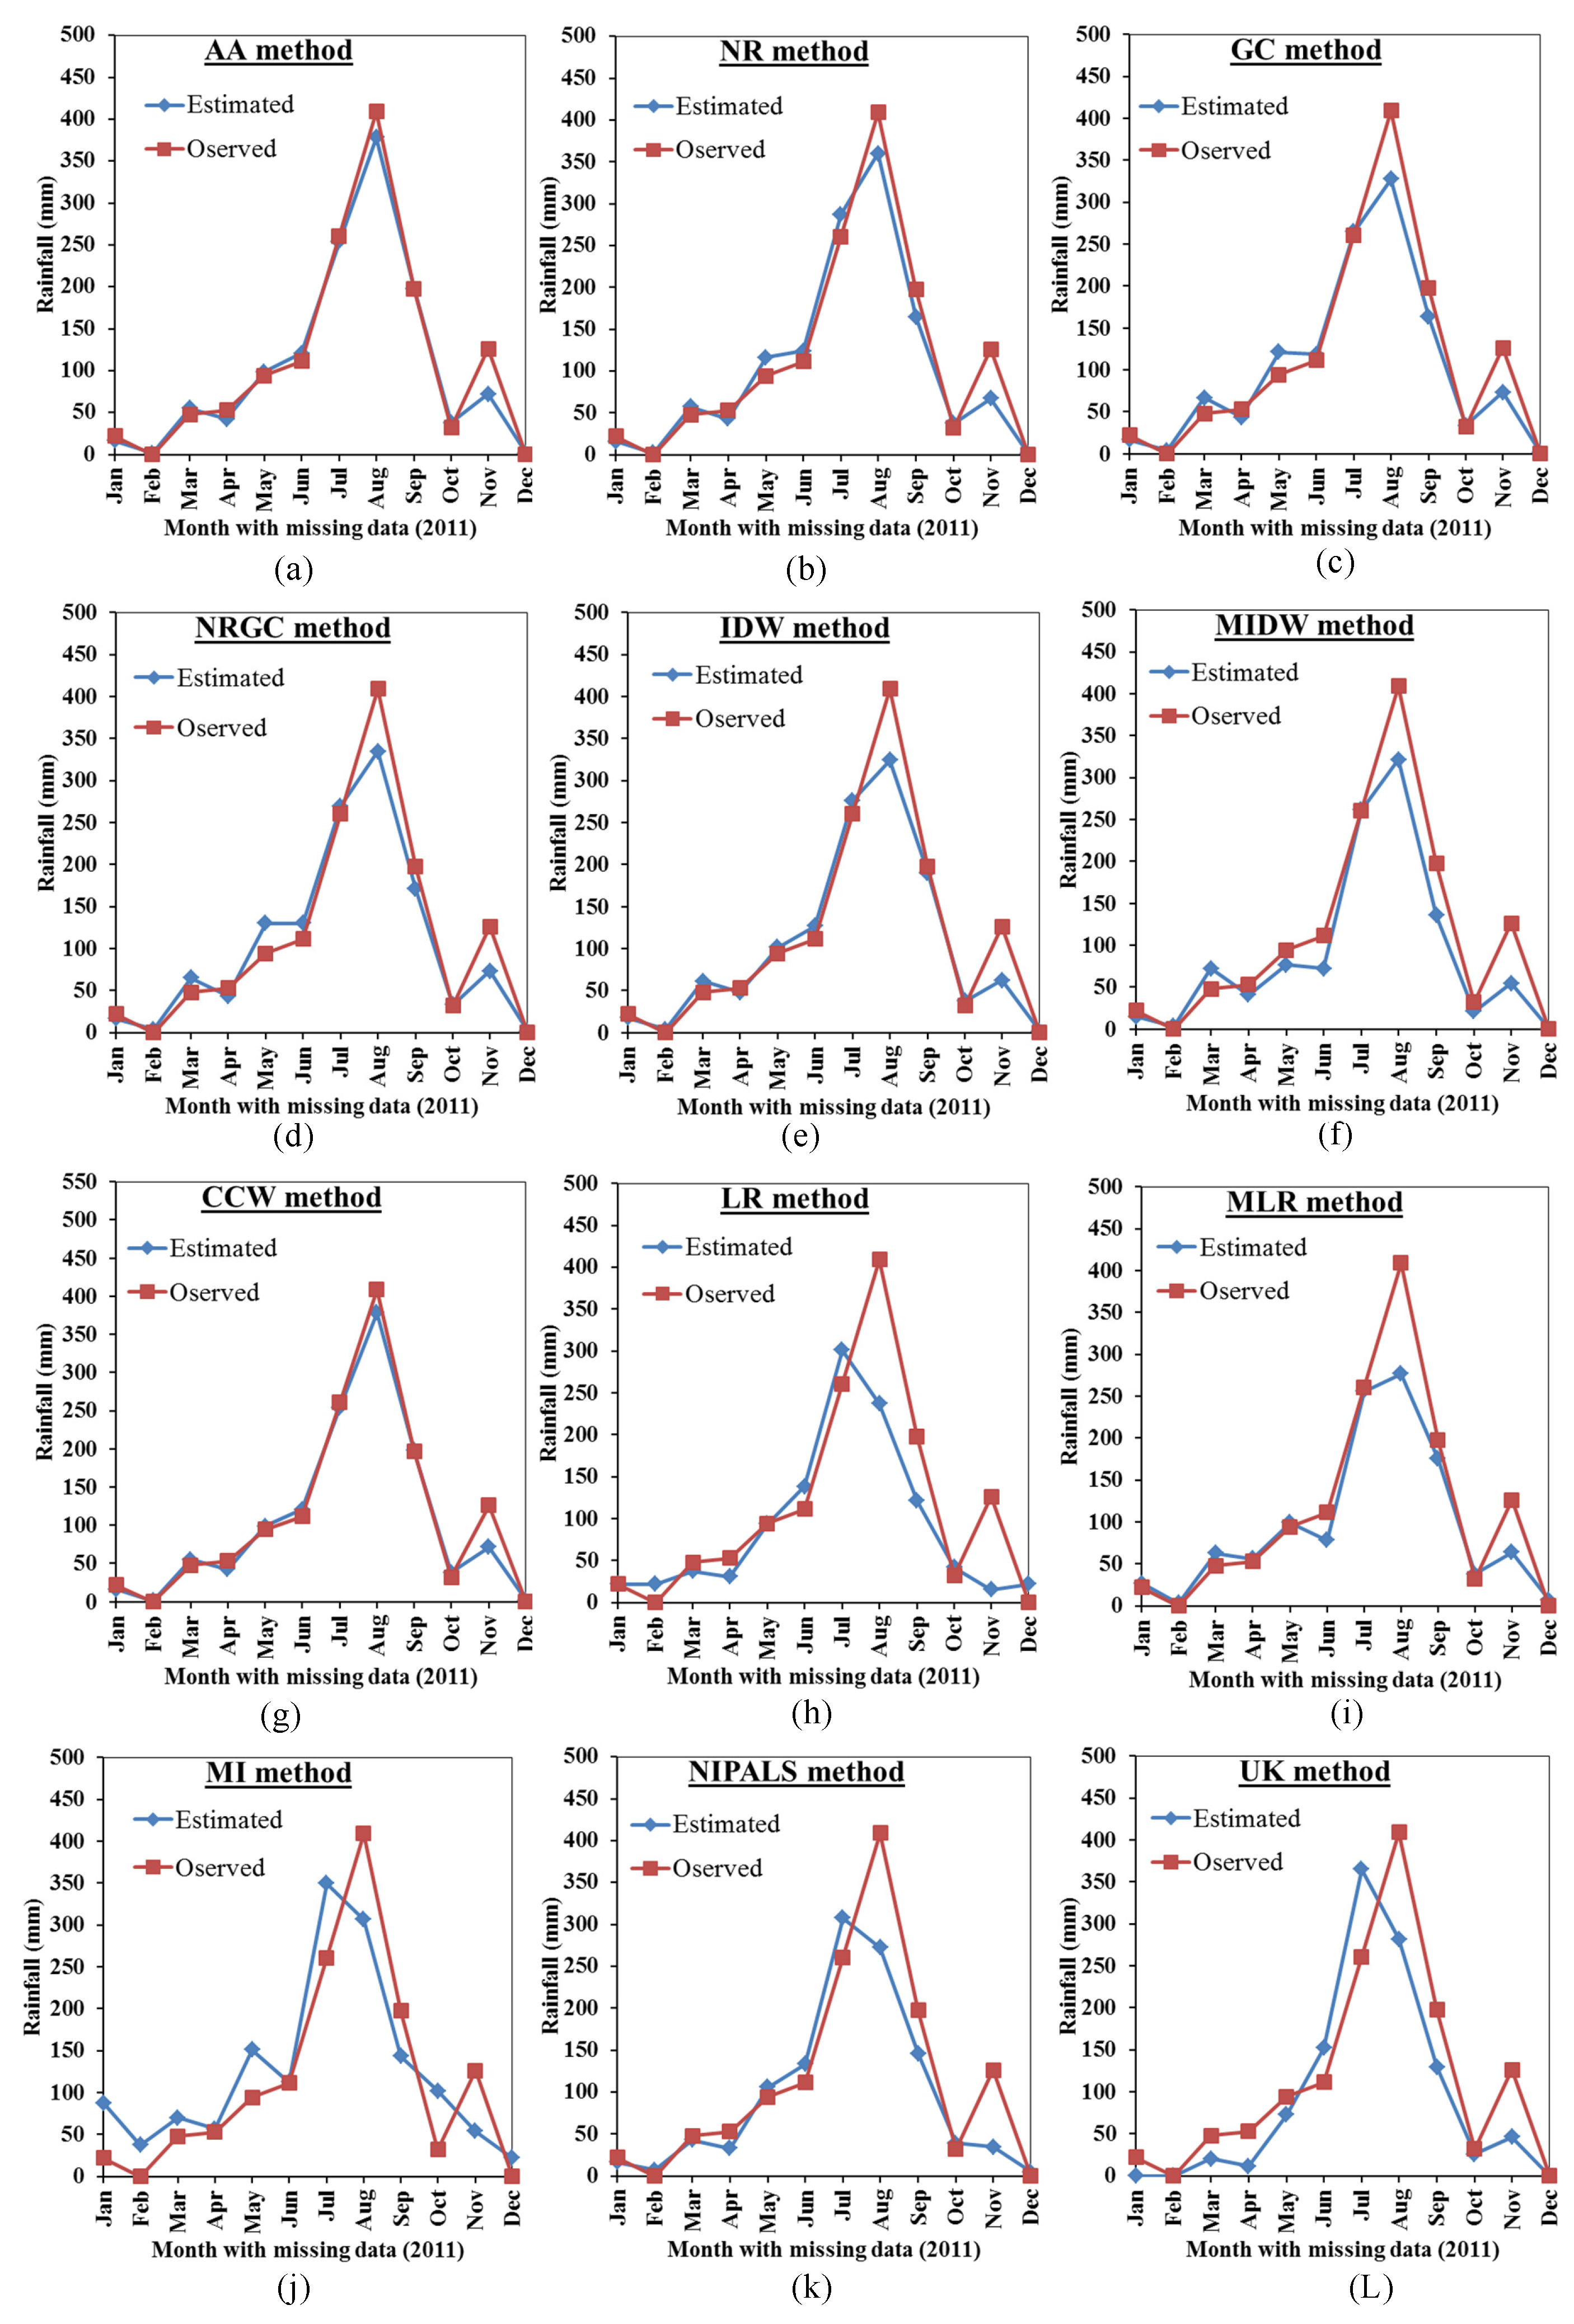

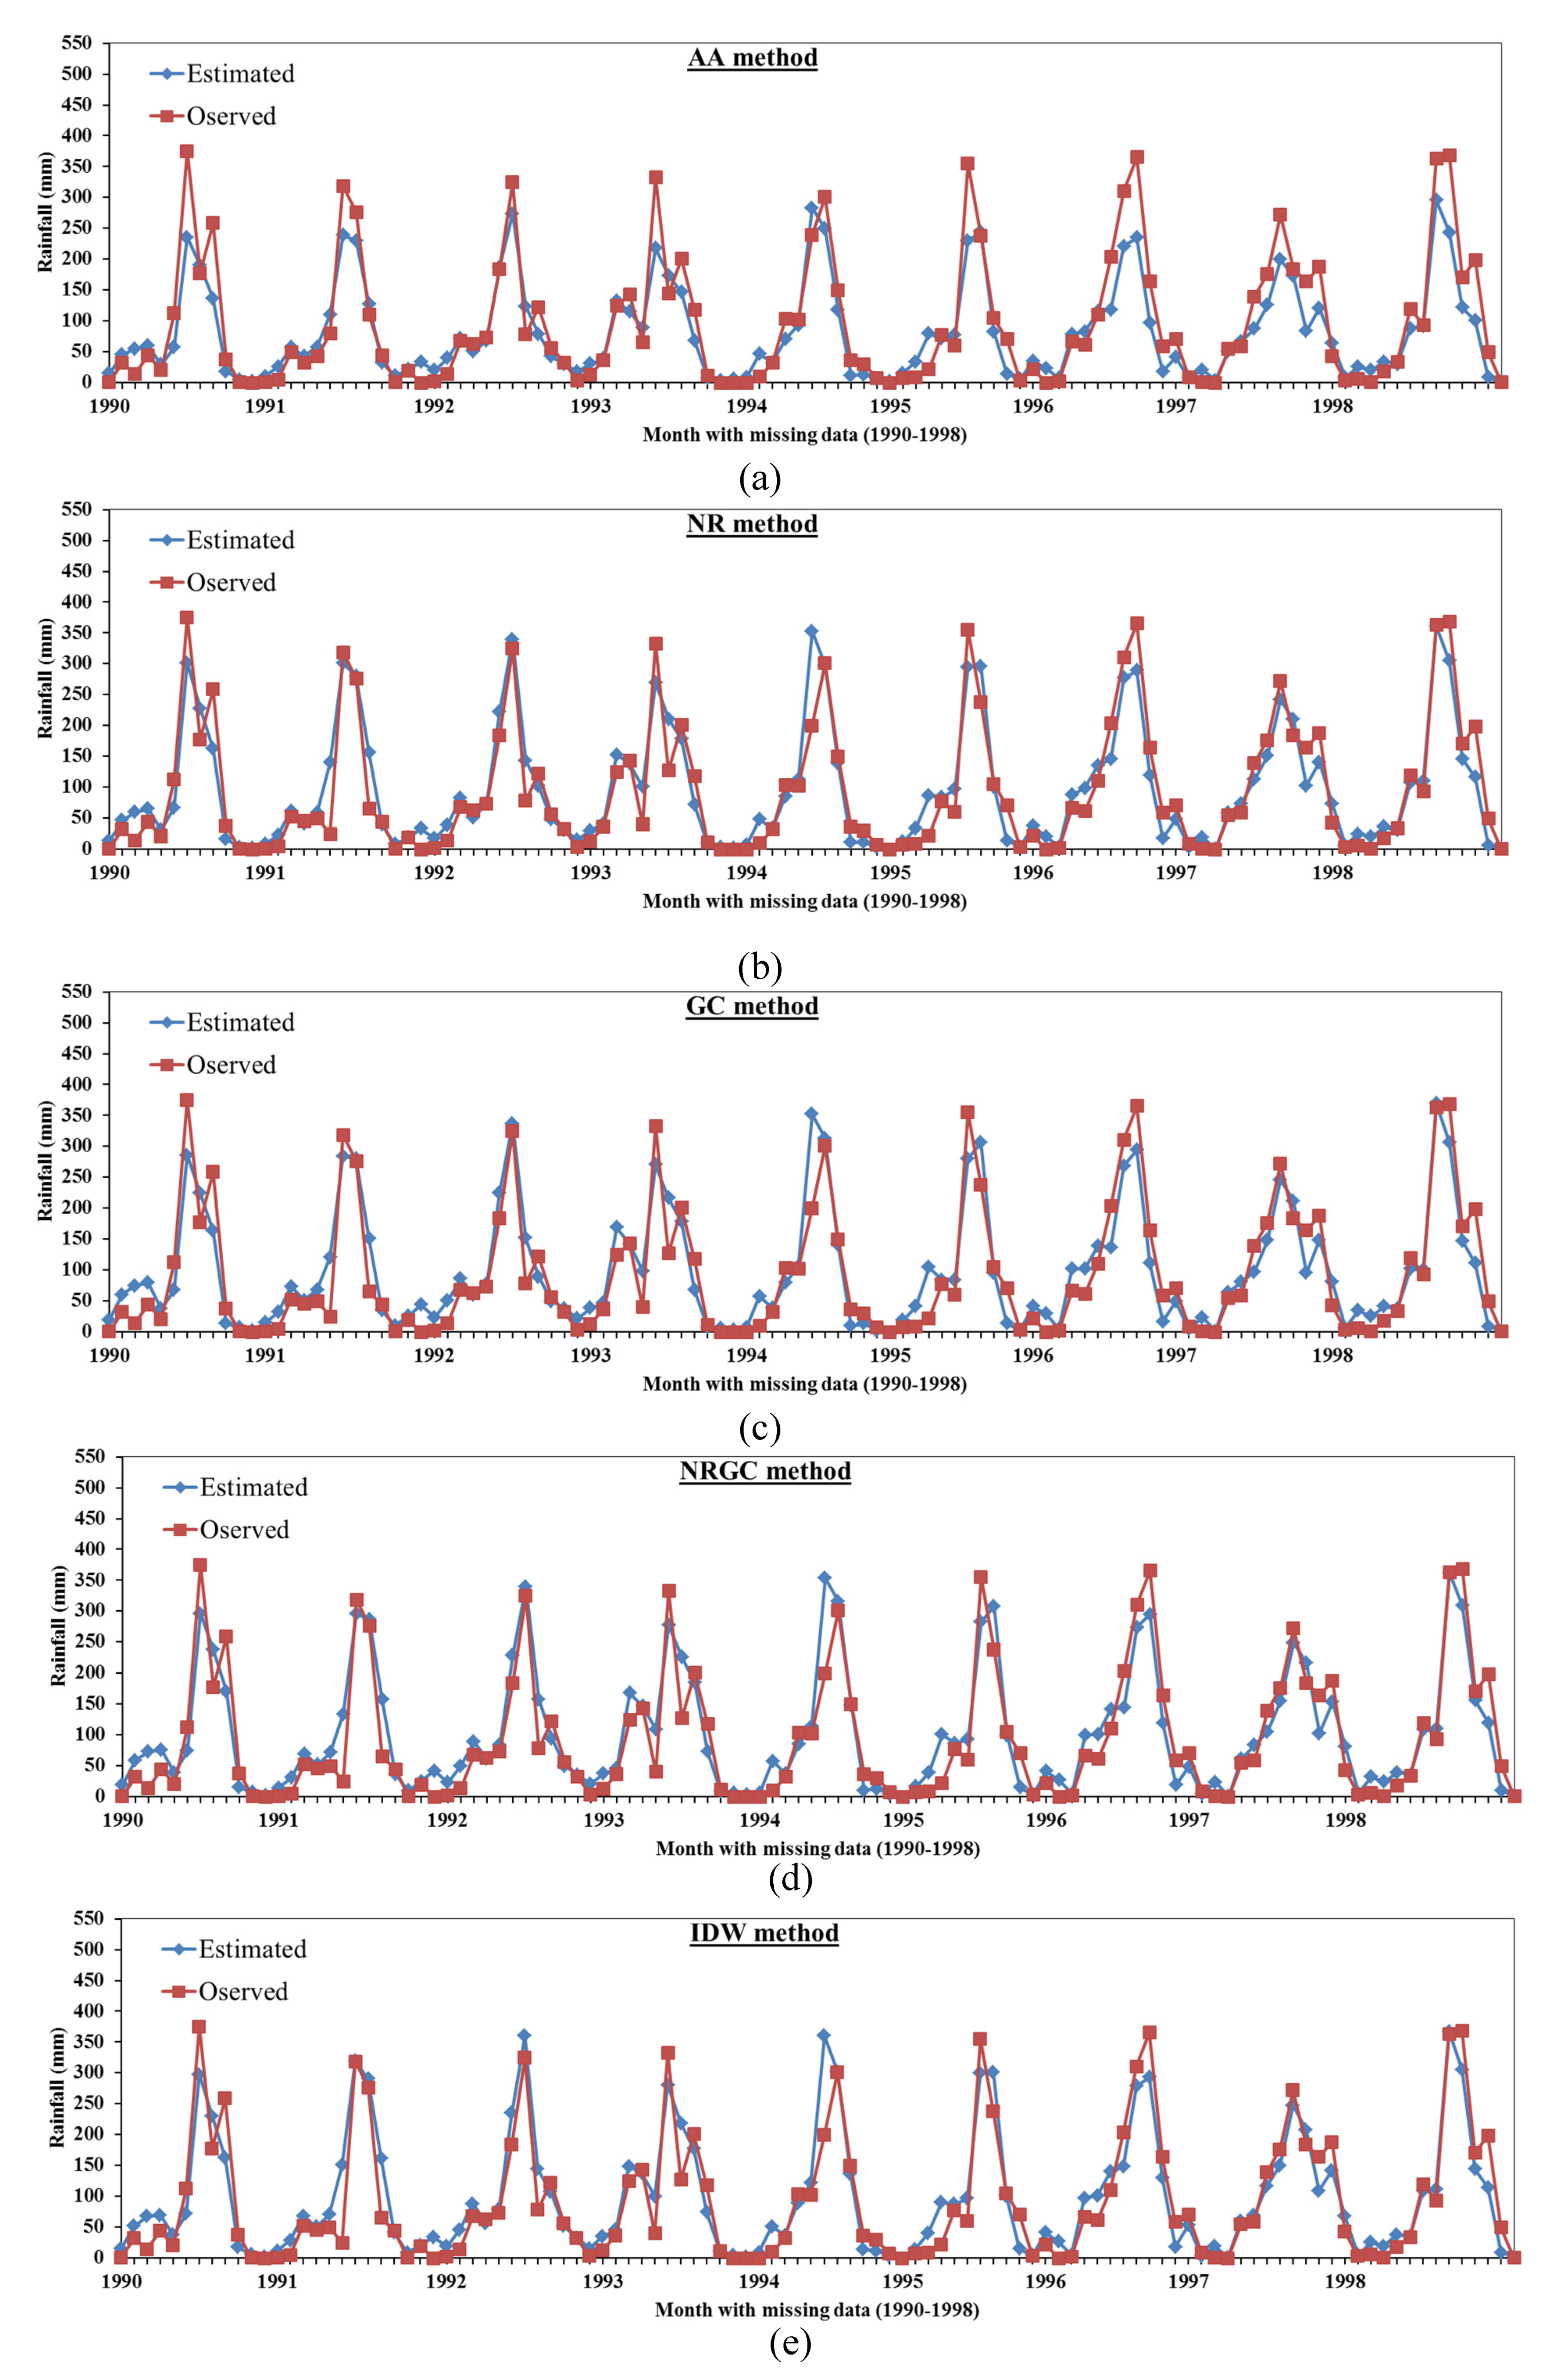


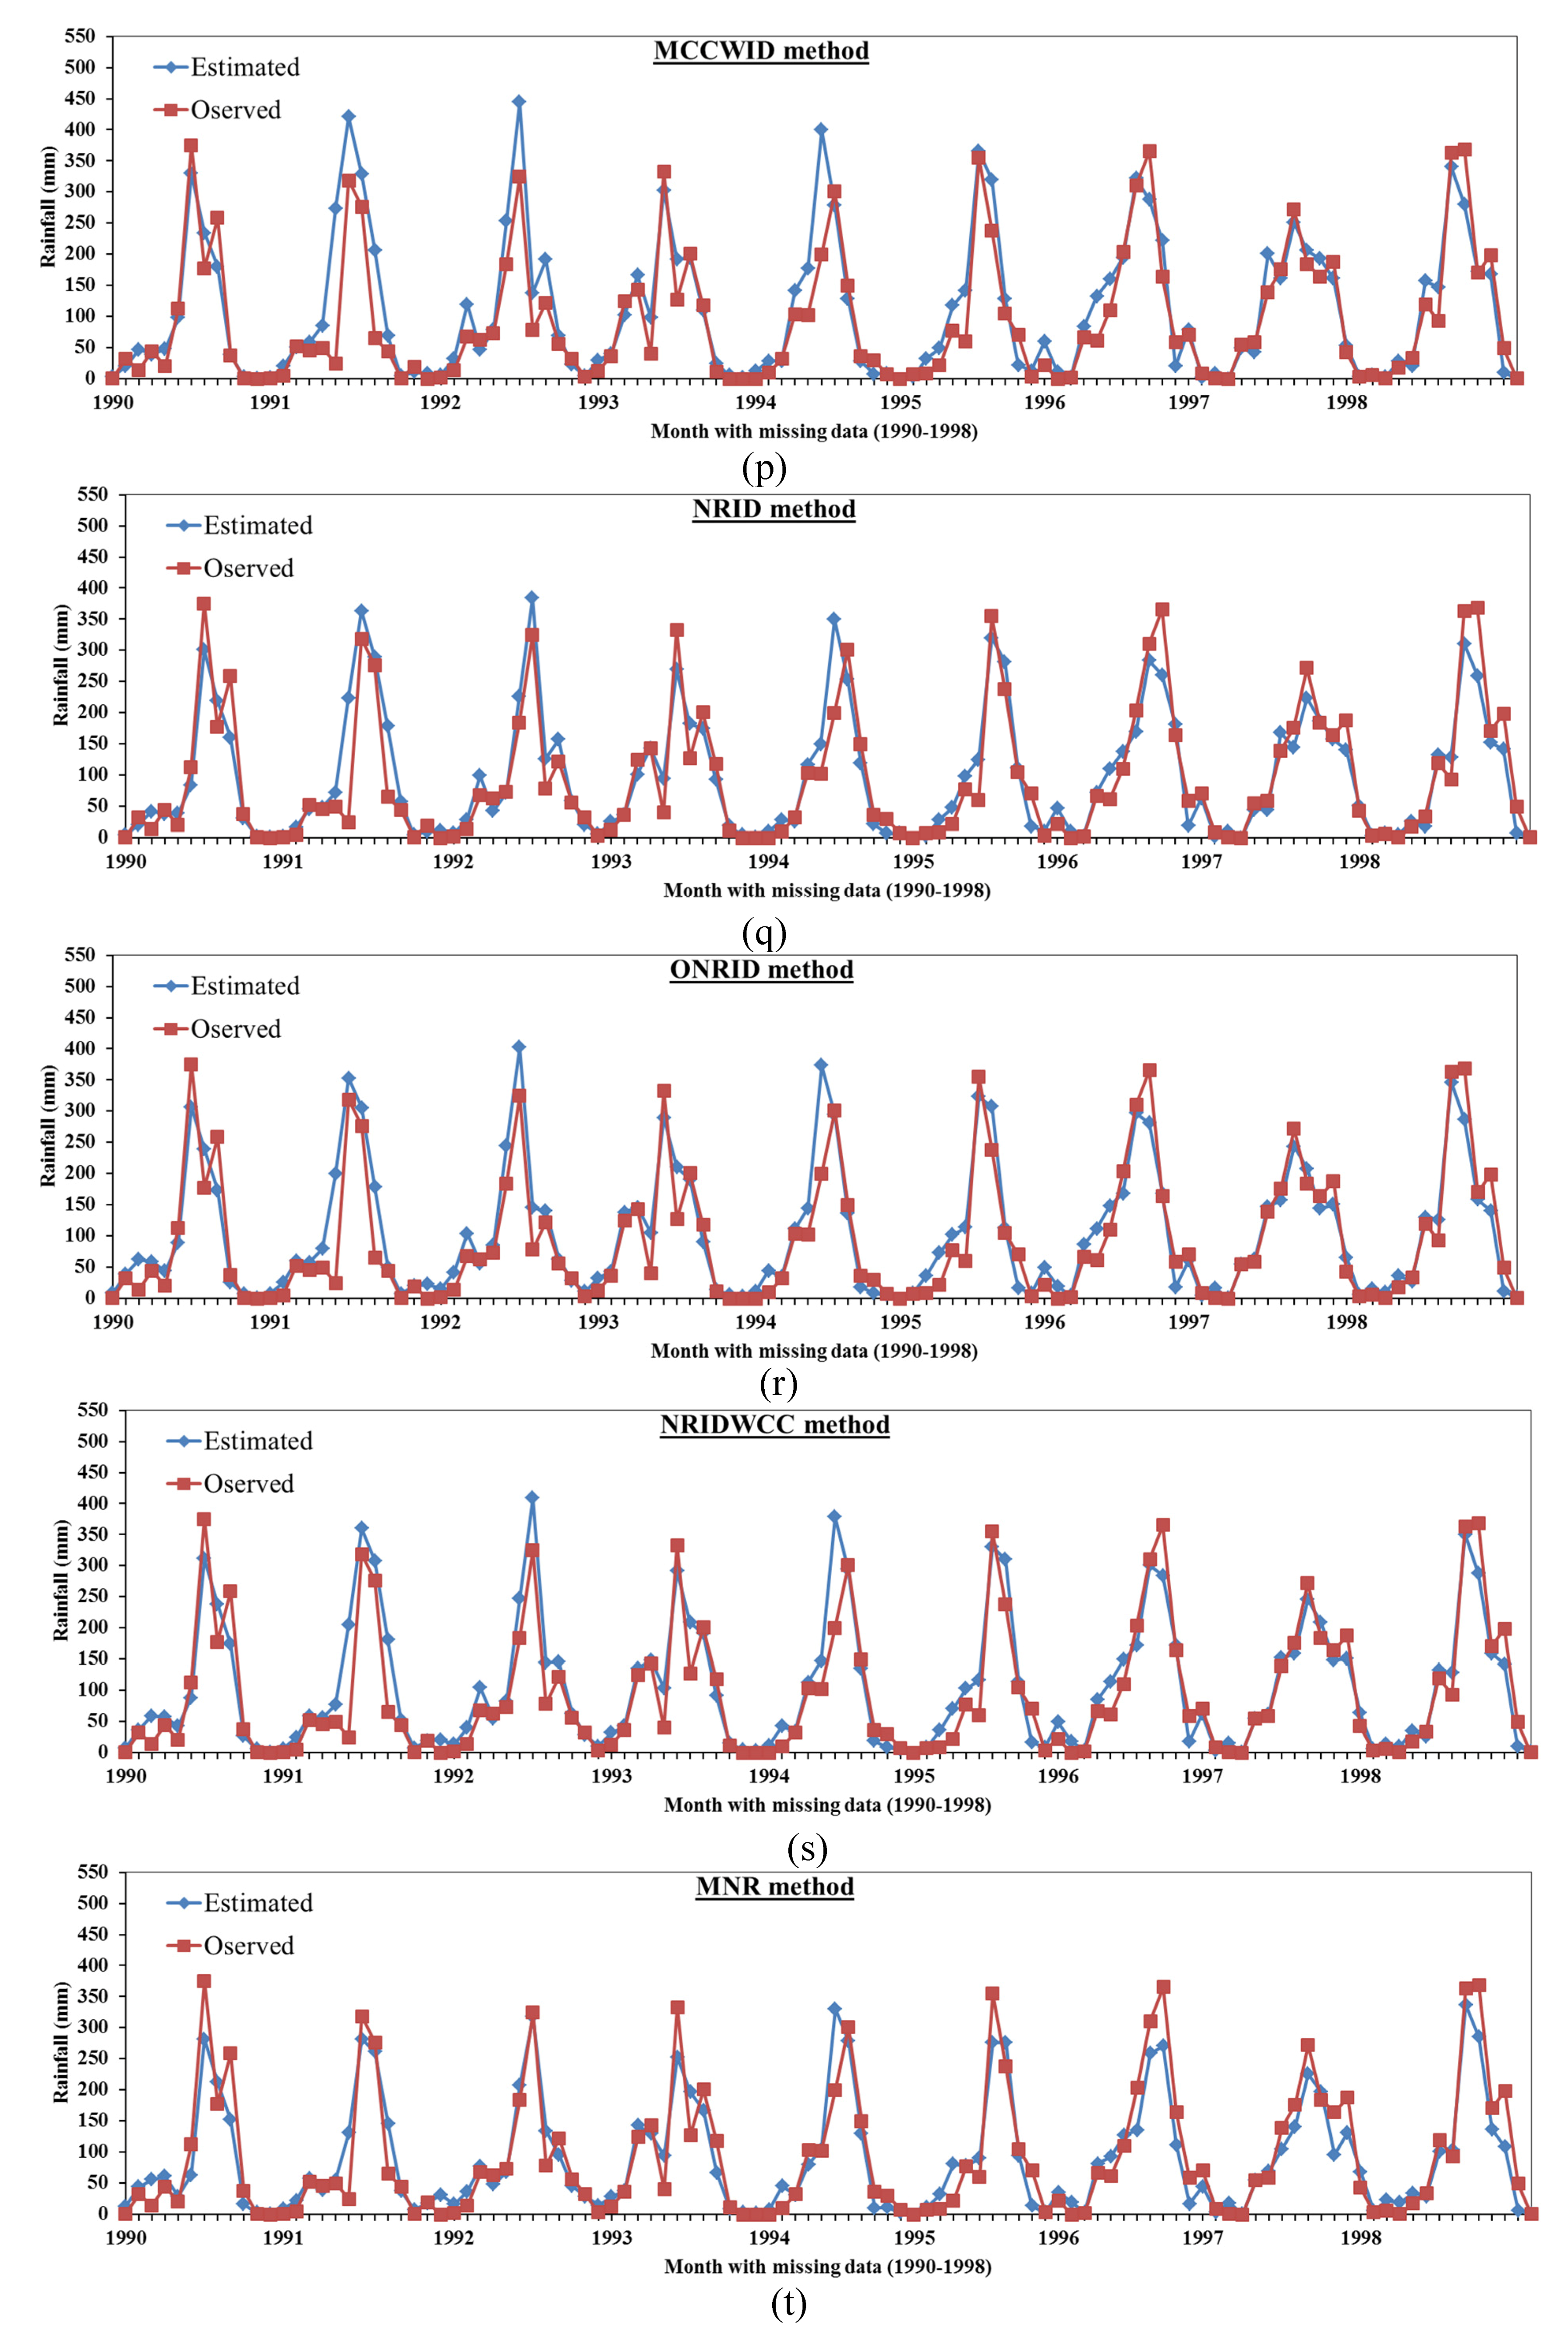


| Station | Latitude (N) | Longitude (E) | Elevation (m) | Statistical Properties | |||||
|---|---|---|---|---|---|---|---|---|---|
| Index of Aridity | Climate Type | Min Rainfall (mm) | Max Rainfall (mm) | Average Rainfall (mm) | Standard Deviation | ||||
| Motta: Target | 11.07 | 37.87 | 2397 | 3.57 | dry/arid | 0.0 | 443.6 | 96.68 | 108.8 |
| Adet | 11.27 | 37.49 | 2224 | 3.50 | dry/arid | 0.0 | 463.4 | 100.3 | 110.3 |
| Amba Marim | 11.20 | 39.22 | 2897 | 3.17 | dry/arid | 0.0 | 529.4 | 75.23 | 111.7 |
| Ancharo | 11.05 | 39.78 | 2174 | 3.26 | dry/arid | 0.0 | 598.8 | 98.29 | 114.2 |
| Bahir Dar | 11.60 | 37.30 | 1838 | 3.94 | dry/arid | 0.0 | 649.5 | 117.8 | 155.2 |
| Combolcha | 11.08 | 39.72 | 1857 | 2.83 | dry/arid | 0.0 | 542.8 | 84.58 | 97.45 |
| Degelo | 10.42 | 39.25 | 2605 | 2.81 | dry/arid | 0.0 | 546.9 | 73.24 | 104.6 |
| Dejein | 10.17 | 38.15 | 2445 | 4.01 | dry/arid | 0.0 | 645.4 | 112.2 | 123.61 |
| Gondar | 12.61 | 37.47 | 2296 | 3.17 | dry/arid | 0.0 | 568.9 | 97.03 | 117.3 |
| Haik | 11.31 | 39.68 | 2496 | 3.51 | dry/arid | 0.0 | 880.9 | 99.65 | 112.9 |
| Korem | 12.30 | 37.30 | 2470 | 2.75 | dry/arid | 0.0 | 435.6 | 81.01 | 98.15 |
| Mekane Selem | 10.74 | 38.76 | 2634 | 2.89 | dry/arid | 0.0 | 456.0 | 78.25 | 87.89 |
| Nefas Mewcha | 11.73 | 38.47 | 2898 | 3.75 | dry/arid | 0.0 | 690.1 | 87.23 | 116.2 |
| Yejuibe | 10.15 | 37.75 | 2152 | 3.76 | dry/arid | 0.0 | 640.2 | 111.4 | 127.9 |
| Yetemen | 10.33 | 38.15 | 2415 | 3.99 | dry/arid | 0.0 | 872.1 | 109.2 | 132.5 |
| Motta | Adet | Amba Marim | Ancharo | Bahir Dar | Combolcha | Degelo | Dejein | Gondar | Haik | Korem | Mekane Selem | Nefas Mewcha | Yejuibe | Yetemen | |
|---|---|---|---|---|---|---|---|---|---|---|---|---|---|---|---|
| Motta | 1.0 | 0.91 | 0.79 | 0.76 | 0.89 | 0.82 | 0.71 | 0.88 | 0.84 | 0.77 | 0.72 | 0.79 | 0.84 | 0.81 | 0.82 |
| Adet | 0.91 | 1.0 | 0.78 | 0.42 | 0.91 | 0.78 | 0.79 | 0.82 | 0.84 | 0.70 | 0.65 | 0.78 | 0.85 | 0.79 | 0.79 |
| Amba Marim | 0.80 | 0.78 | 1.0 | 0.90 | 0.78 | 0.92 | 0.93 | 0.83 | 0.74 | 0.88 | 0.82 | 0.87 | 0.92 | 0.68 | 0.75 |
| Ancharo | 0.76 | 0.42 | 0.90 | 1.0 | 0.73 | 0.91 | 0.89 | 0.78 | 0.66 | 0.90 | 0.82 | 0.83 | 0.83 | 0.62 | 0.71 |
| Bahir Dar | 0.89 | 0.91 | 0.78 | 0.73 | 1.0 | 0.76 | 0.70 | 0.85 | 0.88 | 0.71 | 0.69 | 0.75 | 0.85 | 0.77 | 0.81 |
| Combolcha | 0.82 | 0.78 | 0.92 | 0.91 | 0.76 | 1.0 | 0.76 | 0.82 | 0.75 | 0.89 | 0.82 | 0.81 | 0.89 | 0.67 | 0.69 |
| Degelo | 0.71 | 0.79 | 0.93 | 0.89 | 0.70 | 0.76 | 1.0 | 0.89 | 0.79 | 0.88 | 0.81 | 0.82 | 0.94 | 0.74 | 0.80 |
| Dejein | 0.88 | 0.82 | 0.83 | 0.78 | 0.85 | 0.82 | 0.89 | 1.0 | 0.86 | 0.77 | 0.71 | 0.80 | 0.80 | 0.76 | 0.80 |
| Gondar | 0.84 | 0.84 | 0.74 | 0.66 | 0.88 | 0.75 | 0.79 | 0.86 | 1.0 | 0.34 | 0.65 | 0.71 | 0.43 | 0.74 | 0.76 |
| Haik | 0.77 | 0.70 | 0.88 | 0.90 | 0.71 | 0.89 | 0.88 | 0.77 | 0.34 | 1.0 | 0.43 | 0.75 | 0.77 | 0.60 | 0.70 |
| Korem | 0.72 | 0.65 | 0.82 | 0.82 | 0.69 | 0.82 | 0.81 | 0.71 | 0.65 | 0.43 | 1.0 | 0.71 | 0.81 | 0.84 | 0.65 |
| Mekane Selem | 0.79 | 0.78 | 0.87 | 0.83 | 0.75 | 0.81 | 0.82 | 0.80 | 0.71 | 0.75 | 0.71 | 1.0 | 0.89 | 0.65 | 0.79 |
| Nefas Mewcha | 0.84 | 0.85 | 0.92 | 0.83 | 0.85 | 0.89 | 0.94 | 0.80 | 0.43 | 0.77 | 0.81 | 0.89 | 1.0 | 0.71 | 0.83 |
| Yejuibe | 0.81 | 0.79 | 0.68 | 0.62 | 0.77 | 0.67 | 0.74 | 0.76 | 0.74 | 0.60 | 0.84 | 0.65 | 0.71 | 1.0 | 0.81 |
| Yetemen | 0.82 | 0.79 | 0.75 | 0.71 | 0.81 | 0.69 | 0.80 | 0.80 | 0.76 | 0.70 | 0.65 | 0.79 | 0.83 | 0.81 | 1.0 |
| Stations | SNHT Test | Pettitt’s Test | a | ||
|---|---|---|---|---|---|
| p-Value | Risk of Rejecting Ho (%) | p-Value | Risk of Rejecting Ho (%) | ||
| Motta | 0.368 | 36.8 | 0.163 | 16.3 | 0.05 |
| Adet | 0.869 | 86.9 | 0.761 | 76.1 | 0.05 |
| Amba Marim | 0.984 | 98.4 | 0.060 | 6.00 | 0.05 |
| Ancharo | 0.946 | 94.6 | 0.280 | 28.0 | 0.05 |
| Bahir Dar | 0.749 | 74.9 | 0.220 | 22.0 | 0.05 |
| Combolcha | 0.989 | 98.9 | 0.993 | 99.3 | 0.05 |
| Degelo | 0.979 | 97.9 | 0.391 | 39.1 | 0.05 |
| Dejein | 0.908 | 90.8 | 0.089 | 8.90 | 0.05 |
| Gondar | 0.625 | 62.5 | 0.162 | 16.2 | 0.05 |
| Haik | 0.995 | 99.5 | 0.622 | 62.2 | 0.05 |
| Korem | 0.715 | 71.5 | 0.251 | 25.1 | 0.05 |
| Mekane Selem | 0.144 | 14.4 | 0.442 | 44.2 | 0.05 |
| Nefas Mewcha | 0.764 | 76.4 | 0.658 | 65.8 | 0.05 |
| Yejuibe | 0.751 | 75.1 | 0.170 | 17.0 | 0.05 |
| Yetemen | 0.069 | 6.92 | 0.186 | 18.58 | 0.05 |
| Station | MK Trend Test | a | ||
|---|---|---|---|---|
| p-Value | Kendal’s tau | Risk of Rejecting Ho (%) | ||
| Motta | 0.552 | −0.0277 | 55.18 | 0.05 |
| Adet | 0.818 | 0.0130 | 81.78 | 0.05 |
| Amba Marim | 0.74 | 0.085 | 74.00 | 0.05 |
| Ancharo | 0.050 | 0.0950 | 5.00 | 0.05 |
| Bahir Dar | 0.147 | −0.0752 | 14.68 | 0.05 |
| Combolcha | 0.256 | −0.0506 | 25.59 | 0.05 |
| Degelo | 0.551 | −0.0362 | 55.13 | 0.05 |
| Dejein | 0.865 | −0.0082 | 86.54 | 0.05 |
| Gondar | 0.779 | 0.0084 | 77.88 | 0.05 |
| Haik | 0.882 | −0.0062 | 88.21 | 0.05 |
| Korem | 0.224 | −0.0596 | 22.42 | 0.05 |
| Mekane Selem | 0.404 | −0.0473 | 40.44 | 0.05 |
| Nefas Mewcha | 0.121 | −0.0803 | 12.14 | 0.05 |
| Yejuibe | 0.172 | 0.0863 | 17.19 | 0.05 |
| Yetemen | 0.433 | 0.0293 | 43.35 | 0.05 |
| Method | Studied Errors | |||||
|---|---|---|---|---|---|---|
| MAE | RMSE | CE | S-index | SS | rPearson | |
| AA | 25.547 | 38.671 | 0.998 | 0.999 | 0.998 | 0.944 |
| NR | 22.900 | 33.695 | 0.998 | 0.999 | 0.998 | 0.945 |
| GC | 28.099 | 39.387 | 0.998 | 0.999 | 0.998 | 0.924 |
| NRGC | 25.665 | 36.104 | 0.998 | 0.999 | 0.998 | 0.937 |
| IDW | 23.709 | 35.011 | 0.998 | 0.998 | 0.998 | 0.999 |
| MIDW | 31.474 | 43.304 | 0.997 | 0.999 | 0.997 | 0.908 |
| CCW | 25.288 | 35.919 | 0.998 | 0.999 | 0.998 | 0.937 |
| LR | 35.785 | 54.130 | 0.996 | 0.999 | 0.996 | 0.875 |
| MLR | 23.181 | 35.573 | 0.998 | 0.999 | 0.998 | 0.940 |
| MI | 47.641 | 58.765 | 0.995 | 0.999 | 0.995 | 0.864 |
| NIPALS | 28.419 | 42.516 | 0.997 | 0.999 | 0.997 | 0.914 |
| UK | 33.601 | 52.756 | 0.996 | 0.998 | 0.996 | 0.884 |
| EM | 31.278 | 51.453 | 0.996 | 0.999 | 0.996 | 0.872 |
| CS | 30.424 | 49.564 | 0.996 | 0.999 | 0.996 | 0.881 |
| MCCW | 25.276 | 36.230 | 0.998 | 0.999 | 0.998 | 0.936 |
| MCCWID | 28.254 | 46.167 | 0.997 | 0.999 | 0.997 | 0.914 |
| NRID | 23.175 | 38.032 | 0.998 | 0.999 | 0.998 | 0.929 |
| ONRID | 23.689 | 37.114 | 0.998 | 0.999 | 0.998 | 0.935 |
| NRIDWCC | 23.480 | 37.397 | 0.998 | 0.999 | 0.998 | 0.934 |
| MNR | 23.983 | 35.944 | 0.998 | 0.999 | 0.998 | 0.943 |
| MNR-T | 26.958 | 37.713 | 0.998 | 0.999 | 0.998 | 0.932 |
© 2020 by the authors. Licensee MDPI, Basel, Switzerland. This article is an open access article distributed under the terms and conditions of the Creative Commons Attribution (CC BY) license (http://creativecommons.org/licenses/by/4.0/).
Share and Cite
Armanuos, A.M.; Al-Ansari, N.; Yaseen, Z.M. Cross Assessment of Twenty-One Different Methods for Missing Precipitation Data Estimation. Atmosphere 2020, 11, 389. https://doi.org/10.3390/atmos11040389
Armanuos AM, Al-Ansari N, Yaseen ZM. Cross Assessment of Twenty-One Different Methods for Missing Precipitation Data Estimation. Atmosphere. 2020; 11(4):389. https://doi.org/10.3390/atmos11040389
Chicago/Turabian StyleArmanuos, Asaad M., Nadhir Al-Ansari, and Zaher Mundher Yaseen. 2020. "Cross Assessment of Twenty-One Different Methods for Missing Precipitation Data Estimation" Atmosphere 11, no. 4: 389. https://doi.org/10.3390/atmos11040389
APA StyleArmanuos, A. M., Al-Ansari, N., & Yaseen, Z. M. (2020). Cross Assessment of Twenty-One Different Methods for Missing Precipitation Data Estimation. Atmosphere, 11(4), 389. https://doi.org/10.3390/atmos11040389


