Article

Scaling Properties and Persistence of Long-Term Solar Activity

1
Department of Physics, University of Calabria, Ponte P. Bucci 31C, 87036 Rende, Italy
2
National Institute for Astrophysics (INAF), Direzione Scientifica, 00100 Rome, Italy
3
Radboud Radio Lab, Department of Astrophysics/IMAPP—Radboud University, P.O. Box 9010, 6500 GL Nijmegen, The Netherlands
4
LESIA, Observatoire de Paris, Université PSL, CNRS, Sorbonne Université, Université de Paris, 5 Place Jules Janssen, 92195 Meudon, France
*
Author to whom correspondence should be addressed.
Atmosphere 2021, 12(6), 733; https://doi.org/10.3390/atmos12060733
Submission received: 30 April 2021 / Revised: 26 May 2021 / Accepted: 4 June 2021 / Published: 8 June 2021

Abstract

:
The long-range correlations associated with the presence of persistence are investigated by applying the detrended fluctuation analysis (DFA) on three different proxies of long-term solar activity. The considered datasets are a sunspot number reconstruction (SNR04) obtained from the atmospheric activity of the cosmogenic isotope 14 C derived from tree rings, a total solar irradiance reconstruction (TSIR12) obtained from several 10 Be ice core records from Greenland and Antarctica in combination with the global record of 14 C in tree rings and a new multi-proxy sunspot number reconstruction (SNR18), also derived from 10 Be datasets and the global 14 C production series. The DFA scaling exponents found for the three time series are similar (lying in the range between 0.70 and 0.77) and the scaling ranges are comparable. These results indicate the presence of long-range correlations with persistence, in substantial agreement with the findings of previous studies carried out on other solar activity indices and proxies.

1. Introduction

Solar activity phenomena are the manifestation of the magnetic dynamo process occurring inside the Sun. The magnetic activity of the Sun is characterised by a time variability which encompasses a wide range of scales and involves both quasi-periodic changes and irregular fluctuations. Several indices have been proposed and utilised to investigate these variations. The most commonly used ones are the indices based on the observations of sunspots, which are dark regions emerging in the lower solar atmosphere and associated with strong magnetic fields. For a long time, the Wolf sunspot number has represented the main tool to quantify the time evolution of solar activity (see, e.g., [1] and references therein). The group sunspot number dataset was produced by Hoyt and Schatten [2] to the aim of improving the quality of sunspot number time series before 1850. A revision of the international sunspot number and group sunspot number series has been released by WDC-SILSO (Royal Observatory of Belgium, Available online: http://sidc.be/silso/home (accessed on 8 May 2021) [3,4].
One of the main properties of solar activity, discovered by Schwabe in 1844 [5] from the analysis of sunspot numbers data, is its prominent quasi-periodicity with a period of about 11 years (Schwabe cycle). The existence of a long-term modulation in the sunspot number, with a mean period of about 80 years, was initially suggested by Gleissberg [6,7] and later found also in auroral records [8,9,10,11]. It is now known that this modulation, called the “Gleissberg cycle”, although strictly speaking it is not a cycle, occurs with a timescale varying in the range of 60–130 y. This has been found from analyses of both sunspot number indices (see, e.g., [12]) and solar activity proxies obtained from cosmogenic isotope records [11,13,14,15]. Thanks to the length of the covered time intervals, solar activity proxy datasets have allowed to determine also other nearly cyclic behaviours, longer than the Gleissberg cycle, namely the Suess-de Vries cycle with a period of 200–210 years (see, e.g., [14,16,17,18,19,20]) and the Halstatt cycle with a 2000–2400 year period (see, e.g., [14,16,21,22]).
In addition to the quasi-cyclic behaviour, solar activity is characterised by stochastic fluctuations. In this context, the presence of long-term correlations in the Sun’s activity indices and proxies has been investigated in several papers. The first method used to this aim has been the rescaled range ( R / S ) analysis, which allows to quantify persistence (memory) effects in time series through the determination of the Hurst exponent H. This has been done for monthly averaged sunspot numbers [23], 14 C data covering a ~8000 year interval [24], Doppler solar rotation data [25] and daily averaged intensity of optical flares [26]. The Hurst exponent values found in all these works are significantly larger than 0.5, indicating the presence of persistence in the solar activity time evolution, even though slight differences between the scaling exponents reported in different studies have been found. On the basis of an analysis of four-week binned sunspot areas performed by means of the scale of fluctuation approach, it was pointed out in Ref. [27] that due to the slow convergence to H = 0.5 related to the insufficient length of the datasets, it was not possible to achieve an unquestionable confirmation of the presence of long-term memory in solar activity. This problem was examined again more recently in Ref. [28] by applying the detrended fluctuation analysis (DFA) method, in addition to the R / S analysis, both to annual Wolf sunspot numbers obtained from observations and to two Wolf number reconstructions extracted from proxy data. The author of this work points out that the DFA method demonstrates more rapid convergence to the true value of the Hurst exponent (see, e.g., [29]) and it is more suitable to the analysis of non-stationary datasets, being able to discriminate between slow trends and long-range correlations. The results presented in [28] support the presence of significant persistence in solar activity over a wide range of timescales, from 25 to 3000 years.
In the present work, the presence of long range correlations and persistence in the Sun’s magnetic activity at long timescales (≳100 y) are investigated by using the DFA technique to analyse three different solar activity proxy datasets for which the persistence analysis has not yet been performed, to the aim of further investigating this topic.

2. Data and Methods

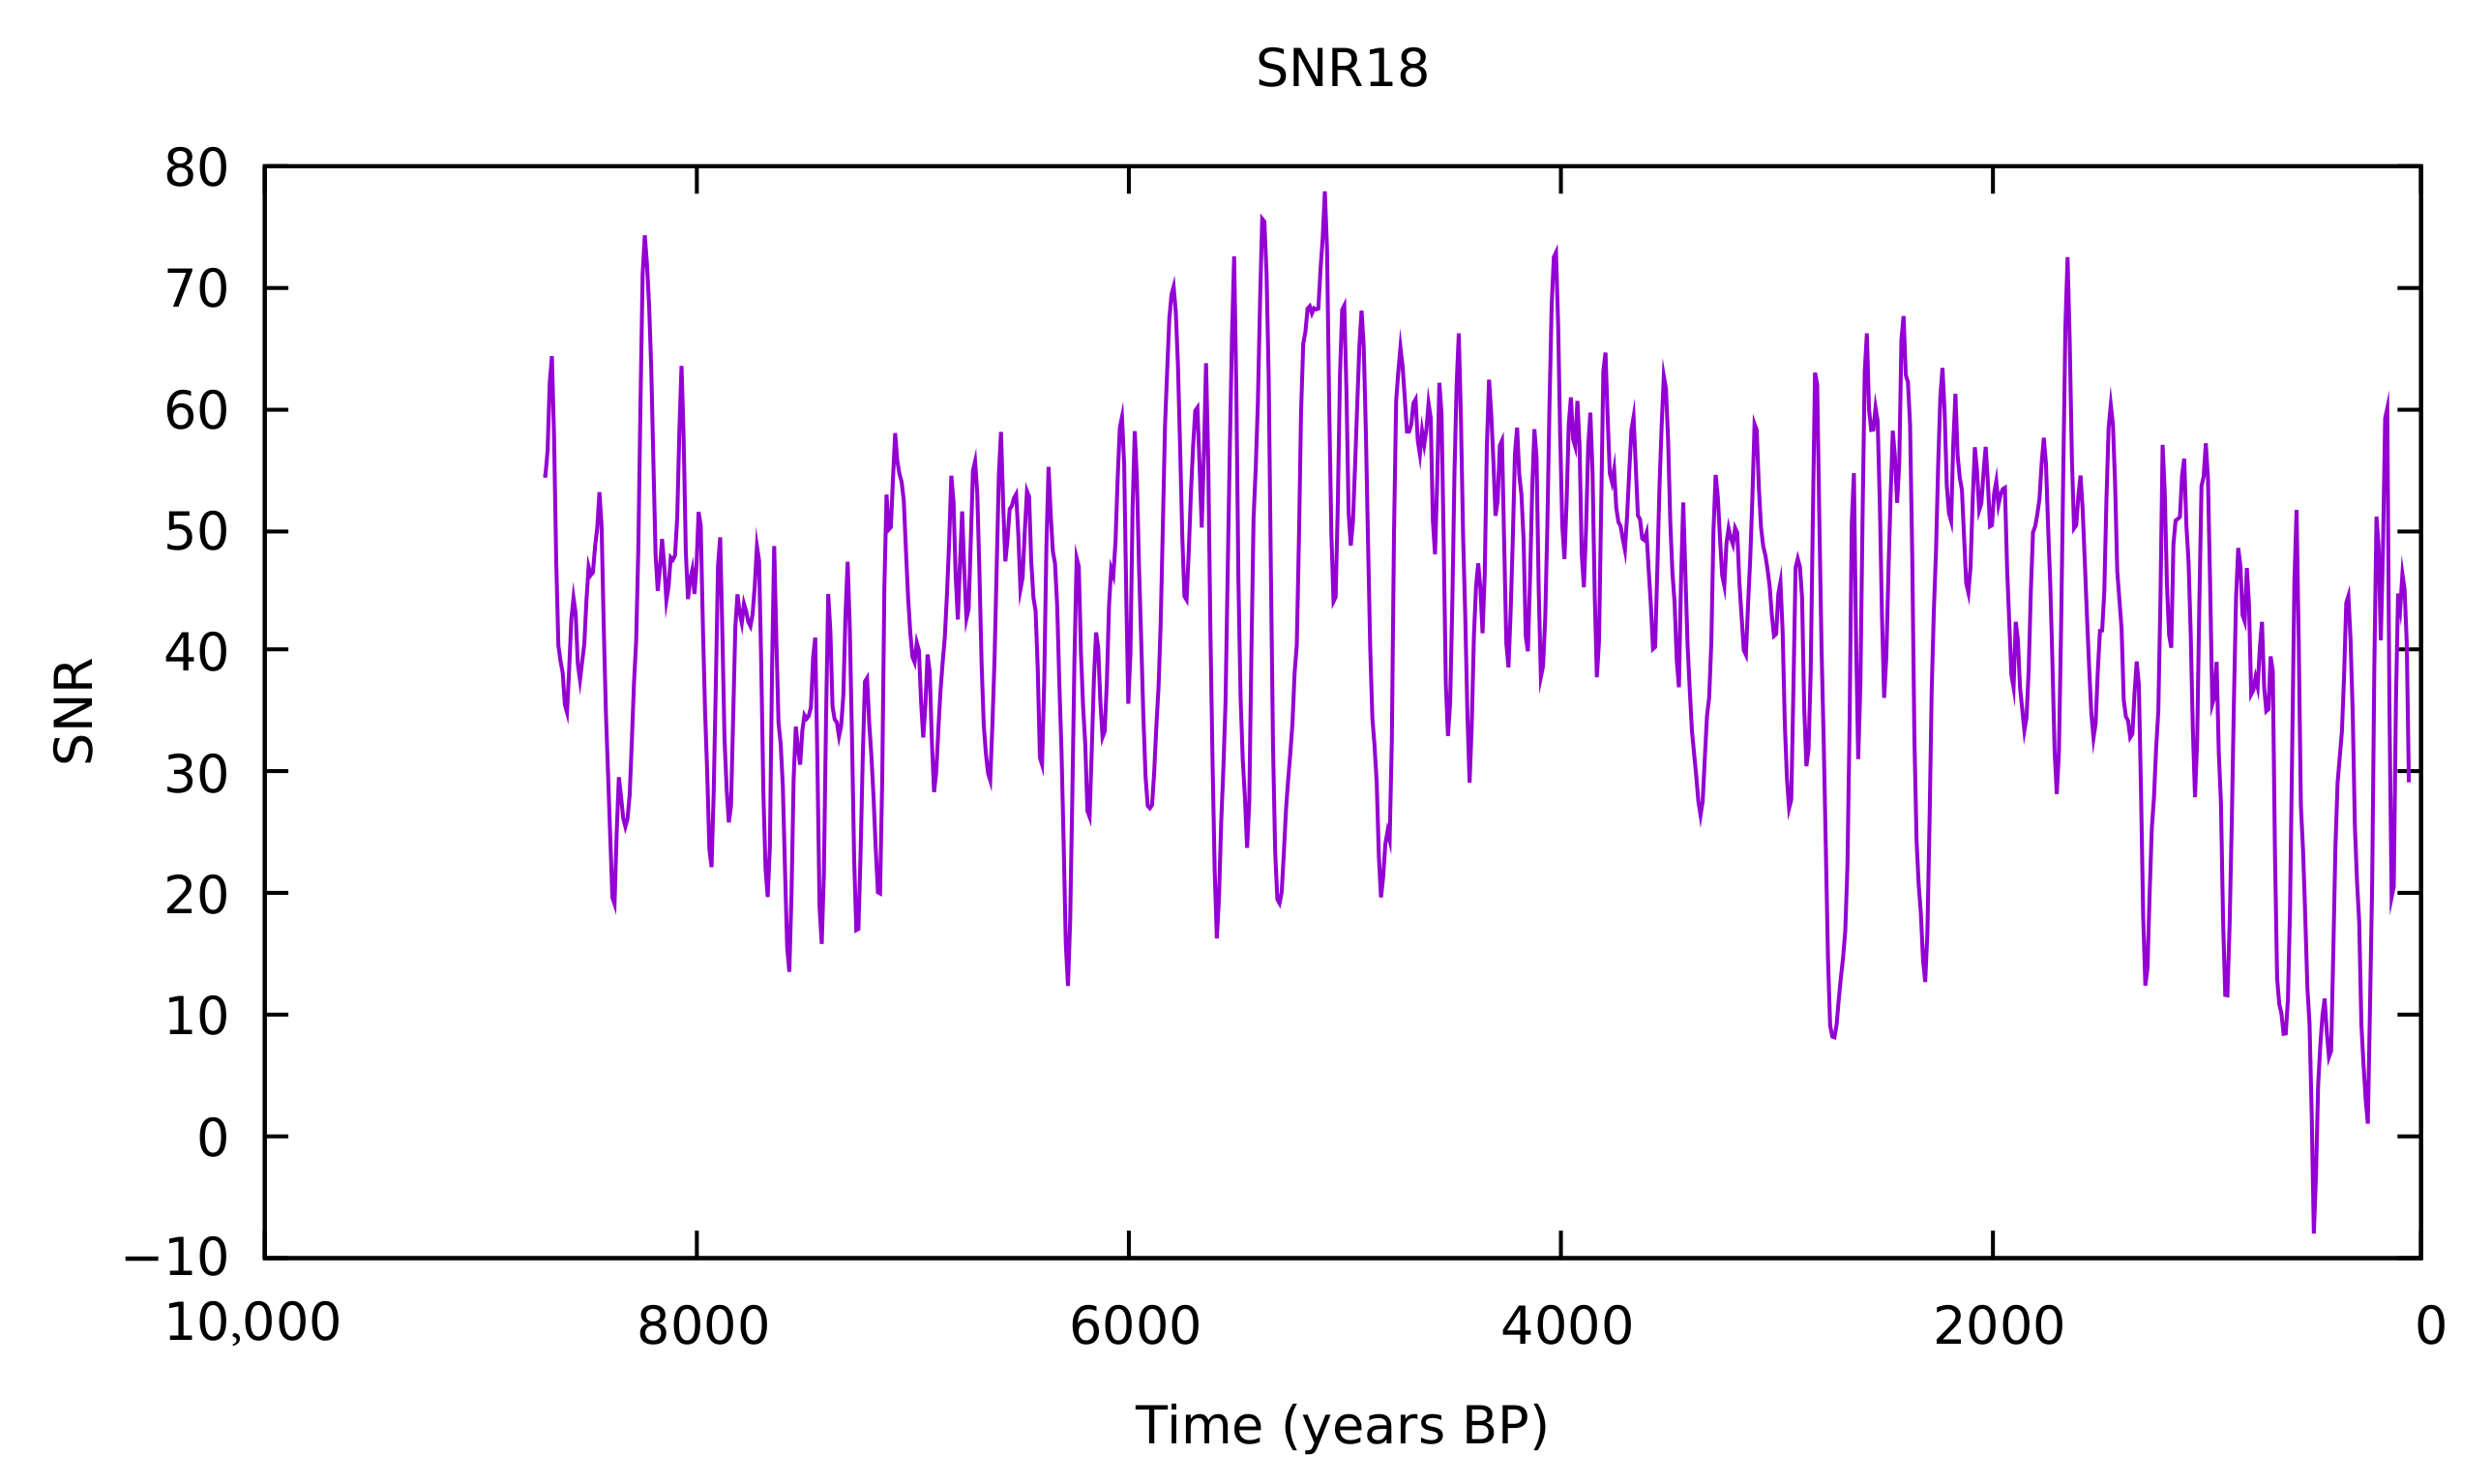
For this study, we used three proxies of the solar activity. The first dataset, which covers an interval of about 11,400 years with decadal resolution, is a sunspot number reconstruction (hereafter denoted by SNR04) obtained by Solanki et al. [30] from the atmospheric activity of the cosmogenic isotope 14 C derived from the analysis of tree rings. The second dataset, covering a time interval of about 9400 years with a 22 year resolution, is a total solar irradiance reconstruction (denoted by TSIR12) derived by Steinhilber et al. [31] from a combination, through principal component analysis, of several 10 Be ice core records from Greenland and Antarctica with the global record of 14 C in tree rings. The last dataset is a reconstruction of the sunspot number, provided by Wu et al. [32] and denoted hereafter by SNR18, spanning almost 9000 years with a 10 year resolution, and based, for the first time, on a Bayesian approach applied on six 10 Be time series of different lengths from Greenland and Antarctica, and the official global 14 C series. The three time series are shown in Figure 1.
The long-term correlations and the possible presence of persistence are investigated here by means of the DFA method, similarly to what was done in Ref. [28] on different solar activity records. The DFA method was proposed in Refs. [33,34] and it is outlined below. We denote the analysed time series by S ( i ) ( i = 1 , , N ), where N is the number of data points. First of all, the cumulative time series y ( k ) = i = 1 k [ S ( i ) S ] is calculated, where S is the time series average. The time series y ( k ) is then divided into nonoverlapping segments of length n and in each segment a fit with a polynomial of order p is performed. We denote the y values of the fitting polynomial by f n ( p ) ( k ) . The y ( k ) time series is detrended by subtracting the local trend f n ( p ) ( k ) in each segment and the root mean square fluctuation of the detrended series is calculated by
F p ( n ) = 1 N k = 1 N y ( k ) f n ( p ) ( k ) 2 .
This calculation is repeated for all segment sizes (timescales), thus providing a relation between the average fluctuation F p ( n ) and the scale n. A power law relation
F p ( n ) n α p ,
where α p is the DFA(p) exponent, indicates the presence of scaling. For a dataset in which each given value is uncorrelated from the previous ones (e.g., white noise) α p = 0.5 . On the other hand, α p 1 indicates the presence of long-range correlations. If 0.5 < α p < 1 , the time series is characterised by persistence, that is, if an increment with a given sign occurs in the signal at a certain time step, the next increment is expected to have the same sign. On the contrary, values 0 < α p < 0.5 indicate anti-persistence, that is, the increments occurring at two successive time steps are typically expected to have opposite signs.

3. Results

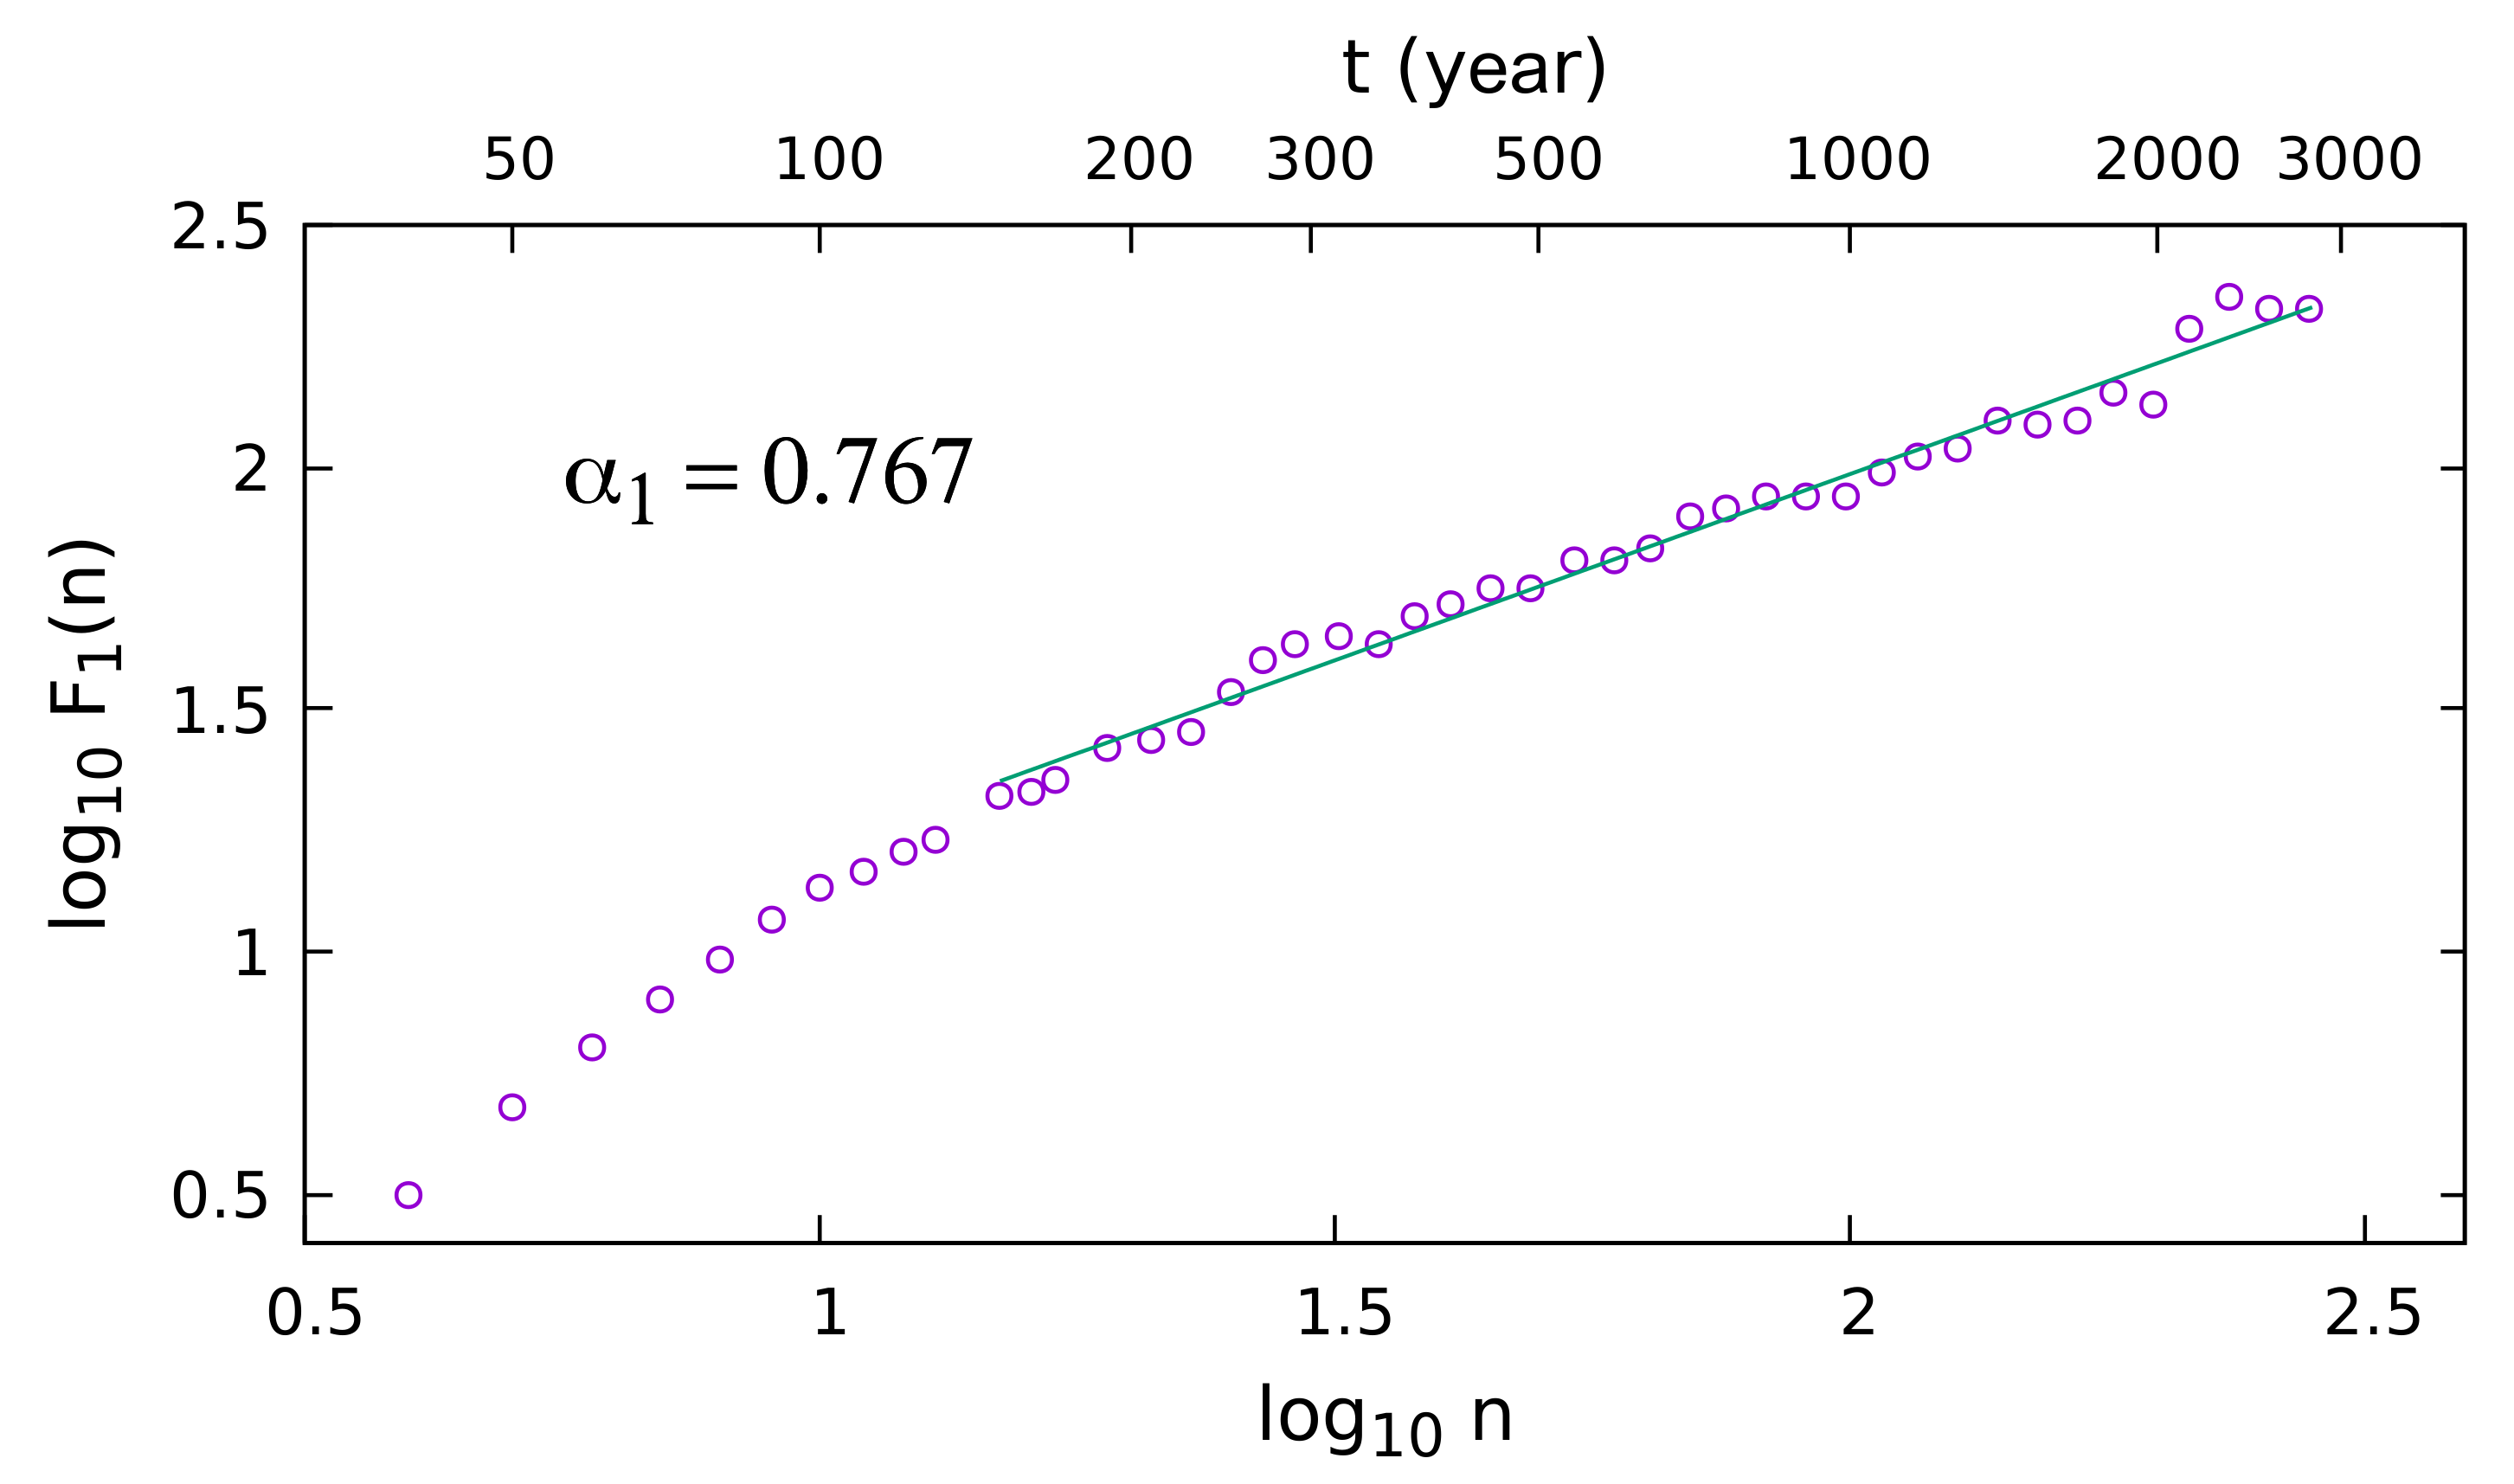
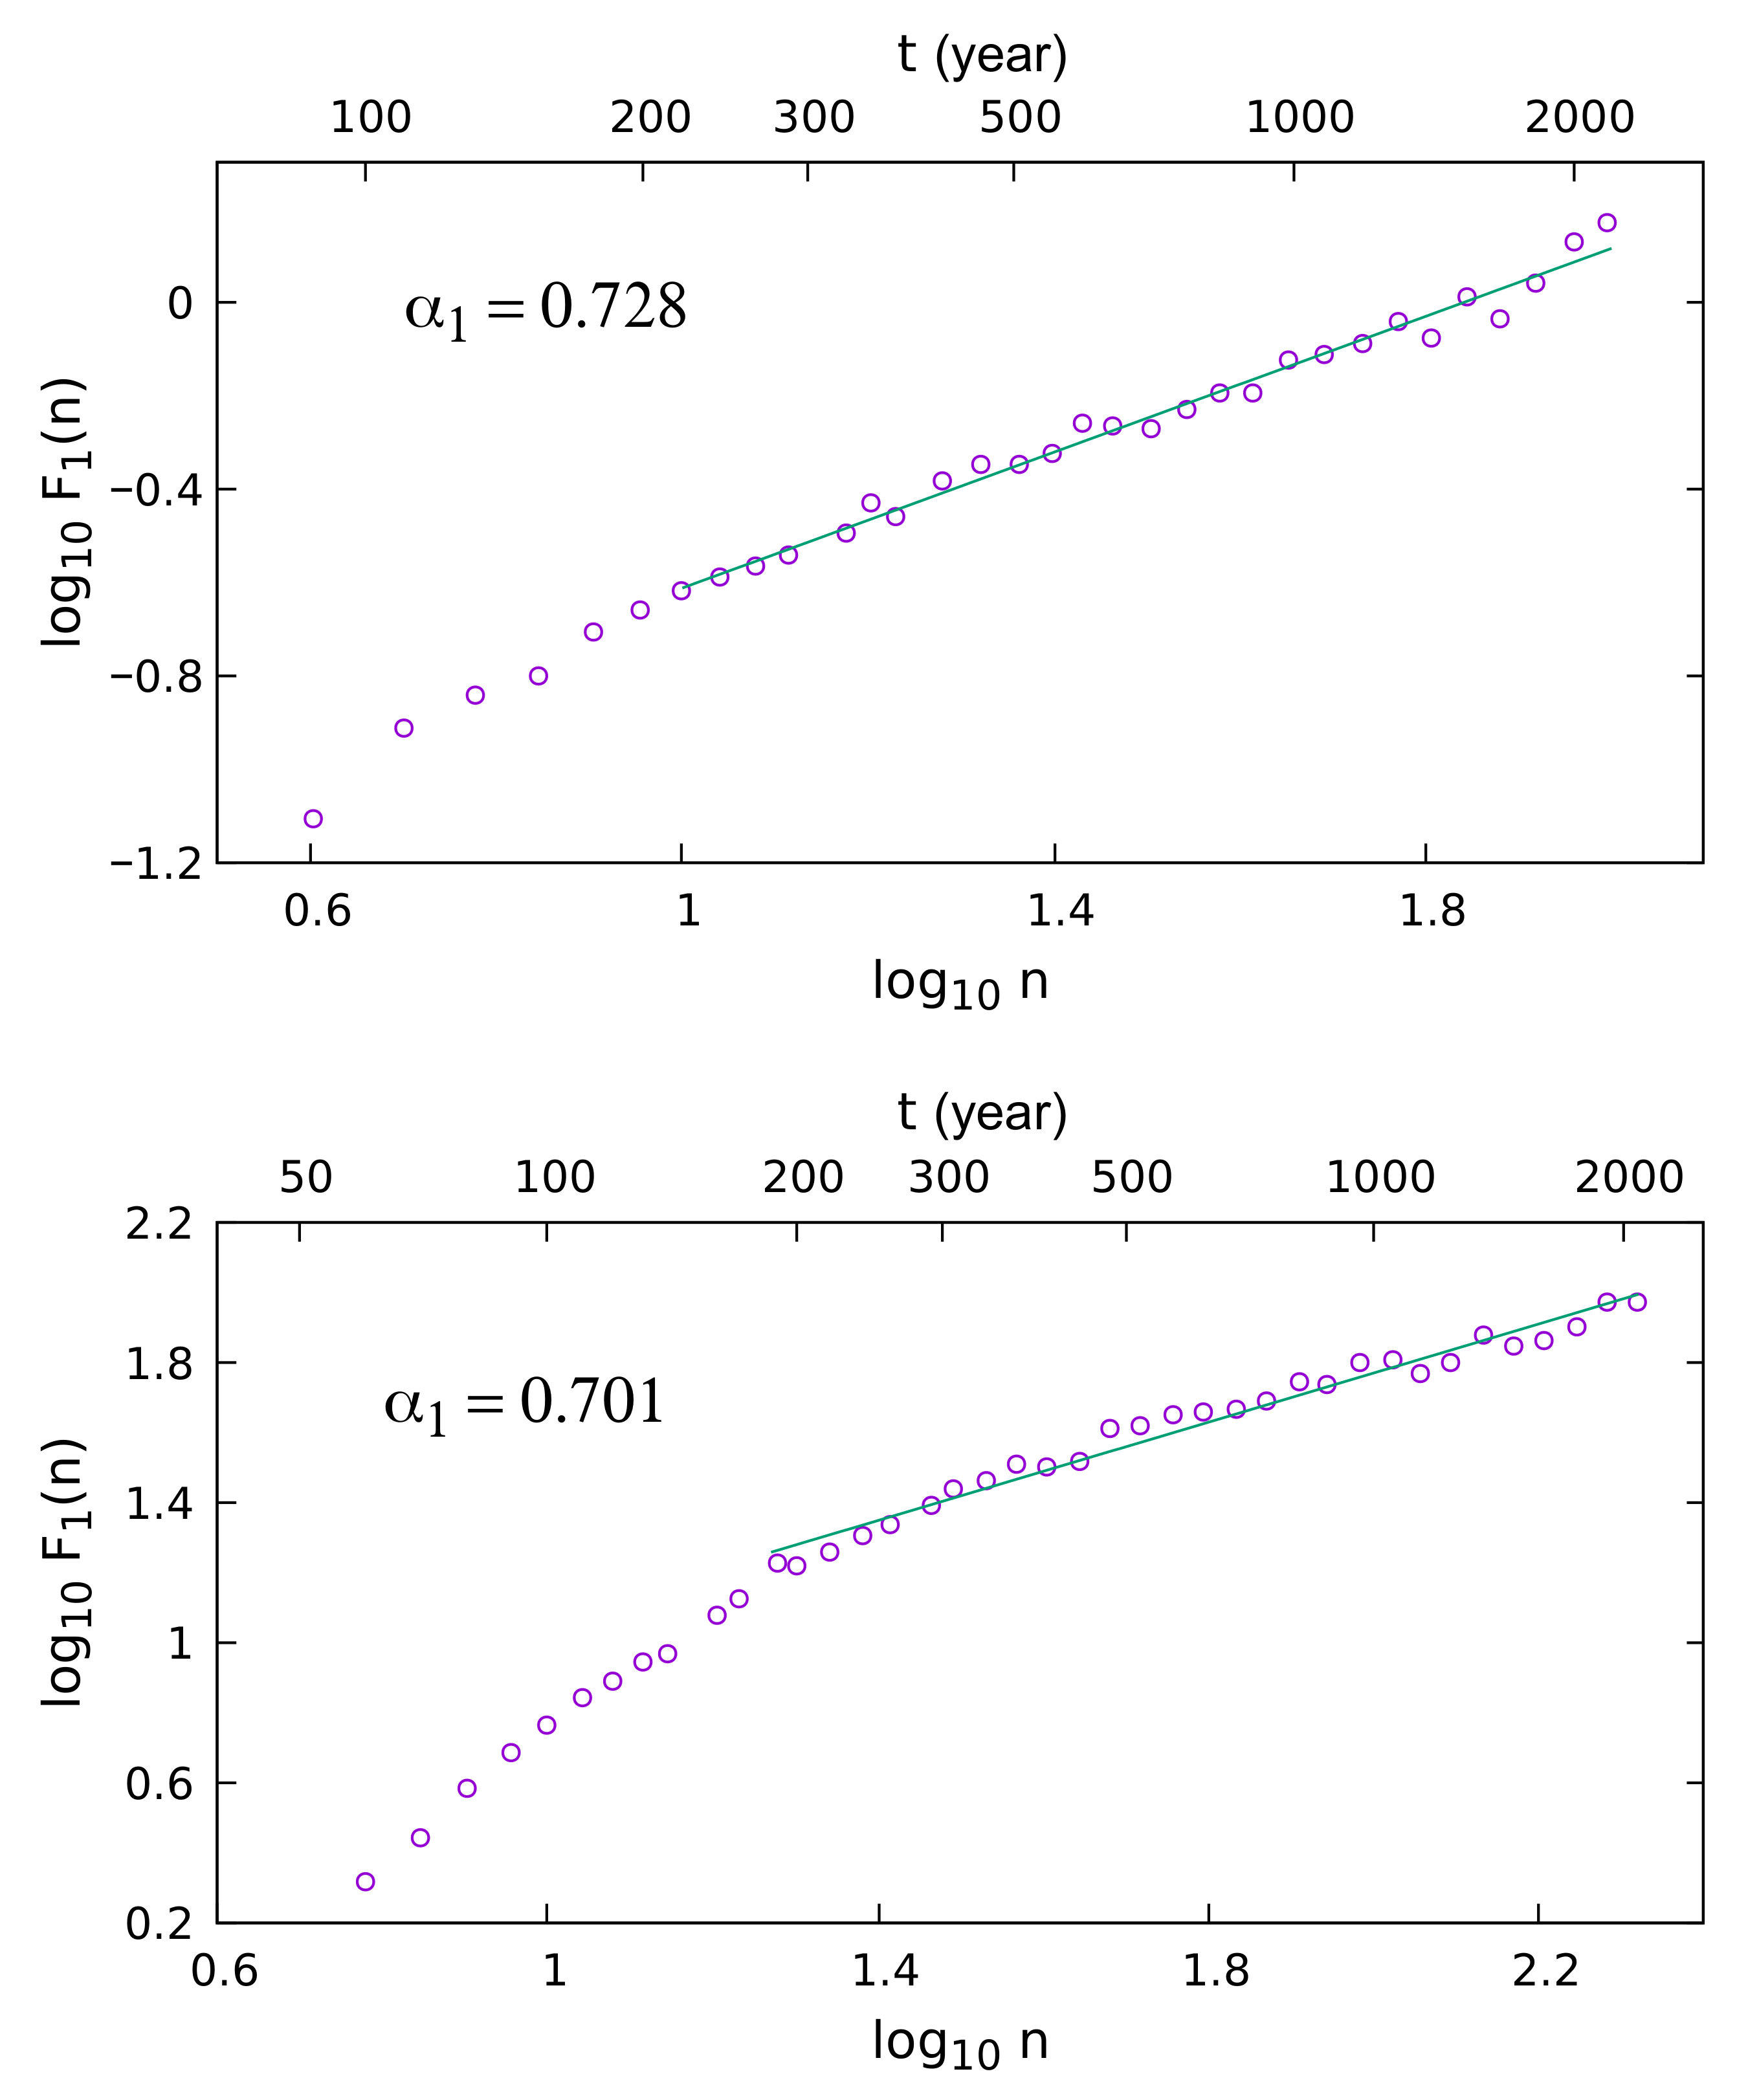
The results obtained from the application of the DFA(1) analysis on the three considered datasets are shown in Figure 2.
For the SNR04 dataset (Figure 2, upper panel), we perform a linear, least squares fit of log F 1 ( n ) as a function of log n , where the fit interval is chosen to go from n = 15 (corresponding to a timescale 150 y), which is located more or less at the start of the nearly linear region in the logarithmic plot, up to the maximum value n m a x (corresponding to 2800 y) used for the DFA of this first dataset. A DFA(1) scaling exponent α 1 = 0.767 ± 0.017 is obtained (where the uncertainty is that obtained from the fit). The robustness of the obtained result can be assessed through a suitable statistical test [29,35]. To this aim, we generated 1000 sequences by random shuffling of the original time series, applied the DFA(1) method to all of them and produced the probability distribution of the α 1 scaling exponents of the randomised sequences. From the α 1 probability distribution, we derived the confidence interval corresponding to the 95% two-tailed significance level, obtaining the interval [0.393, 0.626]. Since the scaling exponent estimated from the fit of log F 1 ( n ) of the original time series lies out of this interval, we can conclude that the presence of long-range correlations with persistence is a significant result. For the TSIR12 dataset (Figure 2, middle panel), the best linear fit of log F 1 ( n ) versus log n is performed between n = 10 (timescale interval 220 y for the 22 y resolution of this dataset) and the maximum value n m a x (corresponding to 2200 y) used for the DFA of the second dataset. The DFA(1) scaling exponent estimated for the TSIR12 time series is α 1 = 0.728 ± 0.019 . From the same statistical test used for the first dataset, the obtained 95% α 1 confidence interval of the randomised sequences is [0.335, 0.681], therefore the presence of persistence appears to be a robust result also for the second dataset. For the SNR18 dataset, the beginning of the nearly linear range used for the fit is located at n = 20 (corresponding to a 200 y timescale) and the fit is calculated, as in the previous cases, between this value and the maximum value n m a x (which corresponds to 2150 y) used for the SNR18 dataset. The DFA(1) scaling exponent found for this last dataset is α 1 = 0.701 ± 0.022 . For this last dataset, the 95% α 1 confidence interval of the randomised sequences is [0.359,0.641], and again the α 1 exponent of the original time series can be significantly attributed to the presence of persistence.

4. Discussion

The analysis of the solar activity proxies considered in the present work, carried out through the DFA method, indicates that in all the cases the time series are characterised by the presence of long range correlations with persistence. We also remark that, although the three used solar activity reconstructions were obtained from different data and by means of different procedures, the scaling exponents calculated in the different cases are close between them and that the scaling ranges are comparable ([150 y , 2800 y] for SNR04, [220 y , 2200 y] for TSIR12, and [200 y , 2150 y] for SNR18). Scaling exponents indicating the existence of memory in solar activity were already found in previous works in which different solar activity indices and proxies were analysed by means of the rescaled range analysis [23,24,25,26] and DFA [28]. The use of different datasets has allowed to highlight the occurrence of persistence at different timescales, covering the range from ≈20 days up to ≈3000 years. Therefore, there is now solid support to the idea that the irregular fluctuations of solar activity are characterised by the presence of temporal correlations over a very wide range of scales, even though slight differences between the scaling exponents reported in different studies have been found.
The question about the possible physical mechanisms giving rise to these persistent variations in solar activity still remains open. It has been suggested that this behaviour can be expected to be generated by persistent stochastic fluctuations in the dynamo process [24,36]. However, detailed studies of scaling properties and temporal correlations in solar dynamo models would be required to get a deeper understanding of this problem.

Author Contributions

Conceptualization, F.L.; methodology and formal analysis, F.L., V.C. and A.V.; writing—original draft preparation, F.L.; writing—review and editing, F.L., V.C. and A.V. All authors have read and agreed to the published version of the manuscript.

Funding

This research was partially funded by Italian MIUR-PRIN grant 2017APKP7T “Circumterrestrial Environment: Impact of Sun–Earth Interaction”.

Institutional Review Board Statement

Not applicable.

Informed Consent Statement

Not applicable.

Data Availability Statement

The sunspot number reconstruction SNR04 data were downloaded from (accessed on 2 April 2021): https://www1.ncdc.noaa.gov/pub/data/paleo/climate_forcing/solar_variability/solanki2004-ssn.txt (Solanki, S.K., et al., 2005. 11,000 Year Sunspot Number Reconstruction. IGBP PAGES/World Data Center for Paleoclimatology Data Contribution Series # 2005-015. NOAA/NGDC Paleoclimatology Program, Boulder CO, USA). The total solar irradiance reconstruction TSIR12 data were downloaded from (accessed on 2 April 2021): https://www1.ncdc.noaa.gov/pub/data/paleo/climate_forcing/solar_variability/steinhilber2012.txt. (Steinhilber, F., et al., 2012. 9400 Year Cosmogenic Isotope Data and Solar Activity Reconstruction. IGBP PAGES/World Data Center for Paleoclimatology Data Contribution Series # 2012-040. NOAA/NCDC Paleoclimatology Program, Boulder CO, USA). The sunspot number reconstruction SNR18 data were downloaded from (accessed on 8 May 2021): http://www2.mps.mpg.de/projects/sun-climate/data/SATIRE-M_wu18_tsi.txt.

Conflicts of Interest

The authors declare no conflict of interest.

Abbreviations

The following abbreviations are used in this manuscript:
DFADetrended fluctuation analysis
SNRSunspot number reconstruction
TSIRTotal solar irradiance reconstruction

References

  1. Hathaway, D.H. The Solar Cycle. Living Rev. Sol. Phys. 2015, 12, 4. [Google Scholar] [CrossRef] [PubMed]
  2. Hoyt, D.V.; Schatten, K.H. Group Sunspot Numbers: A New Solar Activity Reconstruction. Sol. Phys. 1998, 181, 491–512. [Google Scholar] [CrossRef]
  3. Clette, F.; Svalgaard, L.; Vaquero, J.M.; Cliver, E.W. Revisiting the Sunspot Number. A 400-Year Perspective on the Solar Cycle. Space Sci. Rev. 2014, 186, 35–103. [Google Scholar] [CrossRef] [Green Version]
  4. Petrovay, K. Solar cycle prediction. Living Rev. Sol. Phys. 2020, 17, 2. [Google Scholar] [CrossRef] [Green Version]
  5. Schwabe, H. Sonnenbeobachtungen im Jahre 1843. Von Herrn Hofrath Schwabe in Dessau. Astron. Nachr. 1844, 21, 233. [Google Scholar] [CrossRef]
  6. Gleissberg, W. Über die scheinbare Verteilung der Sonnenflecke. Astron. Nachr. 1939, 268, 81. [Google Scholar] [CrossRef]
  7. Gleissberg, W. The eighty-year sunspot cycle. J. Br. Astron. Assoc. 1958, 68, 148–152. [Google Scholar]
  8. Schove, D.J. The Sunspot Cycle, 649 BC to AD. 2000. J. Geophys. Res. 1955, 60, 127–146. [Google Scholar] [CrossRef] [Green Version]
  9. Link, F. Variations á longues périodes de l’activité solaire avant le 17ème siècle. Bull. Astron. Inst. Czechoslov. 1963, 14, 226. [Google Scholar]
  10. Feynman, J.; Fougere, P.F. Eighty-eight year periodicity in solar-terrestrial phenomena confirmed. J. Geophys. Res. 1984, 89, 3023–3027. [Google Scholar] [CrossRef] [Green Version]
  11. Attolini, M.R.; Cecchini, S.; Nanni, T.; Galli, M. On the persistence of the 22 Y solar cycle. Sol. Phys. 1990, 125, 389–398. [Google Scholar] [CrossRef]
  12. Frick, P.; Galyagin, D.; Hoyt, D.V.; Nesme-Ribes, E.; Schatten, K.H.; Sokoloff, D.; Zakharov, V. Wavelet analysis of solar activity recorded by sunspot groups. Astron. Astrophys. 1997, 328, 670–681. [Google Scholar]
  13. Ogurtsov, M.G.; Nagovitsyn, Y.A.; Kocharov, G.E.; Jungner, H. Long-Period Cycles of the Sun’s Activity Recorded in Direct Solar Data and Proxies. Sol. Phys. 2002, 211, 371–394. [Google Scholar] [CrossRef]
  14. Peristykh, A.N.; Damon, P.E. Persistence of the Gleissberg 88-year solar cycle over the last 12,000 years: Evidence from cosmogenic isotopes. J. Geophys. Res. Space Phys. 2003, 108, 1003. [Google Scholar] [CrossRef] [Green Version]
  15. Vecchio, A.; Lepreti, F.; Laurenza, M.; Alberti, T.; Carbone, V. Connection between solar activity cycles and grand minima generation. Astron. Astrophys. 2017, 599, A58. [Google Scholar] [CrossRef] [Green Version]
  16. Suess, H.E. The Radiocarbon Record in Tree Rings of the Last 8000 Years. Radiocarbon 1980, 22, 200–209. [Google Scholar] [CrossRef] [Green Version]
  17. Sonett, C.P. Very long solar periods and the radiocarbon record. Rev. Geophys. Space Phys. 1984, 22, 239–254. [Google Scholar] [CrossRef]
  18. Sonett, C.P.; Finney, S.A. The Spectrum of Radiocarbon. Philos. Trans. R. Soc. Lond. Ser. A 1990, 330, 413–425. [Google Scholar] [CrossRef]
  19. Stuiver, M.; Braziunas, T. Sun, ocean, climate and atmospheric 14CO2: An evaluation of casual and spectral relationships. Holocene 1993, 3, 289–305. [Google Scholar] [CrossRef]
  20. Usoskin, I.G.; Mursula, K.; Solanki, S.; Schüssler, M.; Alanko, K. Reconstruction of solar activity for the last millennium using 10Be data. Astron. Astrophys 2004, 413, 745–751. [Google Scholar] [CrossRef] [Green Version]
  21. Damon, P.E.; Sonett, C.P. Solar and terrestrial components of the atmospheric C-14 variation spectrum. In The Sun in Time; Sonett, C.P., Giampapa, M.S., Matthews, M.S., Eds.; University of Arizona Press: Tucson, AZ, USA, 1991; pp. 360–388. [Google Scholar]
  22. Vasiliev, S.S.; Dergachev, V.A. The ~2400-year cycle in atmospheric radiocarbon concentration: Bispectrum of 14C data over the last 8000 years. Ann. Geophys. 2002, 20, 115–120. [Google Scholar] [CrossRef] [Green Version]
  23. Mandelbrot, B.B.; Wallis, J.R. Some Long-Run Properties of Geophysical Records. Water Resour. Res. 1969, 5, 321–340. [Google Scholar] [CrossRef] [Green Version]
  24. Ruzmaikin, A.; Feynman, J.; Robinson, P. Long-term persistence of solar activity. Sol. Phys. 1994, 149, 395–403. [Google Scholar] [CrossRef] [Green Version]
  25. Komm, R.W. Hurst Analysis of Mt. Wilson Rotation Measurements. Sol. Phys. 1995, 156, 17–28. [Google Scholar] [CrossRef]
  26. Lepreti, F.; Fanello, P.C.; Zaccaro, F.; Carbone, V. Persistence of solar activity on small scales: Hurst analysis of time series coming from Hα flares. Sol. Phys. 2000, 197, 149–156. [Google Scholar] [CrossRef]
  27. Oliver, R.; Ballester, J.L. Is there memory in solar activity? Phys. Rev. E 1998, 58, 5650–5654. [Google Scholar] [CrossRef]
  28. Ogurtsov, M.G. New Evidence for Long-Term Persistence in the Sun’s Activity. Sol. Phys. 2004, 220, 93–105. [Google Scholar] [CrossRef]
  29. Weron, R. Estimating long-range dependence: Finite sample properties and confidence intervals. Phys. A Stat. Mech. Appl. 2002, 312, 285–299. [Google Scholar] [CrossRef] [Green Version]
  30. Solanki, S.K.; Usoskin, I.G.; Kromer, B.; Schüssler, M.; Beer, J. Unusual activity of the Sun during recent decades compared to the previous 11,000 years. Nature 2004, 431, 1084–1087. [Google Scholar] [CrossRef] [Green Version]
  31. Steinhilber, F.; Abreu, J.A.; Beer, J.; Brunner, I.; Christl, M.; Fischer, H.; Heikkila, U.; Kubik, P.W.; Mann, M.; McCracken, K.G.; et al. 9,400 years of cosmic radiation and solar activity from ice cores and tree rings. Proc. Natl. Acad. Sci. USA 2012, 109, 5967–5971. [Google Scholar] [CrossRef] [Green Version]
  32. Wu, C.J.; Usoskin, I.G.; Krivova, N.; Kovaltsov, G.A.; Baroni, M.; Bard, E.; Solanki, S.K. Solar activity over nine millennia: A consistent multi-proxy reconstruction. Astron. Astrophys. 2018, 615, A93. [Google Scholar] [CrossRef] [Green Version]
  33. Peng, C.K.; Buldyrev, S.V.; Havlin, S.; Simons, M.; Stanley, H.E.; Goldberger, A.L. Mosaic organization of DNA nucleotides. Phys. Rev. E 1994, 49, 1685–1689. [Google Scholar] [CrossRef] [PubMed] [Green Version]
  34. Peng, C.K.; Havlin, S.; Stanley, H.E.; Goldberger, A.L. Quantification of scaling exponents and crossover phenomena in nonstationary heartbeat time series. Chaos 1995, 5, 82–87. [Google Scholar] [CrossRef]
  35. Kristoufek, L. Rescaled Range Analysis and Detrended Fluctuation Analysis: Finite Sample Properties and Confidence Intervals. Czech Econ. Rev. 2010, 4, 236–250. [Google Scholar]
  36. Pontieri, A.; Lepreti, F.; Sorriso-Valvo, L.; Vecchio, A.; Carbone, V. A Simple Model for the Solar Cycle. Sol. Phys. 2003, 213, 195–201. [Google Scholar] [CrossRef]
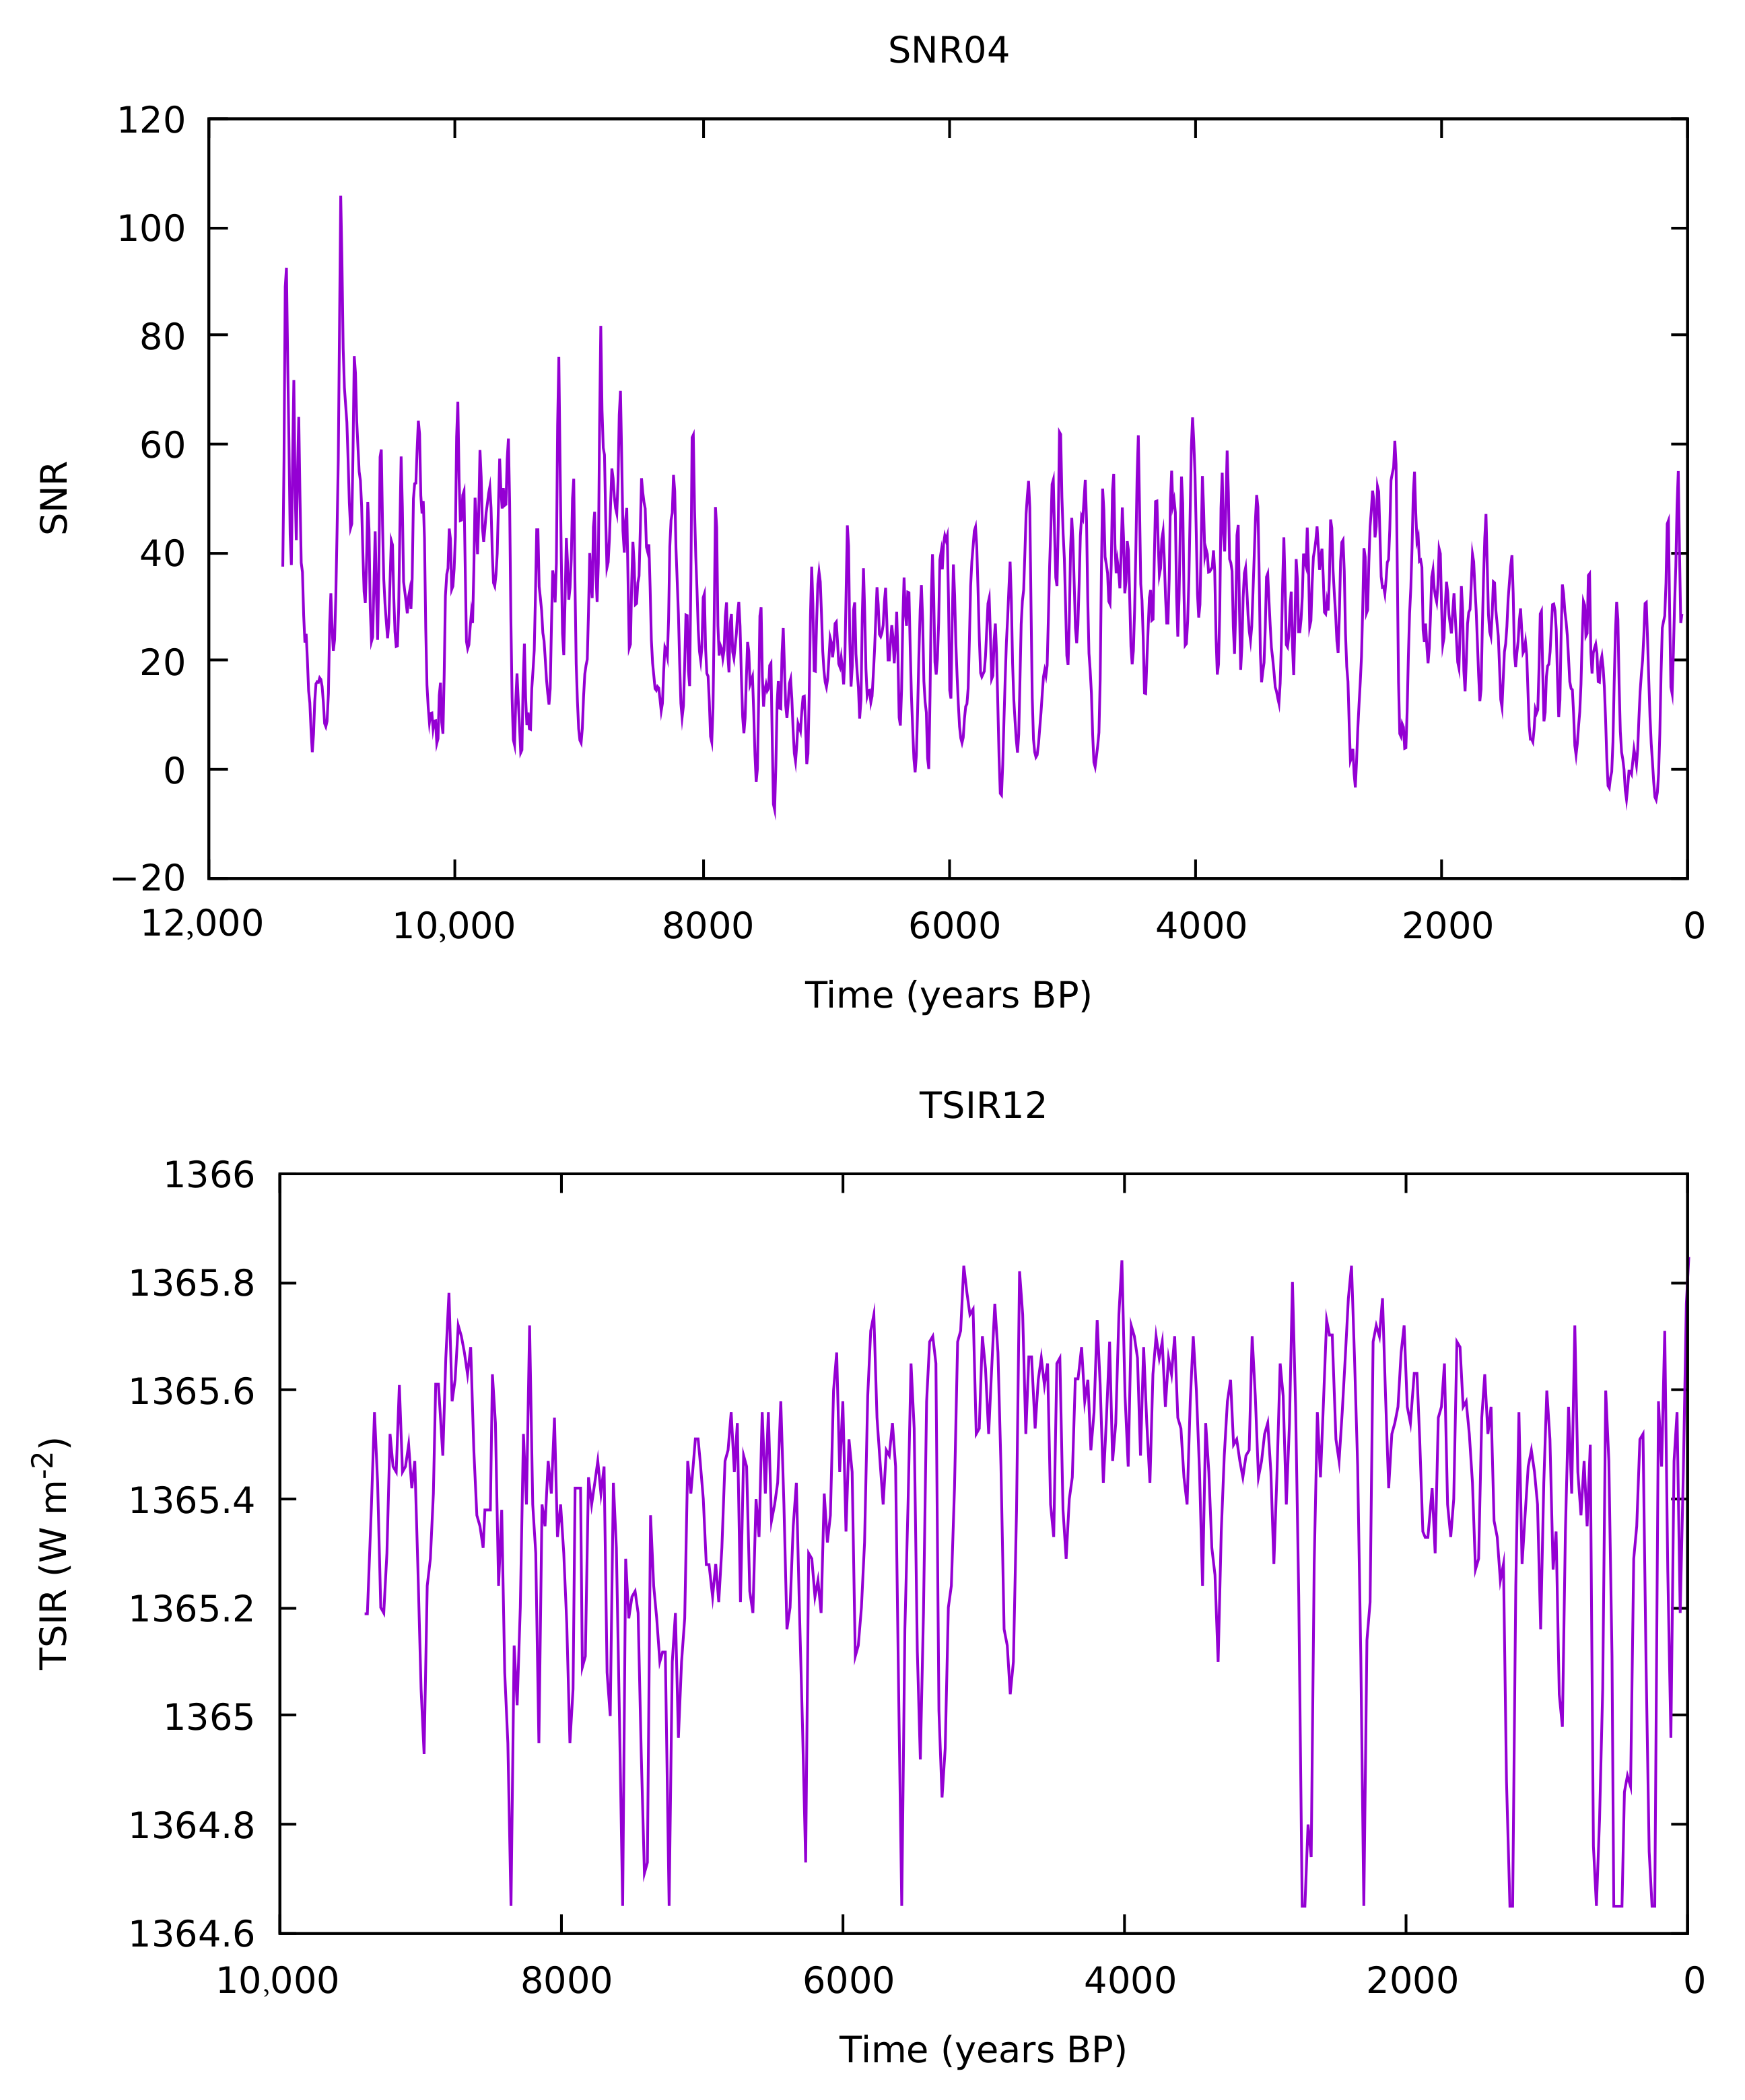
Figure 1. (Top panel) Sunspot number reconstruction (SNR04), reprinted from Solanki et al. [30] from dendrochronologically dated radiocarbon concentrations in tree rings. (Middle panel) Total solar irradiance reconstruction (TSIR12), reprinted from Steinhilber et al. [31] from a combination of several 10 Be ice core records from Greenland and Antarctica with the global record of 14 C in tree rings. (Bottom panel) Sunspot number reconstruction (SNR18), reprinted from Wu et al. [32] using a Bayesian approach applied on six 10 Be time series from Greenland and Antarctica, and the global 14 C series. For all the plots, time is given as years before present (BP), where present refers to 1950 AD.
Atmosphere 12 00733 g001aAtmosphere 12 00733 g001b
Figure 2. (Top panel) log F 1 ( n ) (circles) versus log n calculated through the DFA(1) method applied to the sunspot number reconstruction (SNR04), reprinted from Solanki et al. [30]. The green solid line represents a linear least squares fit with slope α 1 = 0.767 . (Middle panel) log F 1 ( n ) (circles) versus log n calculated through from the DFA(1) method applied to the total solar irradiance reconstruction (TSIR12), reprinted from Steinhilber et al. [31]. The green solid line represents a linear least squares fit with slope α 1 = 0.728 . (Bottom panel) log F 1 ( n ) (circles) versus log n calculated through the DFA(1) method applied to the sunspot number reconstruction (SNR18), reprinted from Wu et al. [32]. The green solid line represents a linear least squares fit with slope α 1 = 0.701 . In all the plots, the timescale t in years is reported on the upper x-axis for clarity.
Atmosphere 12 00733 g002aAtmosphere 12 00733 g002b
Publisher’s Note: MDPI stays neutral with regard to jurisdictional claims in published maps and institutional affiliations.