
Exploring Recent (1991–2020) Trends of Essential Climate Variables in Greece


 ,
,  ,
,  and
and 
Abstract
:1. Introduction
2. Materials and Methods
3. Results and Discussion
3.1. Temperature and Frost Days Trend
- (a)
- In all three decades, the trend is increasing, with no significant differences in the increasing trend;
- (b)
- After the year 2012, all subsequent years show a mean temperature over Greece that is greater than the 30-year average (14.1 °C);
- (c)
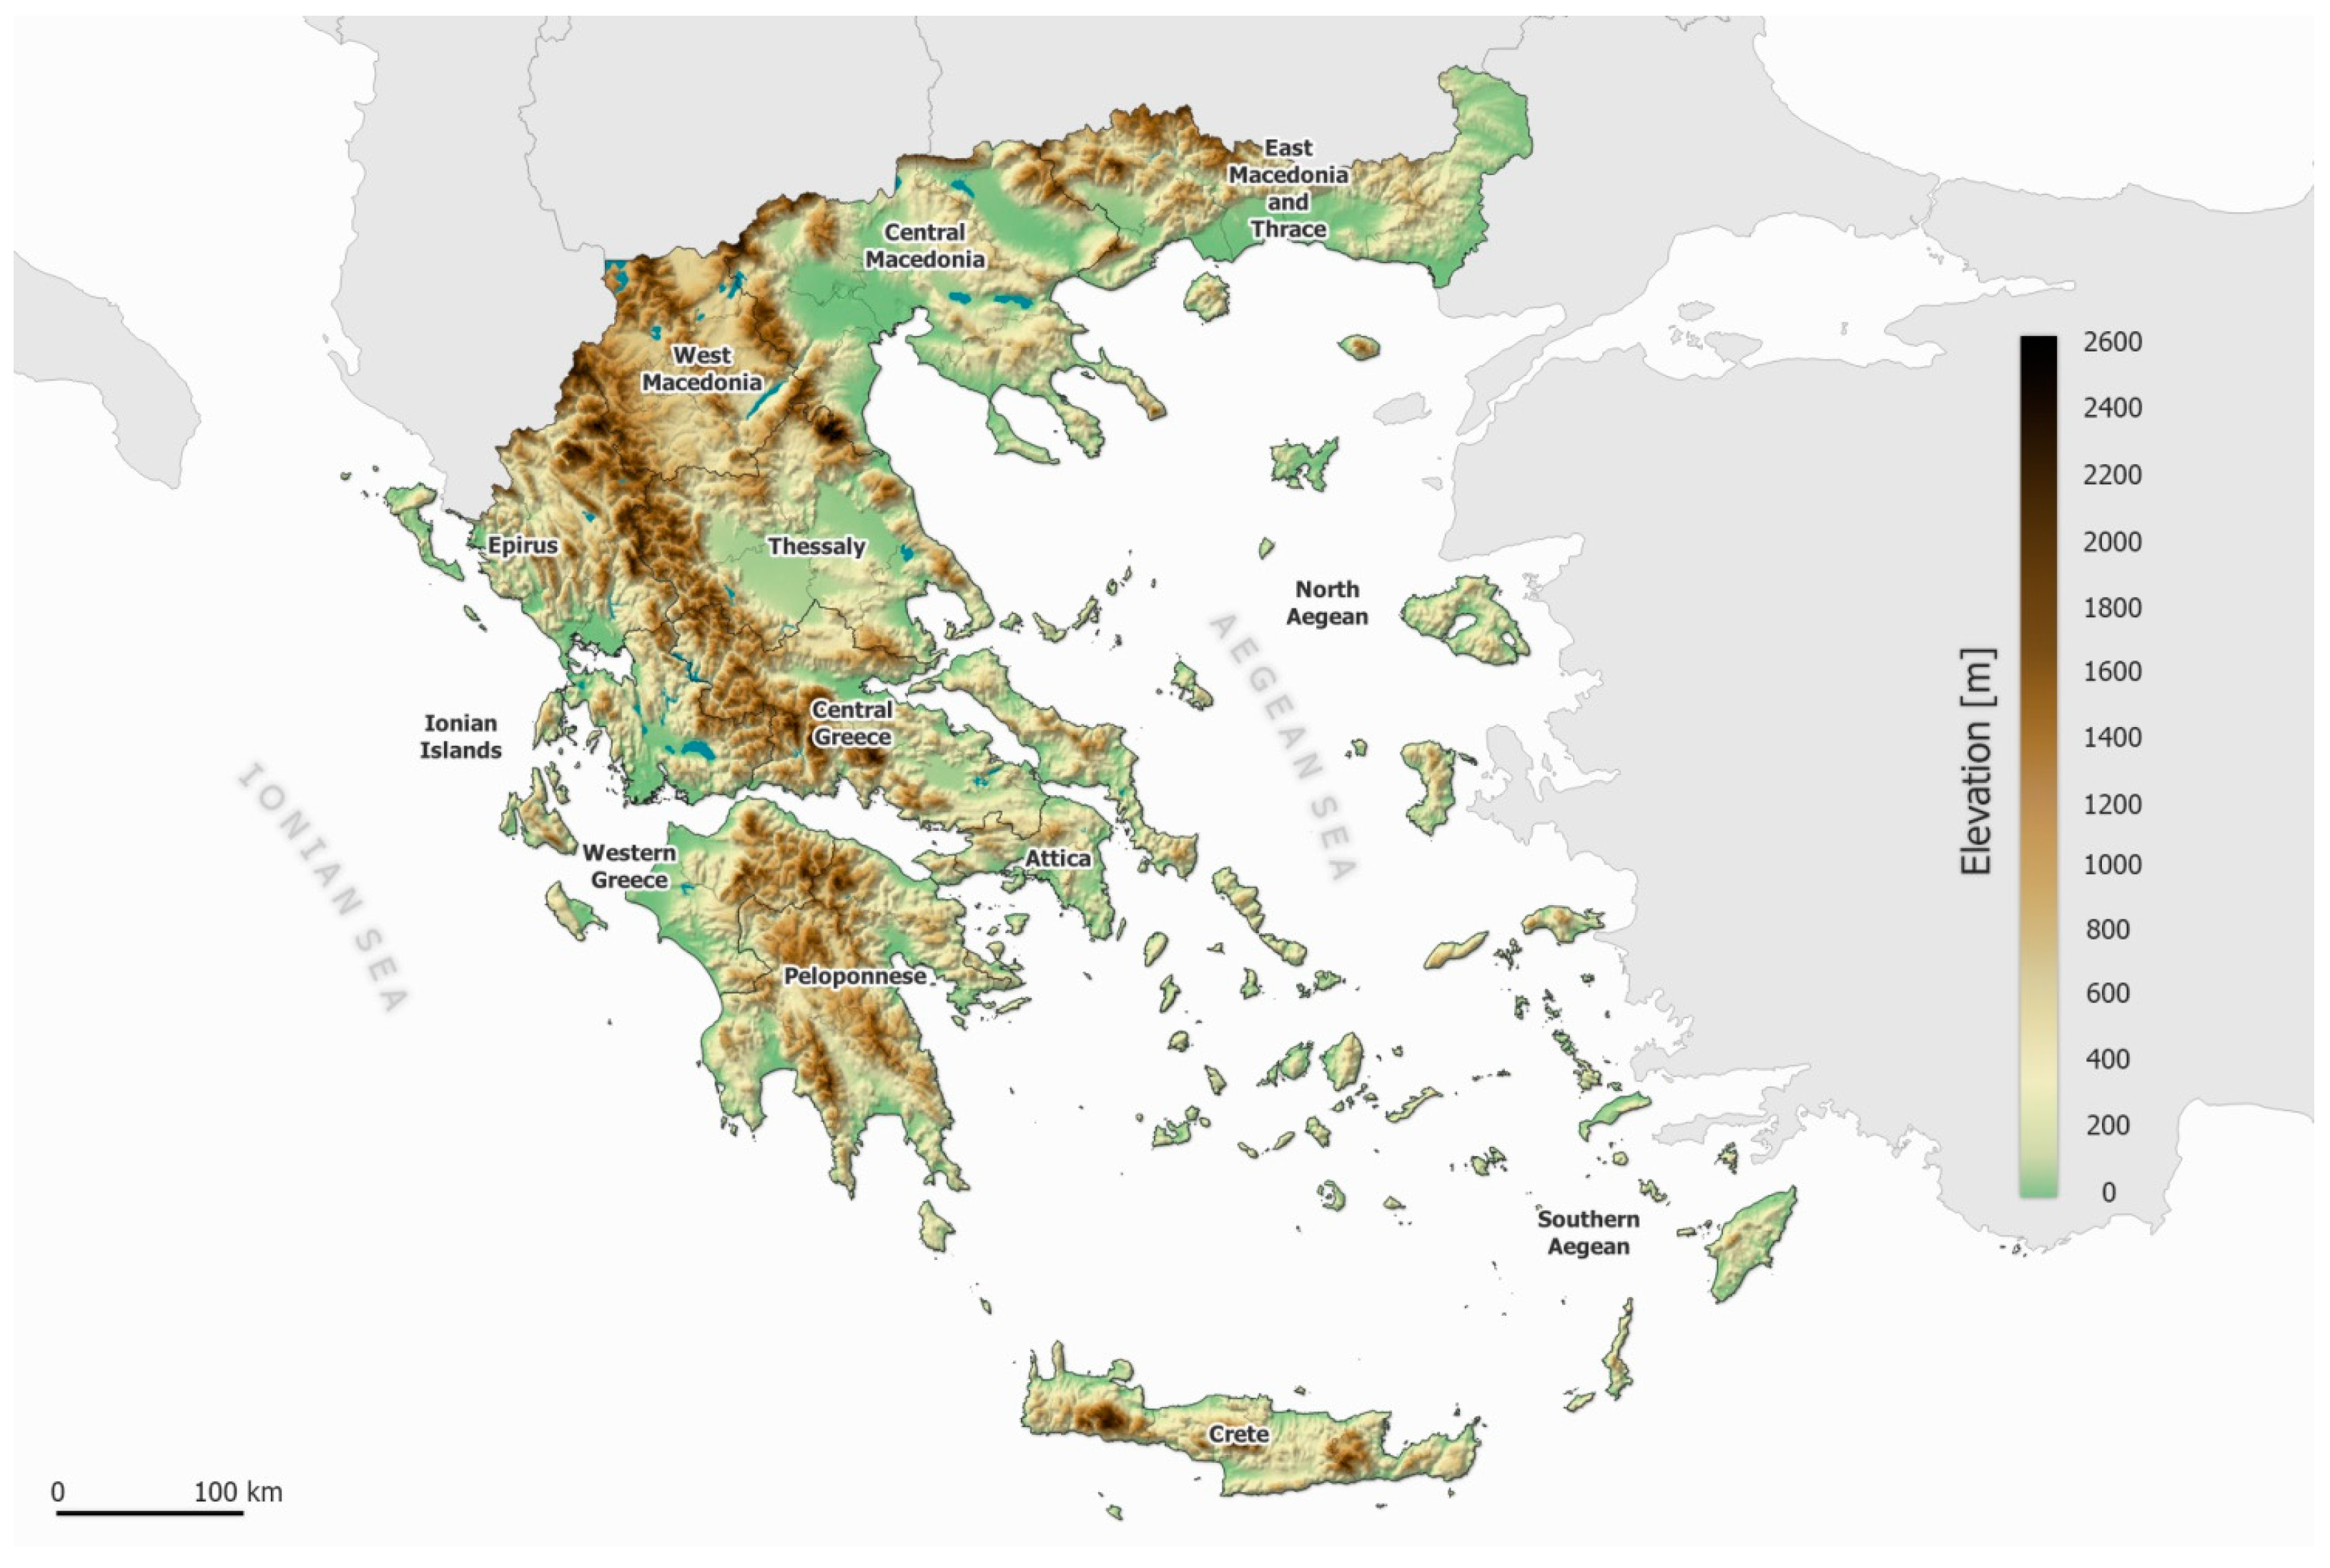
- The geographical distribution of temperature deviation from the 30-year average value shows, as expected, a relatively cold first decade (1991–2000), with deviations up to −0.8 °C (mainly over continental Greece), while the last decade (2011–2020) is warmer than the 30-year average value, reaching up to +1 °C in the northwestern part of Greece.
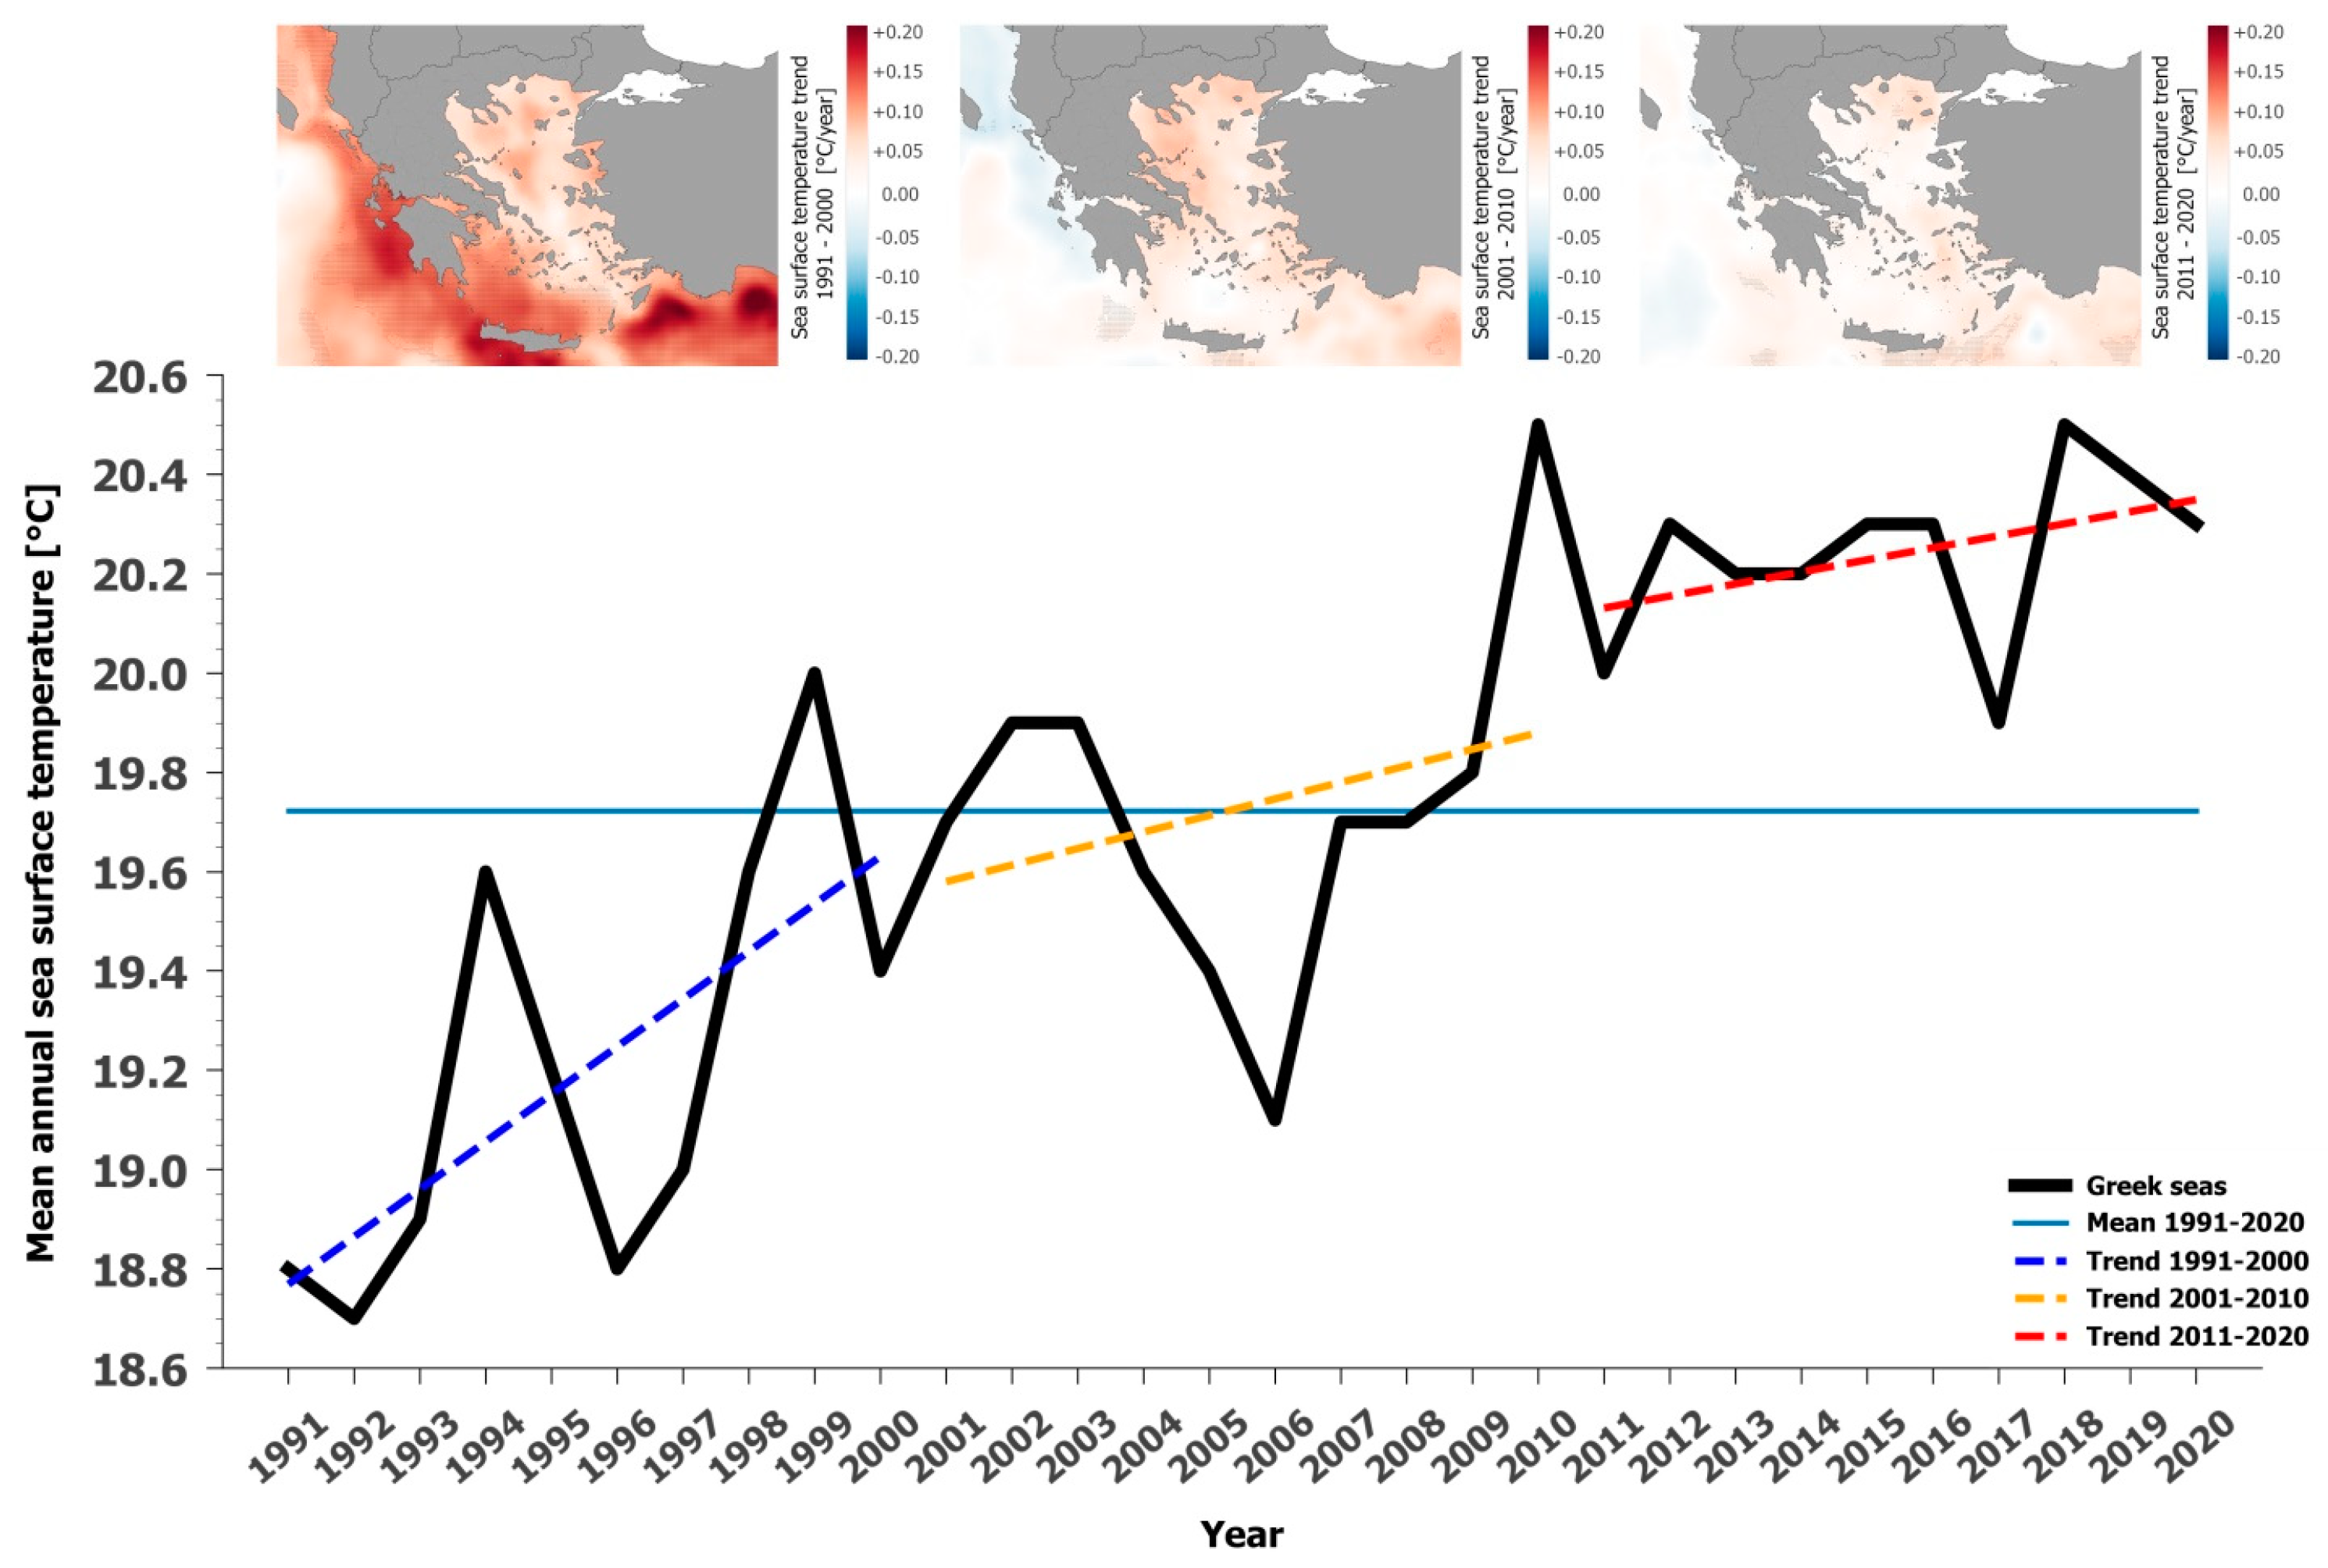
3.2. Sea Surface Temperature
- (a)
- In all three decades, the trend is increasing, with a larger increasing trend during the decade 1991–2000;
- (b)
- After the year 2009, all subsequent years show a mean sea surface temperature over the Greek seas that is greater than the 30-year average (19.7 °C);
- (c)
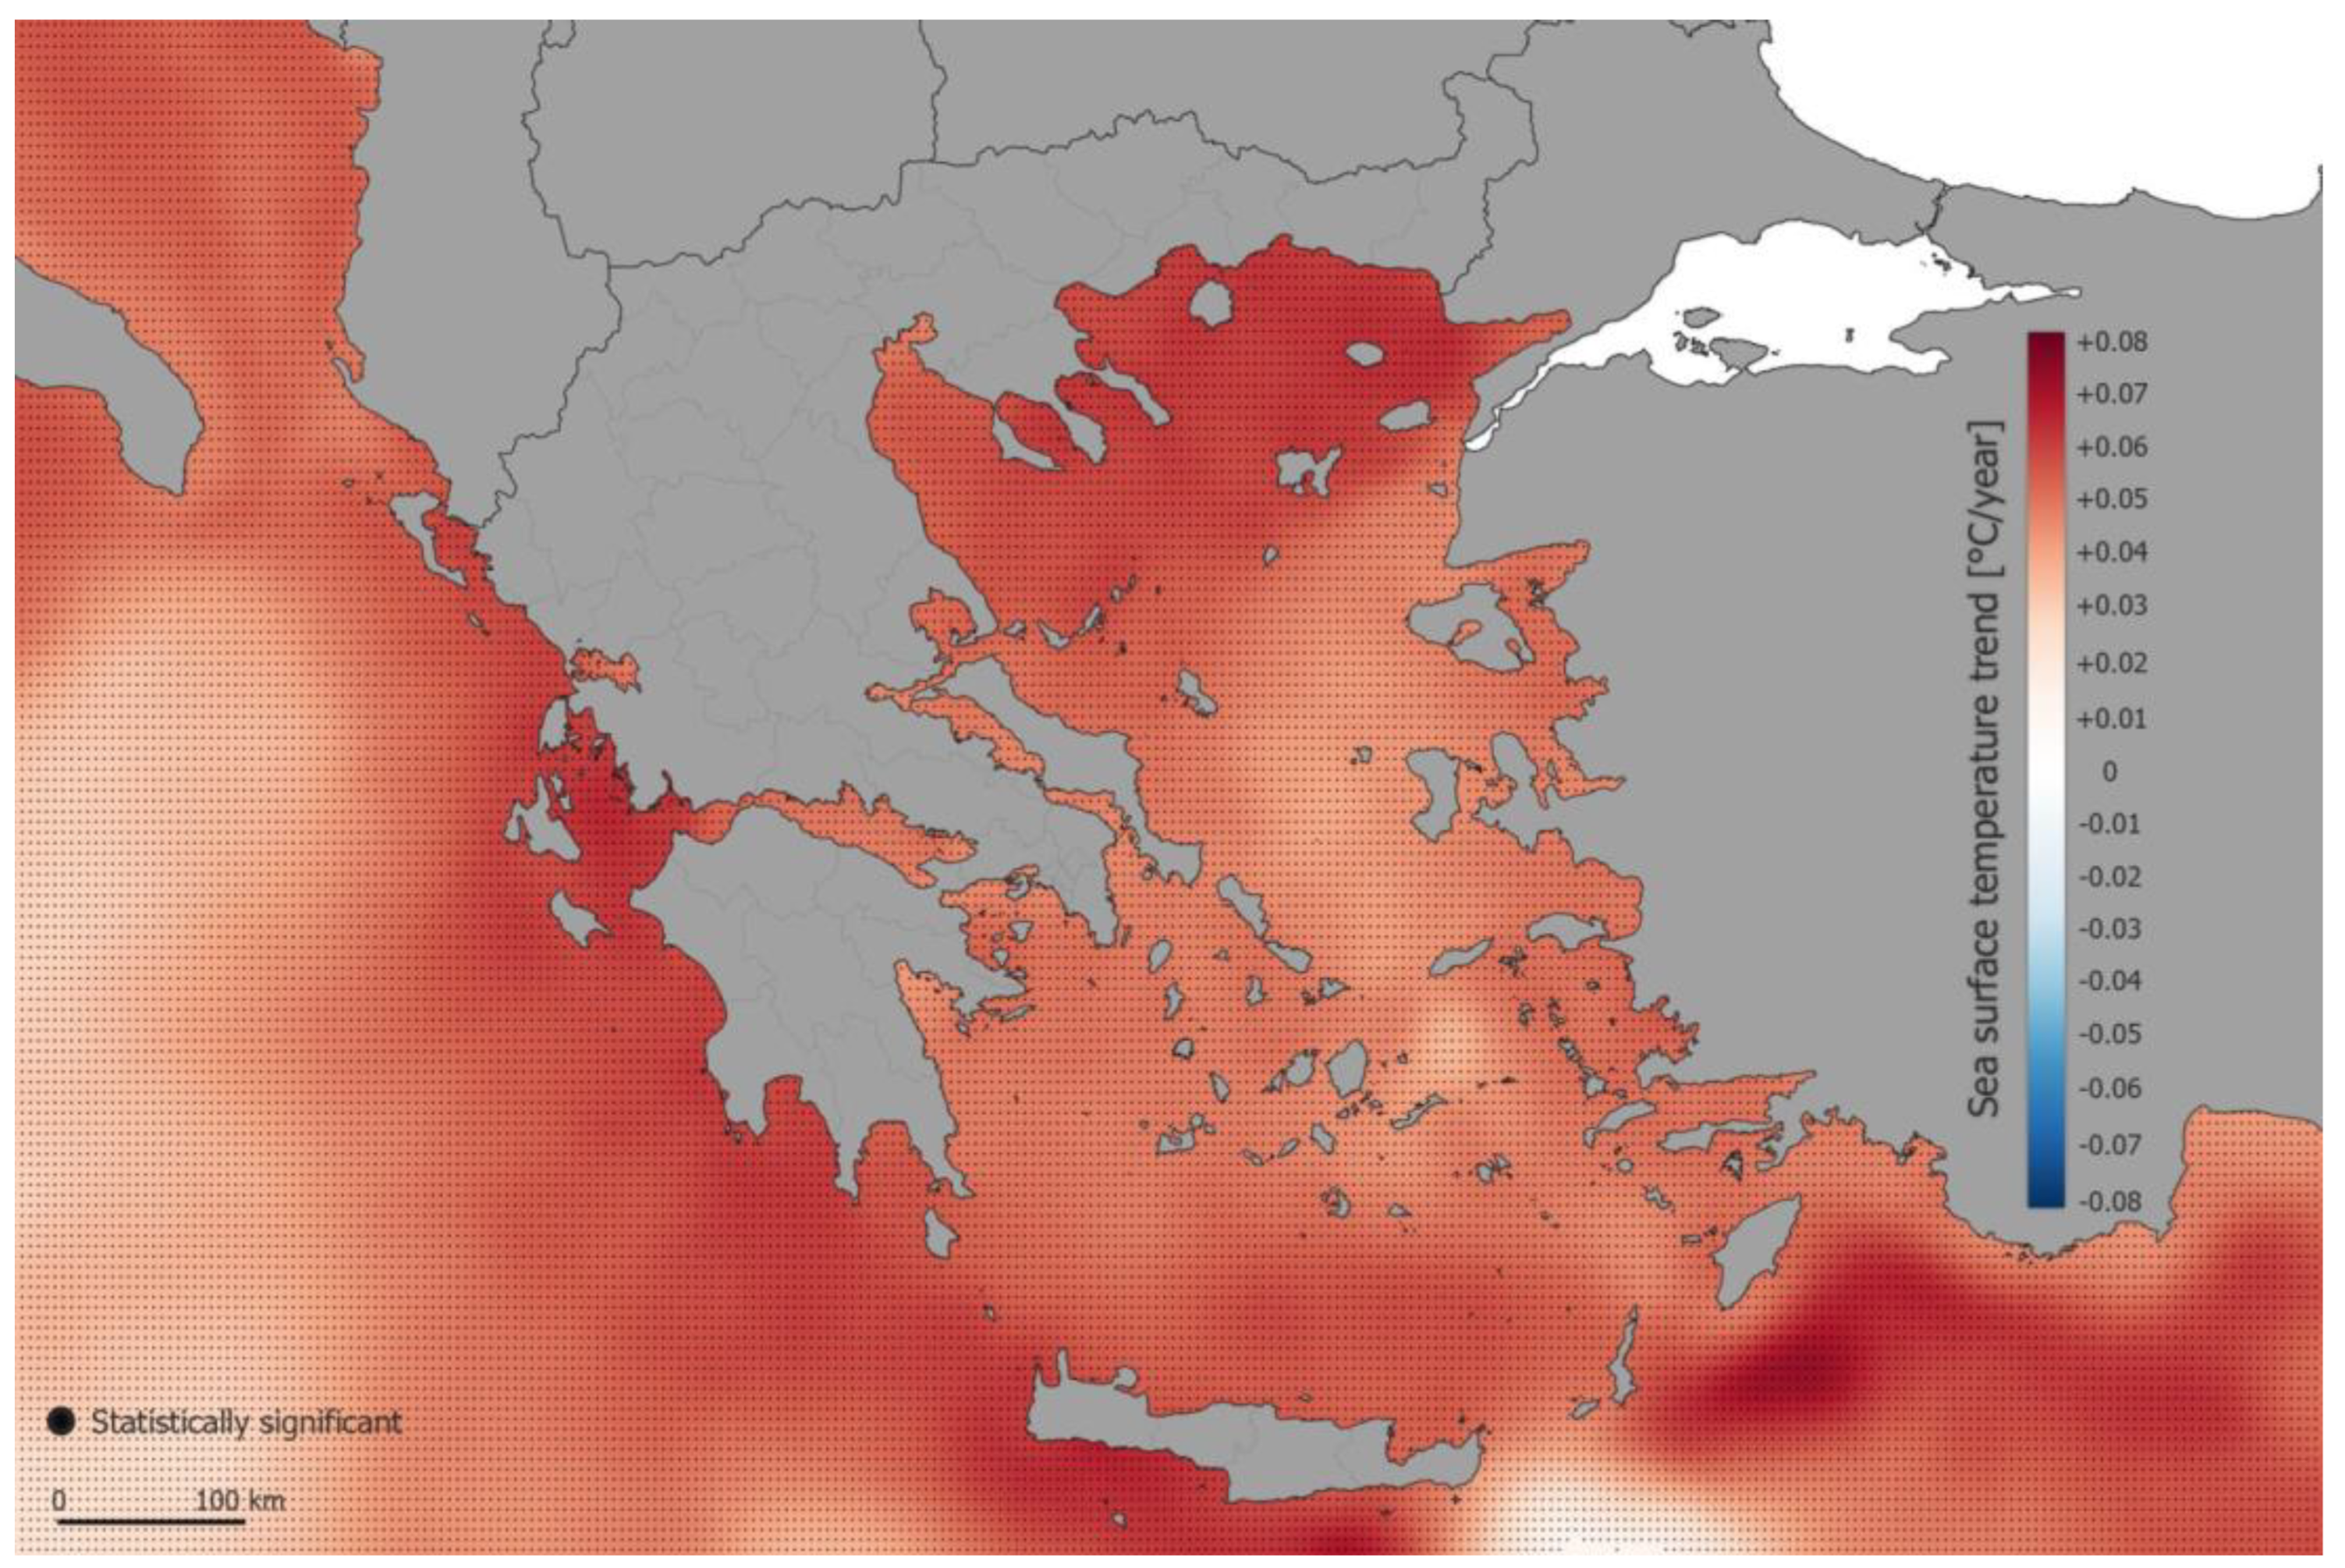
- The geographical distribution of the sea surface temperature deviation from the 30-year average value shows, as expected, a relatively cold first decade (1991–2000), with deviations up to −0.6 °C (mainly over the northern Aegean Sea), while the last decade (2011–2020) is warmer than the 30-year average value, reaching up to +0.8 °C, especially over the Ionian Sea coasts and the maritime area south of Rhodes island.
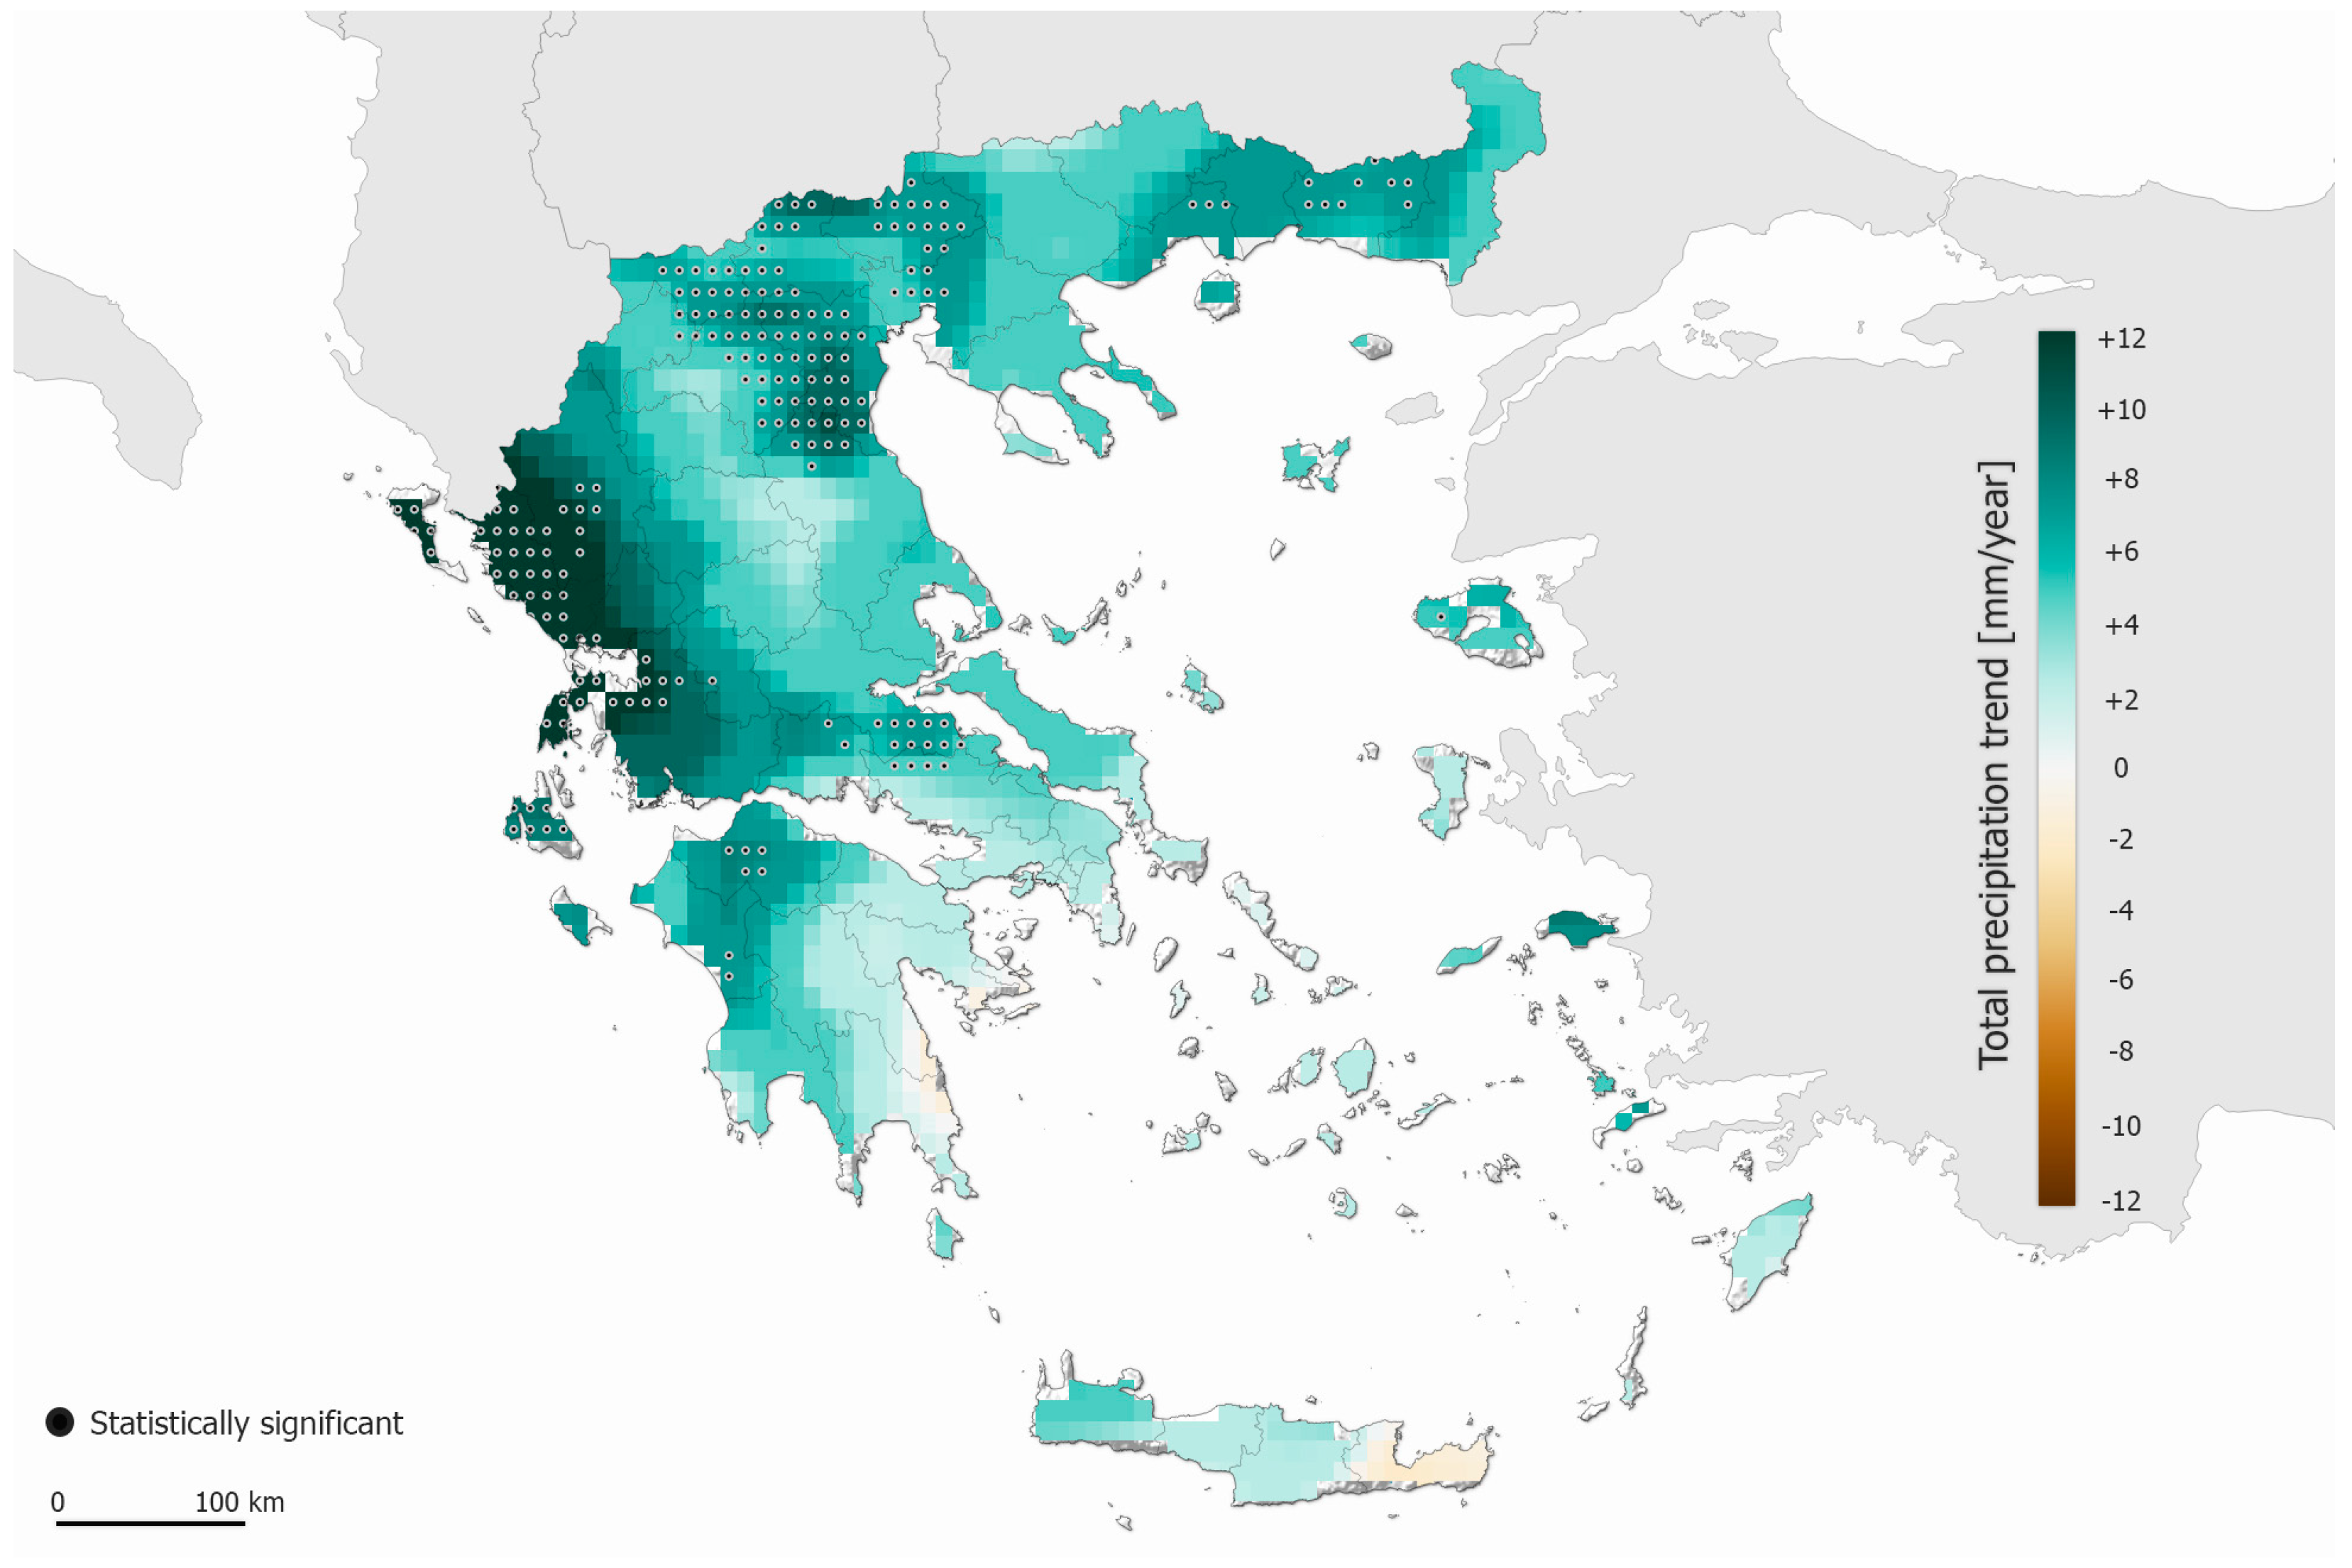
3.3. Precipitation
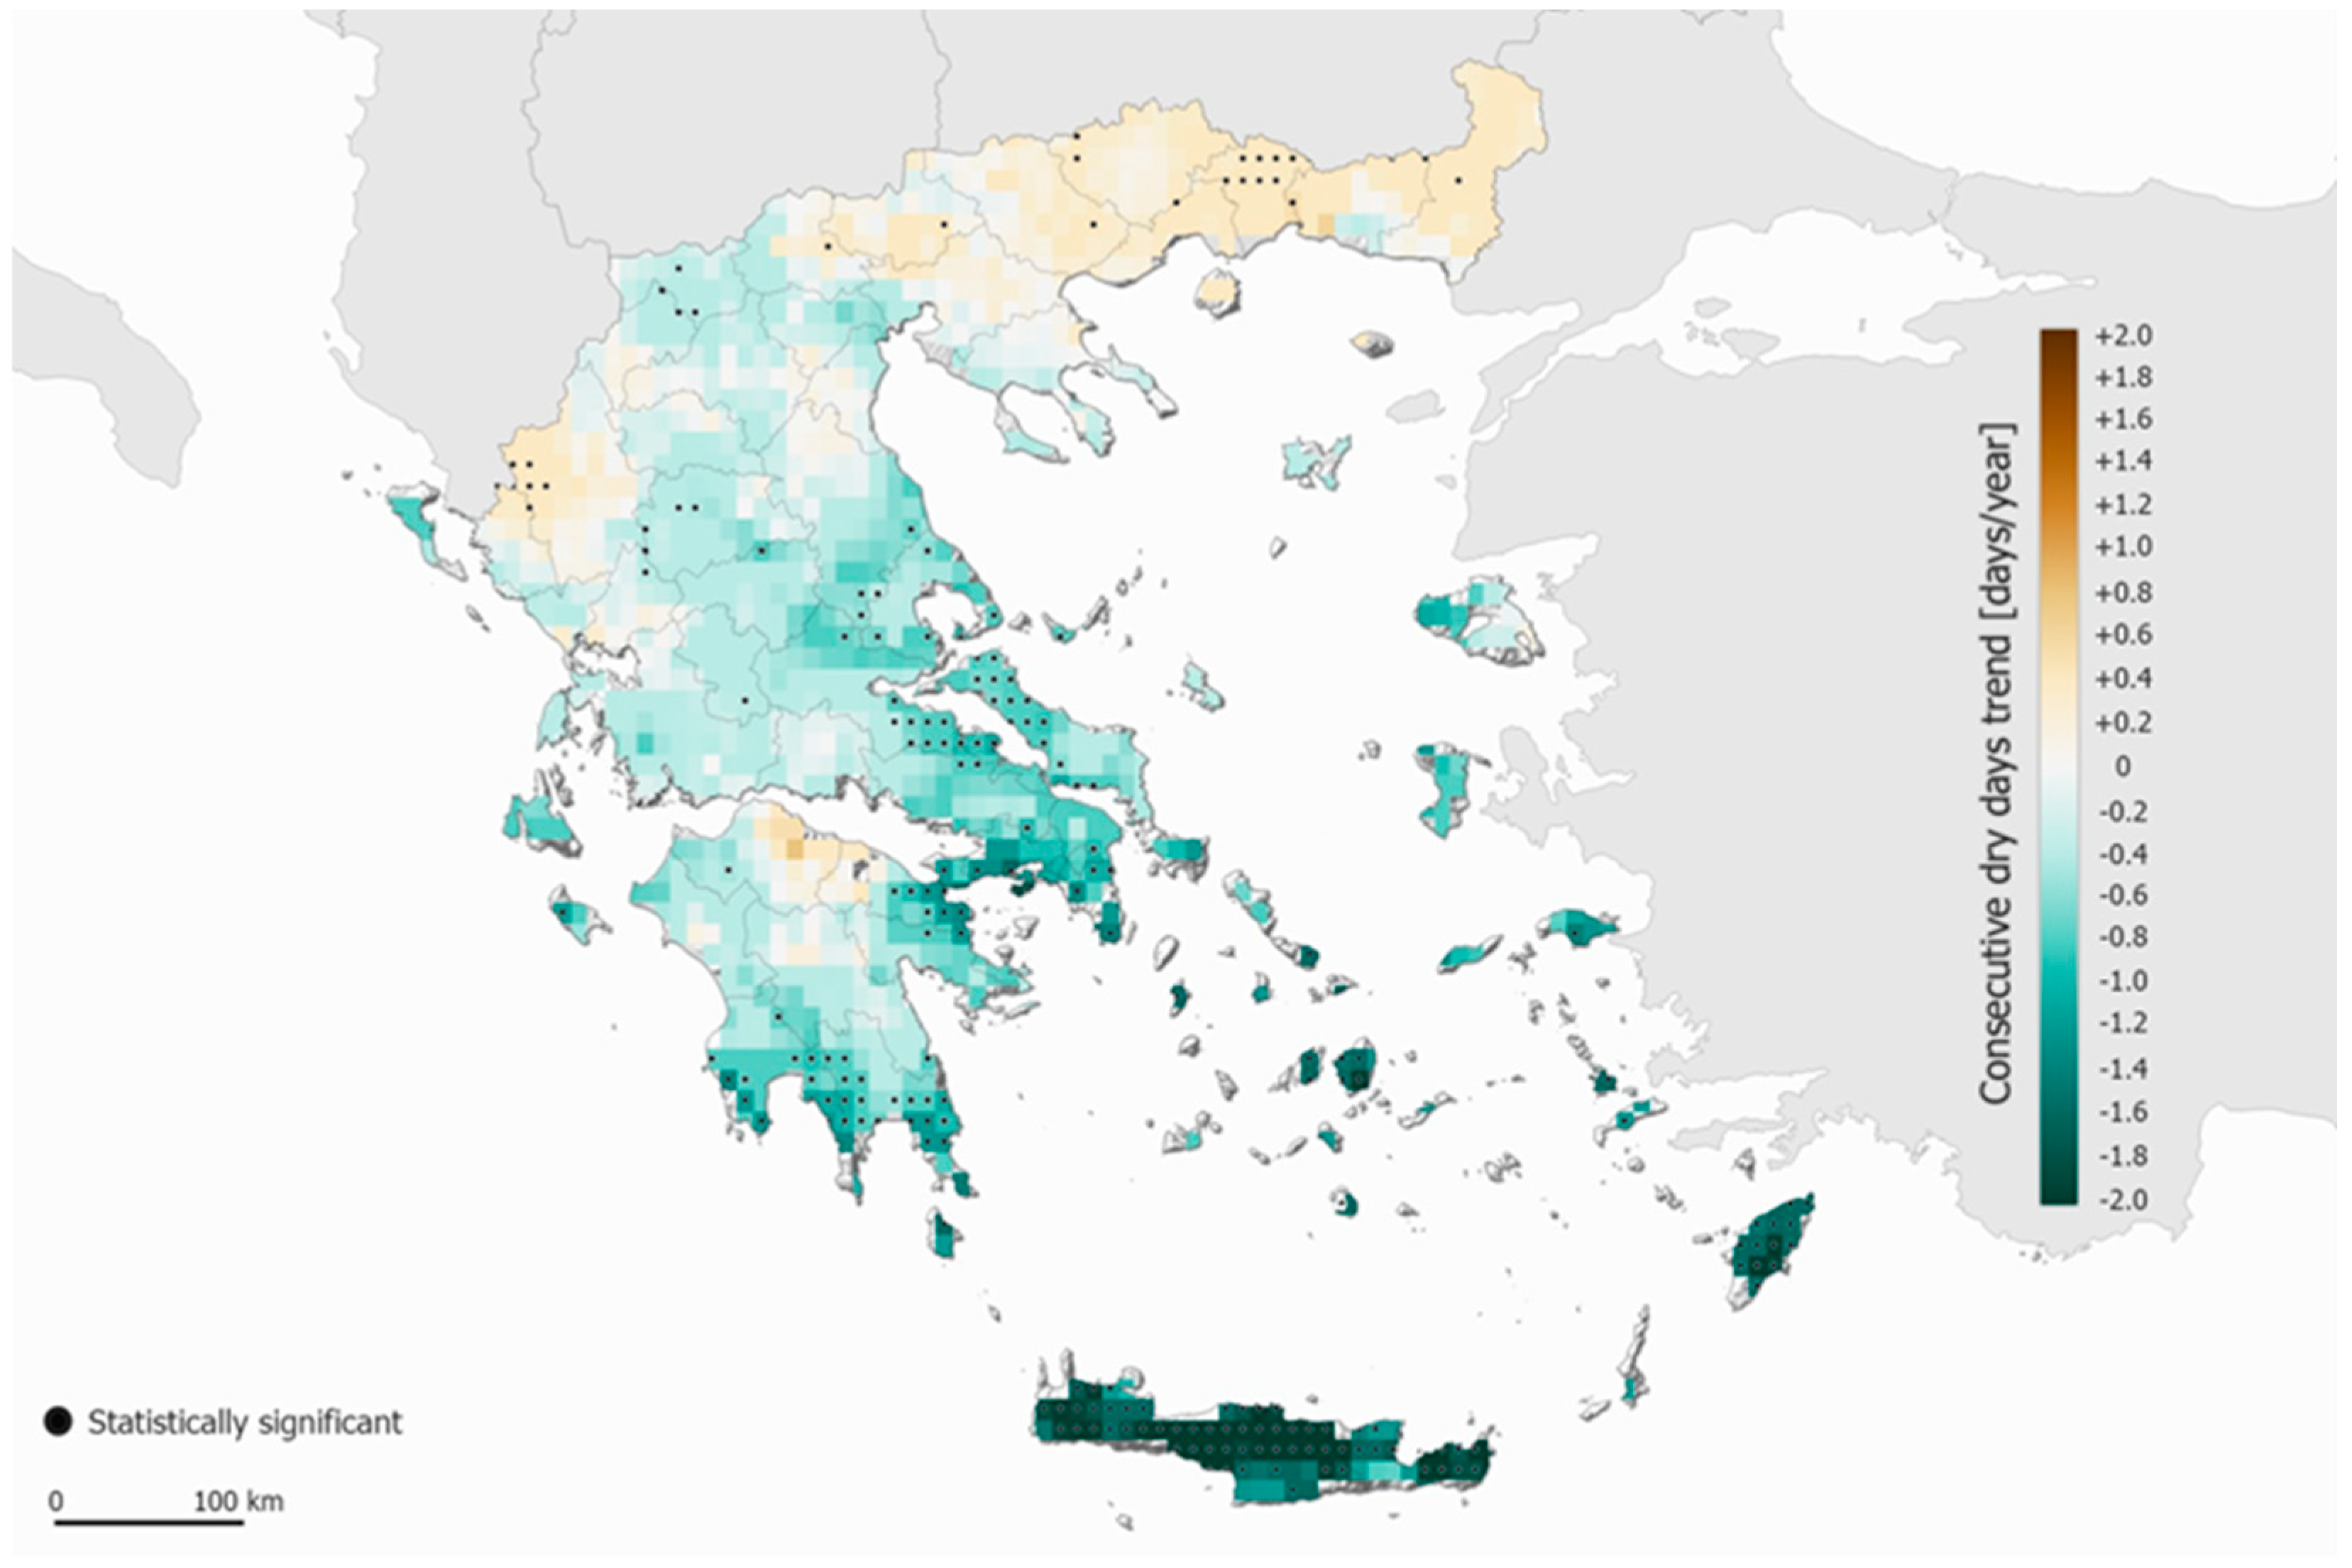
3.4. Drought
4. Concluding Remarks
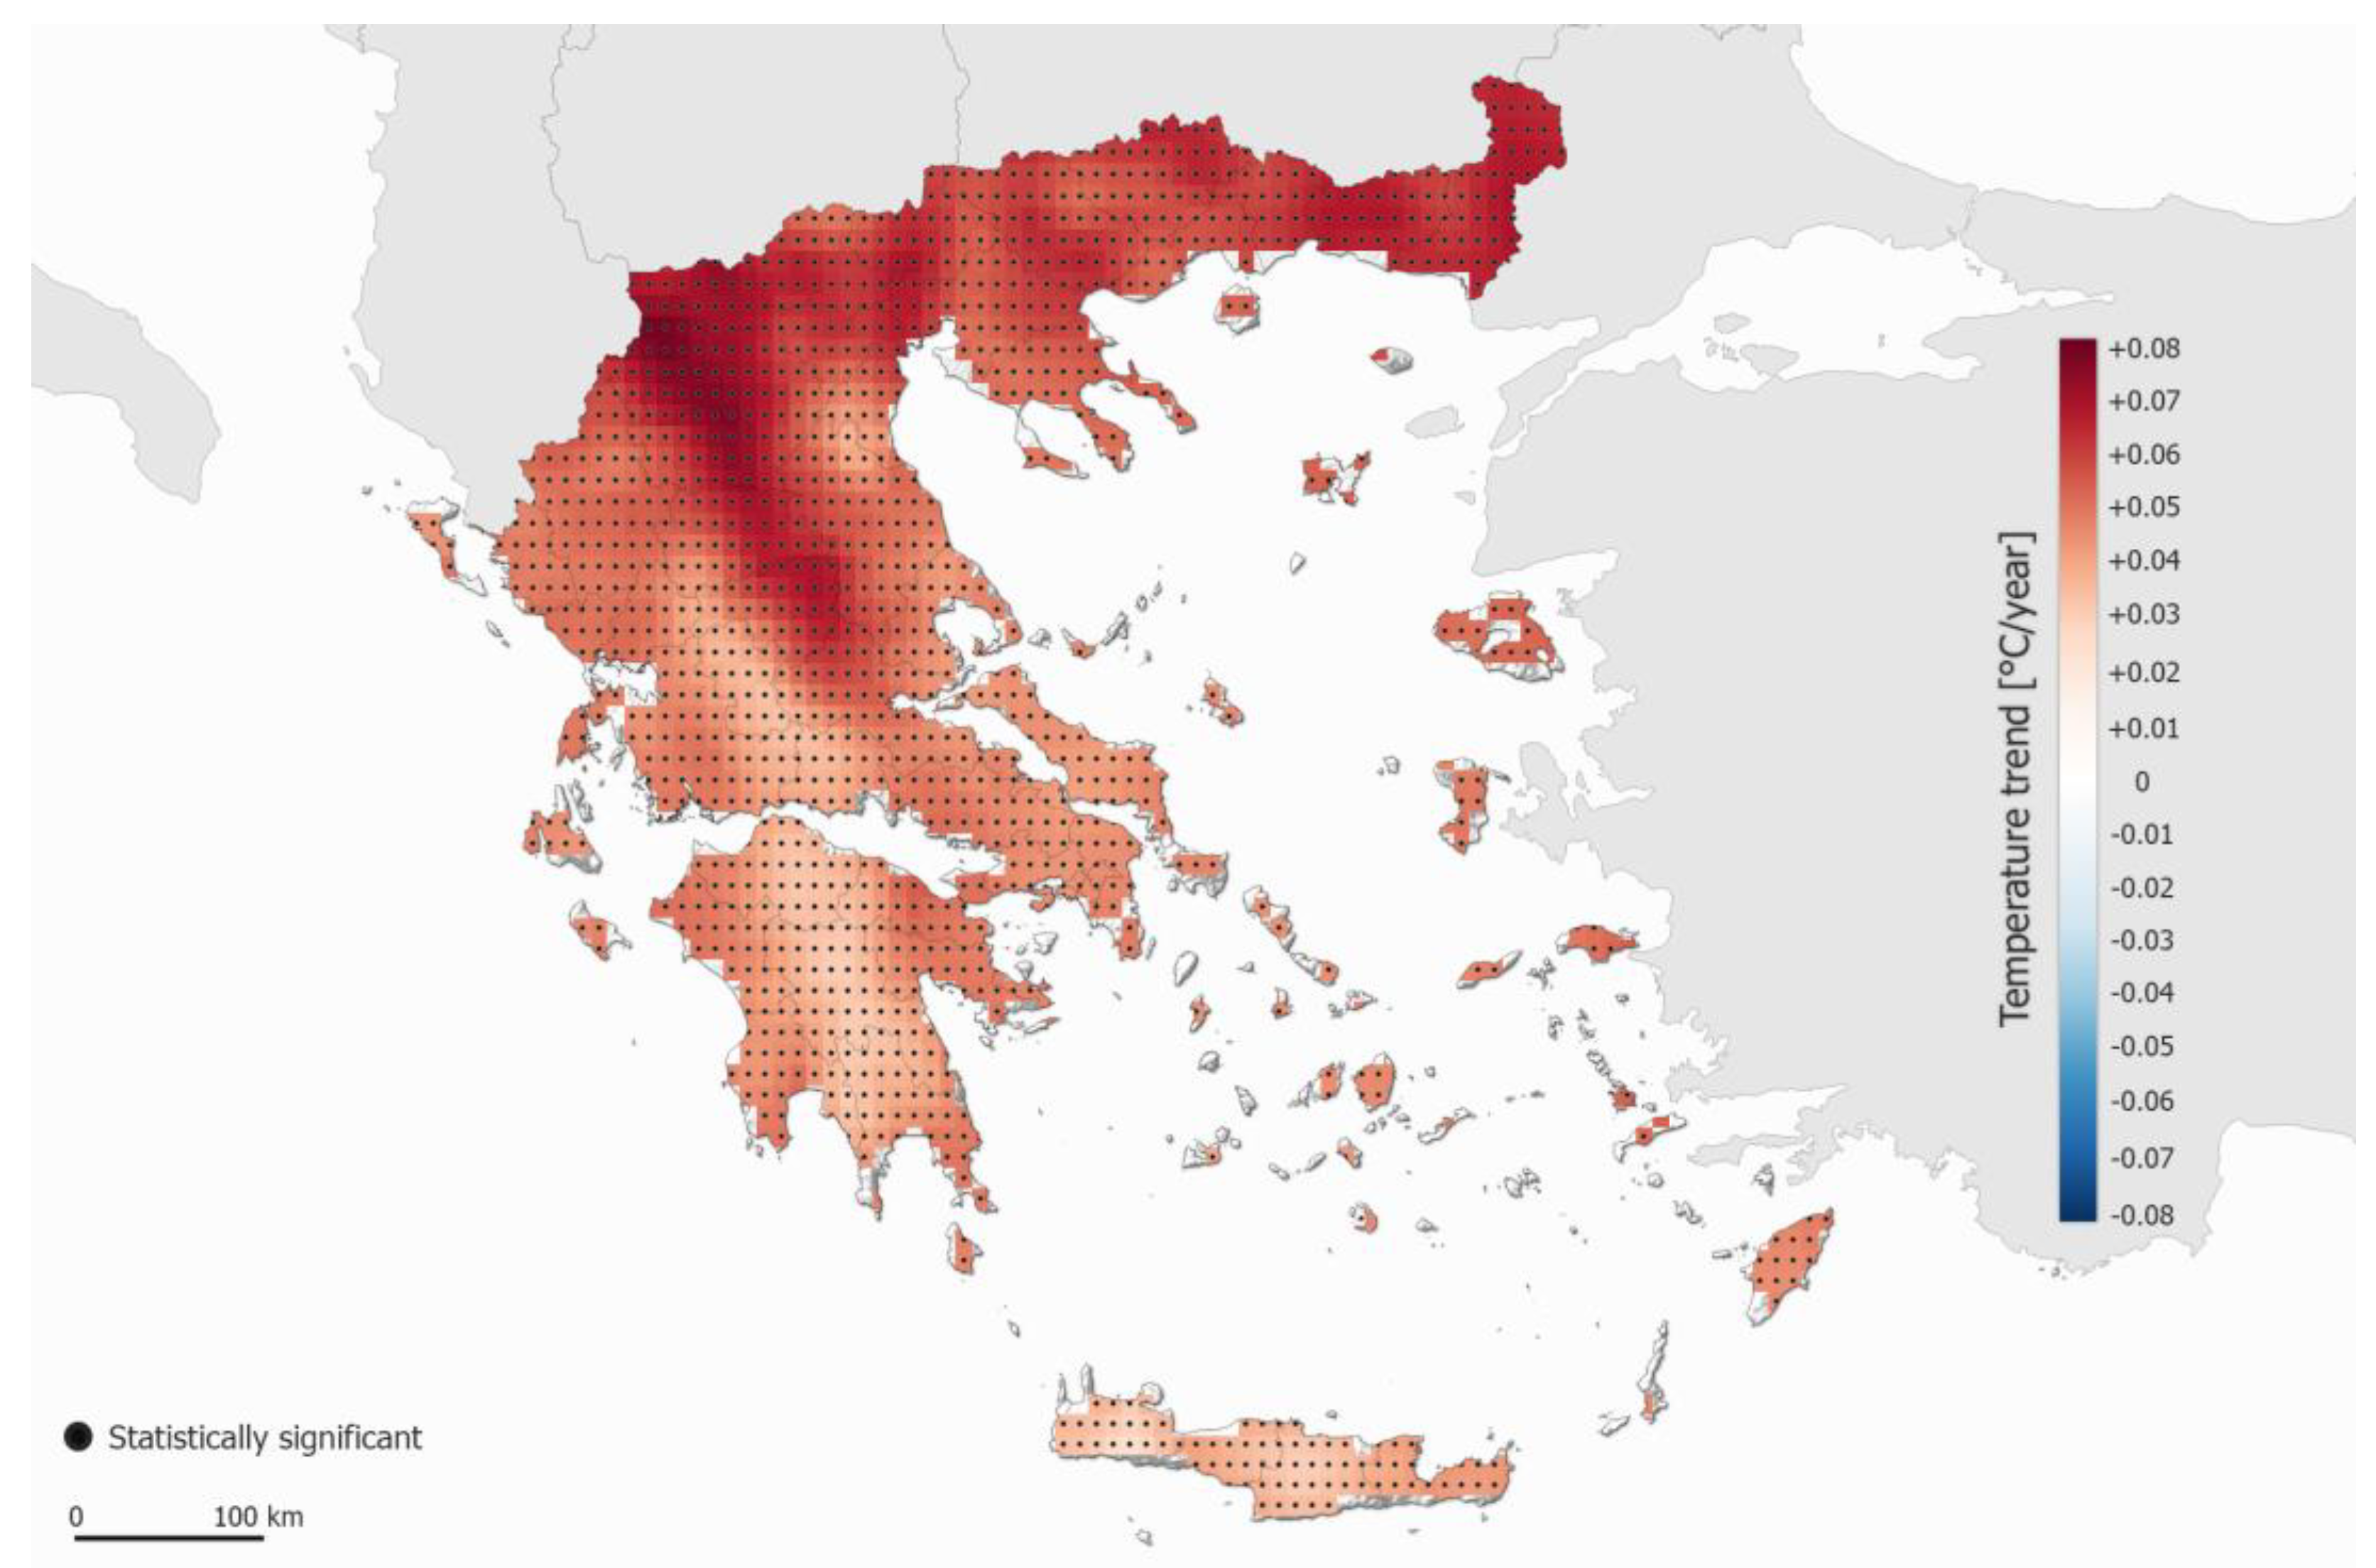
- The increasing cumulative 30-year trend of temperature reaches a country-averaged value of +1.5 °C, while locally, it exceeds +2 °C mainly in the northwestern part of Greece. This trend is much higher than the global temperature trend of ~0.6–0.8 °C during the same period [29]
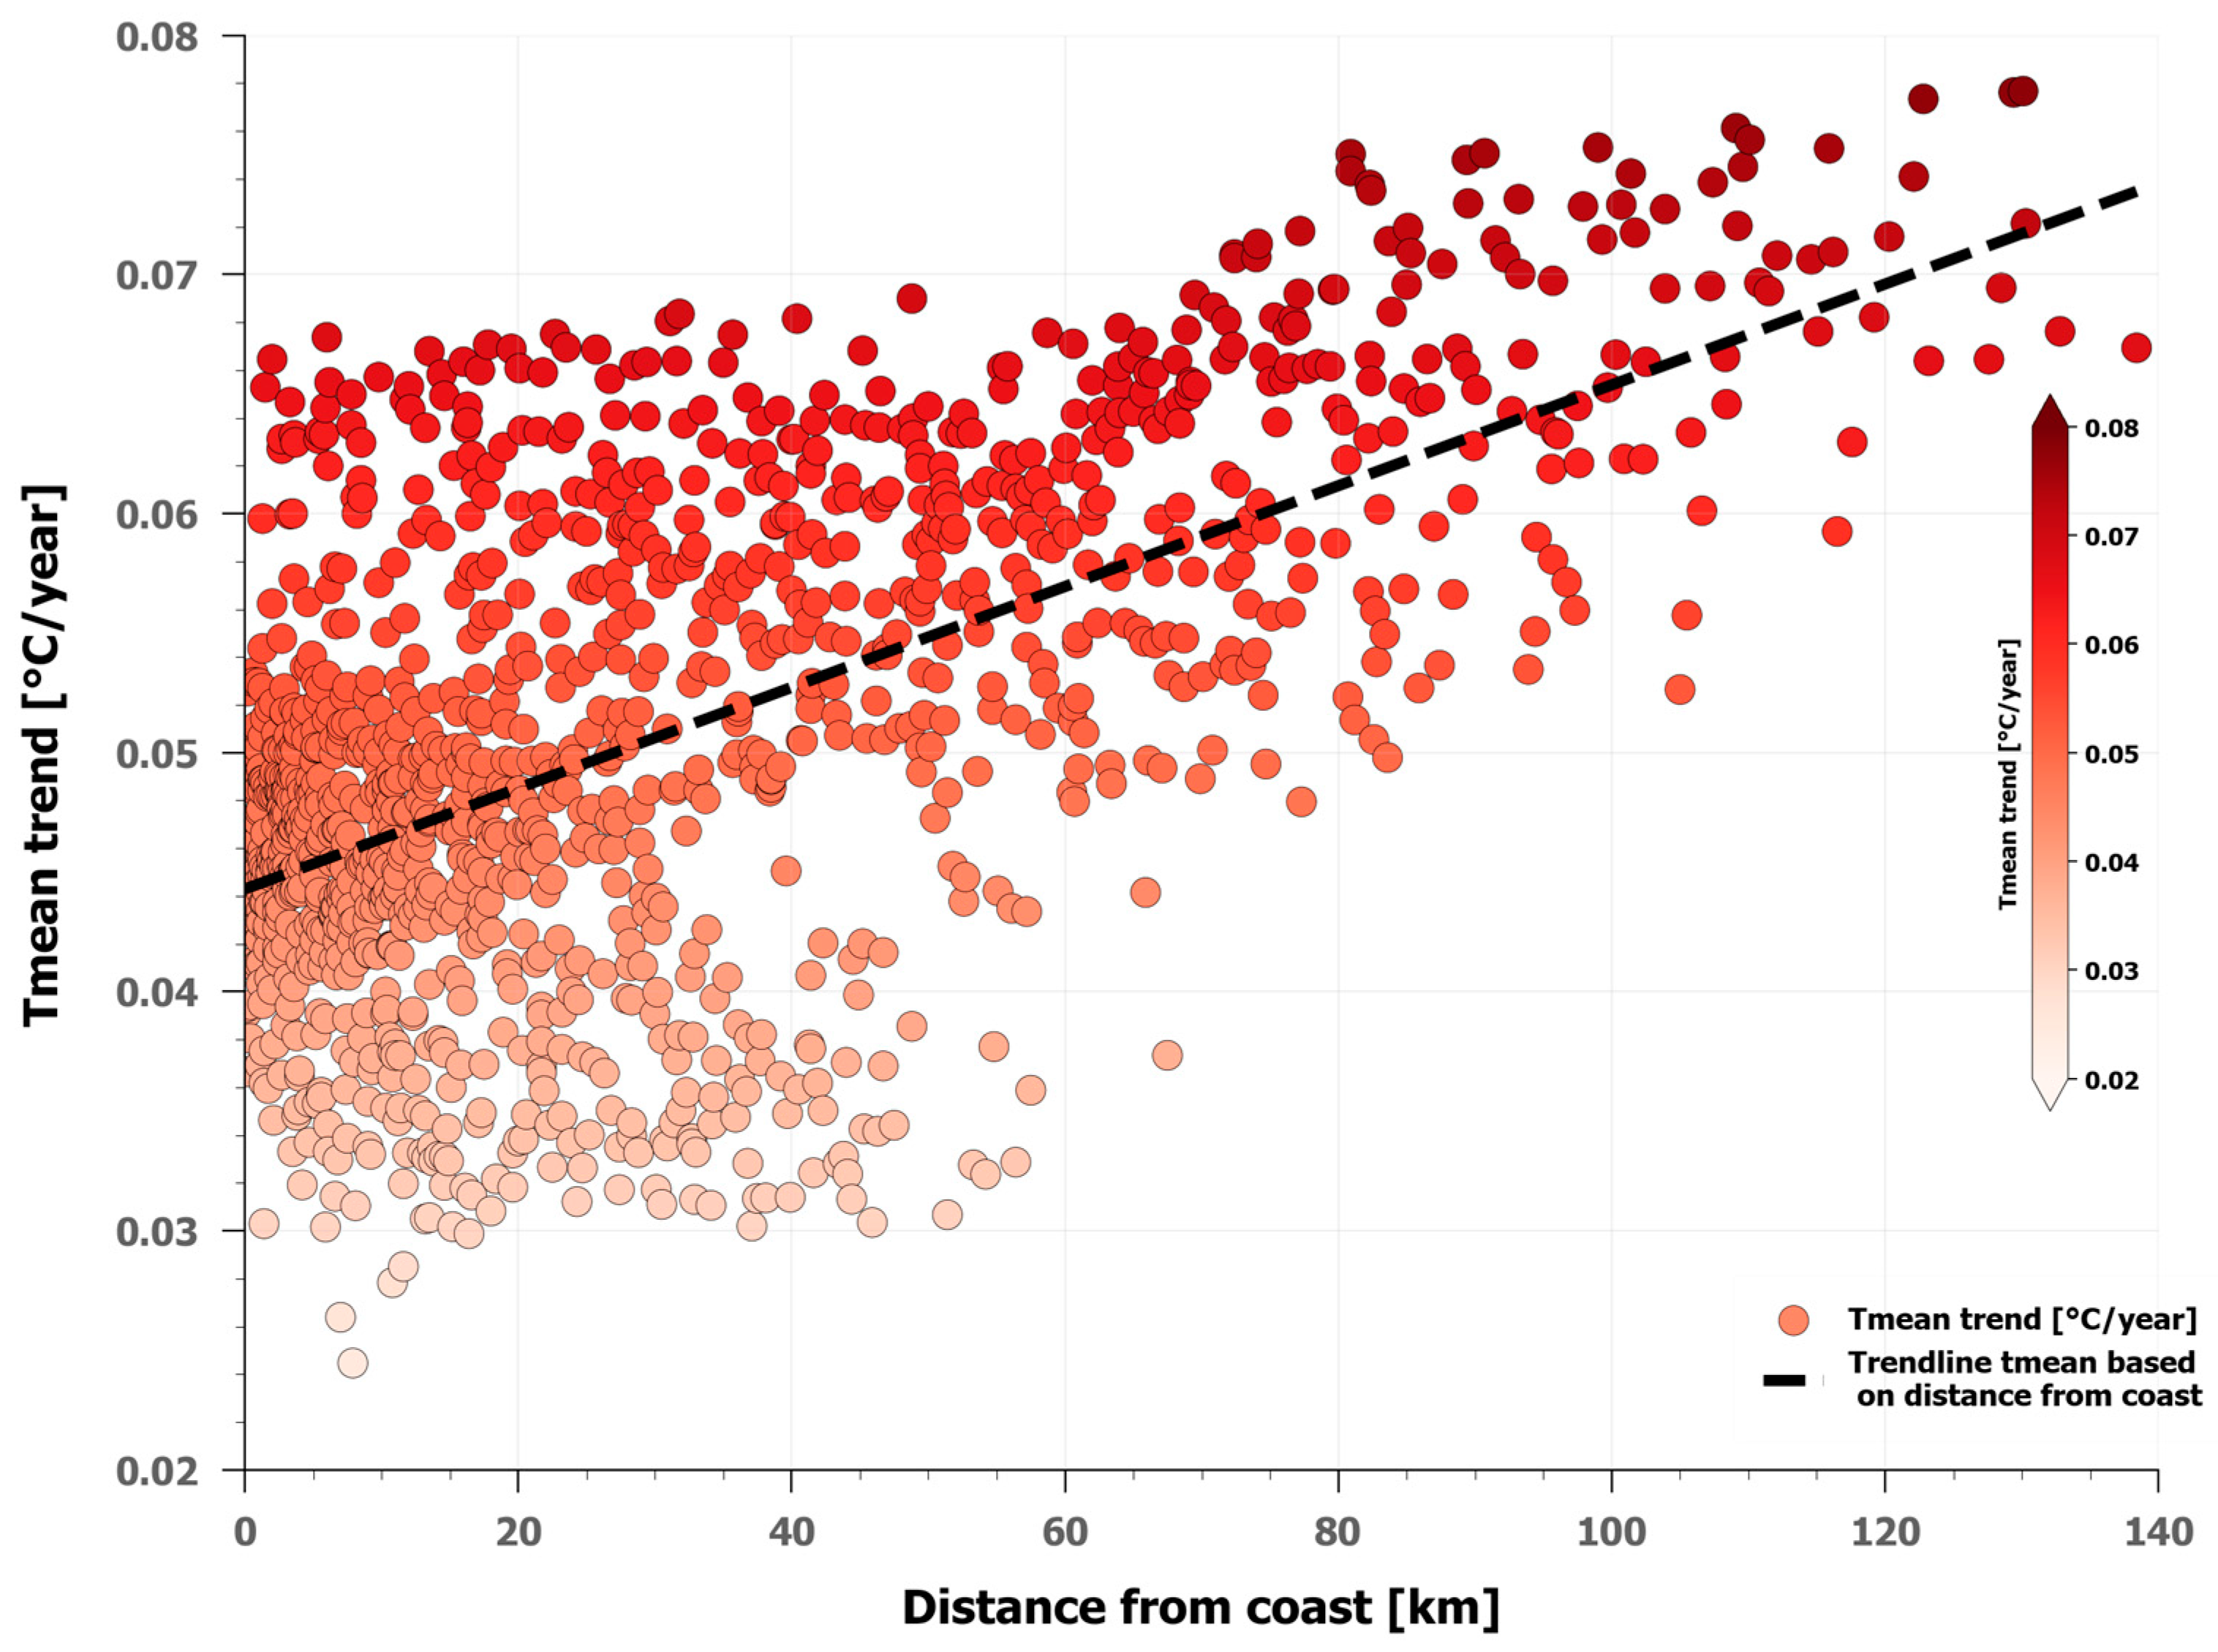
- The distance from the coasts was found to be positively correlated to the increasing temperature trend. Areas remote from the sea experienced a higher increasing trend during the analyzed period, compared to the coastal areas and the islands. This finding is of great importance for sectors such as agriculture in the areas where the increasing temperature trend maximizes;
- Following the monotonic increase in air temperature, frost days, a key parameter for agriculture, shows a significant decrease during the analyzed period;
- Sea surface temperature reaches an average cumulative increasing 30-year trend of 1.5 °C. A faster increase in sea surface temperature was evident during the first decade (1991–2000) of the analyzed period. Higher SSTs are related to more enhanced evaporation and hence increased atmospheric moisture, thus increasing extreme precipitation, especially in the coastal regions [30];
- Annual precipitation shows a mixed signal. In western Greece, there is a significant increase in precipitation, while in the eastern part of continental Greece, the Aegean Islands and Crete, a decrease in annual precipitation is evident (although not statistically significant);
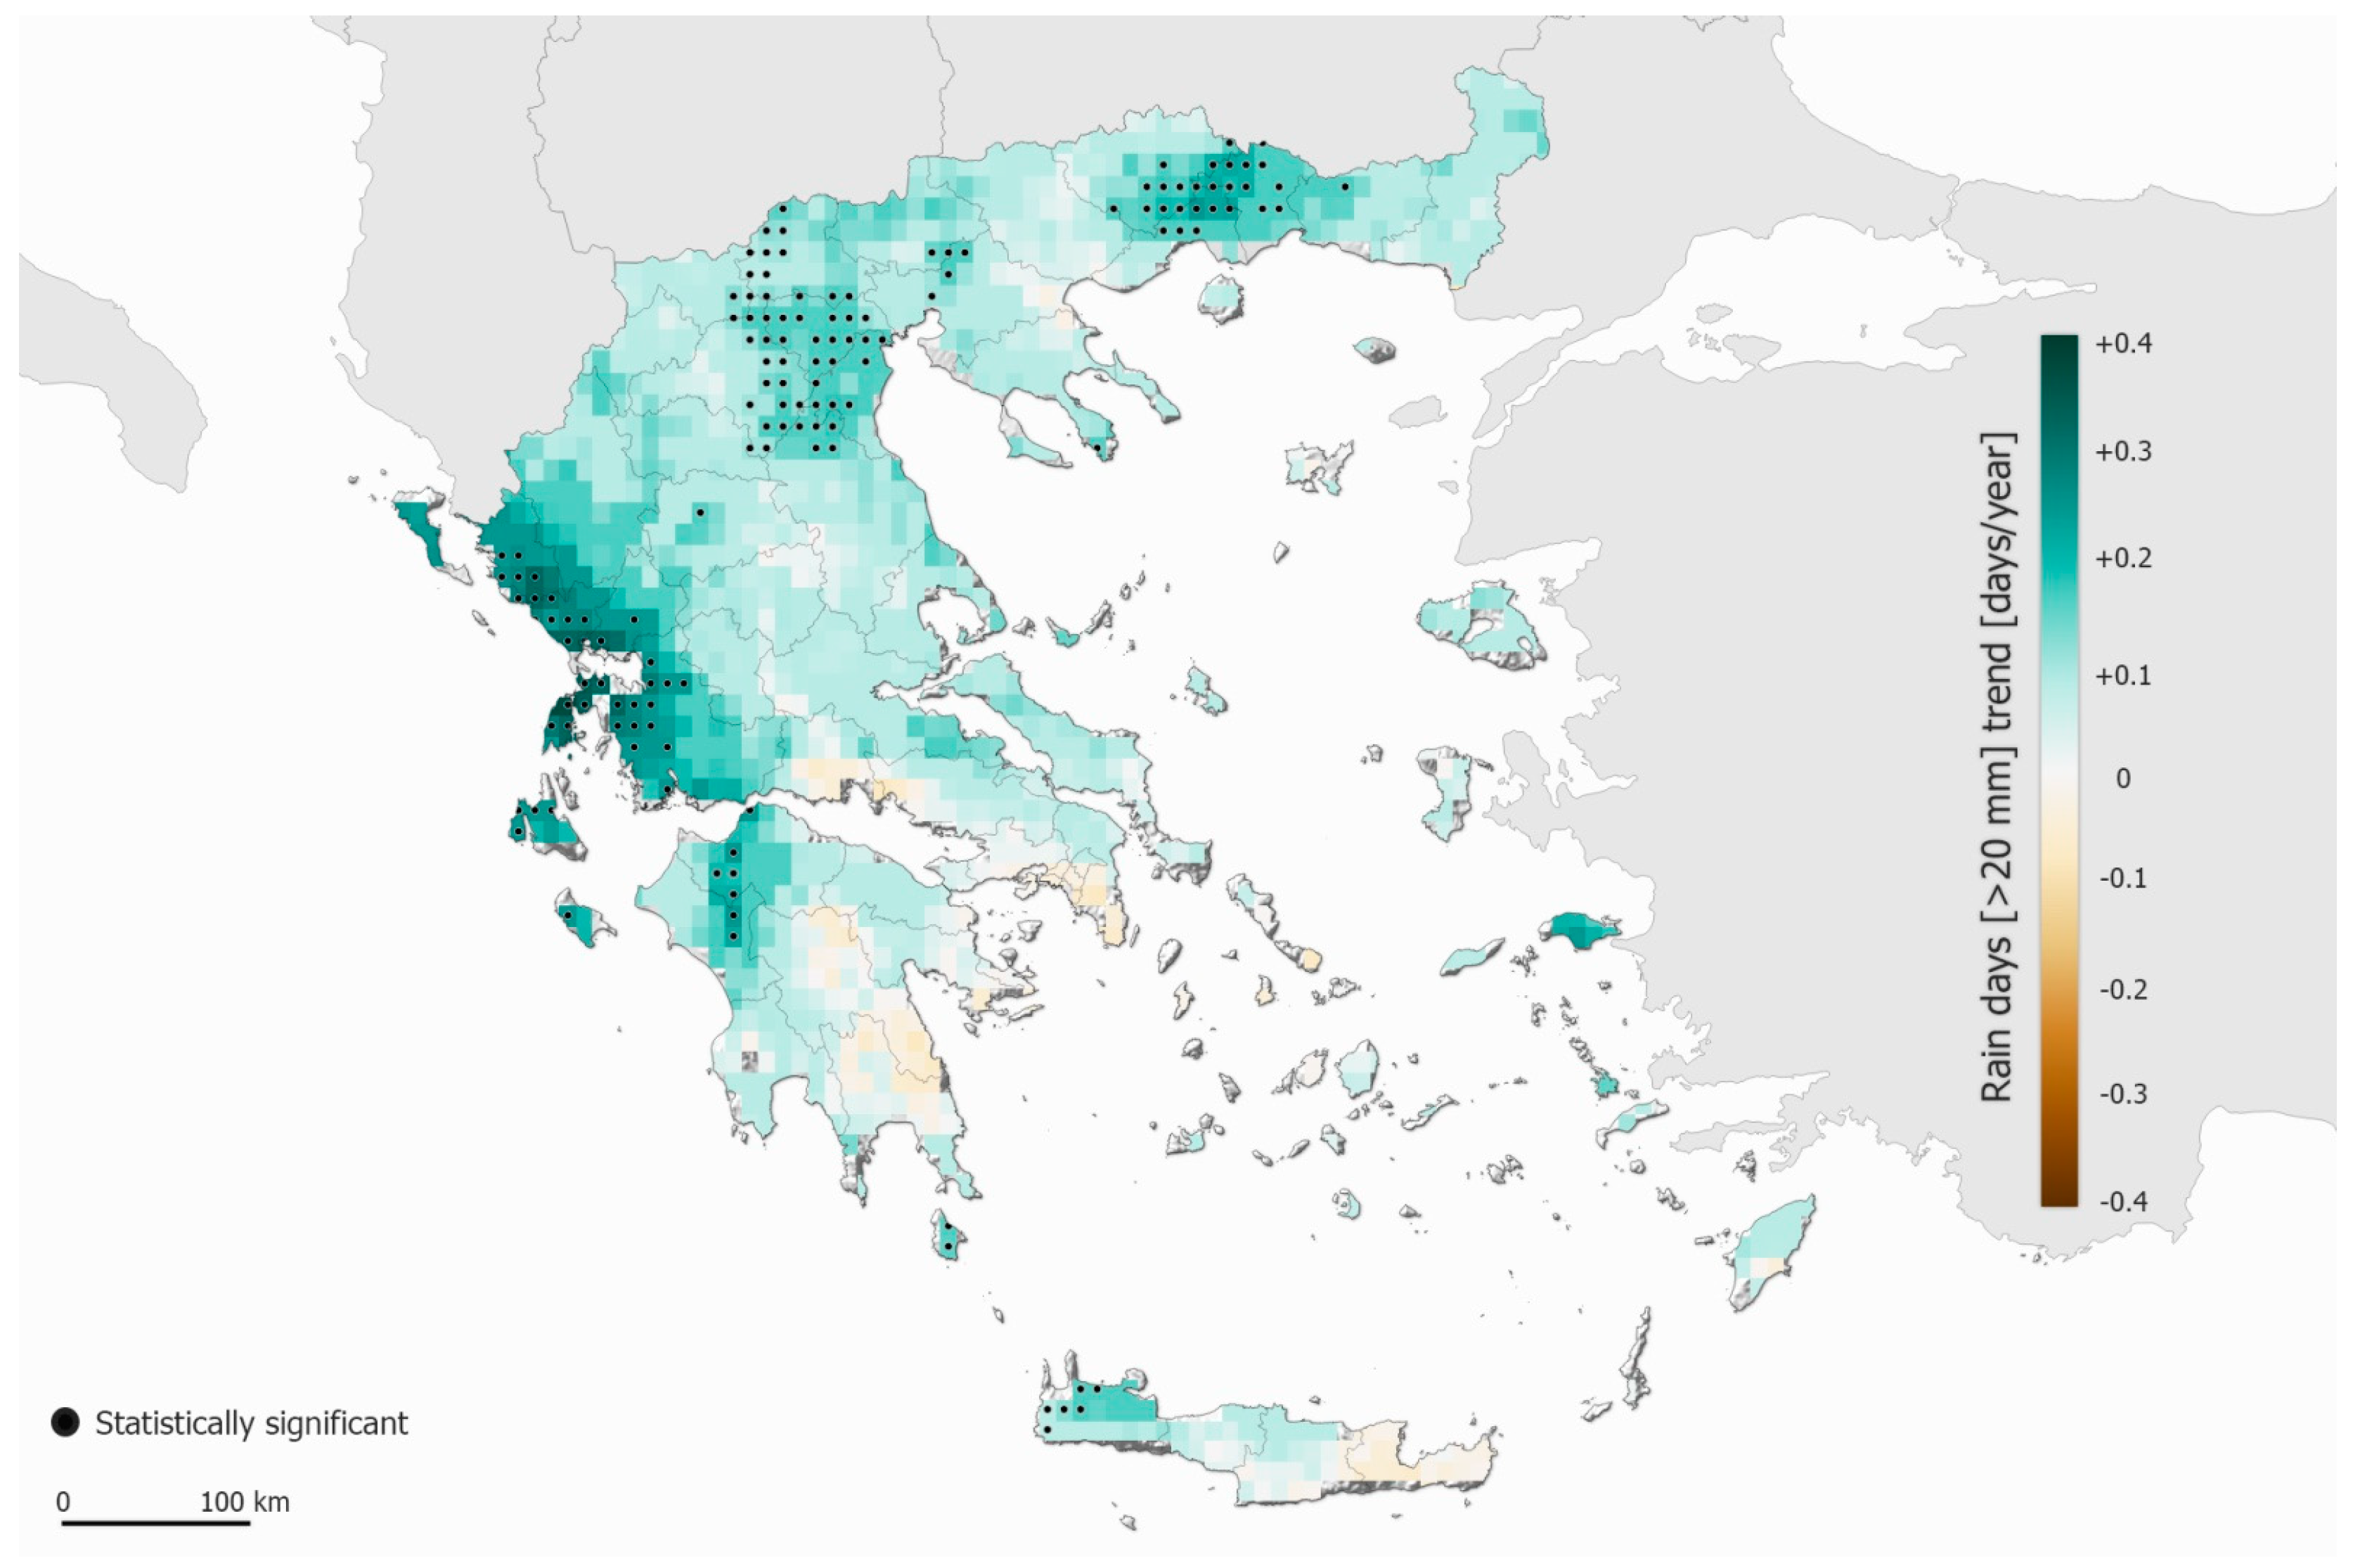
- Days of heavy rainfall show a significant increase, mainly in the western part of the country. This finding reveals the potential danger of flood events in these areas;
- Consecutive dry days also show a mixed signal. Large areas of northern Greece show an increasing trend of the CDD, while large parts of eastern and southern Greece (including the Aegean Islands and Crete) show a decreasing trend of CDD, a fact that is beneficial to agriculture. This decrease seems to be related to the increase in rainfall that was observed during the last decade (2011–2020).
Author Contributions
Funding
Institutional Review Board Statement
Informed Consent Statement
Data Availability Statement
Acknowledgments
Conflicts of Interest
References
- Raza, A.; Razzaq, A.; Mehmood, S.S.; Zou, X.; Zhang, X.; Lv, Y.; Xu, J. Impact of Climate Change on Crops Adaptation and Strategies to Tackle Its Outcome: A Review. Plants 2019, 8, 34. [Google Scholar] [CrossRef] [PubMed]
- Malhi, Y.; Janet, F.; Nathalie, S.; Martin, S.; Monica, G.T.; Christopher, B.F.; Nancy, K. Climate change and ecosystems: Threats, opportunities and solutions. Philos. Trans. R. Soc. 2020, 375, 20190104. [Google Scholar] [CrossRef] [PubMed]
- Tabari, H. Climate change impact on flood and extreme precipitation increases with water availability. Sci. Rep. 2020, 10, 13768. [Google Scholar] [CrossRef]
- Ridder, N.N.; Ukkola, A.M.; Pitman, A.J.; Perkins-Kirkpatrick, S.E. Increased occurrence of high impact compound events under climate change. npj Clim. Atmos. Sci. 2022, 5, 3. [Google Scholar] [CrossRef]
- Kotroni, V.; Lagouvardos, K.; Bezes, A.; Dafis, S.; Galanaki, E.; Giannaros, C.; Giannaros, T.; Karagiannidis, A.; Koletsis, I.; Kopania, T.; et al. Storm Naming in the Eastern Med-iterranean: Procedures, Events Review and Impact on the Citizens Risk Perception and Readiness. Atmosphere 2021, 12, 1537. [Google Scholar] [CrossRef]
- Zafeiratou, S.; Analitis, A.; Founda, D.; Giannakopoulos, C.; Varotsos, K.V.; Sismanidis, P.; Keramitsoglou, I.; Katsouyanni, K. Spatial Variability in the Effect of High Ambient Temperature on Mortality: An Analysis at Municipality Level within the Greater Athens Area. Int. J. Environ. Res. Public Health 2019, 16, 3689. [Google Scholar] [CrossRef] [PubMed]
- Parliari, D.; Cheristanidis, S.; Giannaros, C.; Keppas, S.C.; Papadogiannaki, S.; de’Donato, F.; Sarras, C.; Melas, D. Short-Term Effects of Apparent Temperature on Cause-Specific Mortality in the Urban Area of Thessaloniki, Greece. Atmosphere 2022, 13, 852. [Google Scholar] [CrossRef]
- Bojinski, S.; Verstraete, M.; Peterson, T.C.; Richter, C.; Simmons, A.; Zemp, M. The Concept of Essential Climate Variables in Support of Climate Research, Applications, and Policy. Bull. Am. Meteorol. Soc. 2014, 95, 1431. [Google Scholar]
- European State of the Climate 2023, Copernicus Climate Change Service (C3S), 2024. Available online: https://climate.copernicus.eu/esotc/2023 (accessed on 3 September 2024). [CrossRef]
- Intergovernmental Panel on Climate Change. Climate Change 2021: The Physical Science Basis. Contribution of Working Group I to the Sixth Assessment Report of the Intergovernmental Panel on Climate Change; Cambridge University Press: Cambridge, UK, 2021. [Google Scholar] [CrossRef]
- Lionello, P.; Scarascia, L. Recent Climate Change in the Mediterranean Region and Its Environmental and Societal Impacts. Reg. Environ. Chang. 2018, 18, 573–586. [Google Scholar]
- Zittis, G.; Almazroui, M.; Alpert, P.; Ciais, P.; Cramer, W.; Dahdal, Y.; Fnais, M.; Francis, D.; Hadjinicolaou, P.; Howari, F.; et al. Climate change and weather extremes in the Eastern Mediterranean and Middle East. Rev. Geophys. 2022, 60, e2021RG000762. [Google Scholar] [CrossRef]
- Urdiales-Flores, D.; Zittis, G.; Hadjinicolaou, P.; Osipov, S.; Klingmüller, K.; Mihalopoulos, N.; Kanakidou, M.; Economou, T.; Lelieveld, J. Drivers of accelerated warming in Mediterranean climate-type regions. npj Clim. Atmos. Sci. 2023, 6, 97. [Google Scholar] [CrossRef]
- Founda, D.; Giannakopoulos, C.; Pierros, F.; Kalimeris, A.; Petrakis, M. Observed and projected precipitation variability in Athens over a 2.5 century period. Atmos. Sci. Lett. 2013, 14, 72–78. [Google Scholar] [CrossRef]
- Lagouvardos, K.; Papavasileiou, G.; Papagiannaki, K.; Dafis, S.; Galanaki, E.; Giannaros, T.M.; Koletsis, I.; Kotroni, V. Regional precipitation index: Method analysis and application over Greece. Atmos. Sci. Lett. 2023, 24, e1184. [Google Scholar] [CrossRef]
- Muñoz-Sabater, J.; Dutra, E.; Agustí-Panareda, A.; Albergel, C.; Arduini, G.; Balsamo, G.; Boussetta, S.; Choulga, M.; Harrigan, S.; Hersbach, H.; et al. ERA5-land: A state-of-the-art global reanalysis dataset for land applications. Earth Syst. Sci. Data 2021, 13, 4349–4383. [Google Scholar] [CrossRef]
- Varlas, G.; Stefanidis, K.; Papaioannou, G.; Panagopoulos, Y.; Pytharoulis, I.; Katsafados, P.; Papadopoulos, A.; Dimitriou, E. Unravelling Precipitation Trends in Greece since 1950s Using ERA5 Climate Reanalysis Data. Climate 2022, 10, 12. [Google Scholar] [CrossRef]
- Founda, D.; Katavoutas, G.; Pierros, F.; Mihalopoulos, N. Centennial changes in heat waves characteristics in Athens (Greece) from multiple definitions based on climatic and bioclimatic indices. Glob. Planet. Chang. 2022, 212, 103807. [Google Scholar] [CrossRef]
- Papakostas, K.T.; Zagana-Papavasileiou, P.; Mavromatis, T. Analysis of 3 decades temperature data for Athens and Thessaloniki, Greece—Impact of temperature changes on energy consumption for heating and cooling of buildings. In Proceedings of the International Conference ADAPTtoCLIMATE, Nicosia, Cyprus, 27–28 March 2014. [Google Scholar]
- Mamara, A.; Argiriou, A.A.; Anadranistakis, M. Recent trend analysis of mean air temperature in Greece based on homogenized data. Theor. Appl. Climatol. 2016, 126, 543–573. [Google Scholar] [CrossRef]
- Muñoz Sabater, J. ERA5-Land hourly data from 1981 to present. Copernicus Climate Change Service (C3S) Climate Data Store (CDS). Earth Syst. Sci. Data 2021, 13, 4349–4383. [Google Scholar]
- Sheridan, S.C.; Lee, C.C.; Smith, E.T. A comparison between station observations and reanalysis data in the identification of extreme temperature events Geophys. Res. Lett. 2020, 47, e2020GL088120. [Google Scholar] [CrossRef]
- Zhao, P.; He, Z. A First Evaluation of ERA5-Land Reanalysis Temperature Product Over the Chinese Qilian Mountains. Front. Earth Sci. 2022, 10, 907730. [Google Scholar] [CrossRef]
- Gomis-Cebolla, J.; Rattayova, V.; Salazar-Galán, S.; Francés, F. Evaluation of ERA5 and ERA5-Land reanalysis precipitation datasets over Spain (1951–2020). Atmos. Res. 2023, 284, 106606. [Google Scholar] [CrossRef]
- Merchant, C.J.; Embury, O.; Bulgin, C.E.; Block, T.; Corlett, G.K.; Fiedler, E.; Good, S.A.; Mittaz, J.; Rayner, N.A.; Berry, D.; et al. Satellite-based time-series of sea-surface temperature since 1981 for climate applications. Sci. Data 2019, 6, 223. [Google Scholar] [CrossRef] [PubMed]
- Galanaki, E.; Giannaros, C.; Kotroni, V.; Lagouvardos, K.; Papavasileiou, G. Spatio-Temporal Analysis of Heatwaves Characteristics in Greece from 1950 to 2020. Climate 2022, 11, 5. [Google Scholar] [CrossRef]
- Pantavou, K.; Kotroni, V.; Kyros, G.; Lagouvardos, K. Thermal bioclimate in Greece based on the Universal Thermal Climate Index. (UTCI) and insights into 2021 and 2023 heatwaves. Theor. Appl. Climatol. 2024, 155, 6661–6675. [Google Scholar] [CrossRef]
- Lagouvardos, K.; Karagiannidis, A.; Dafis, S.; Kalimeris, A.; Kotroni, V. Ianos—A Hurricane in the Mediterranean. Bull. Am. Meteorol. Soc. 2022, 103, E1621–E1636. [Google Scholar] [CrossRef]
- NOAA National Centers for Environmental Information, Monthly Global Climate Report for Annual 2023. January 2024. Available online: https://www.ncei.noaa.gov/access/monitoring/monthly-report/global/202313/supplemental/page-3 (accessed on 20 August 2024).
- Hatsuzuka, D.; Sato, T. Impact of SST on present and future extreme precipitation in Hokkaido investigated considering weather patterns. J. Geophys. Res. Atmos. 2022, 127, e2021JD036120. [Google Scholar] [CrossRef]
- Christensen, J.H.; Hewitson, B.; Busuioc, A.; Chen, A.; Gao, X.; Held, I.; Jones, R.; Kolli, R.K.; Kwon, W.-T.; Laprise, R.; et al. Regional climate projections. In Climate Change 2007: The Physical Science Basis. Contribution of Working Group I to the Fourth Assessment Report of the Intergovernmental Panel on ClimateChange; Solomon, S., Qin, D., Manning, M., Chen, Z., Marquis, M., Averyt, K.B., Tignor, M., Miller, H.L., Eds.; Cambridge University Press: Cambridge, UK; New York, NK, USA, 2007. [Google Scholar]
- Deque, M.; Rowell, D.; Luthi, D.; Giorgi, F.; Christensen, J.; Rockel, B.; Jacob, D.; Kjellstrom, E.; De Castro, M.; Van Den Hurk, B. An intercomparison of regional climate simulations for Europe: Assessing uncertainties in model projections. Clim. Chang. 2007, 81, 53–70. [Google Scholar] [CrossRef]
- Tolika, K.; Maheras, P.; Tegoulias, I. Extreme temperatures in Greece during 2007: Could this be a “return to the future”? Geophys. Res. Lett. 2009, 36, L10813. [Google Scholar] [CrossRef]
- Pastor, F.; Valiente, J.A.; Khodayar, S. A Warming Mediterranean: 38 Years of Increasing Sea Surface Temperature. Remote Sens. 2020, 12, 2687. [Google Scholar] [CrossRef]
- Pörtner, H.O.; Knust, R. Climate change affects marine fishes through the oxygen limitation of thermal tolerance. Science 2007, 315, 95–97. [Google Scholar] [CrossRef] [PubMed]
- Scharsack, J.P.; Franke, F. Temperature effects on teleost immunity in the light of climate change. J. Fish Biol. 2022, 101, 780–796. [Google Scholar] [CrossRef] [PubMed]
- Atalah, J.; Ibañez, S.; Aixalà, L.; Barber, X.; Sánchez-Jerez, P. Marine heatwaves in the western Mediterranean: Considerations for coastal aquaculture adaptation. Aquaculture 2024, 588, 740917. [Google Scholar] [CrossRef]
- Deitch, M.J.; Sapundjieff, M.J.; Feirer, S.T. Characterizing Precipitation Variability and Trends in the World’s Mediterranean-Climate Areas. Water 2017, 9, 259. [Google Scholar] [CrossRef]
- Chiaravalloti, F.; Caloiero, T.; Coscarelli, R. The Long-Term ERA5 Data Series for Trend Analysis of Rainfall in Italy. Hydrology 2022, 9, 18. [Google Scholar] [CrossRef]


Disclaimer/Publisher’s Note: The statements, opinions and data contained in all publications are solely those of the individual author(s) and contributor(s) and not of MDPI and/or the editor(s). MDPI and/or the editor(s) disclaim responsibility for any injury to people or property resulting from any ideas, methods, instructions or products referred to in the content. |
© 2024 by the authors. Licensee MDPI, Basel, Switzerland. This article is an open access article distributed under the terms and conditions of the Creative Commons Attribution (CC BY) license (https://creativecommons.org/licenses/by/4.0/).
Share and Cite
Lagouvardos, K.; Dafis, S.; Kotroni, V.; Kyros, G.; Giannaros, C. Exploring Recent (1991–2020) Trends of Essential Climate Variables in Greece. Atmosphere 2024, 15, 1104. https://doi.org/10.3390/atmos15091104
Lagouvardos K, Dafis S, Kotroni V, Kyros G, Giannaros C. Exploring Recent (1991–2020) Trends of Essential Climate Variables in Greece. Atmosphere. 2024; 15(9):1104. https://doi.org/10.3390/atmos15091104
Chicago/Turabian StyleLagouvardos, Konstantinos, Stavros Dafis, Vassiliki Kotroni, George Kyros, and Christos Giannaros. 2024. "Exploring Recent (1991–2020) Trends of Essential Climate Variables in Greece" Atmosphere 15, no. 9: 1104. https://doi.org/10.3390/atmos15091104