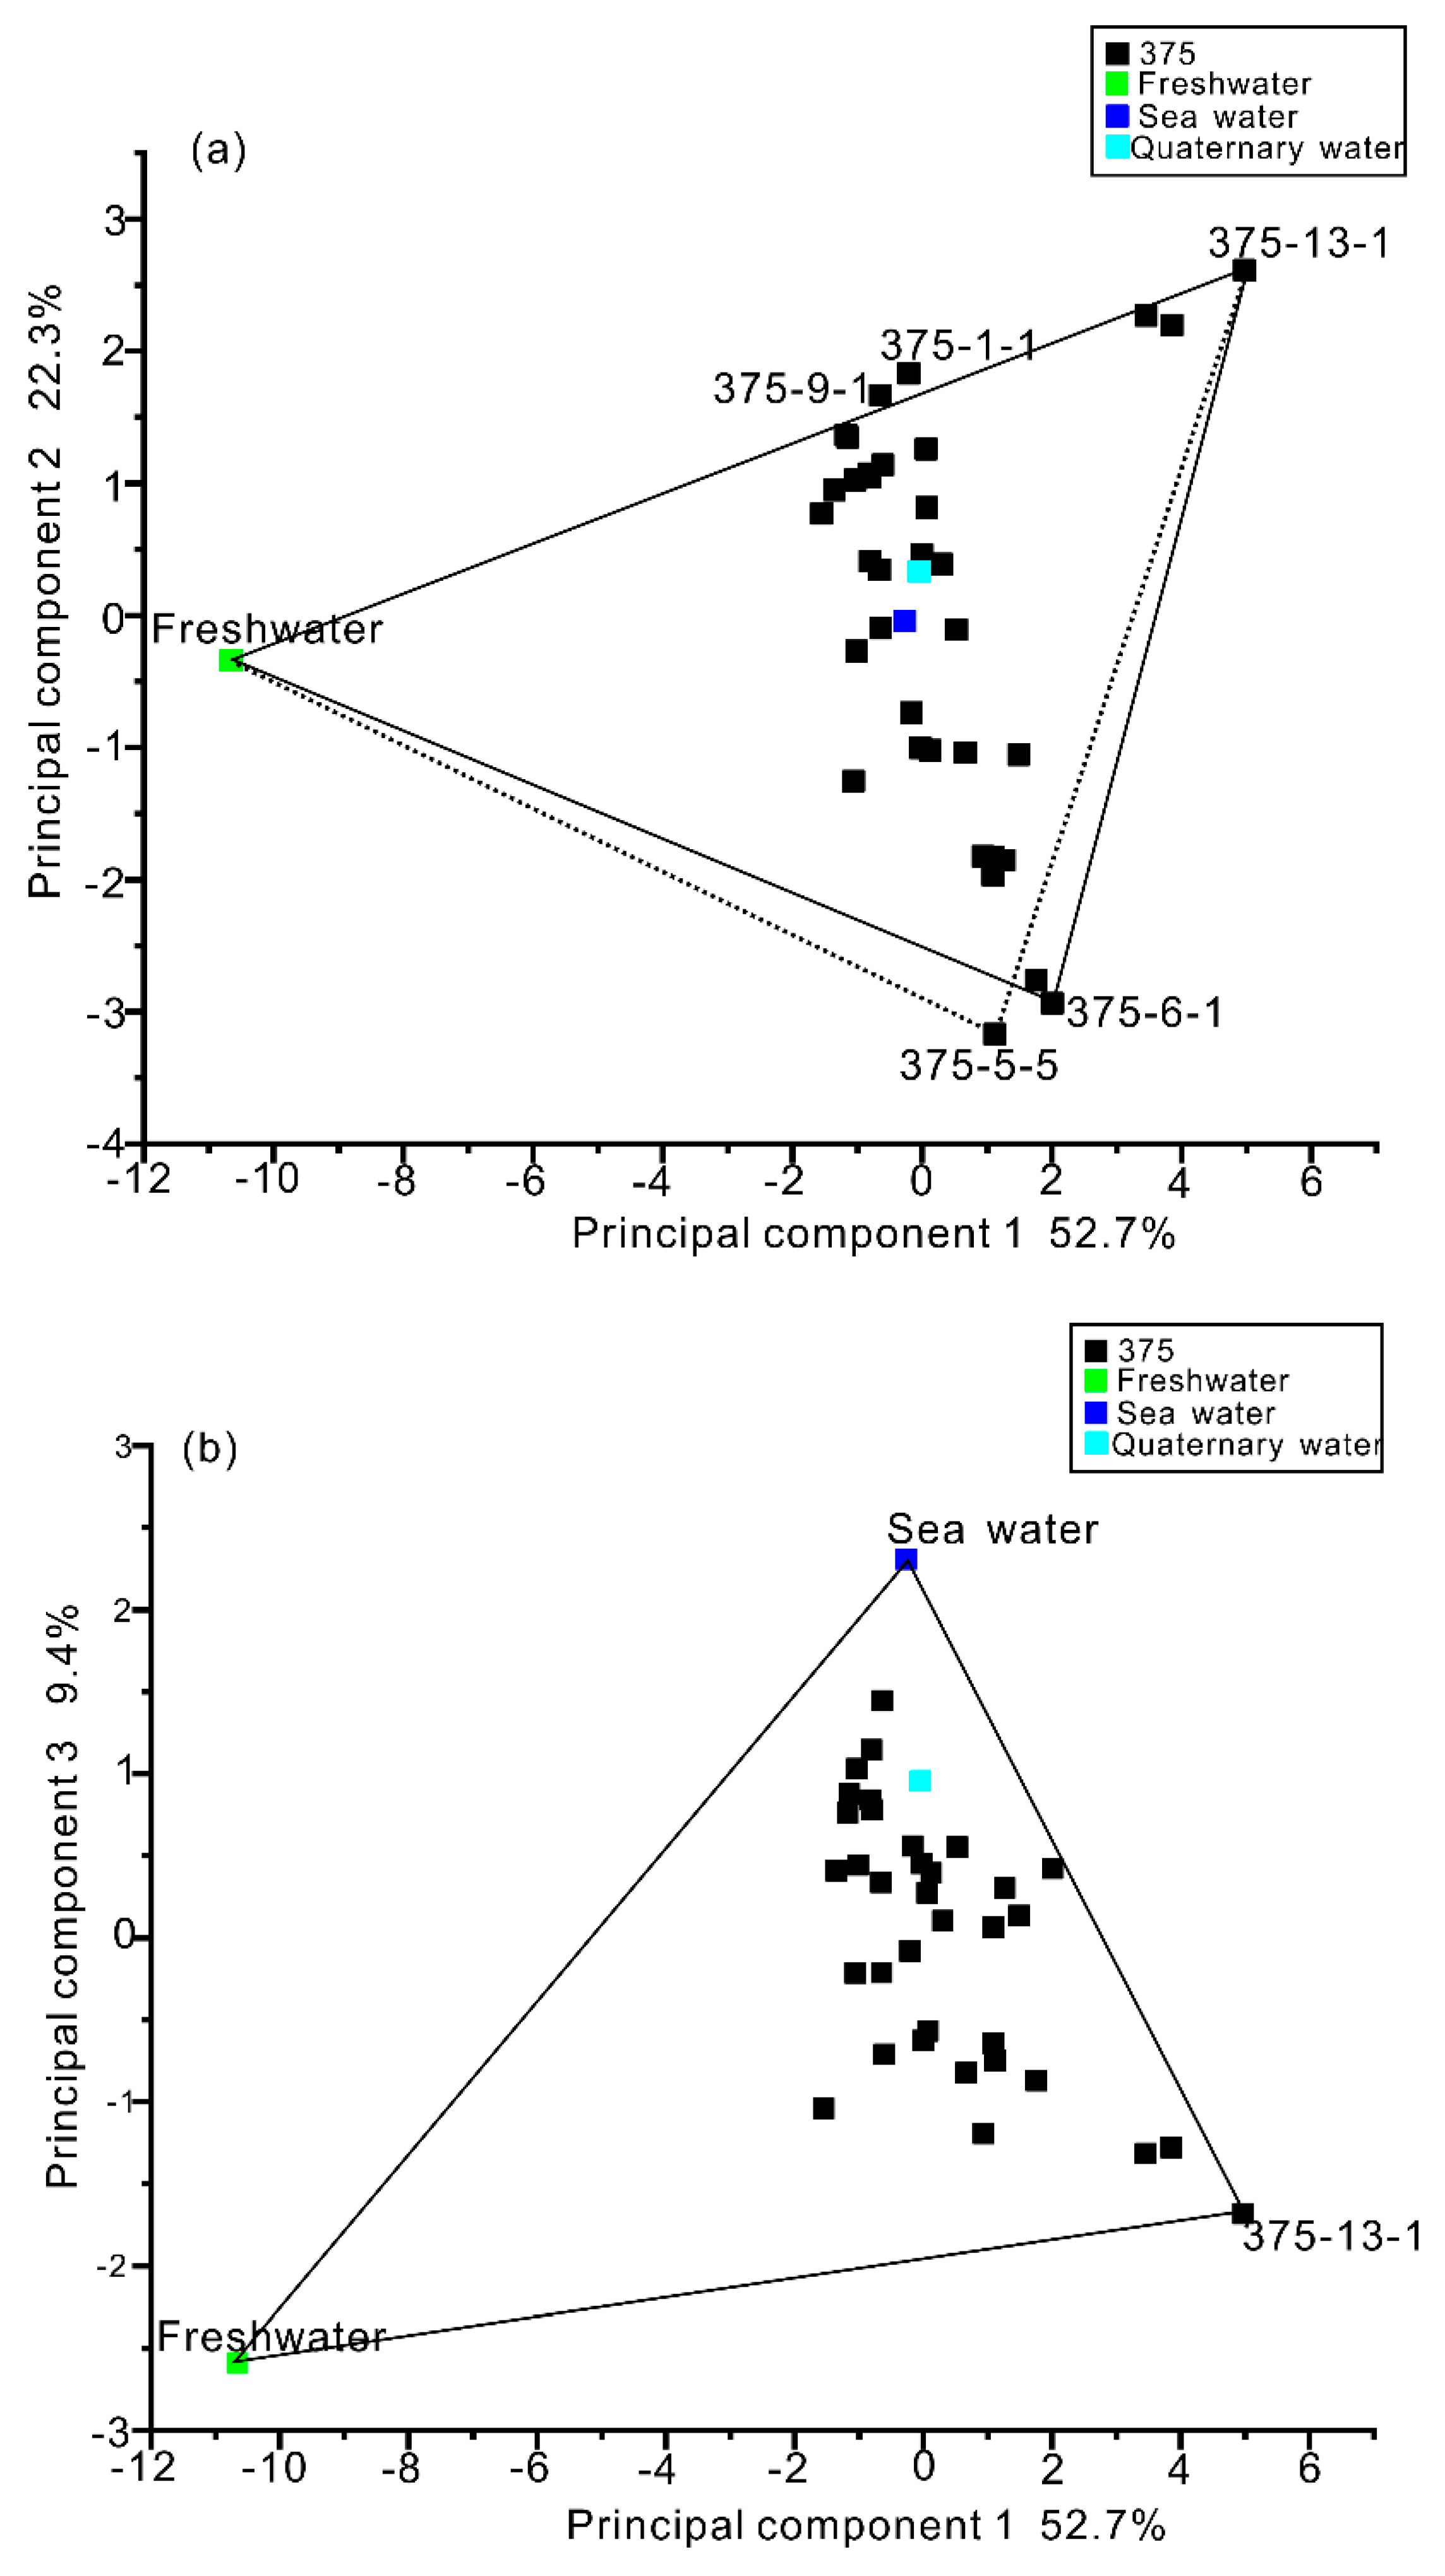
On the basis of local hydrogeological conditions, previous studies, and the results from scenarios 1, 2 and 3, seawater and freshwater could be identified as the two main water sources (end-members) in the study area. In these three scenarios, there was another possible water sample: quaternary water. Many scholars studying the region have used quaternary water as a water source. However, in this research, quaternary water was not revealed to be a water source. Depending on the hydrogeological conditions, quaternary water is mainly recharged from seawater and atmospheric precipitation. It also has the characteristics of seawater and freshwater. Importantly, the quaternary water sample here did not have extreme values and was relatively far from the extreme-value points on the scatterplots of the principal component scores. This all demonstrated that quaternary water was not suitable for selection as a water source (end-member).
5.1. Choice of End-Members in the PCA and HCA Models
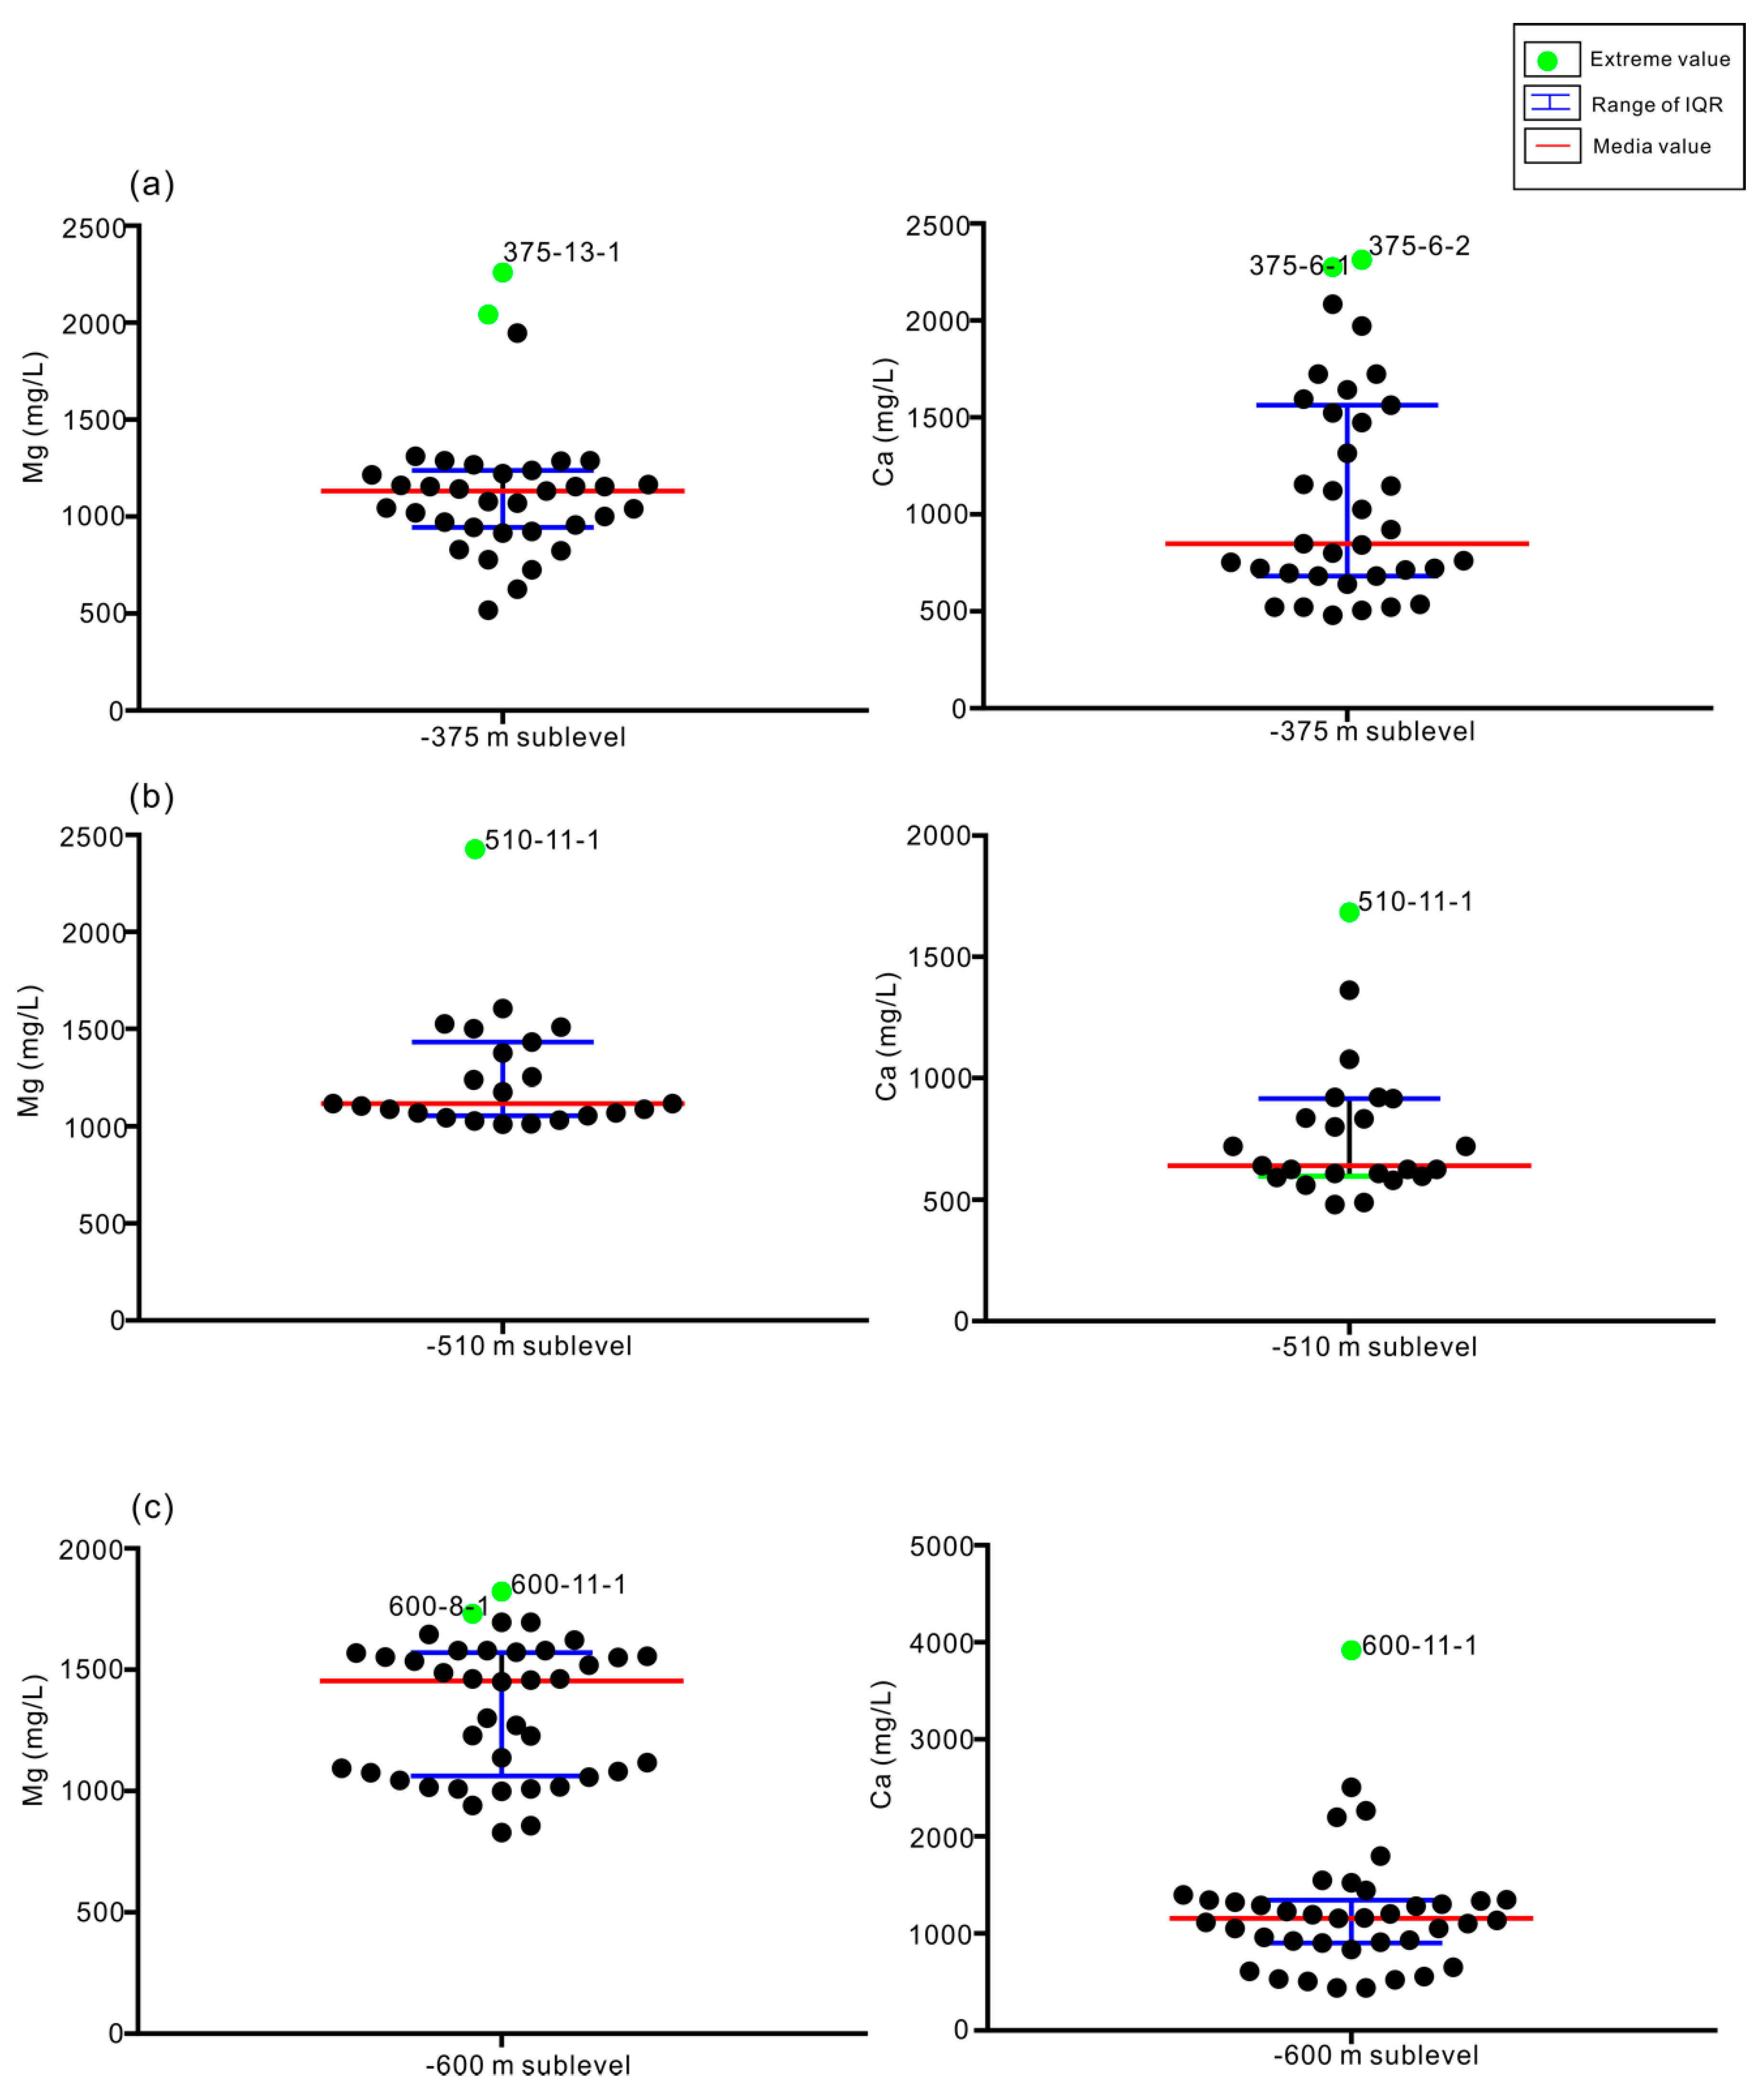
There are two types of groundwater in the rock fractures of the Xishan gold mine: Ca-rich water and Mg-rich water [
37]. The chemical compositions of these two types of water evolved from quaternary water, freshwater, and sea water. Mining operations and artificial drainage not only accelerate the groundwater flow rate and then enrich the quaternary water, freshwater, and sea water, but also cause an ion exchange reaction that removes the calcium in the potassium feldspar and the magnesium in the hornblende. In
Figure 10, it can be seen that there were some water samples (375-13-1, 510-11-1, and 600-11-1) that contained Mg-extreme values and some water samples (375-6-1, 375-6-2, 510-11-1, and 600-11-1) that contained Ca-extreme values. By comparing
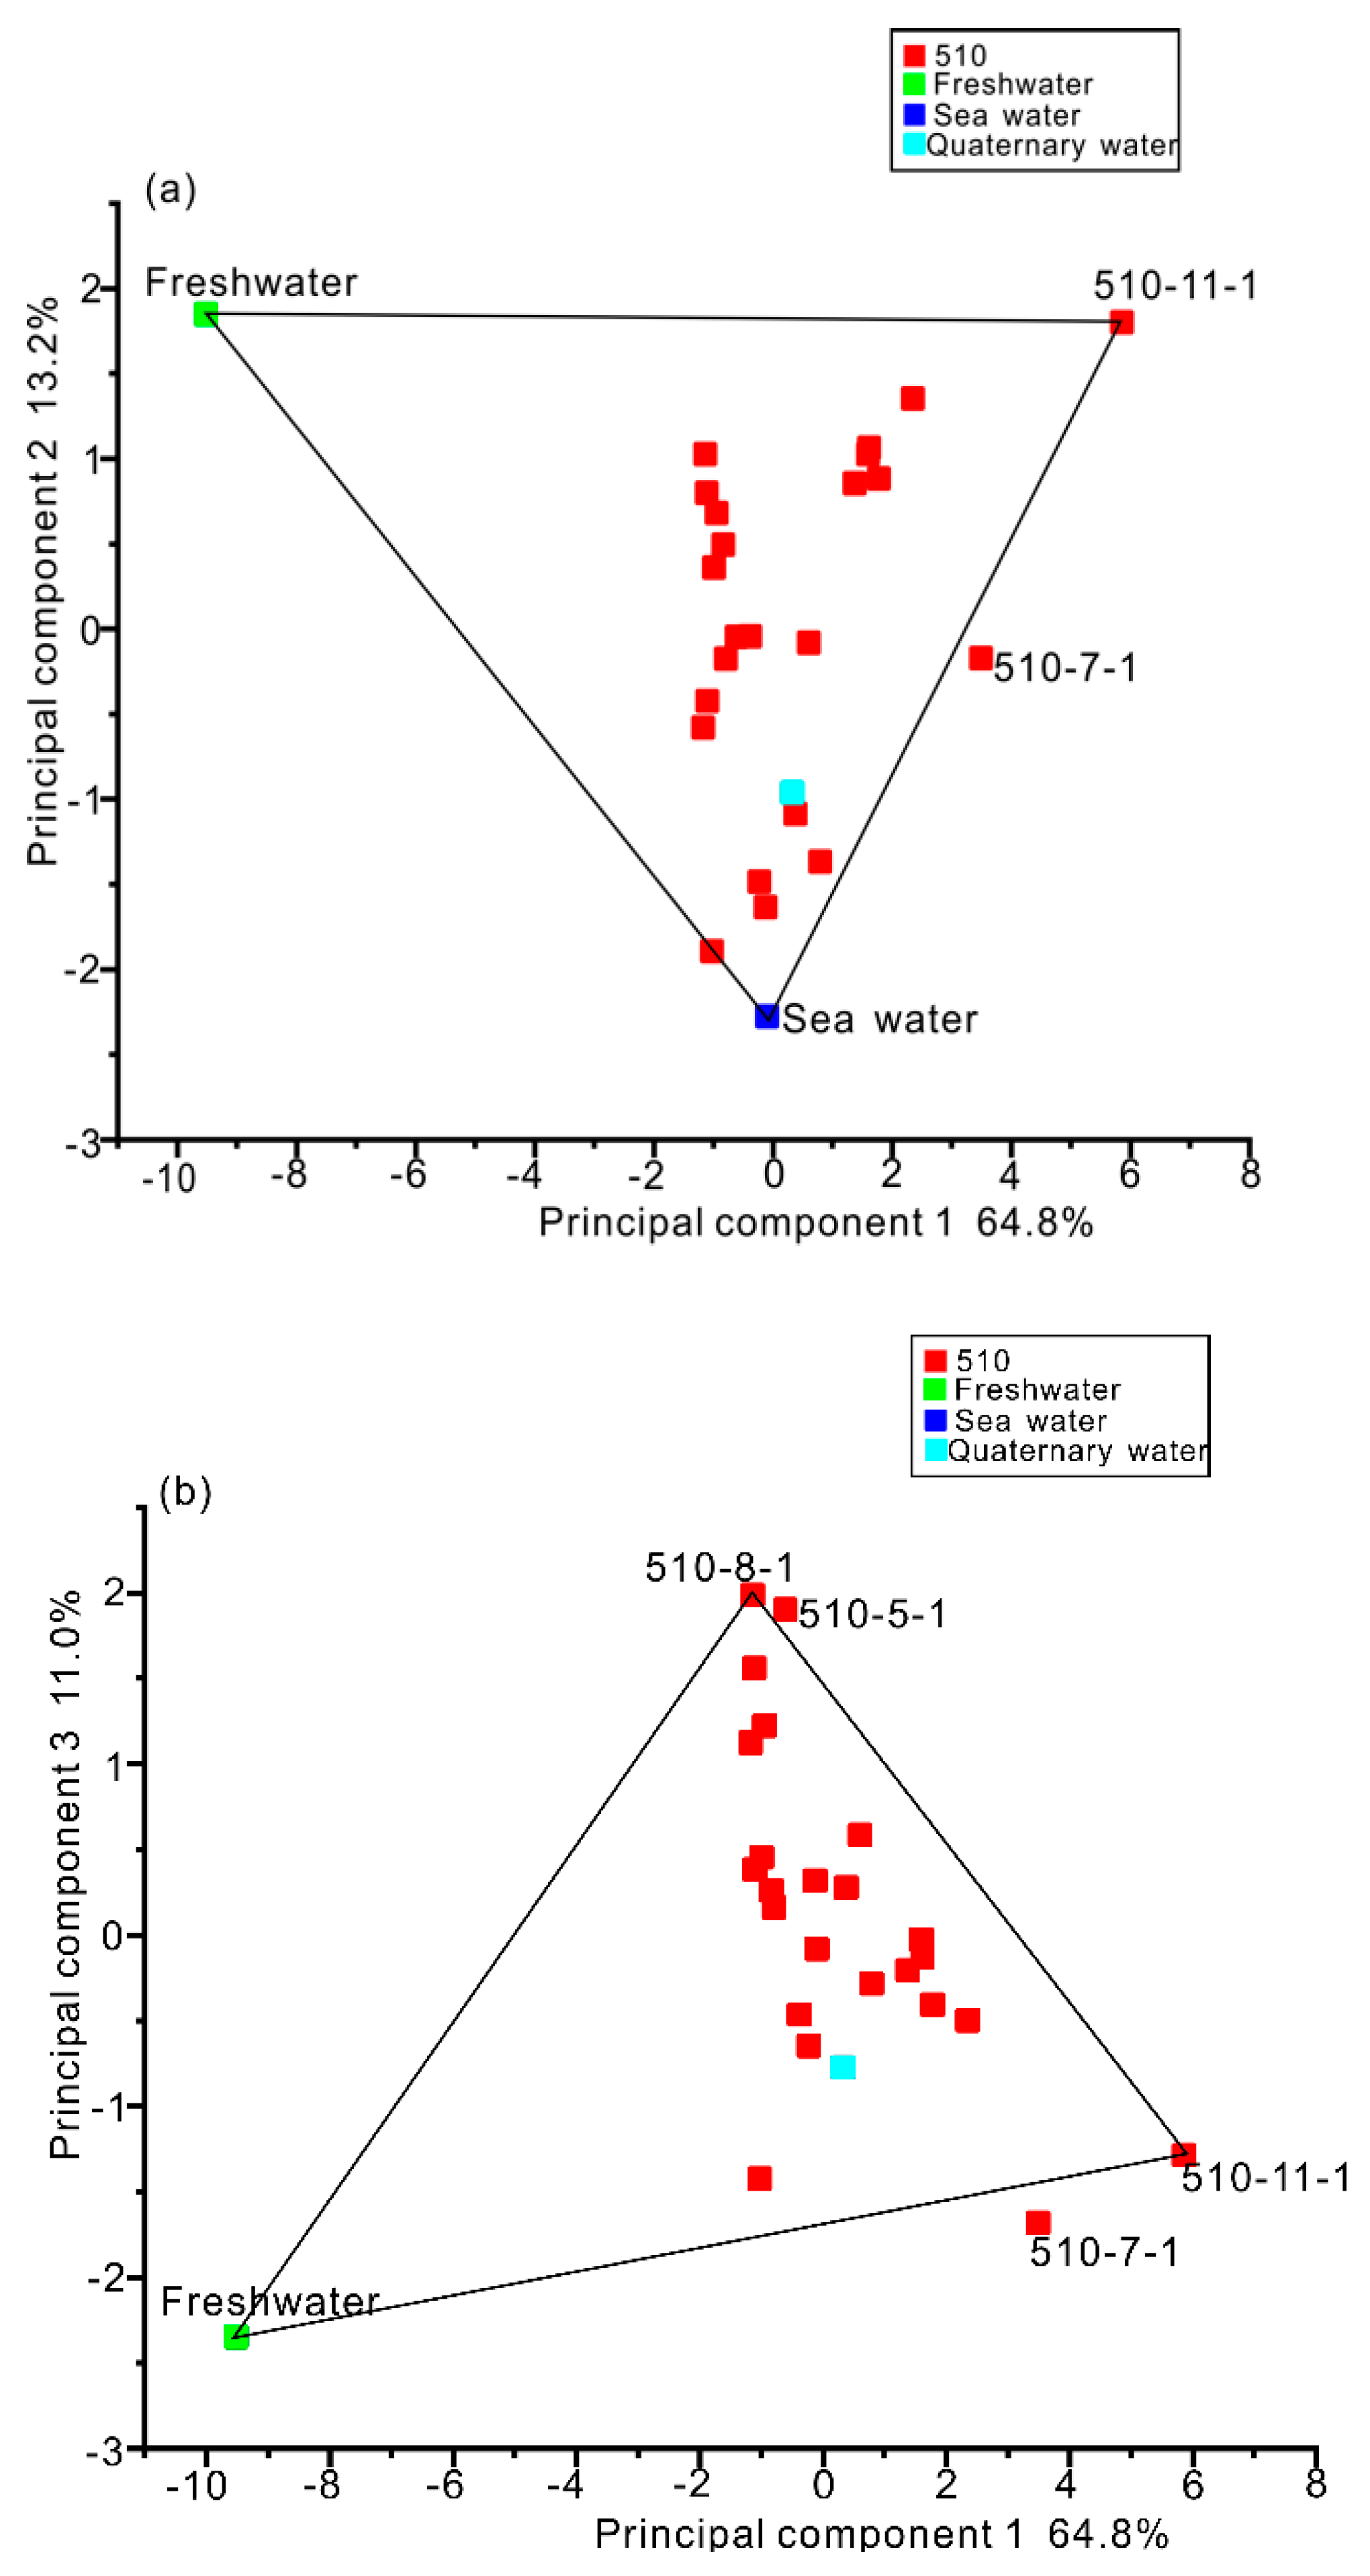
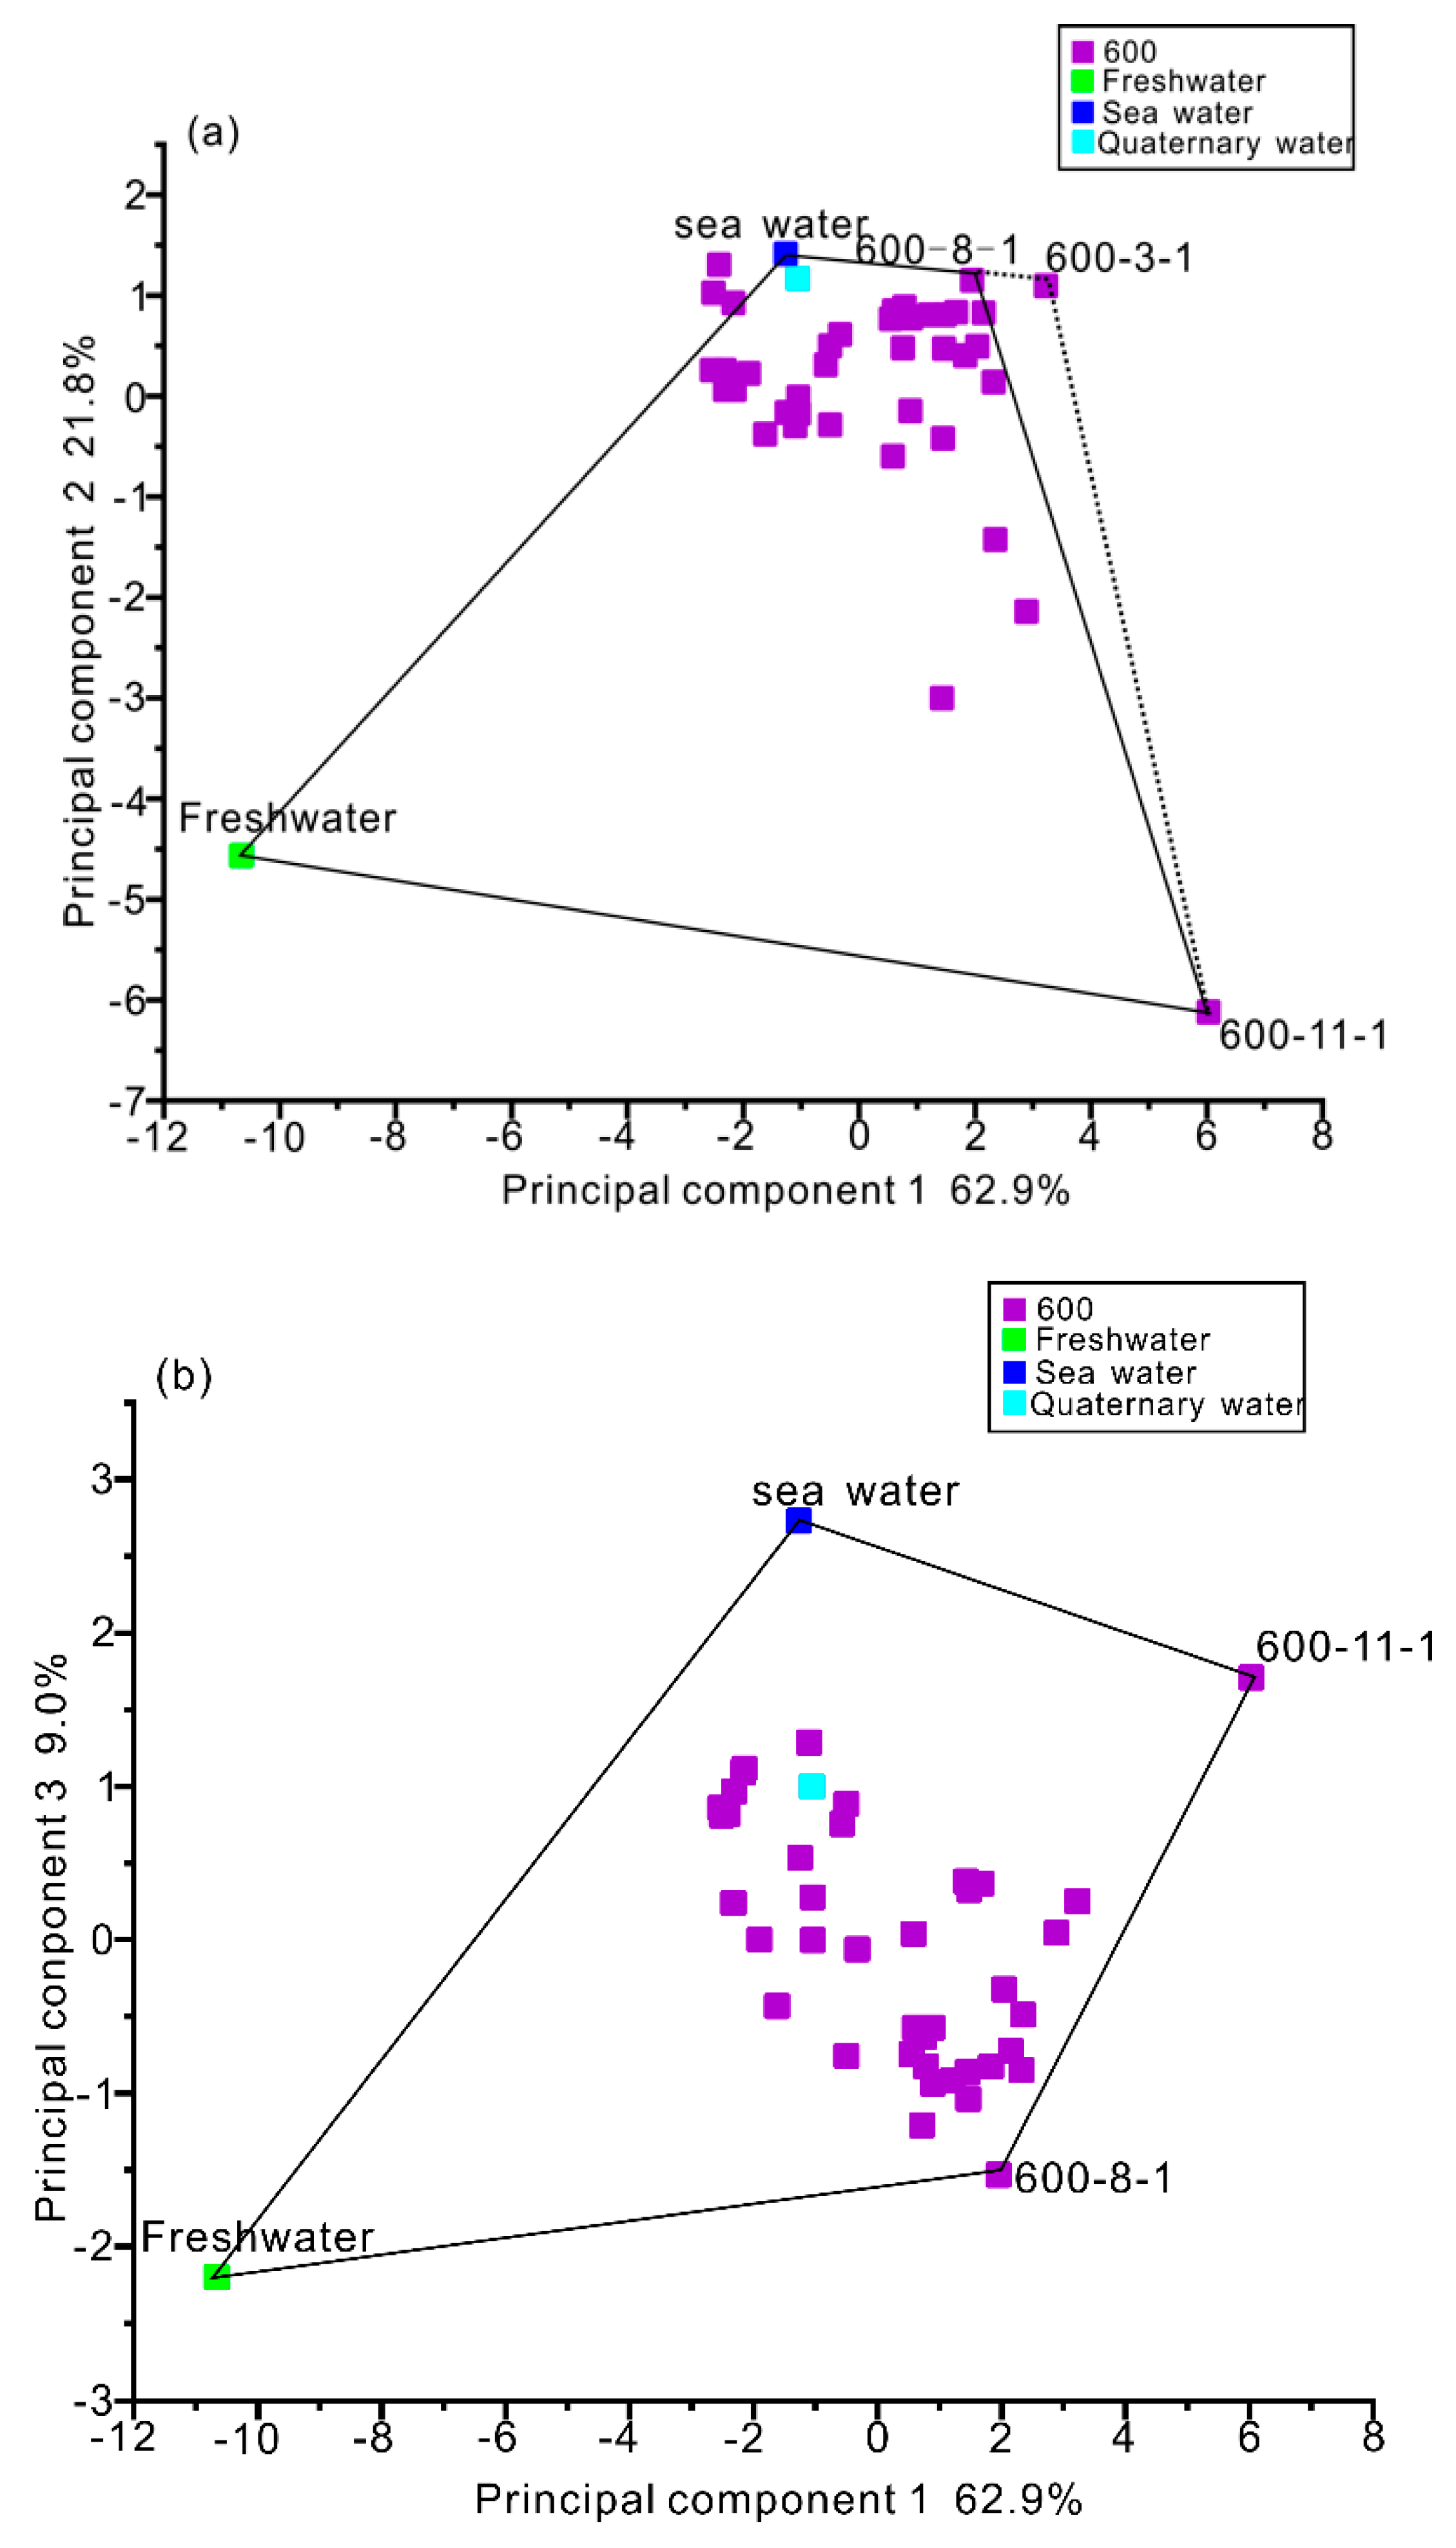
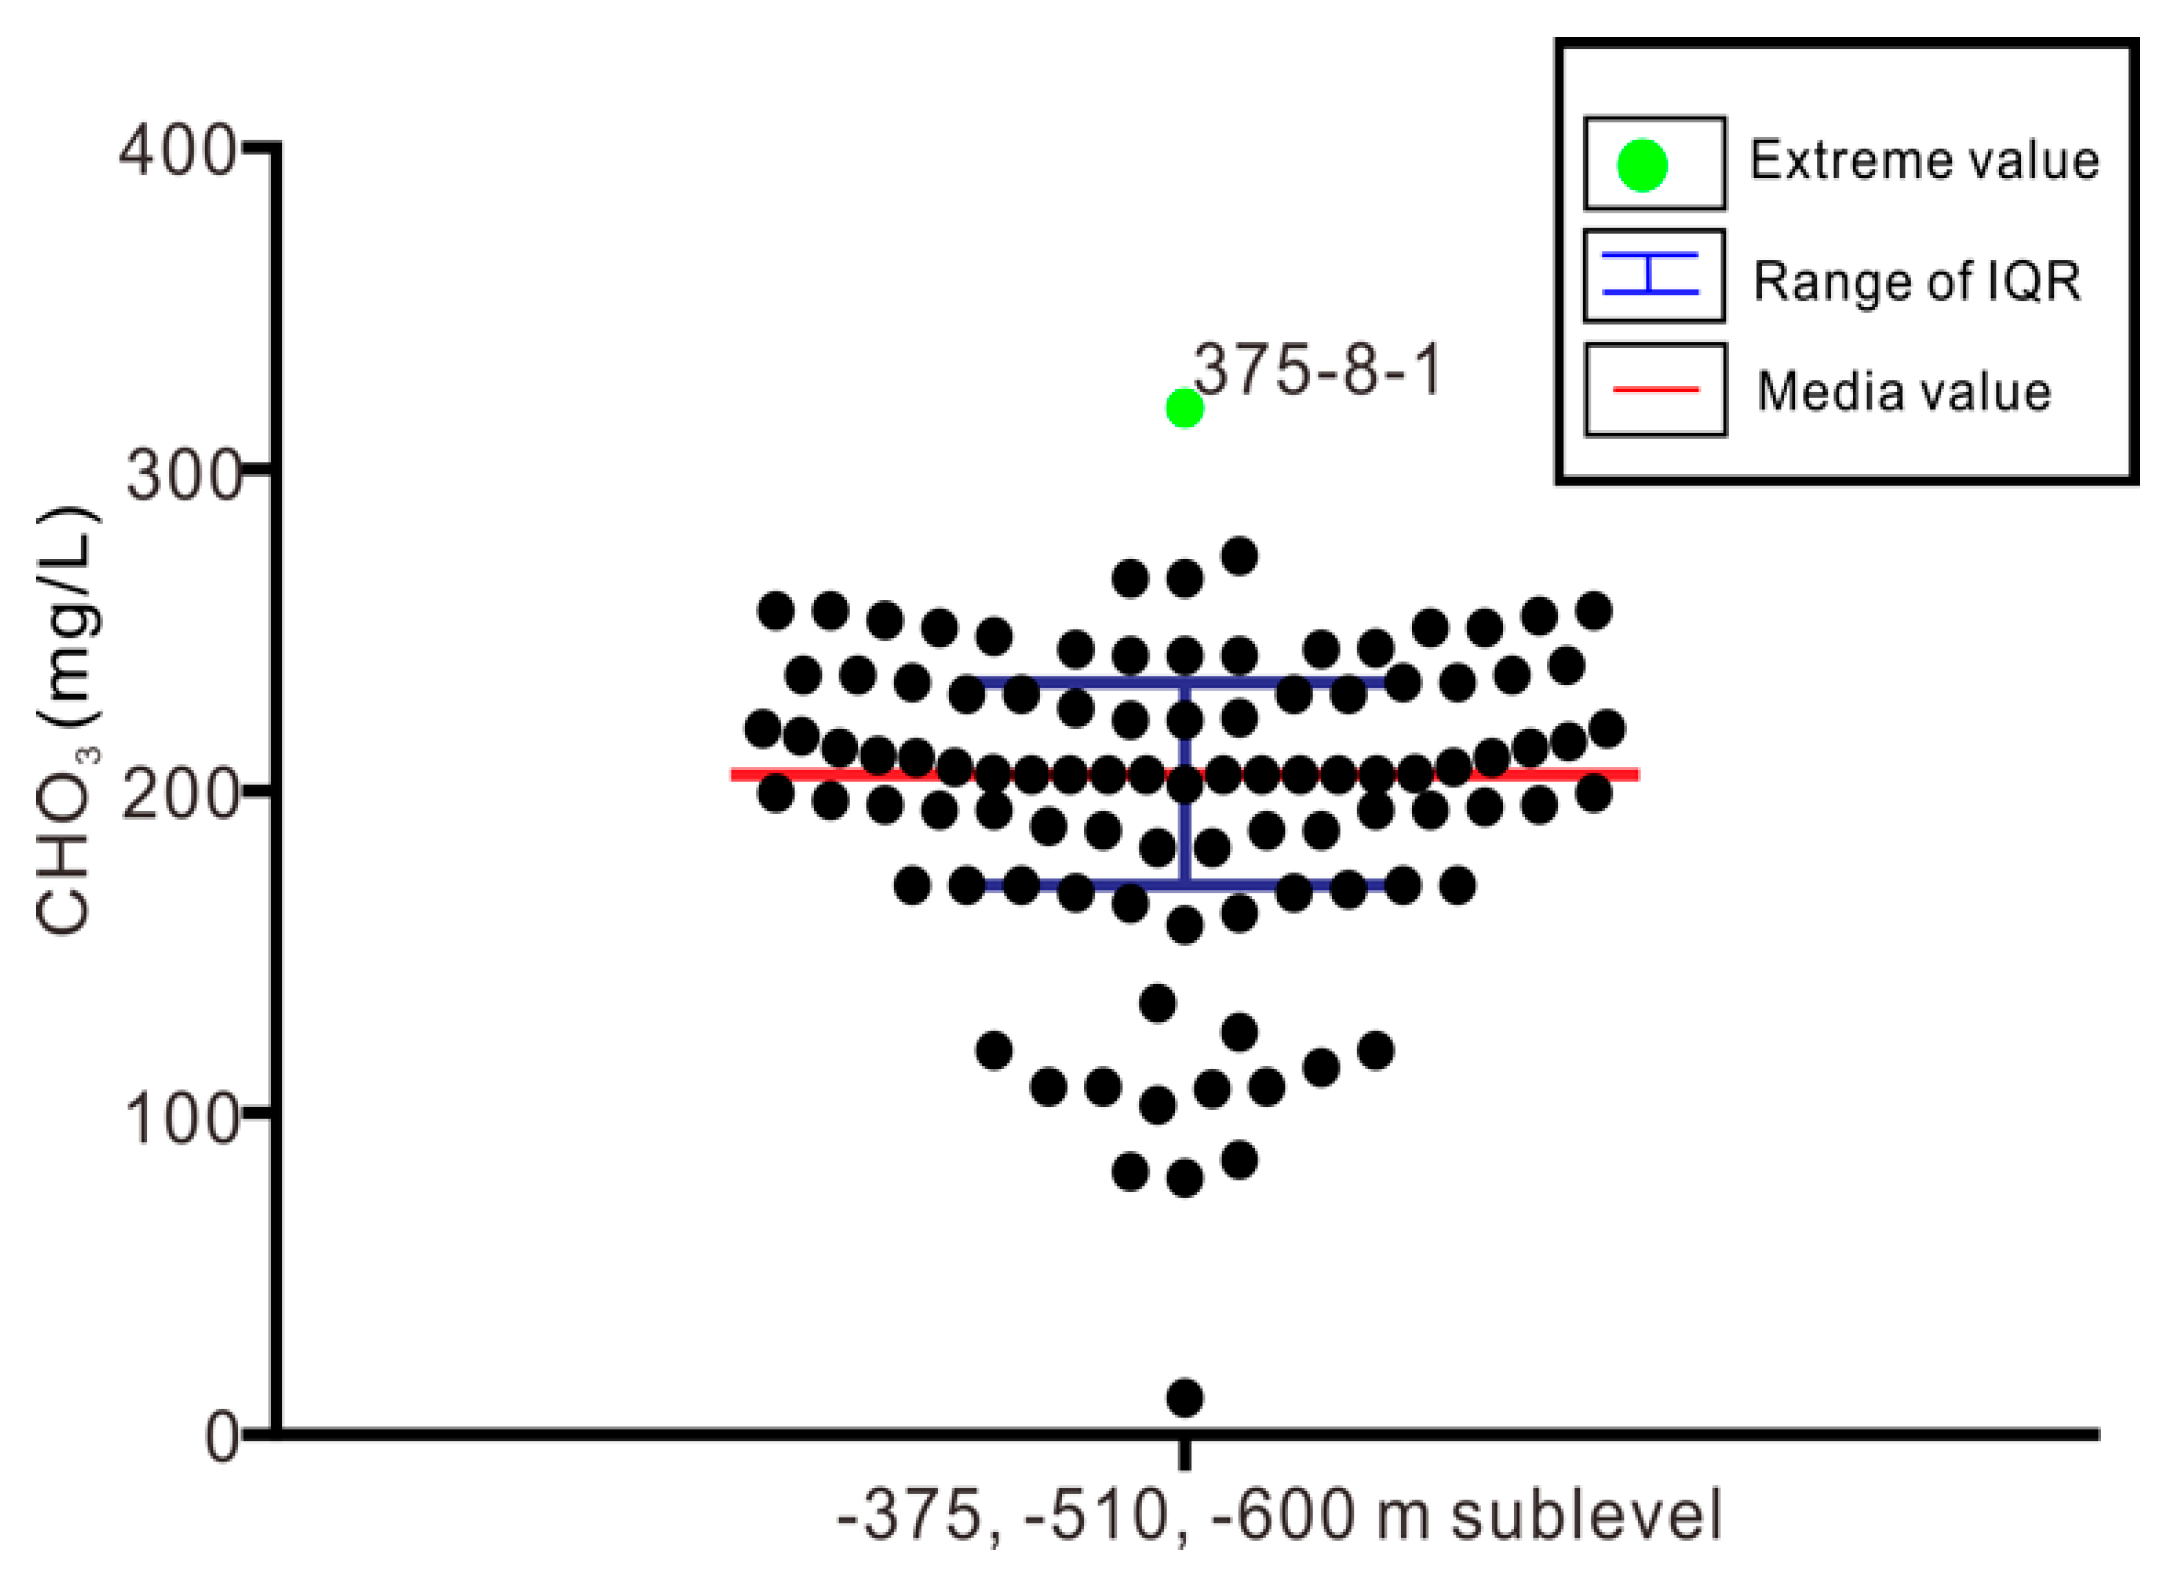
Figure 10 to the results of the PCA and HCA, it was easily found that the two results confirmed each other. It was reasonable to select seawater, freshwater, 375-6-1, and 375-11-1 at the −375-m sublevel; seawater, freshwater, and 510-11-1 at the −510-m sublevel; and seawater, freshwater, 600-8-1, and 600-11-1 at the −600-m sublevel (510-11-1 and 600-11-1 were rich in calcium and magnesium). Here, the water sample 510-8-1 was unique and was not consistent with the PCA and HCA analyses. Principal component 3 accounted for 11.0% of the information from the original variables, with significant loading of pH and HCO
3−. Moreover, 510-8-1 contained the highest value of HCO
3− of all the collected water samples (
Figure 11). Thus, it was also reasonable to select 510-8-1 as an end-member at the −510-m sublevel. The reasons for the high content of HCO
3− were that volatile components, including water, carbon dioxide, and methane, exist in the Sanshandao gold mine; beresite and lamprophyre are the main rocks containing carbonate minerals; and Quaternary water and freshwater containing CO
2 flow into the fractures [
38].
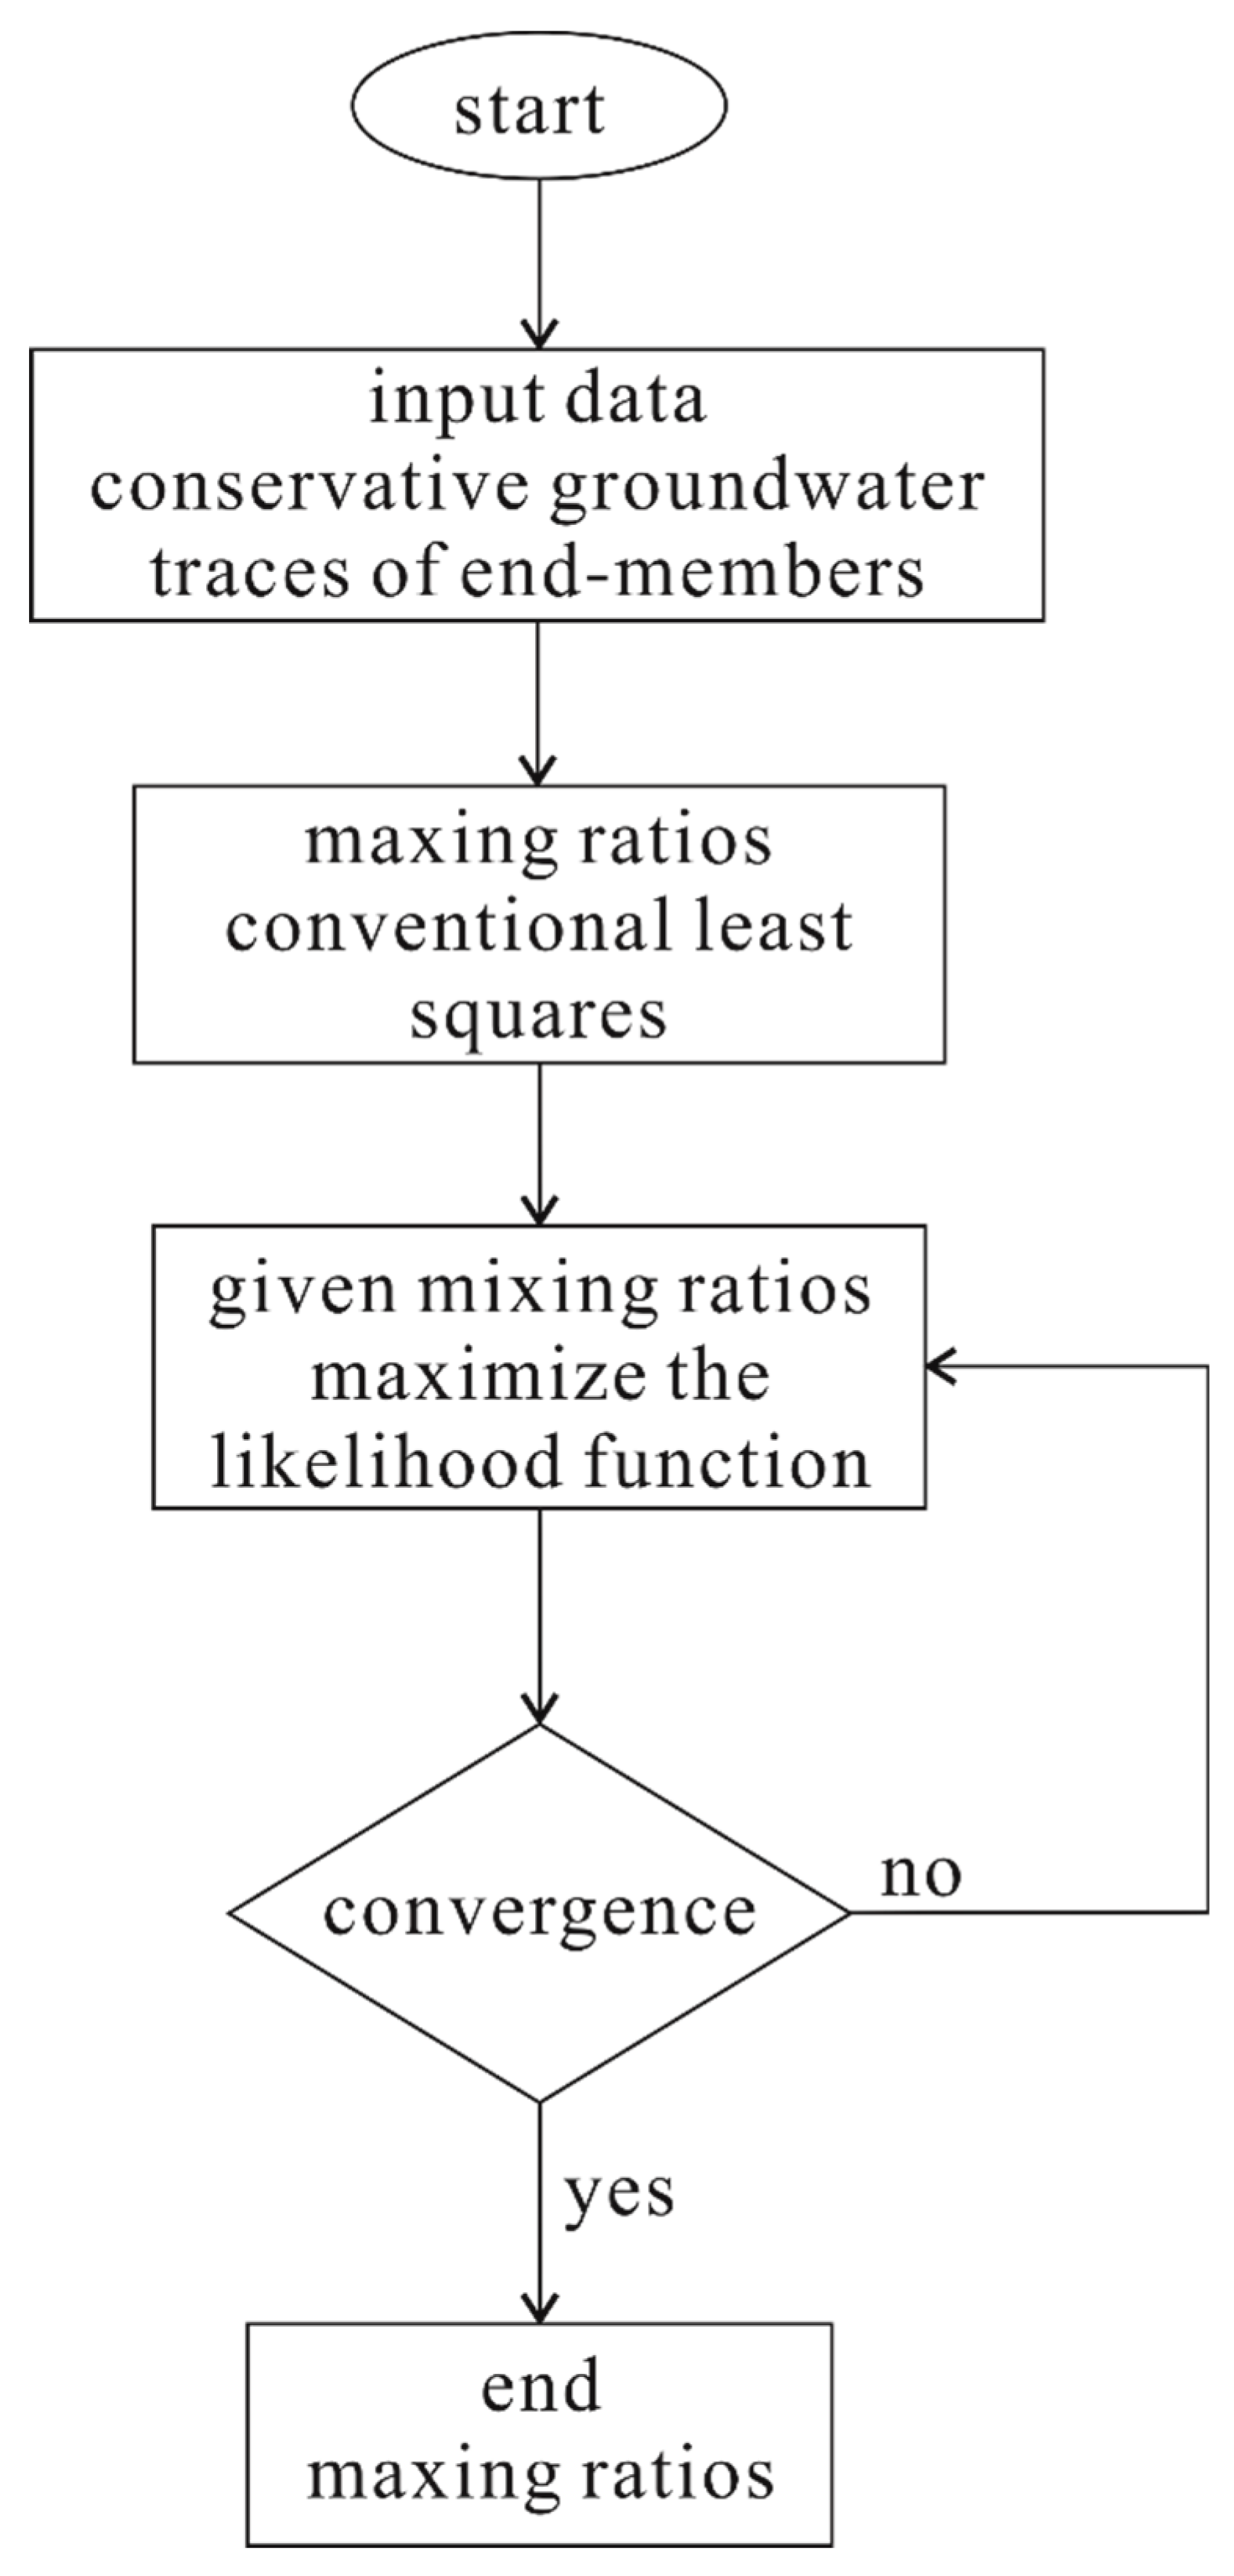
5.2. Choice of Conservative Groundwater Tracers in the EMMA Model
The stable isotopes of water (δ
18O and δ
2H) are usually used as conservative groundwater tracers to estimate the proportions of water mixes [
9,
11,
12]. In our research in the tunnels of the Xishan gold mine, four end-members were identified. According to Equation (2), there should be three tracers used to obtain mix sources (end-members). Here, the authors chose Cl
− as another tracer to estimate the mixing ratios. Ten parameters were used to estimate the mix proportions of the water samples.
Table 4 shows the principal component loadings of all of the original variables. The table demonstrates that Cl
− had extremely high loadings in PC1s, which explains most of the hydrochemical information in the datasets collected from the three sublevels (0.978, 0.967, and 0.990).
Table 5,
Table 6 and
Table 7 show a Person correlation matrix of the ten variables. They demonstrate that Cl
− had a strong, positive correlation with five variables (Na
+, Ca
2+, Mg
2+, SO
42+, EC, and TDSes) and a strong, negative correlation with one variable (pH). Cl
− is nonvolatile, hydrologically mobile, and chemically inert, and it is assumed to be affected only by groundwater mixing [
11,
12,
20]. All of this accounts for why Cl
− was chosen as another conservative groundwater tracer.
5.3. Three-Dimensional Geological Model
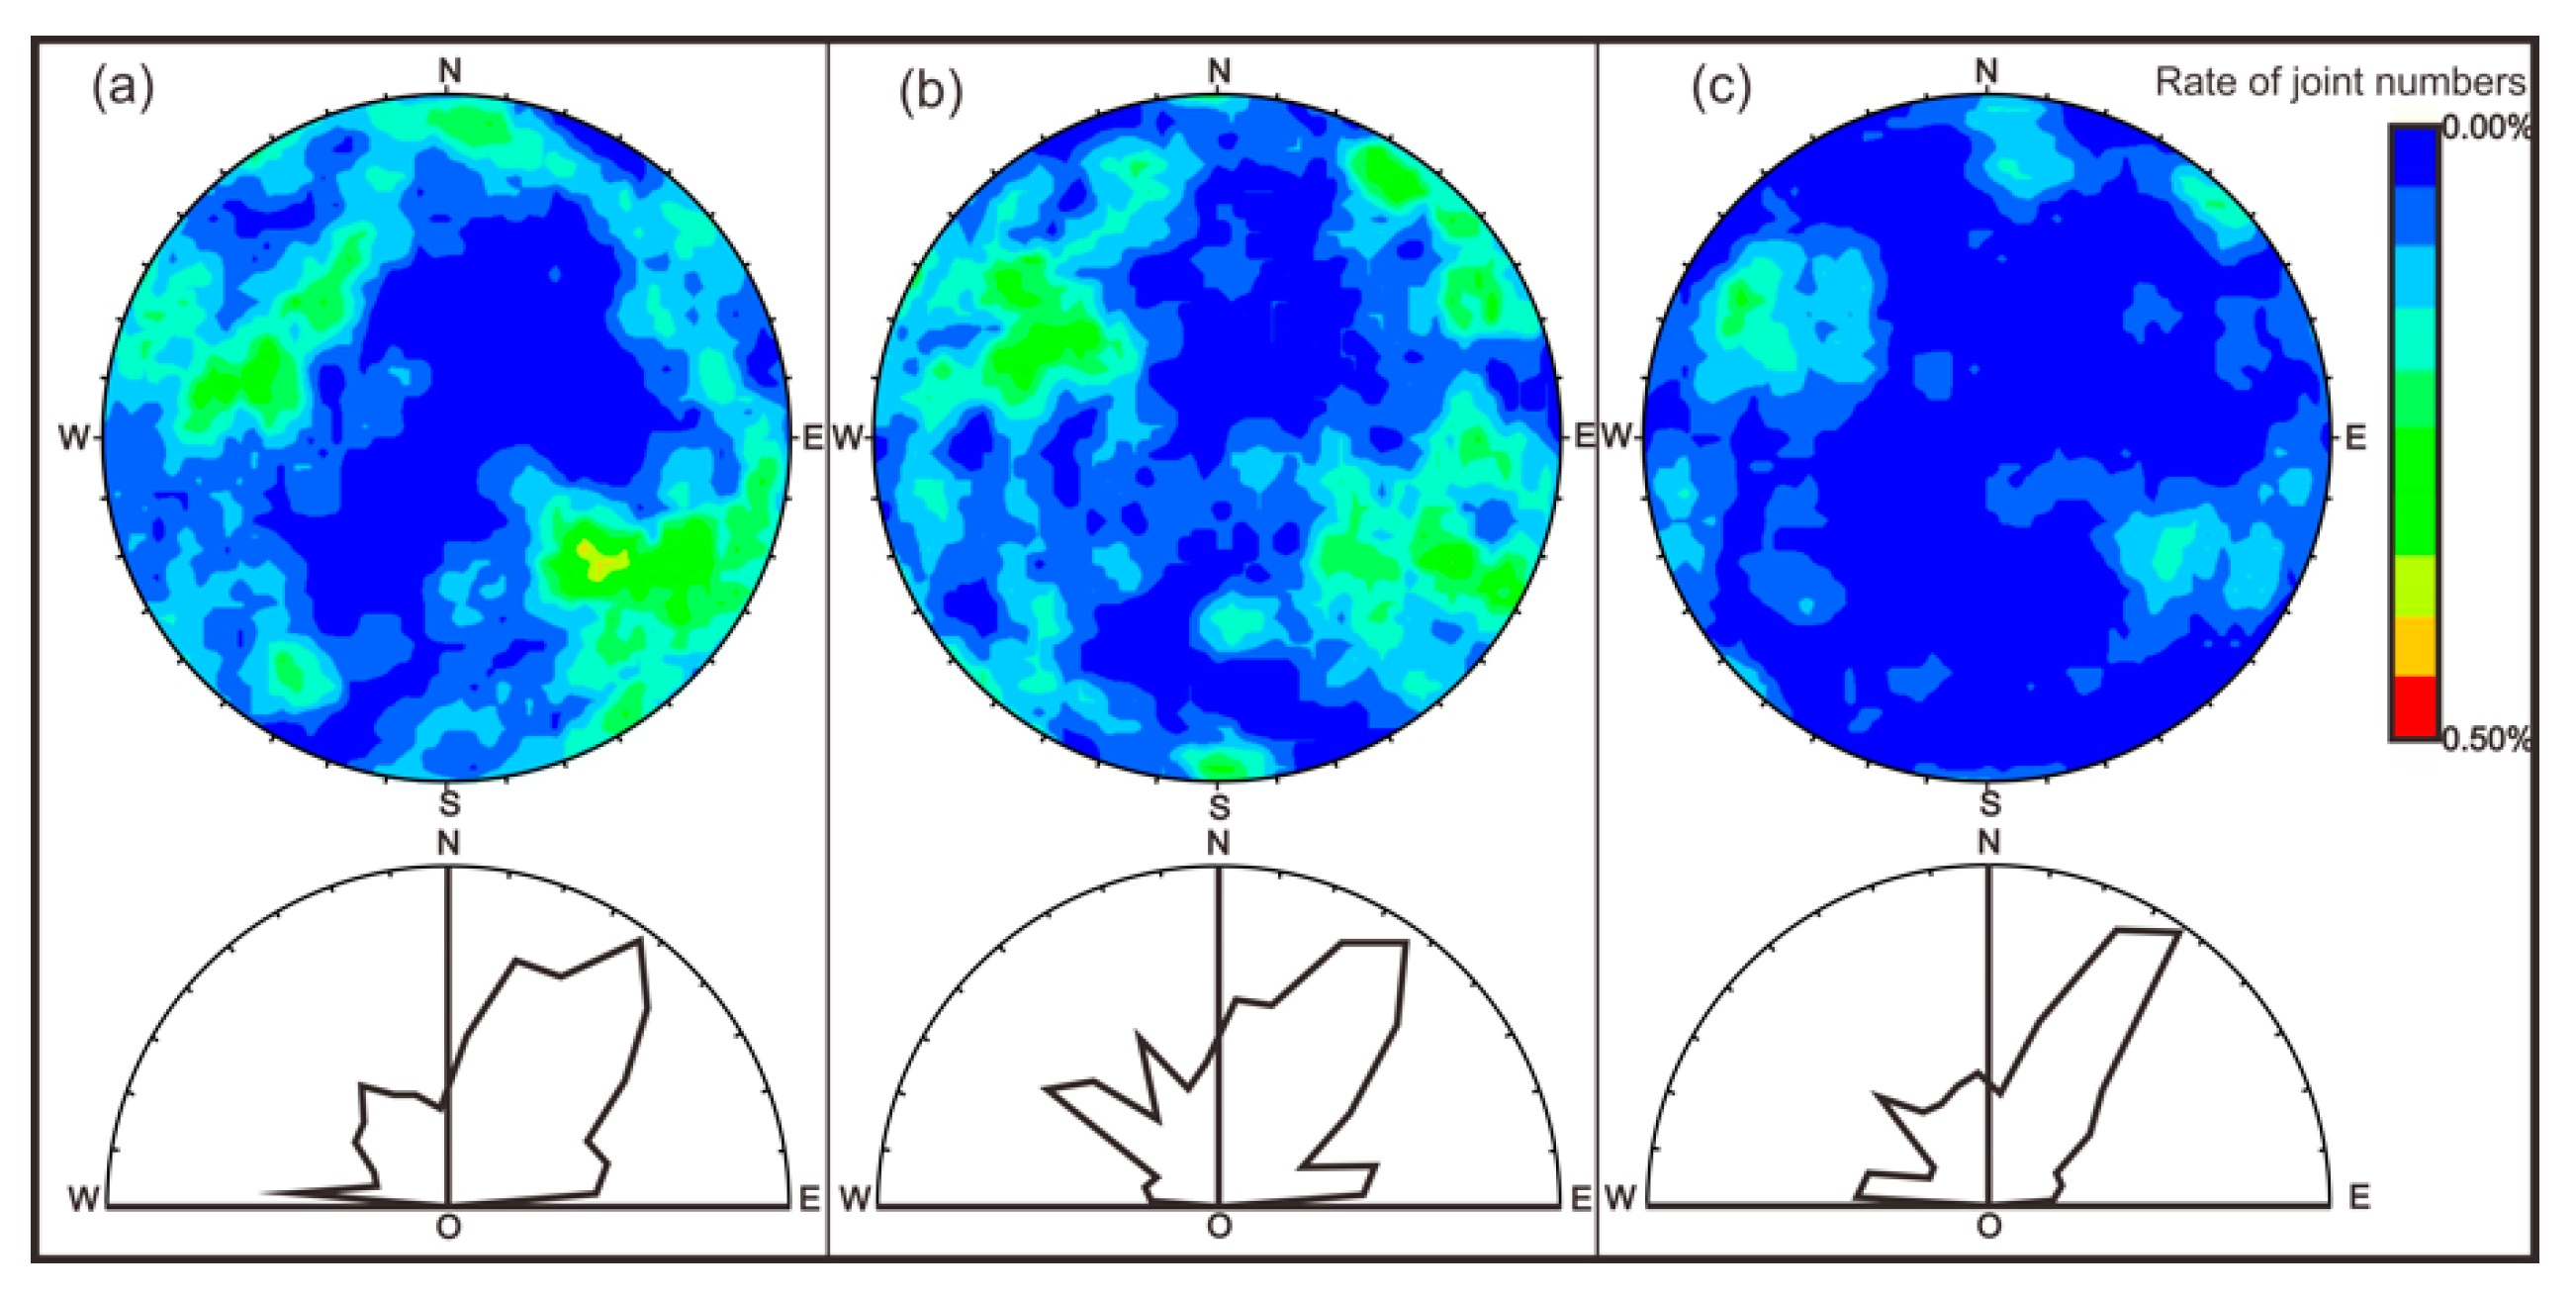
The validity of the EMMA model was further evaluated using fracture distribution law and a three-dimensional geological model. A field investigation of the fracture development characteristics of the area was valuable for studying the seepage channels and mixing ratios. Through years of measurements of the surrounding rock structures at the −375-m, −510-m, and −600-m sublevels, data from 1122 fractures (471, 391, and 260, respectively) were obtained, mainly on inclination, dip, crack spacing, and trace length. Using these data, rose diagrams of crack strike and pole contour maps of fracture inclination and dip were drawn (
Figure 12). As can be seen in
Figure 12, the strikes of the fractures in the three sublevels were mainly in a northeasterly direction and secondly in a northwesterly direction. These strikes were 15°–25° and 300°–320°, respectively. Moreover, there were a few fissure zones with an orientation angle between 270° and 280°. In
Figure 12, it can be seen that the tendency was stronger in the second and fourth quadrants than in the first and third quadrants. Meanwhile, the fissures oriented toward the north were consistent with the results presented by the strike graph. The dip angles of the multiple sets of fissures were larger, mostly above 60°, and were concentrated between 70° and 90°.
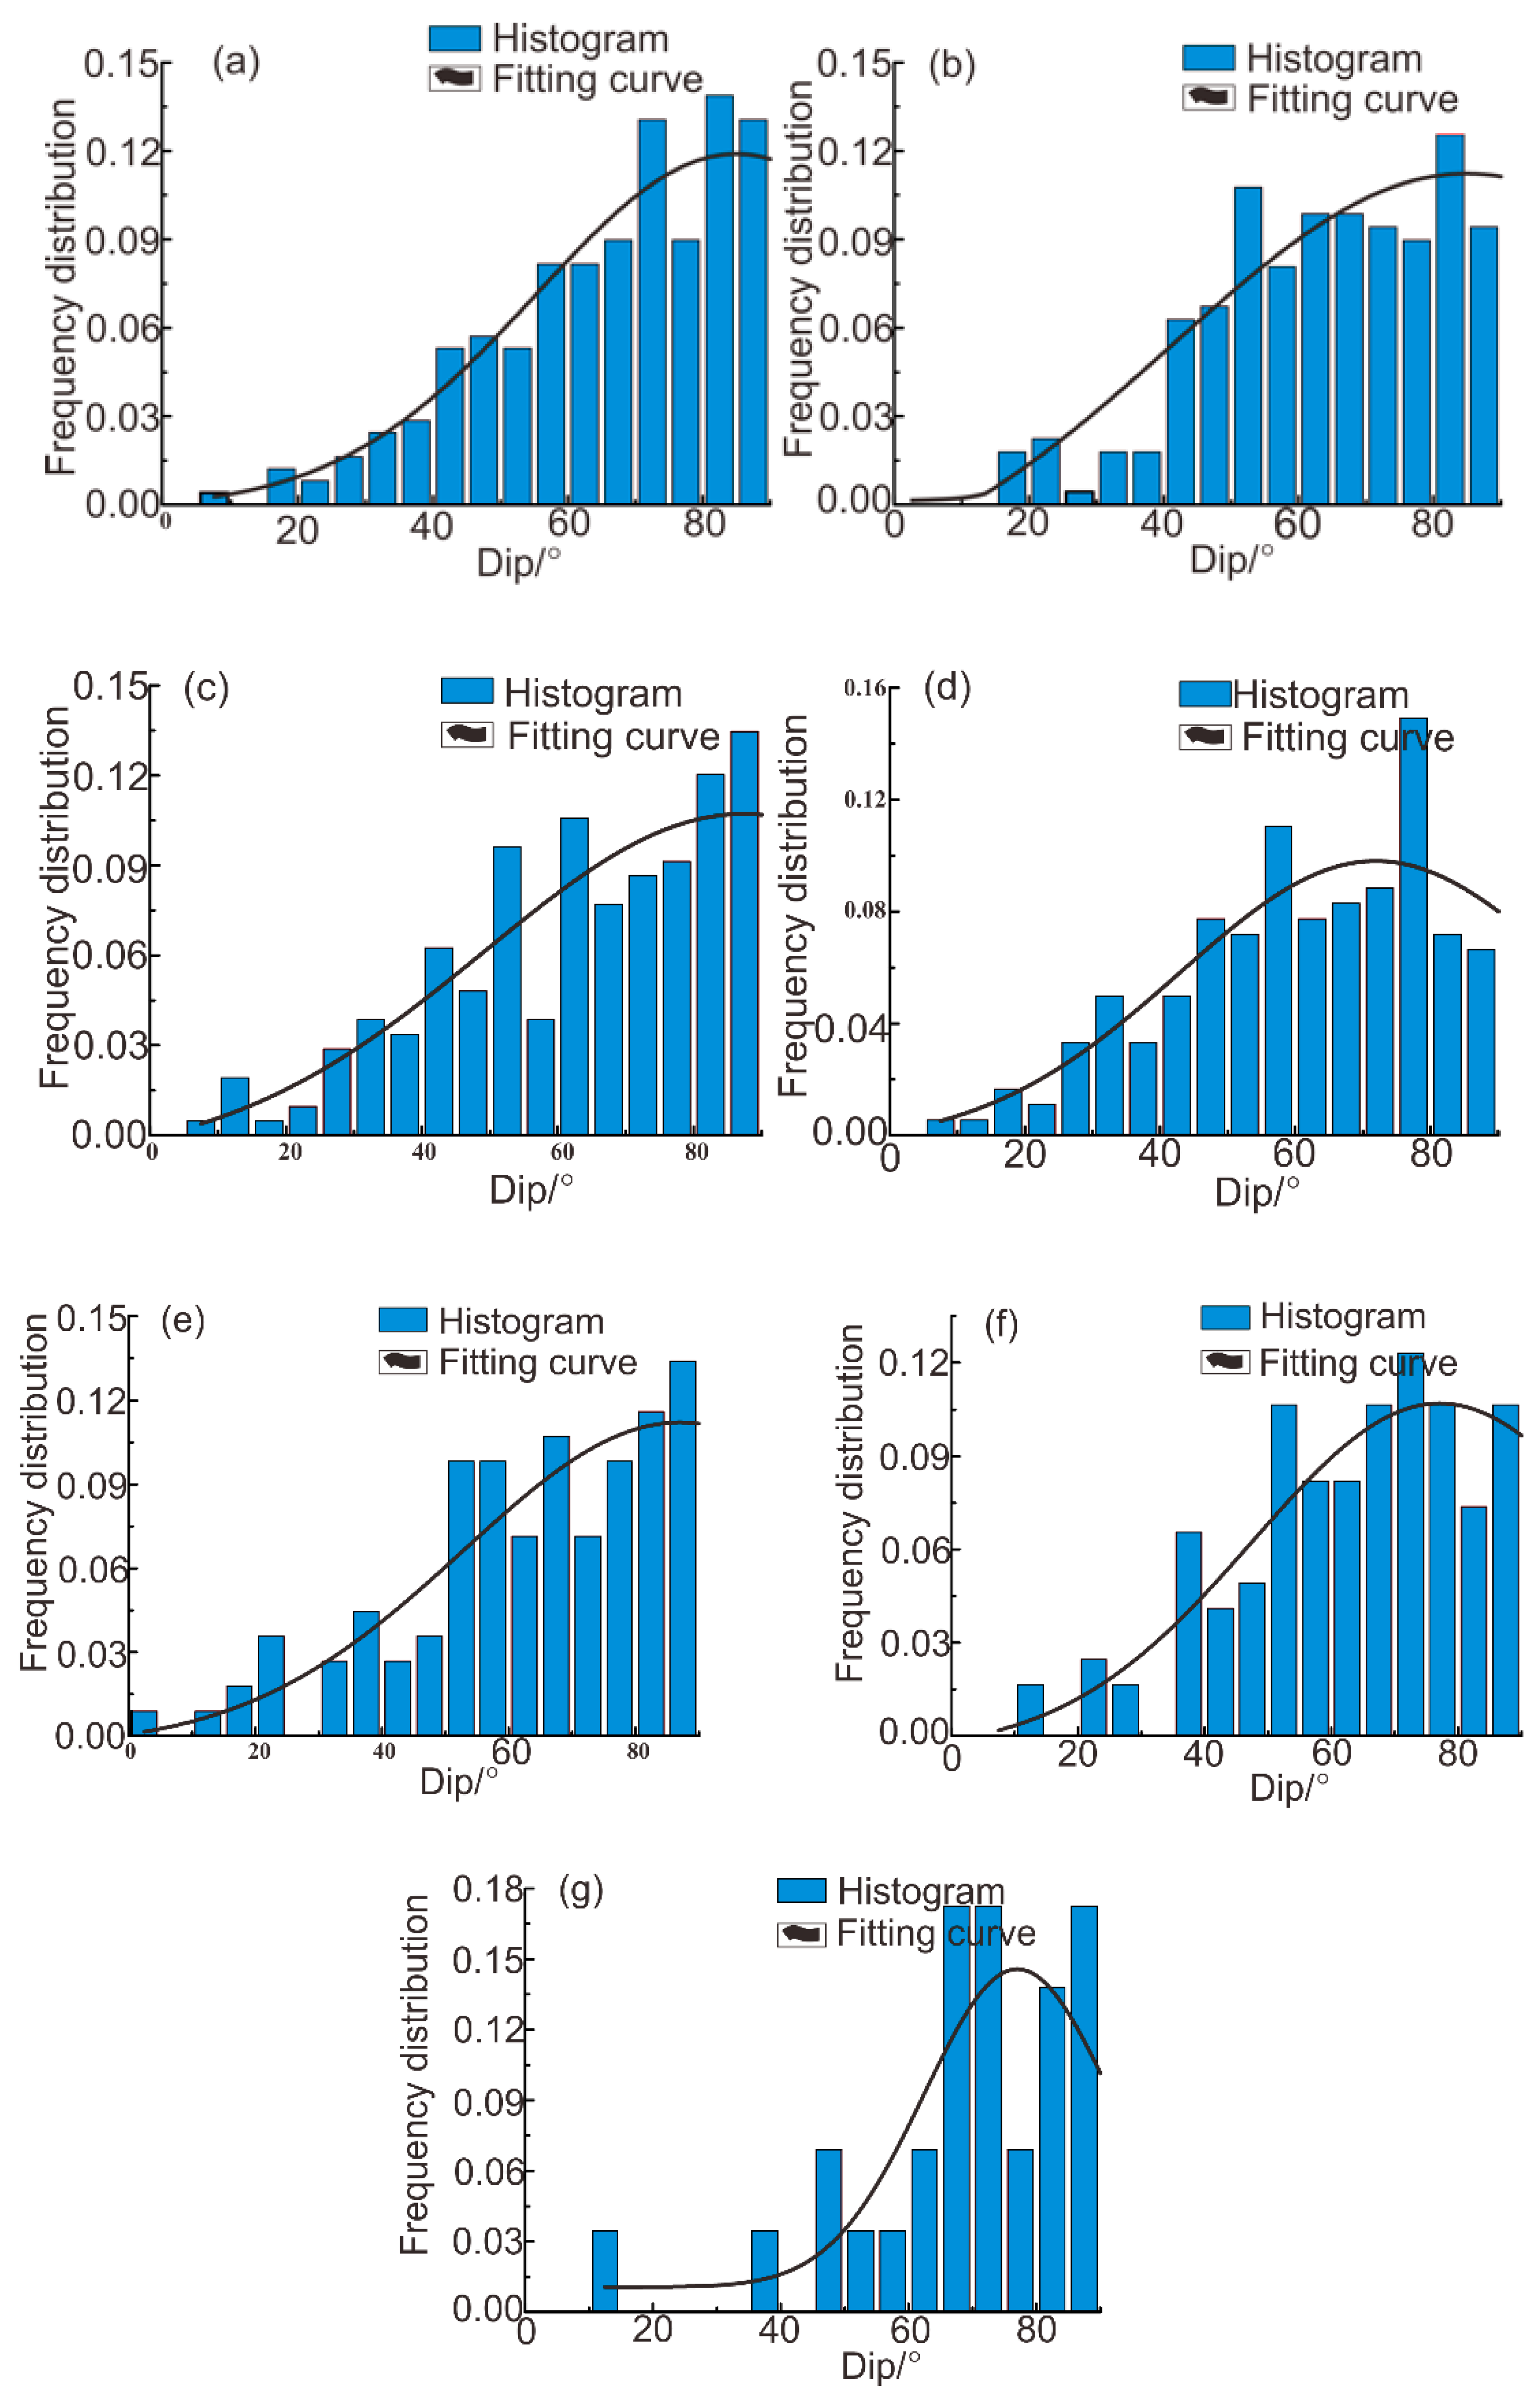
Further, we also analyzed data from 1122 fractures and plot histograms of the frequency distribution of the inclination, dip angles, and crack spacing. In
Figure 13, it can be seen that the fractures had discrete characteristics. However, each sublevel had at least two peak points. In a certain range of dip angles, the tendency could be approximated as two normal distributions or log-normal distributions. The fracture tendencies of the −375-m sublevel, −510-m sublevel, and −600-m sublevel all obeyed a log-normal distribution, with average dips of 130° and 297°, 130°and 310°, and 120° and 297°, respectively. Particularly at the −600-m sublevel, there were many fractures with dips of 0°–20°. Because there were too many, these were analyzed separately, and their tendency followed a normal distribution, with a mean dip of 10°.
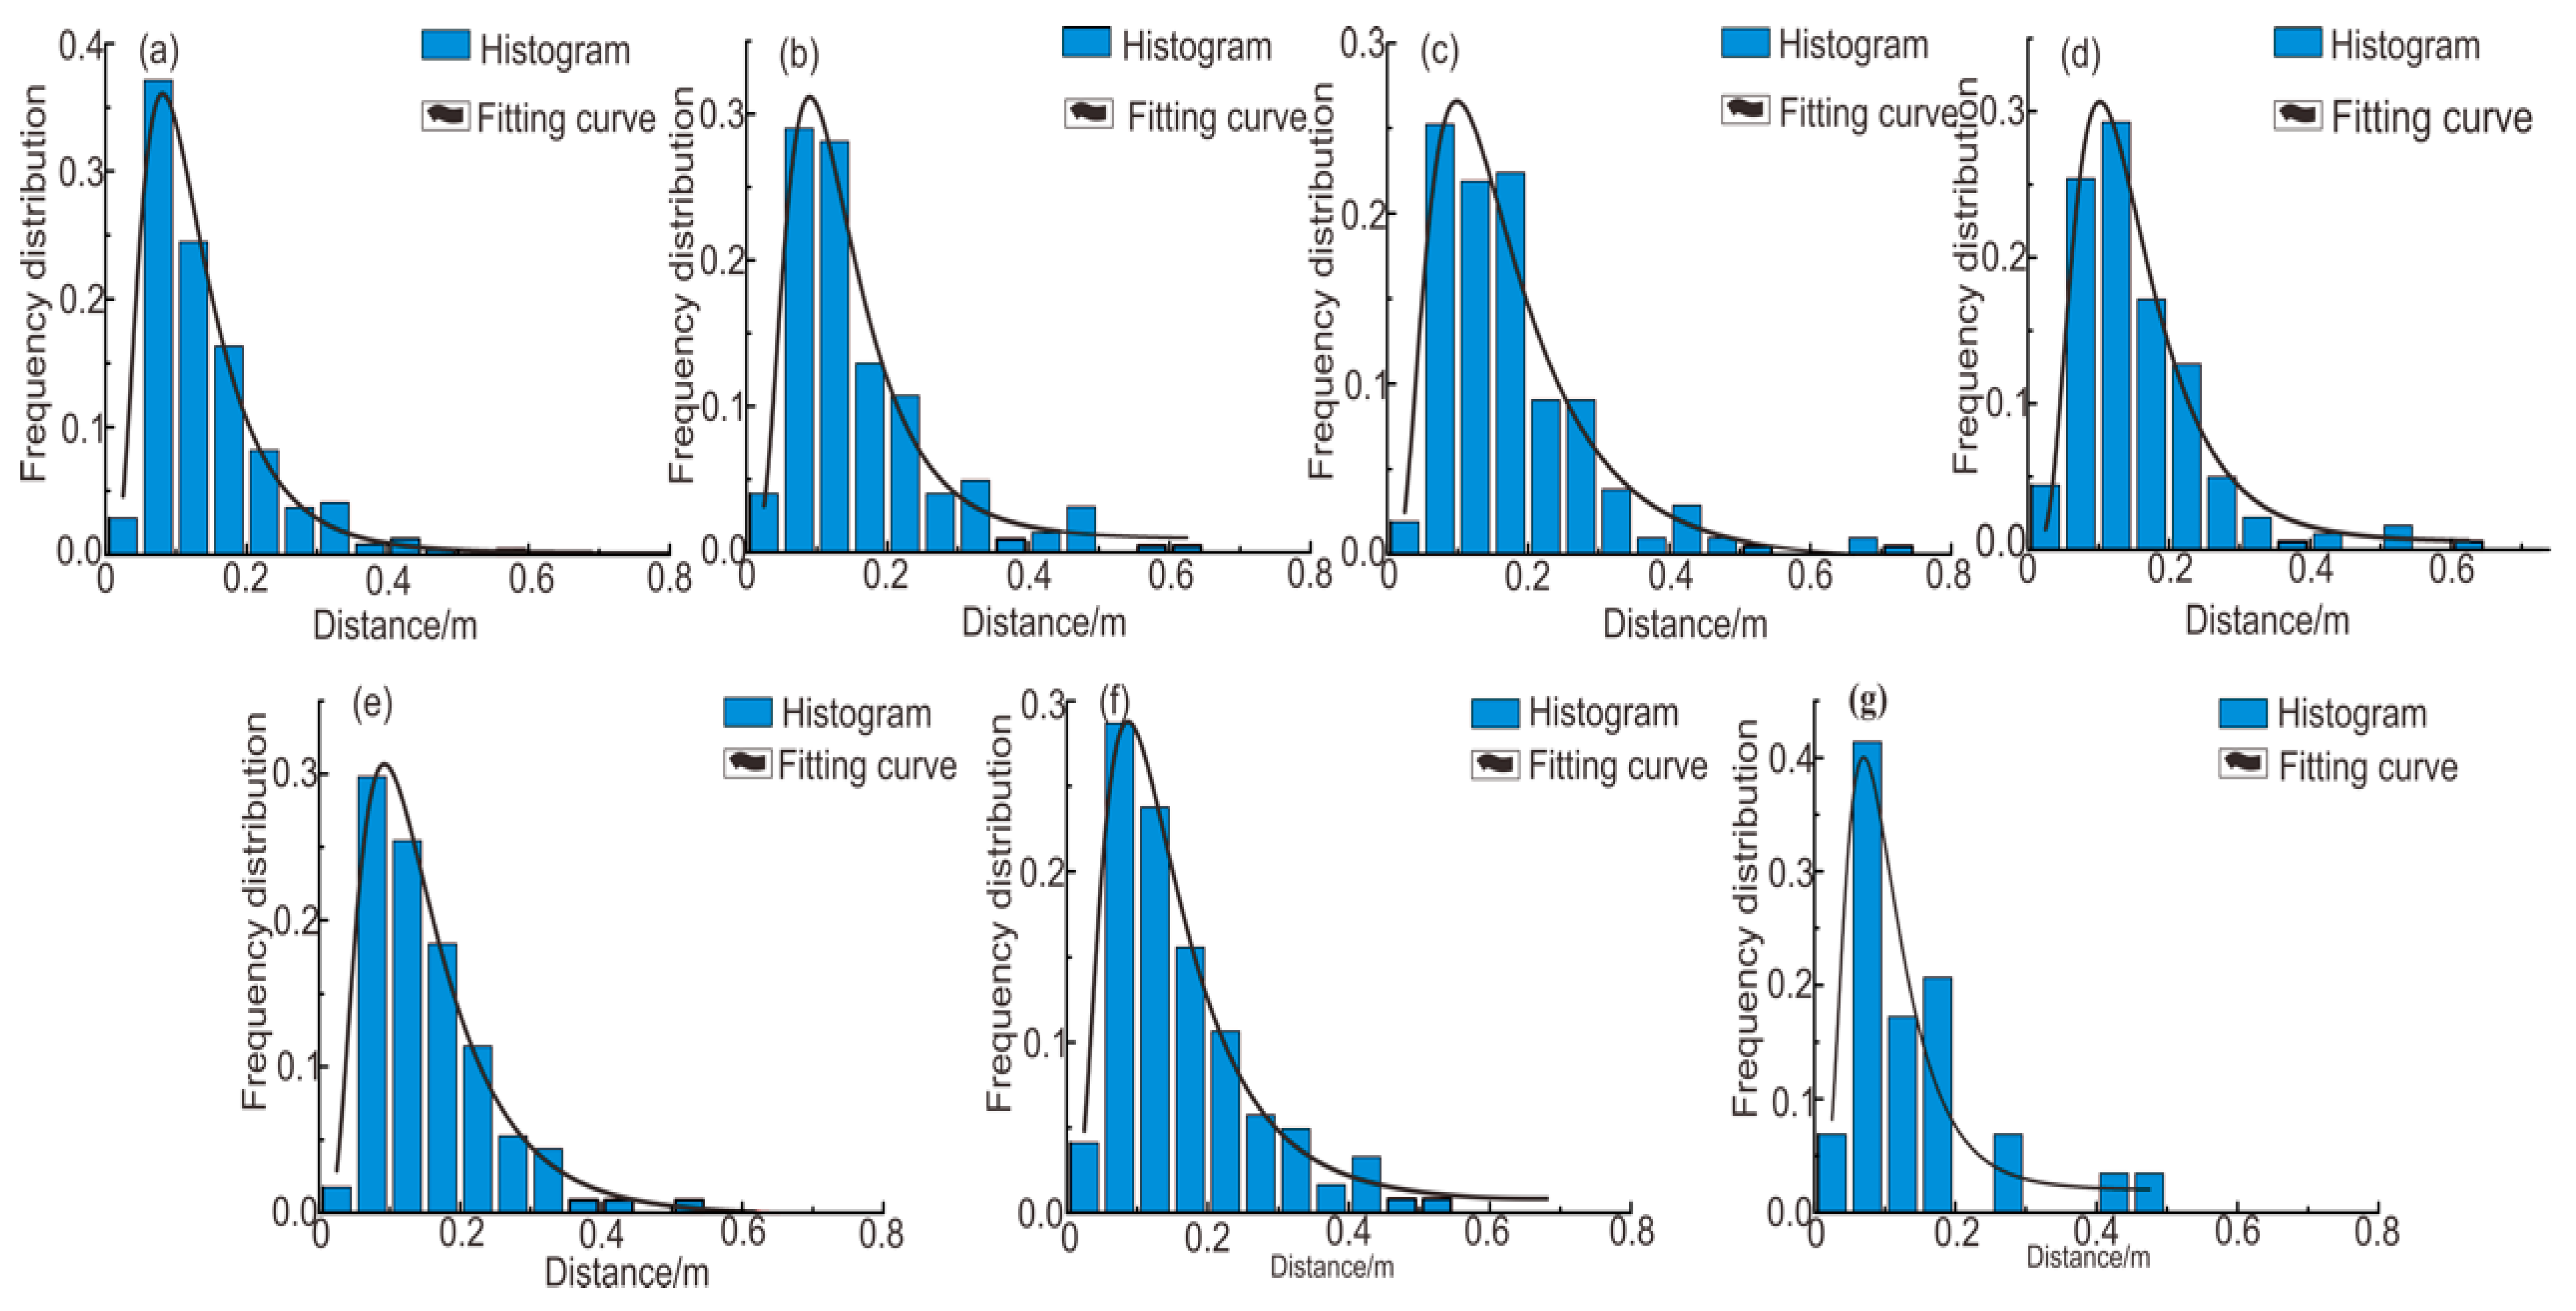
Since the dip angles of the fissures were generally large and the number of samples was limited, conventional distributions, such as a log-normal distribution or Weibull distribution, were difficult to fit to the fissure data. Thus, a normal distribution was adopted, and the data from the field investigation were in good agreement with part of the data from the normal distribution curve (
Figure 14). The two groups of dip angles at the −375-m sublevel were 85°; the two groups of dip angles at the −510-m sublevel were 87°and 72°; and the three groups of dip angles at the −600-m sublevel were 87°, 77° and 77°.
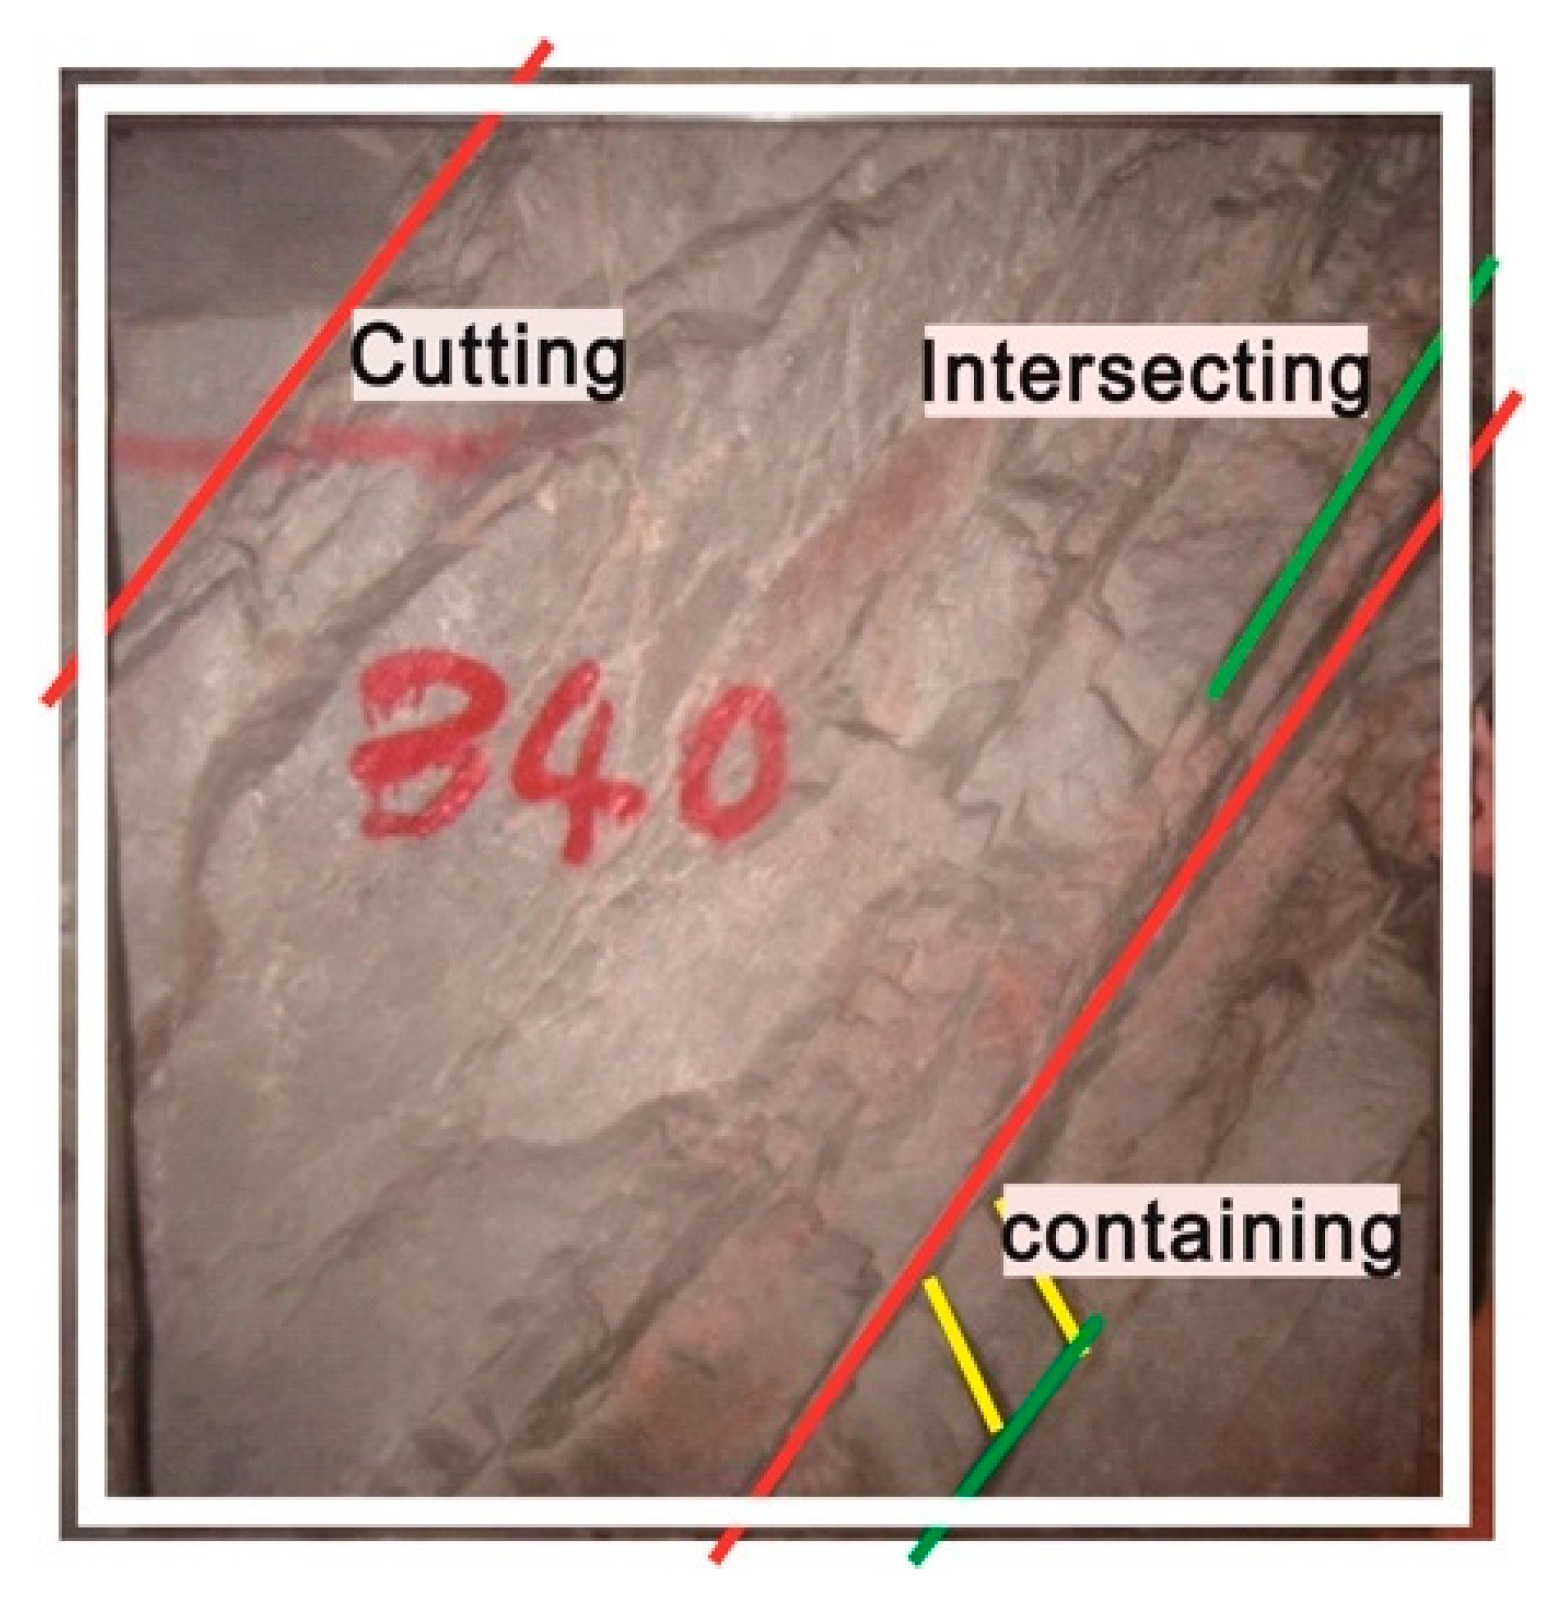
The window method was used to estimate the trace length of the fissure. As is shown in
Figure 15, this method is based on relationships that include cutting, intersection, and containment in terms of the boundary of the window. This method has the advantages of flexibility and a large number of samples [
39]. After analyzing the dozens of statistical windows in the mine, the average trace length of fissures was found to be 0.8 m. The trace length was assumed to obey a negative exponential distribution [
40]. In
Figure 16, it can be seen that the crack spacing more or less fit a log-normal distribution. The two groups of crack tracings at the −375-m sublevel were 0.113 m and 0.123 m; the two groups of dip angles at the −510-m sublevel were 0.151 m and 0.135 m; and the three groups of dip angles at the −600-m sublevel were 0.134 m, 0.13 m, and 0.09 m.
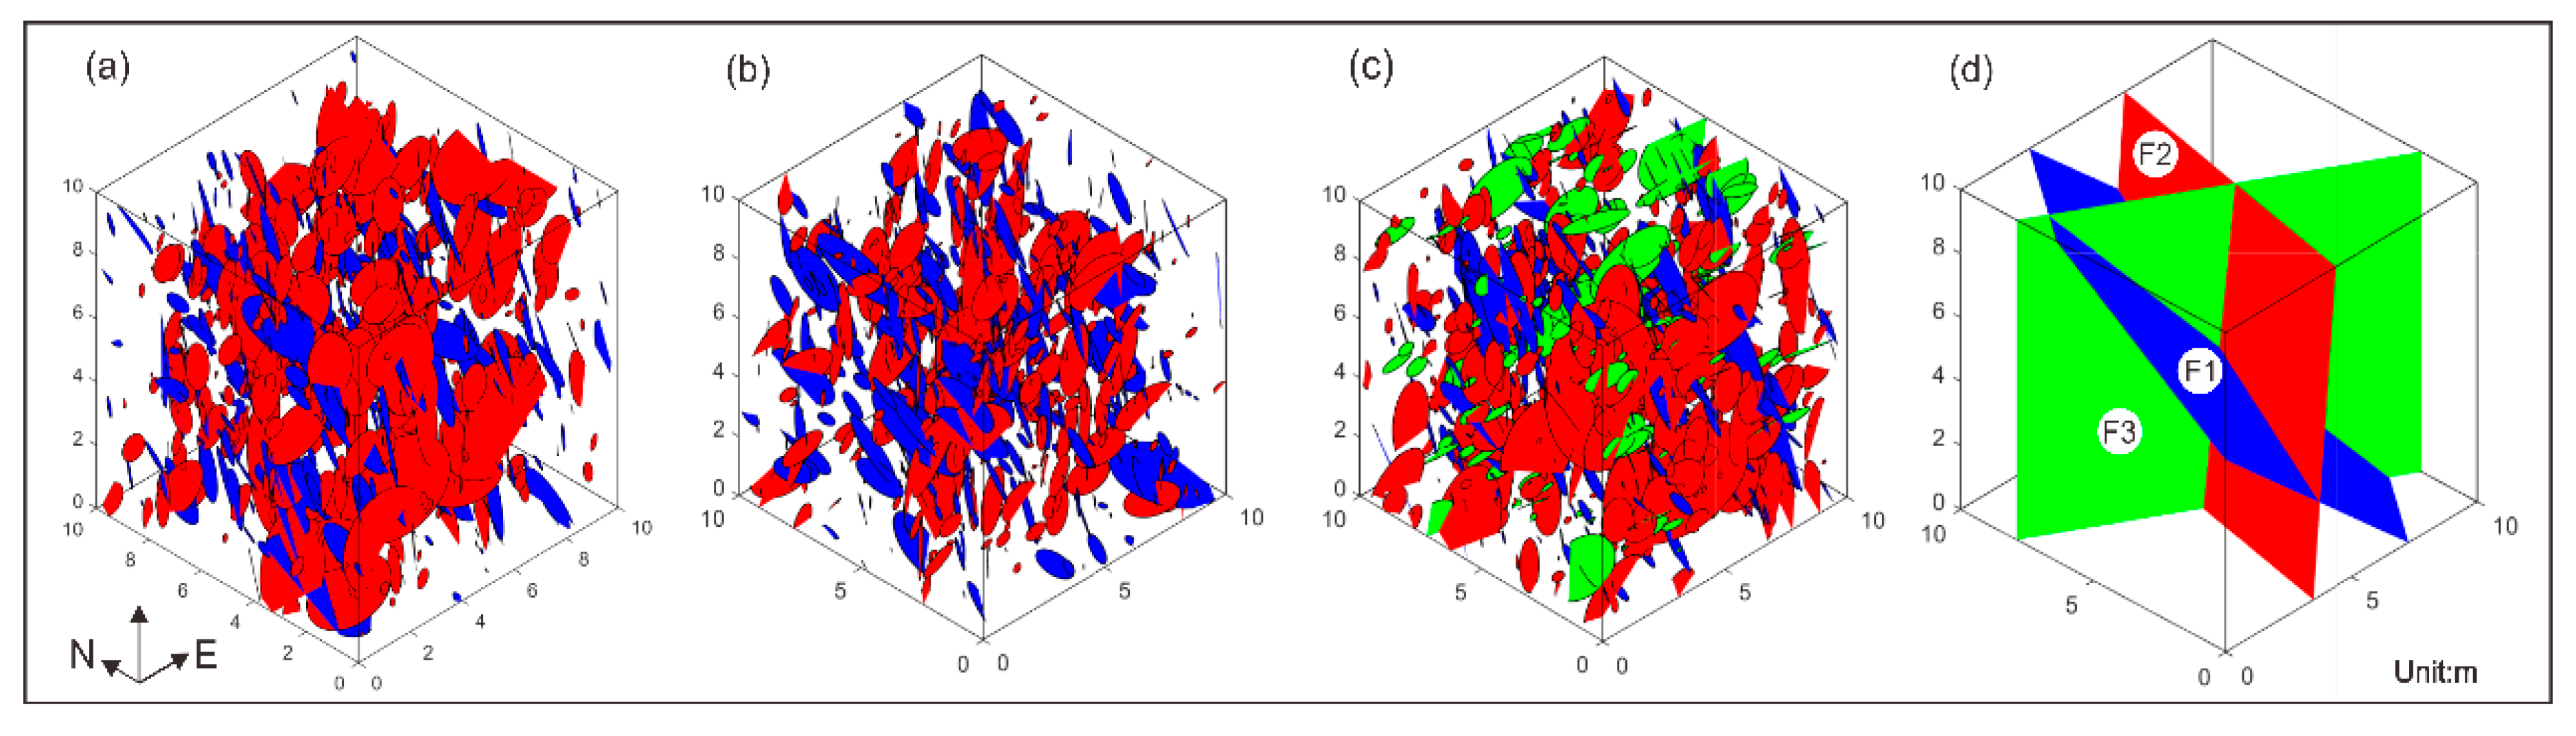
We used data on the fissure tendency, dip angle, and trace length; a mean and variance estimation; an assumption that the fissure was disc-shaped; and three-dimensional geometric modeling (
Figure 17) of the −375-m sublevel, −510-m sublevel, and −600-m sublevel to carry out an analysis using MATLAB software (MathWorks Inc., Natick, USA, 2018). In
Figure 17, it can be seen that the fissure had characteristics of high dispersion and a high dip angle ratio and agreed with the actual fissure well. In order to more intuitively display the three faults (F1, F2, and F3) in the mining area, the occurrences (tendency and dip angle) were plotted (
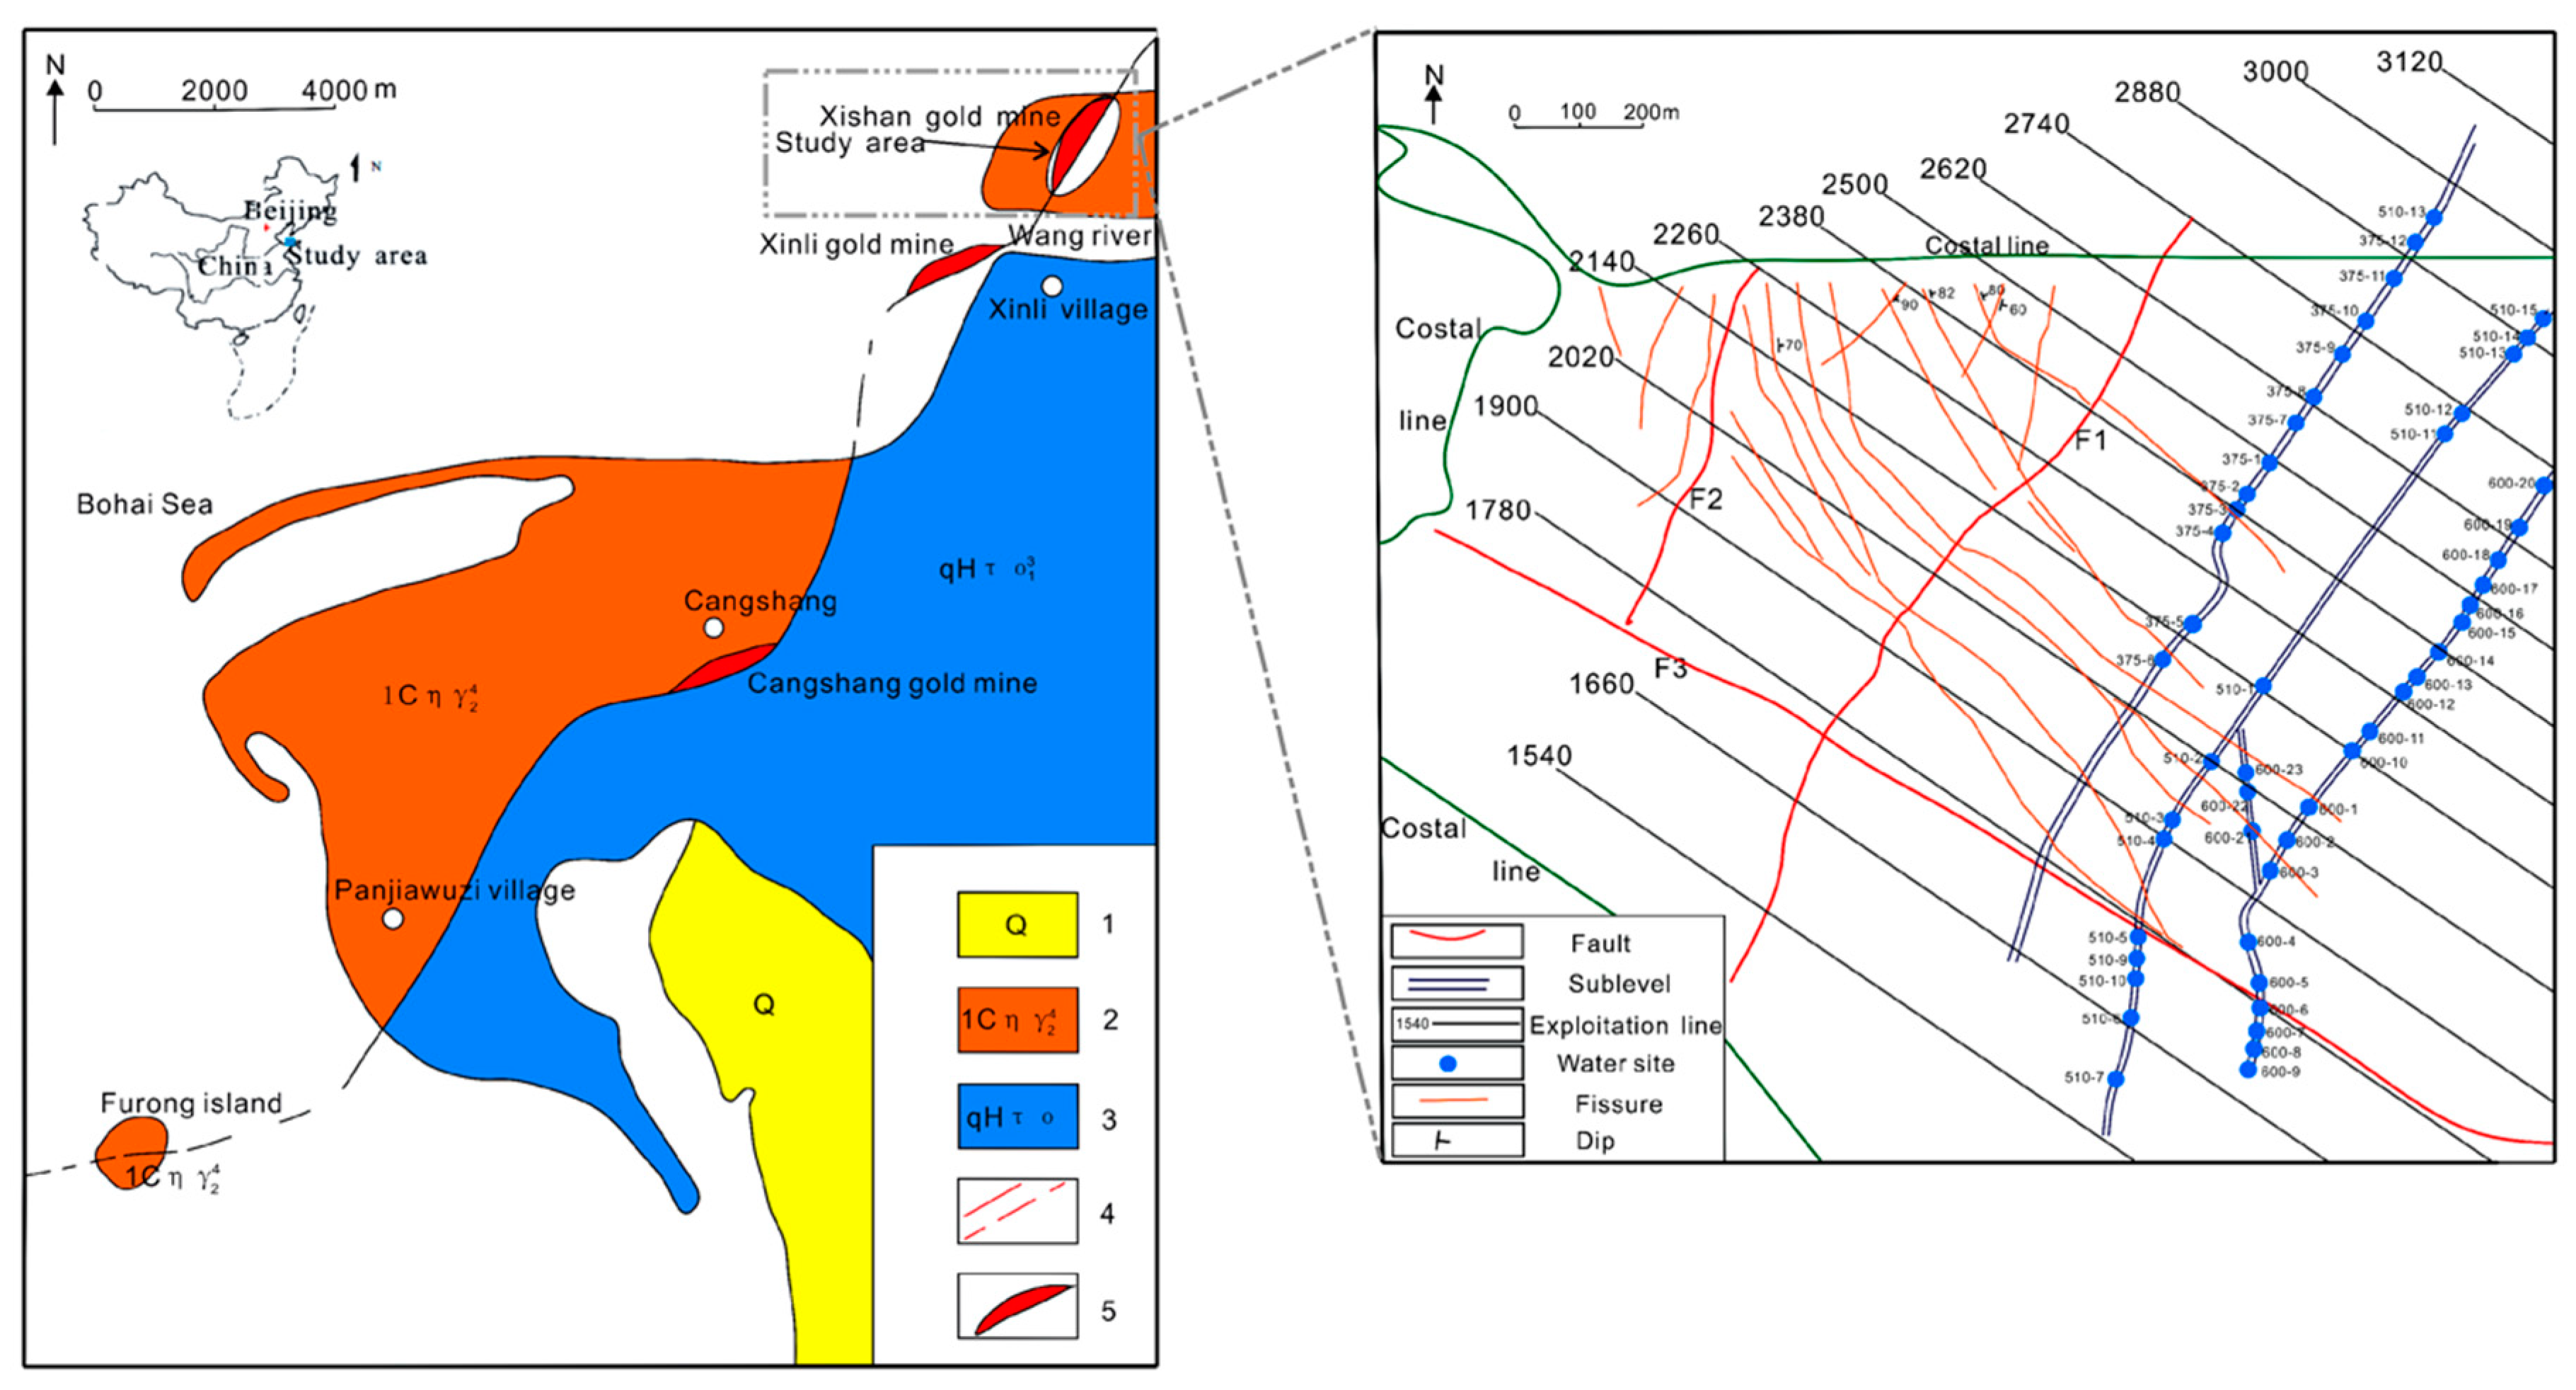
Figure 17d). The occurrence of F1 was 127°∠46°, the occurrence of F2 was 282°∠85°, and the strike of F3, which was nearly vertical, was 300°. Combining information from the three sublevels, it could be concluded that the occurrences of the three sets of fractures were 130°∠85°, 300°∠78°, and 10°∠77°, respectively. Comparing the fracture occurrence and fault occurrence, it can be seen that the three groups of fracture occurrence had a strong correlation with the fracture distribution of the mining area: the first group of fractures could be part of F1, the second set of fractures could be closely related to F2, and the third set could be part of the F3 fault. According to the property and position information of the three fault zones, it could be preliminarily determined that the third set of fractures had greater water conductivity than did the first and second sets of fractures.
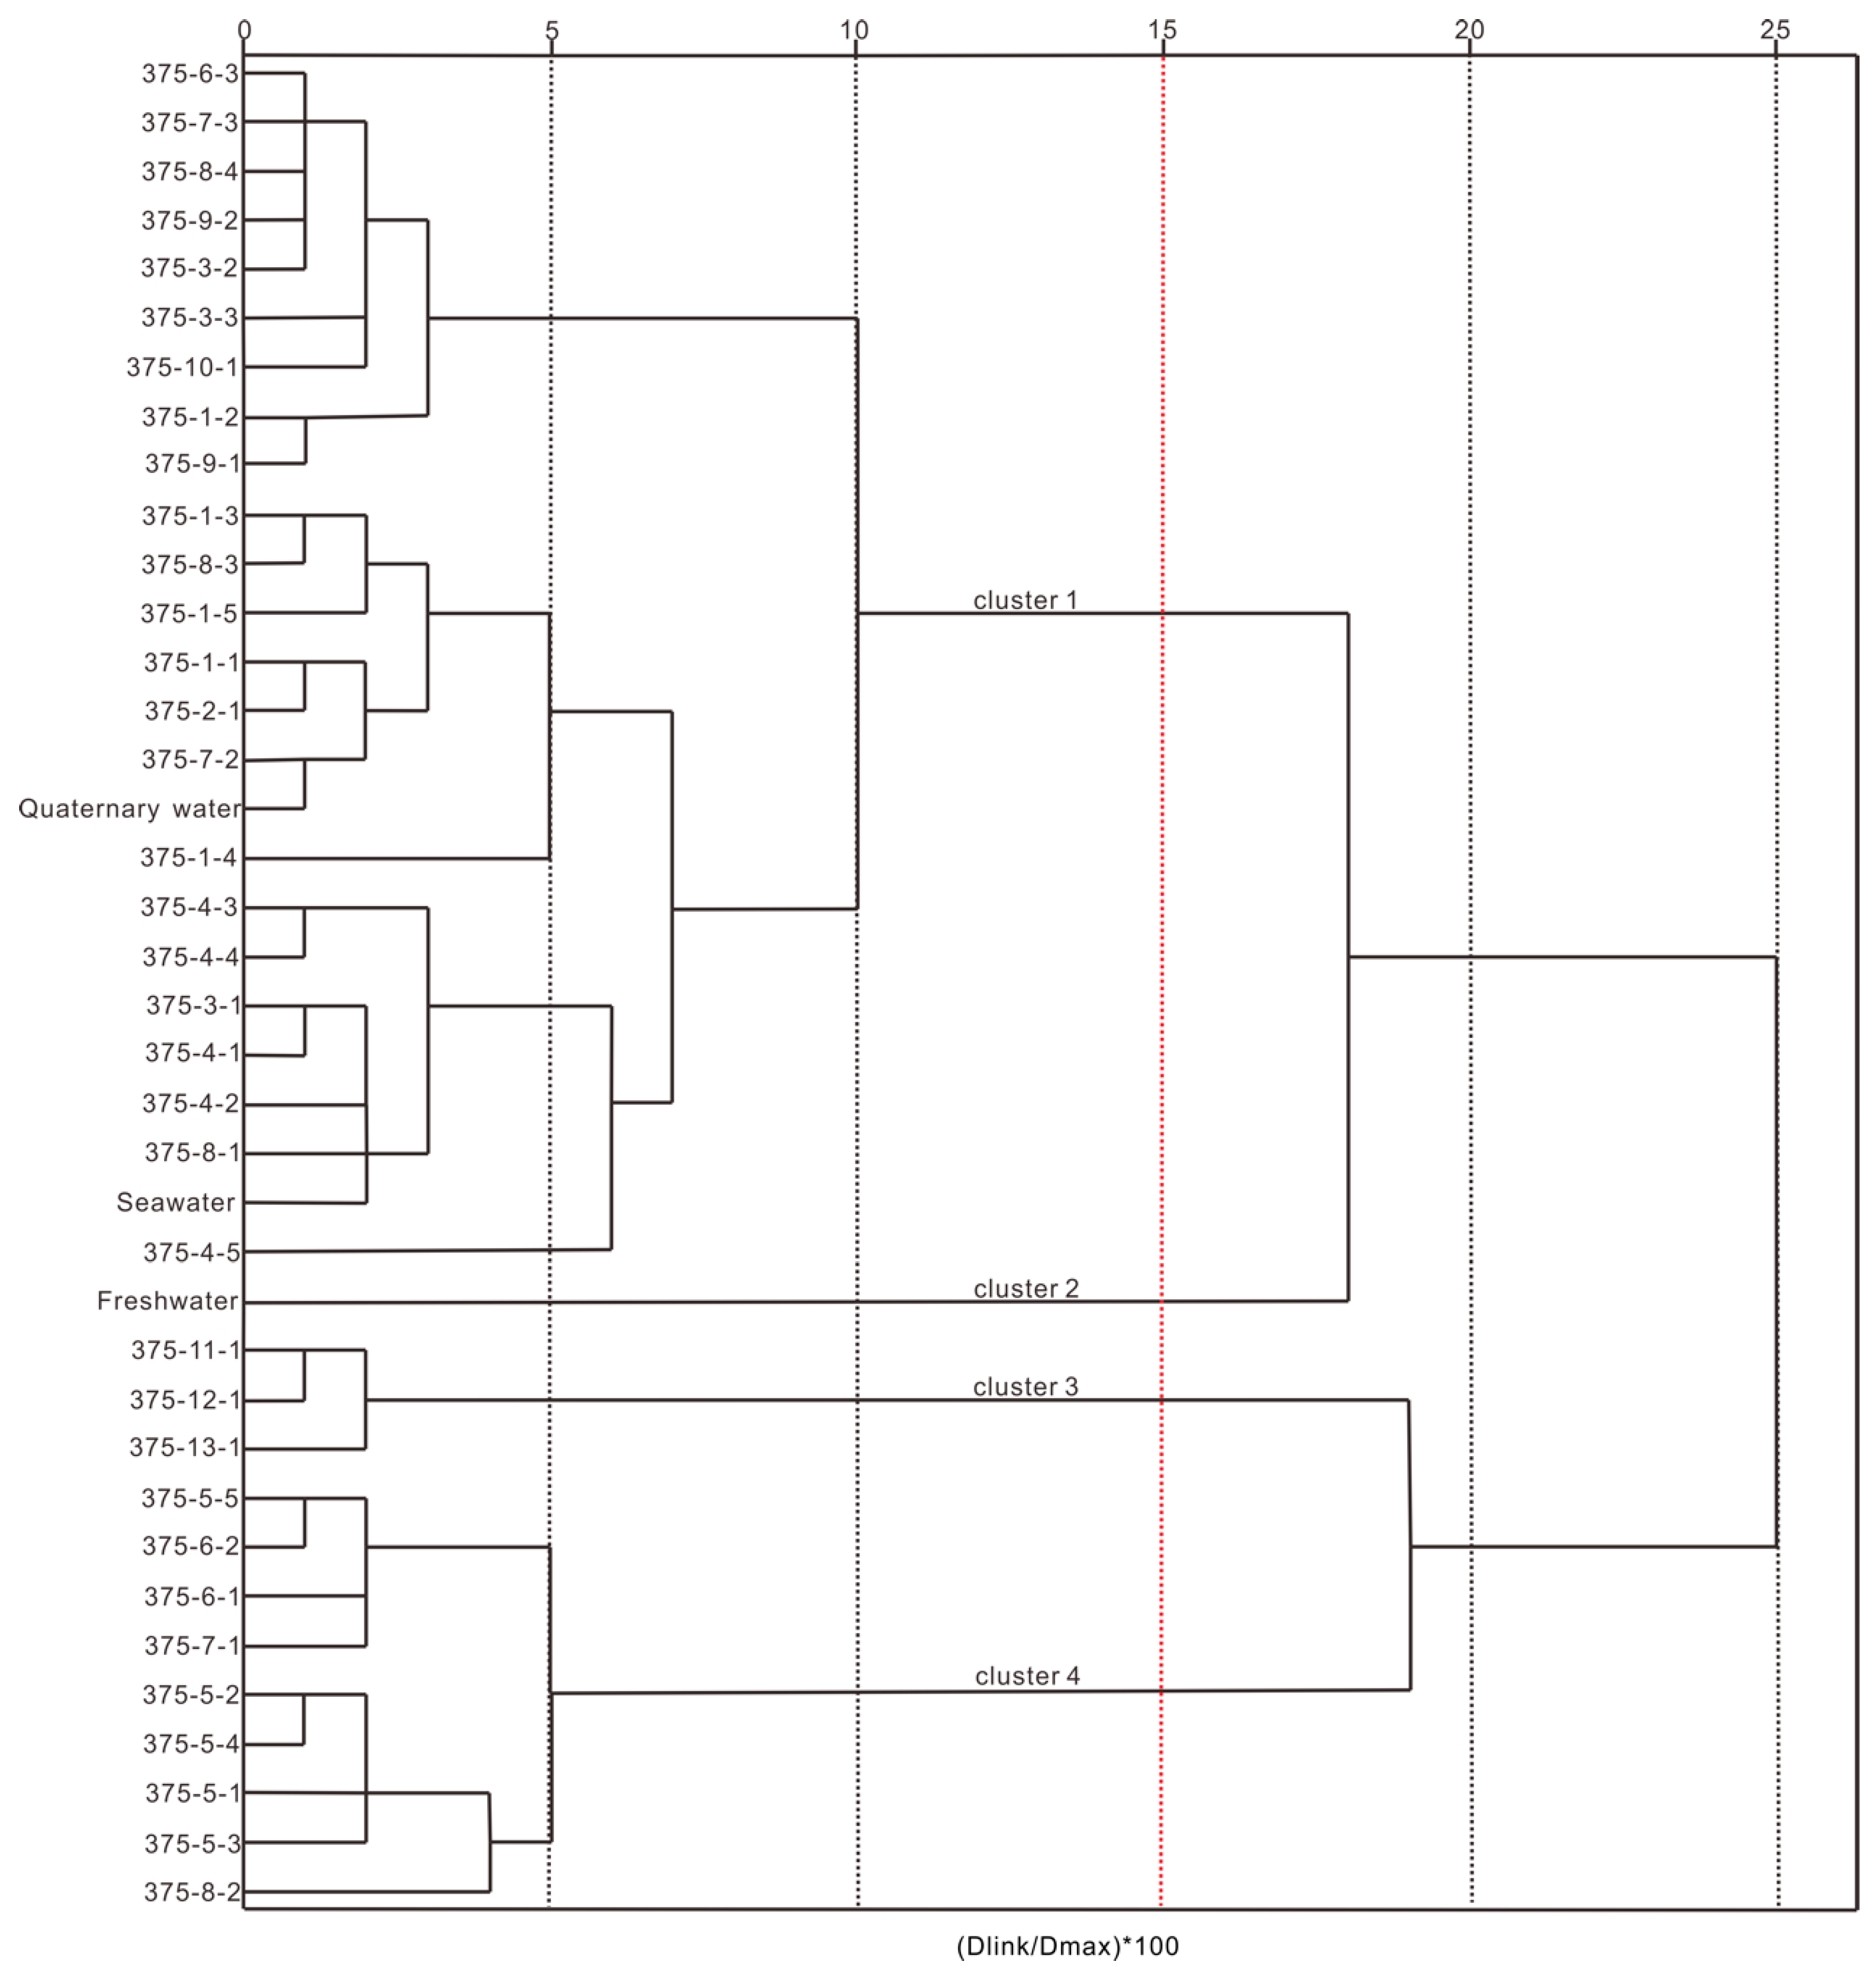
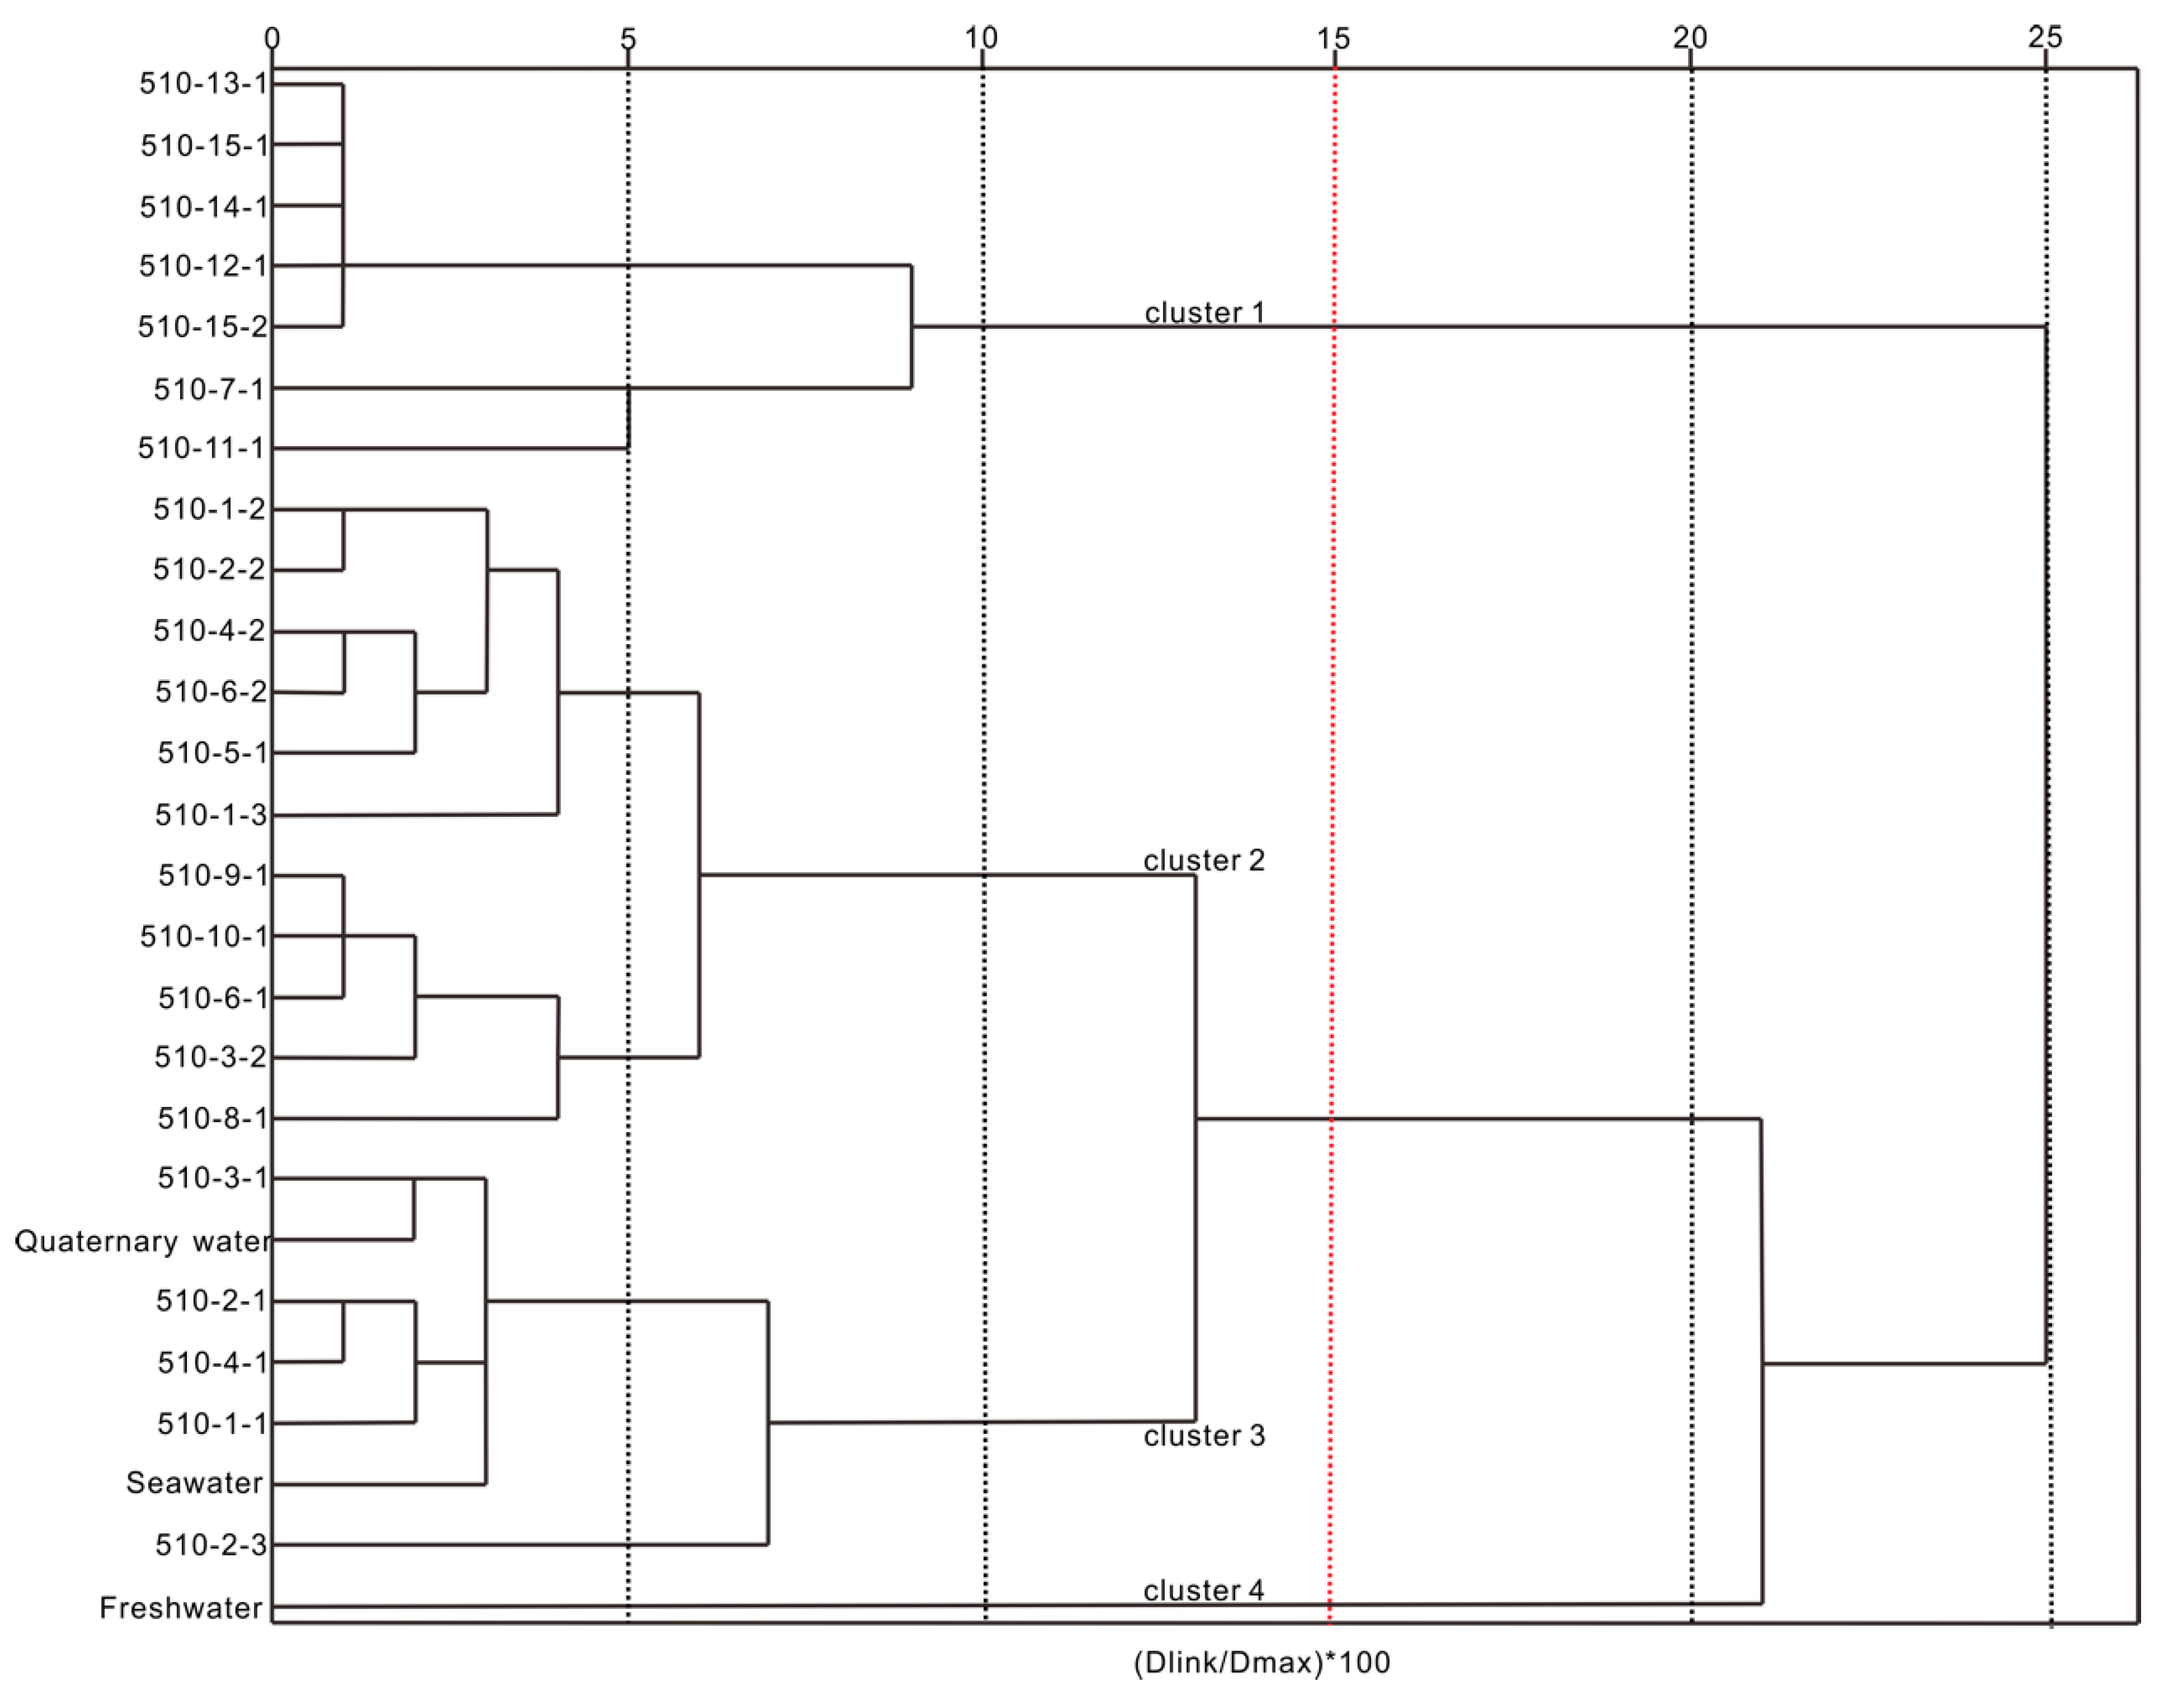
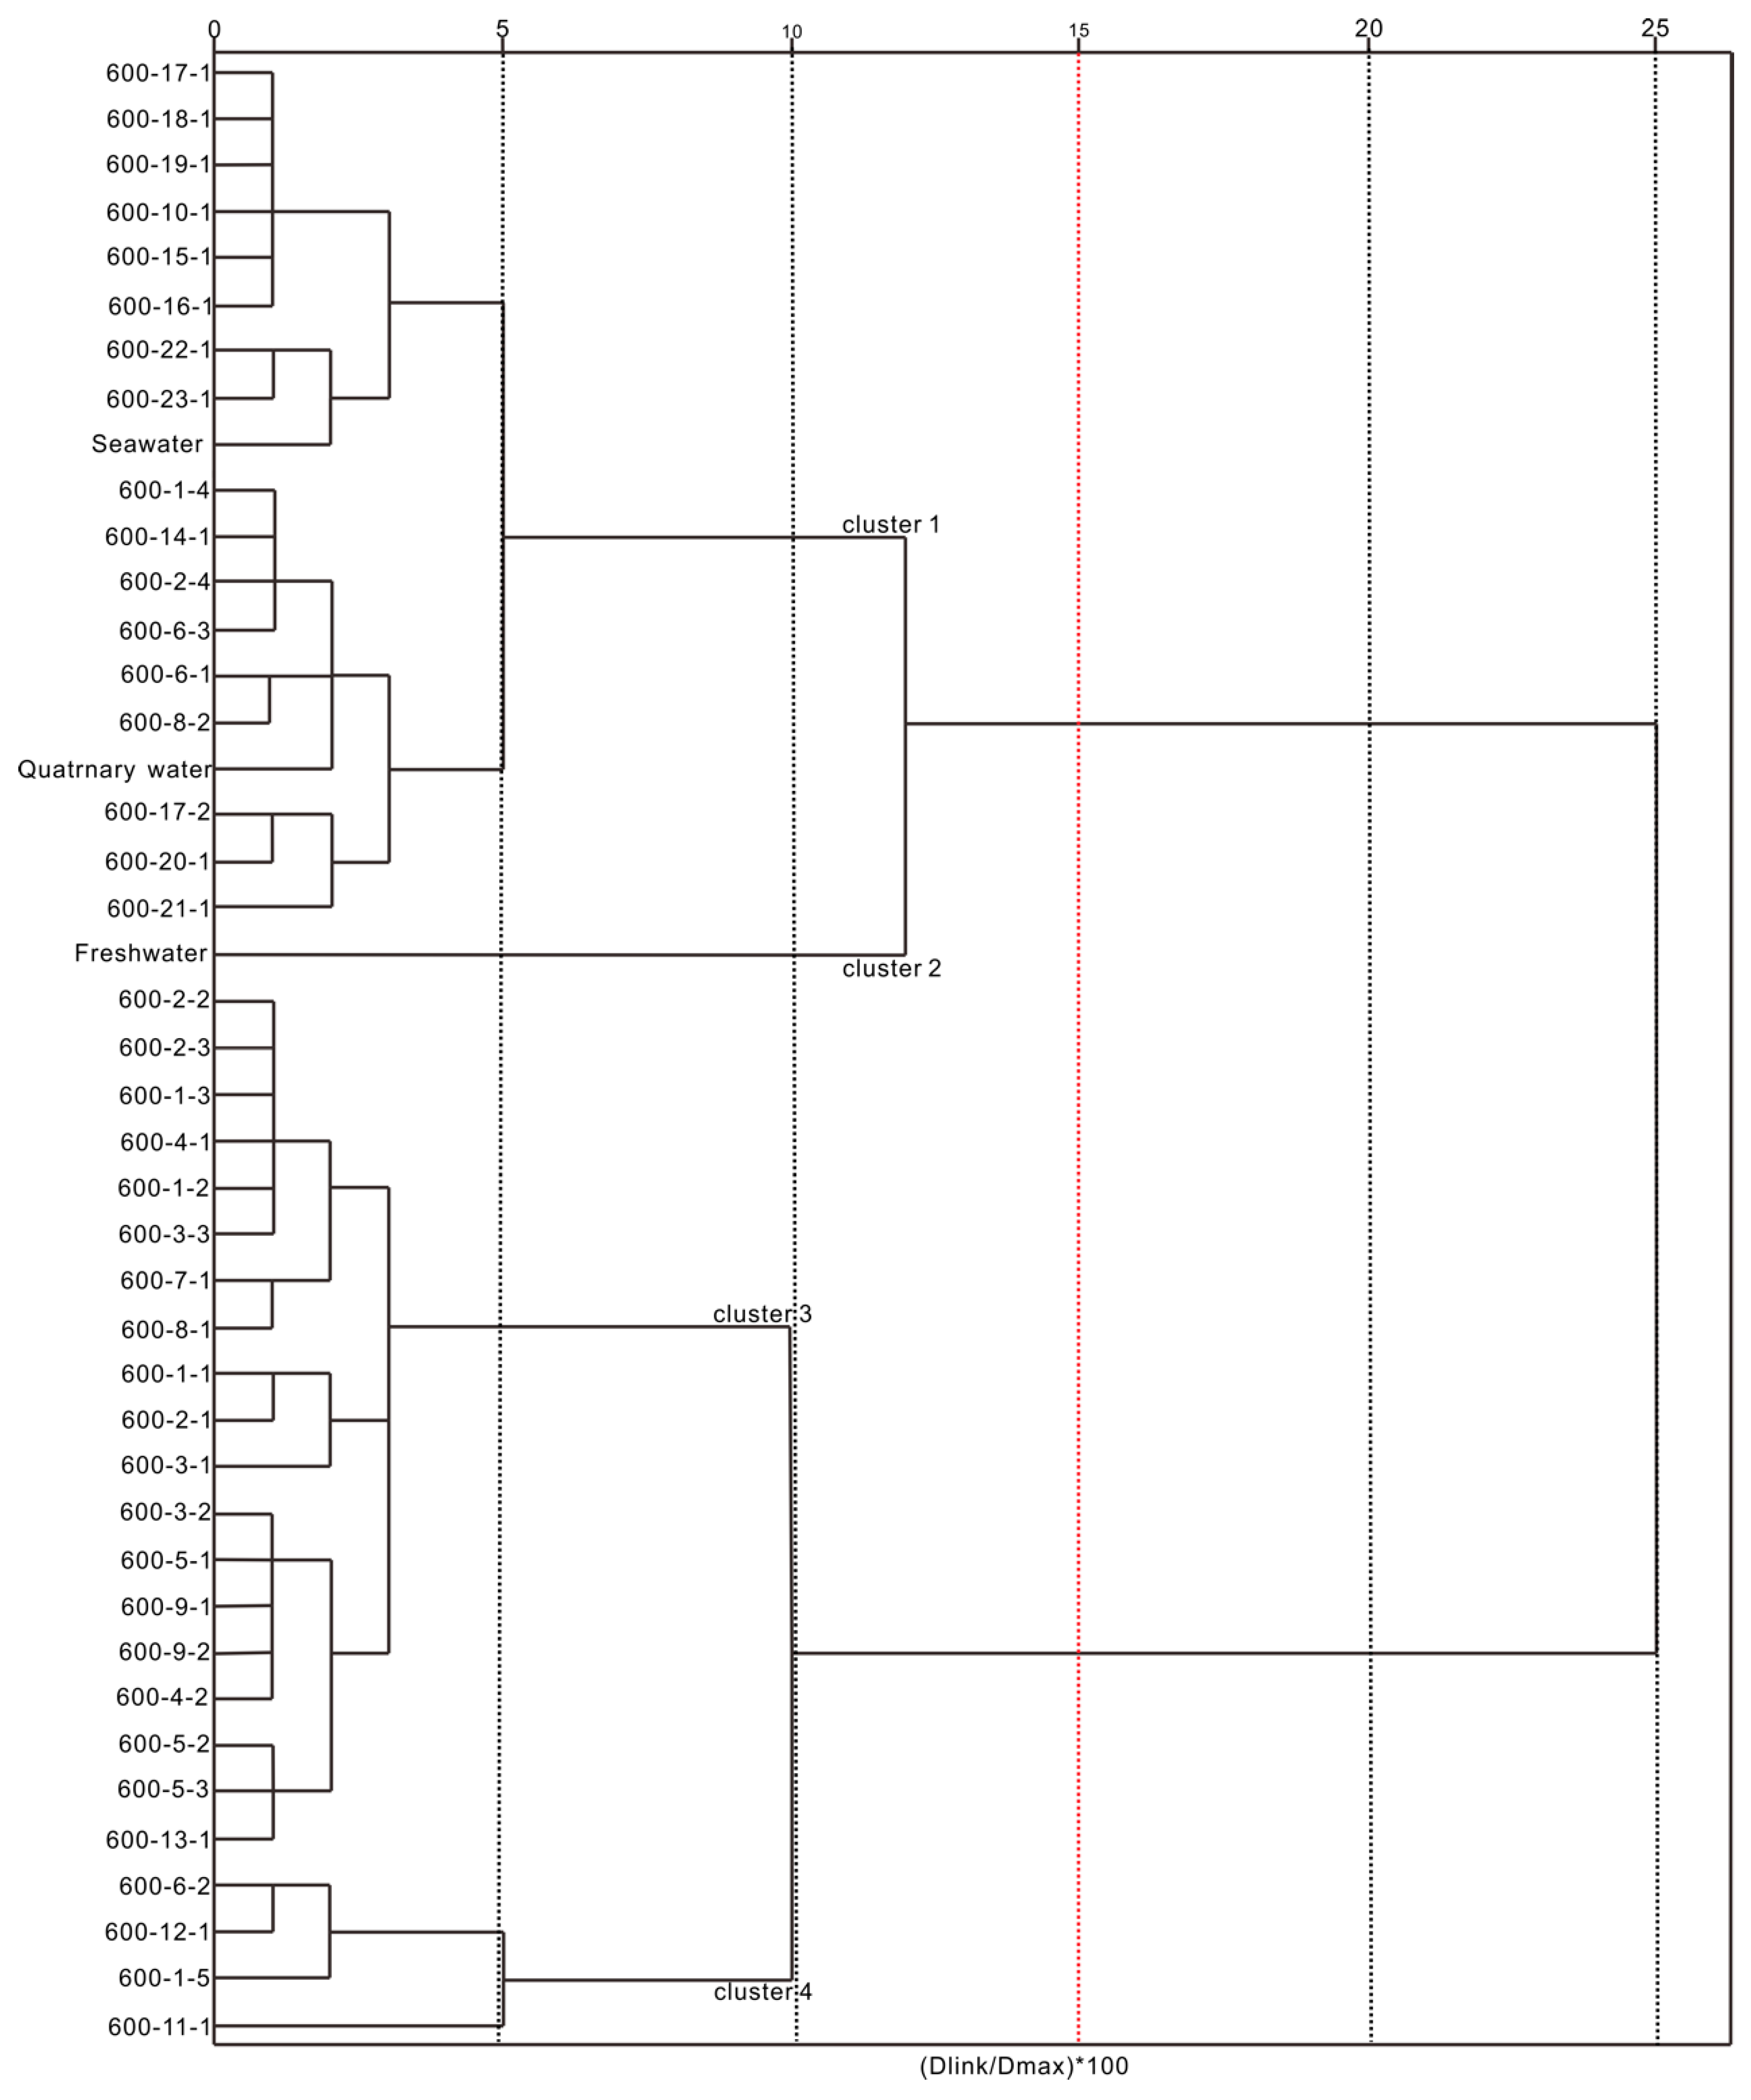
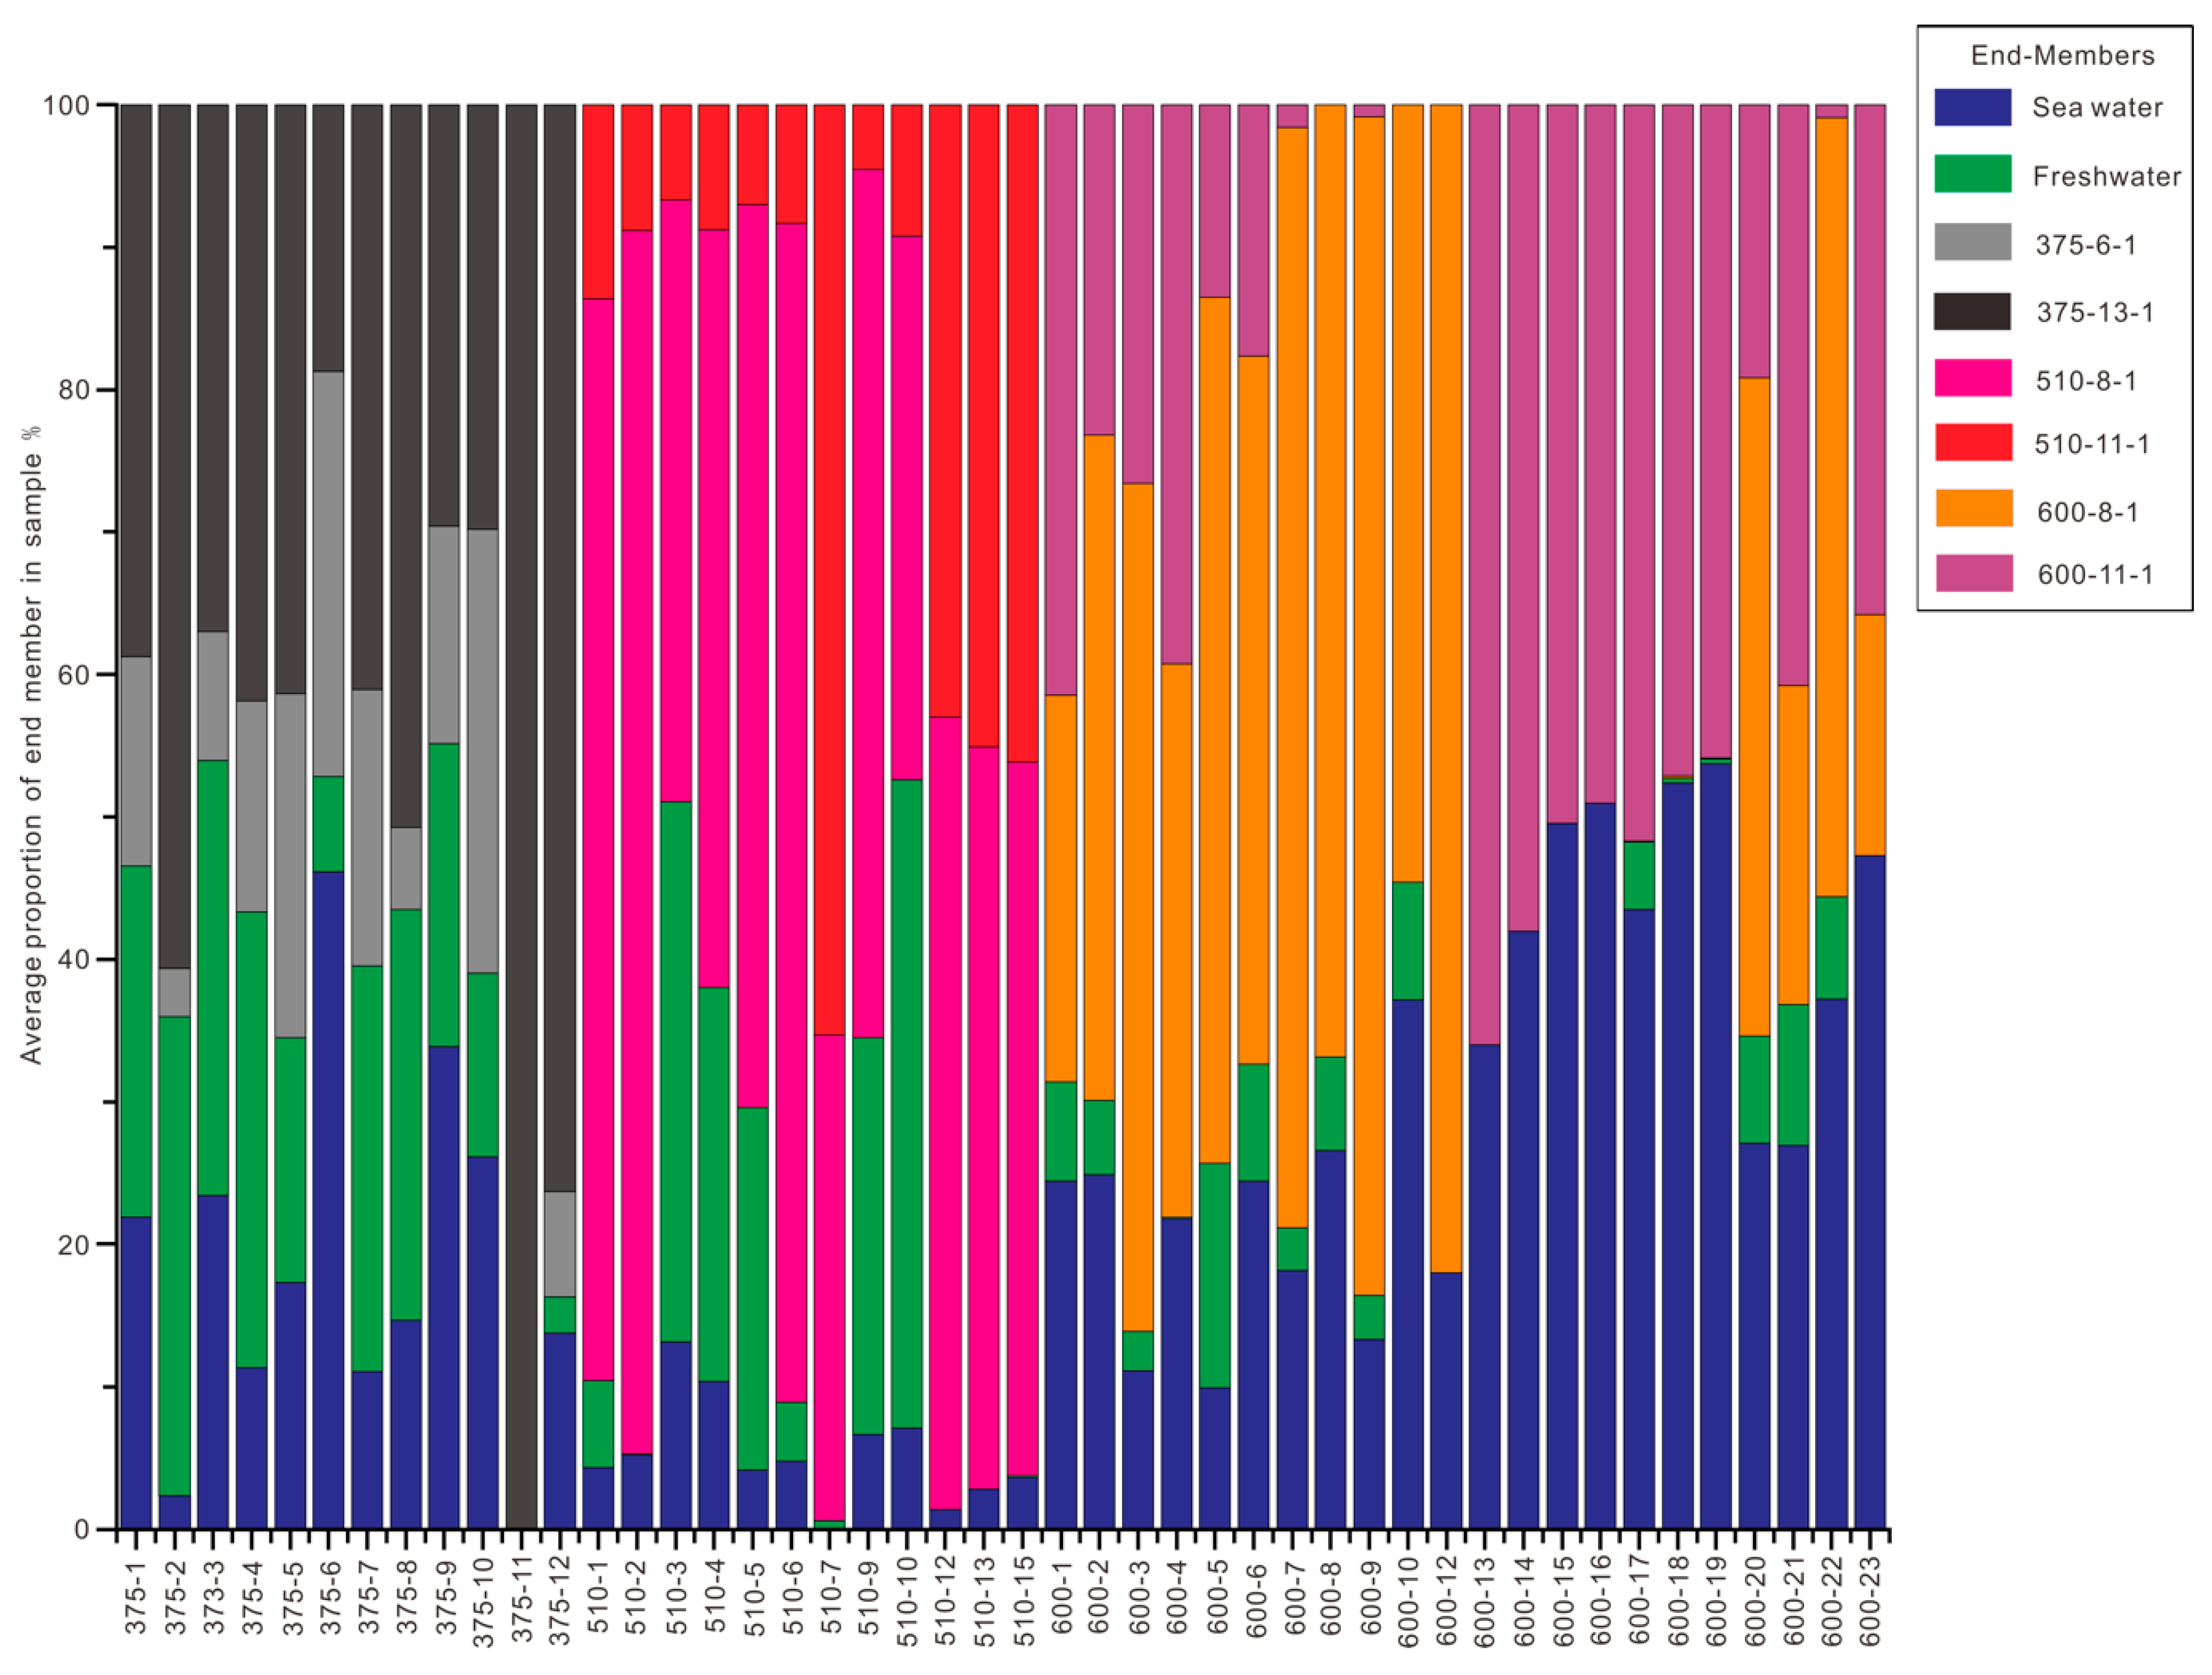
From discussion above, there are four ways to evaluate the reliability of the chosen methods. 1. It can be seen that the first three principle components (
Figure 3) explain most of the water chemistry of the water samples, and four extreme water samples (freshwater, seawater, 375-6-1, and 375-13-1) can be derived from it. It shows that in the −375 m sublevel, all water samples consist of four potential water sources. Using HCA, the water samples (
Figure 4) in −375 m sublevel were also divided into four clusters. The results of PCA and HCA agree well. This shows to some extent that the two methods verify each other. Further, by combing these two methods, end-members (the number and specific water samples) can be obtained. For −510 m sublevel and −600 m sublevel, it has the same results of the analysis. 2. Combining with PCA and HCA, the end-members were obtained. According to available researches, the brine of the Sanshandao gold mine mainly contains Ca
2+ and Mg
2+. A scatter plot was made of Ca
2+ and Mg
2+ ions in the water samples, it was found that the water samples at the extreme value point of Ca
2+ and Mg
2+ ions corresponds to the end-members which were obtained. 3. From the PCA results, we selected several special water samples: 375-1-1, 375-9-1, 510-5-1 and 600-3-1. For 375-1-1 and 375-9-1, they are near the line that was composed by freshwater and 375-13-1 and have a good fit with this line. This demonstrated that these two water samples were mainly composed by freshwater and 375-13-1. For 510-5-1, it is near the line that was composed by freshwater and 500-8-1 and near the line which was composed by 510-8-1 and 510-11-1. This demonstrate that 510-5-1 were mainly composed by 510-8-1, freshwater, and 510-11-1. The 600-3-1 was located on the extension line of sea water and 600-8-1 and was near 600-8-1. It demonstrated that 600-3-1 could be represented by 600-8-1 in a large extent. From the EMMA results, it was apparently seen that 375-1-1 was composed by freshwater and 375-13-1, which make up 31.5% and 59.3%, respectively. 375-9-1 was composed by freshwater and 375-13-1, which make up 33.3% and 52.0%, respectively. For 510-5-1, it was composed by freshwater, 510-11-1, and 510-11-1, which make up 25.4%, 63.4%, and 7%, respectively. For 600-3-1, it was mainly composed by 600-8-1 at 94.6%. In summary, the qualitative analysis of PCA and the quantitative analysis of EMMA are consistent. 4. According to
Section 5.3, it was found that the third set of fractures of 10°∠77° which belongs to F3 fault has greater water conductivity than the first and second sets of fractures and is widely developed in the −600 m sublevel. The results of EMMA apparently demonstrate that in the −600 m sublevel, the seawater content is abruptly increased. These two results are also consistent.


