Article

Changes in the Urban Hydrological Cycle of the Future Using Low-Impact Development Based on Shared Socioeconomic Pathway Scenarios

1
Saman Corp., Union Bldg., 5, Byeoryangsangga 3-ro, Gwacheon-si 13837, Republic of Korea
2
Department of Urban and Environmental and Disaster Management, Graduate School of Disaster Prevention, Kangwon National University, Samcheok-si 25913, Republic of Korea
3
Civil and Environmental Engineering, Konkuk University, 120 Neungdong-ro, Gwangjin-gu, Seoul 05029, Republic of Korea
4
Technology Research Division, Korea Slope Safety Association, Sejong-si 30128, Republic of Korea
*
Author to whom correspondence should be addressed.
Water 2023, 15(22), 4002; https://doi.org/10.3390/w15224002
Submission received: 16 October 2023 / Revised: 5 November 2023 / Accepted: 15 November 2023 / Published: 17 November 2023

Abstract

:
Representative Concentration Pathway (RCP) scenarios have been used for various studies in the field of climate change. In this regard, the Shared Socioeconomic Pathway (SSP) scenario has been newly introduced to examine climate change impacts, but relevant research is still insufficient. For this reason, new SSP scenarios with a combination of Low-Impact Development (LID) techniques are applied to predict rainfall-runoff efficiency and hydrological variation. The inter-model variability in the monthly average precipitation for each GCM according to new SSP scenarios under future climate was investigated. Based on the RCP 4.5 and RCP 8.5 scenarios, the results show precipitation changes with an increase of 4.8% and 12.3%, respectively. Furthermore, precipitation projections under SSP2-4.5 and SSP5-8.5 scenarios are predicted to increase by 13.9% and 20.6%, respectively, indicating that the magnitude of precipitation increases with new climate change scenarios. The Storm Water Management Model (SWMM) during the future period indicated that LID applications will reduce runoff compared with scenarios with no LID application. In particular, the introduction of permeable pavement and infiltration trenches revealed the best runoff reduction performance among the combinations of LID techniques considered. In addition, this study projected changes in the urban hydrological cycle for the climate over the next 30 years to reflect the implementation of urban hydrological cycle plans, which take approximately 10 years. Overall, it was found that, in the future, LID applications will contribute to improving the sustainability of the urban hydrological cycle of the study area. The results of our study can provide future directions for water management strategies in Korea.

1. Introduction

As a result of climate change, extreme events are occurring with increased frequency and intensity [1,2,3]. Changes in the magnitude and frequency of heavy rainfall lead to an increased inundation risk. Therefore, impact assessments have focused on improving sustainability in urban regions that have experienced water-related disasters caused by climate change [4,5]. Regarding the concept of sustainable development, several works of literature were reviewed across various research fields such as agriculture systems, computer science, and renewable energy [6,7,8].
A common method for assessing the impacts of climate change is to employ climate change scenarios [9]. However, because climate change scenarios have varying dynamics and resolutions, there is significant uncertainty among them. To quantify this uncertainty, an ensemble of scenarios is often used. This allows the uncertainty to be quantified from all scenarios based on inter-model variability [9,10,11,12,13,14,15,16]. Because Korea’s climate is affected by topographical characteristics, it is necessary to use downscaled scenarios to reflect the regional climate [3].
Recently, the Shared Socioeconomic Pathway (SSP) scenario was proposed by the Inter-governmental Panel on Climate Change’s sixth assessment report. This scenario considers future reductions, adaptations, and efforts to mitigate climate change based on future social and economic changes, such as population, economic development, ecosystems, resources, institutions, and social factors [17]. The Sixth Coupled Model Intercomparison Project (CMIP6) is composed of SSP1-2.6, SSP2-4.5, SSP4-6.0, and SSP5-8.5, each of which results in 2100 radiative forcing levels similar to their predecessor. New future scenarios were also introduced in CMIP6, including SSP119, SSP4-3.4, SSP5-3.4OS, and SSP3-7.0. To date, a large number of studies have focused on comparisons between RCPs and SSPs [18,19]. In previous studies, researchers investigated flood risk mitigation effects of Low-Impact Development (LID) techniques for an urban area that aims to deal with climate change [20,21,22,23]. In previous studies, they projected future precipitation based on the reproducibility and past data sets to evaluate LID techniques for its rainfall-runoff mitigation efficiency. Contrary to the previous studies, we introduced the 18 GCM models to compute precipitation data based on the new climate change scenarios (SSPs). Moreover, it was confirmed that combinations of scenarios with three LID techniques could be suitable for analyzing urban characteristics. This study projected changes in the urban hydrological cycle for climate change. Overall, the application of LID techniques in the study area is expected to enhance the sustainability of the urban hydrological cycle in the future.
Precipitation in Korea is greatly affected by topography, and floods occur frequently because of extreme weather. In Seoul, the capital of Korea, frequent urban flooding, as a result of summer precipitation and extreme population concentrations, threatens its sustainability. In addition, changes in the urban hydrologic cycle are expected because of the nonstationarity of the hydrological cycle, which is a major threat to the sustainability of the city. However, future climate projection applying LID techniques was challenging, as it requires a lot of time and effort to conduct modeling with a complicated combination of various techniques for climate change scenarios (CCSs). Recently, LID techniques were implemented in the SWMM, making it easier to analyze the efficacy of LID techniques [24]. LID refers to techniques and design methods implemented to manage urban hydrological cycle systems via functions such as storage, infiltration, and filtration to create hydrological cycle characteristics similar to natural conditions.
Representative LID techniques include green roofs, permeable pavement, planter boxes, tree filter boxes, dry ponds, sand filters, rain barrels, and rain gardens. When LID strategies are applied to rainfall-runoff mitigation, executing complex operations for the hydrological cycle is is required. For example, rain gardens perform the functions of filtration, retention, and infiltration simultaneously. Through these complex functions, the efficient management of the urban hydrological cycle is possible [25]. The rainfall-runoff reduction effects of individual LID techniques are 10–20% for vegetation channels, 25–50% for vegetation retention areas, 45–60% for green roofs, 45–75% for permeable pavement, and 50–90% for infiltration facilities [26]. Simulated runoff through SWMM driven by combinations of LID techniques was analyzed to figure out the performance of LID techniques regarding the mitigation effect on urban runoff volume. In this study, we adopted nine combinations of three techniques (green roof, permeable pavement, and infiltration trench) [26] presented in previous studies and projected its effects to assess the sustainability of the urban hydrological cycle, which is expected to undergo changes due to future climate changes.

2. Study Area and Methodology

2.1. Procedure

The objectives of this study were to project changes in the hydrological cycle of urban watersheds according to future LID scenarios. The projected changes in the future urban hydrological cycle were determined by considering the effects of LID under the impact of climate change. On this basis, the precipitations under SSP2-4.5 and SSP5-8.5 were divided into two groups: current (1981–2005) and future (2046–2075). In addition, precipitation at the global grid scale was downscaled to the scale of the observation station, which included 18 global climate change scenarios under SSP2-4.5 and SSP5-8.5. While earlier research primarily examined the effects of LID techniques, this study provides a comprehensive assessment of both the benefits and limitations of LID methods across an extensive array of climate change scenarios. This study discussed the future direction of water circulation restoration strategies in South Korea. Figure 1 shows the procedure of this study.

2.2. Study Area

The study area, Cheonggye-cheon, has been frequently damaged by flooding (Figure 2). Its watershed slope upstream is very steep at 14.8% and is mainly composed of urbanized regions with a short flood travel time. In addition, as most of the urban facilities, such as housing, are concentrated in the lowlands, most facilities are vulnerable to flooding caused by heavy rainfall in the summer. Thus, in the event of heavy rainfall, runoff is concentrated in the lowlands, and inundation is frequent.
Figure 3 shows the average monthly precipitation (1981–2020) of Seoul, the watershed to be studied. In particular, due to typhoons and rainy seasons in summer, the precipitation was observed to be significantly larger than in other seasons. The risk of flood and inundation damage induced by heavy rainfall in the lowlands is very high.
For SWMM construction, 293 sub-watersheds were divided based on the slope and buildings of the target watershed. Input data were constructed using the runoff curve index for each watershed by examining the land use and soil layer of each watershed. During SWMM construction, the input parameters can be divided into physical and hydrological parameters.
The physical parameters include subwatershed-related parameters, such as the area of the sub-watershed, average slope, and the total impervious area, as well as parameters related to the drainage system, such as the length, pipe diameter, width, and slope of the channel. Meanwhile, hydrological parameters include the Manning roughness coefficients of pervious and impervious watersheds, the Manning roughness coefficients of channels and pipe networks, surface depression storage, infiltration-related parameters, and characteristic width. In this study, the runoff amount was calculated using the runoff curve number (CN) and the roughness coefficient of the watershed. The runoff curve number considers physical and hydrological parameters, such as hydrologic soil groups, land cover types, land cover treatment conditions, hydrological conditions, impermeable areas, and antecedent soil moisture conditions (AMCs). The runoff CN value calculated by considering the type of soil and the state of surface use for each small drainage area was reduced by 10–90% for the entire watershed, with the exception of the rural area. As a result, the CN value based on the AMC-III condition, which is mainly used in Korea, was applied in this study, and it was divided into three types A, B, and D, according to the soil classifications. In addition, the roughness coefficient, which indicates the roughness of the boundary with the flow, was 0.030 for the permeable area and 0.014 for the impermeable area; these values were based on the values presented in the SWMM manual.
Precipitation and runoff data observed from 2017 to 2019 were used to calibrate and correct the constructed SWMM model. The coefficients of determination (R2) and Nash–Sutcliffe Efficiency (NSE) were introduced to evaluate the suitability of the model through three events. In this study, calibration and correction of the model were performed. We employed the parameters of the best simulated and observed events based on the R2 and NSE results.

2.3. Methodology

Bias Correction of Global Climate Models (GCM)

The impact assessment of climate change mainly focused on a statistical relationship based on observations and the variables of the GCM scenarios. Newly GCM scenarios were based on new emission scenarios, SSP [27] (Table 1). GCMs have a large uncertainty, resulting in various resolutions and dynamic systems among the scenarios. Therefore, it is necessary to select appropriate scenarios or utilize all available scenarios [3,28,29]. Most raw GCMs include systematic errors in simulating precipitation. This is known as bias, which is the difference between observation and simulation [30,31]. Therefore, it is necessary to post-process the climate model output, based on [32] with a different combination of GCMs, to replicate the observed climate via bias correction (Table 2). Quantile Mapping (QM) is a bias-correction method and can be downscaled to the scale of the observation station. Equation 1 mathematically formalizes the transformation of the model data, x m , p , into bias-corrected projections, x ^ o , p , by mapping the cumulative probabilities of model data onto the historical observations as shown below:
x ^ o , p = F o , h 1 [ F m , p ( x m , p ) ]
where x m , p and x ^ o , p denote the climate model data and the estimated future observation during projected future periods, respectively. F m , p represents the cumulative distribution function (CDF) from the modeled data during projected periods, and F o , h 1 represents the inverse CDF from the observation during historical periods. Climate model data were used to determine the quantile level, and then the bias-corrected projection with respect to historical distribution was reproduced. The effectiveness of QM lies in its ability to match the statistical properties of the projected data with the observed data, thereby potentially improving the reliability of climate projections. Herein, we produced a downscaled regional climate scenario using QM.

3. Results

3.1. Projection of Change in Precipitation and Runoff of Future

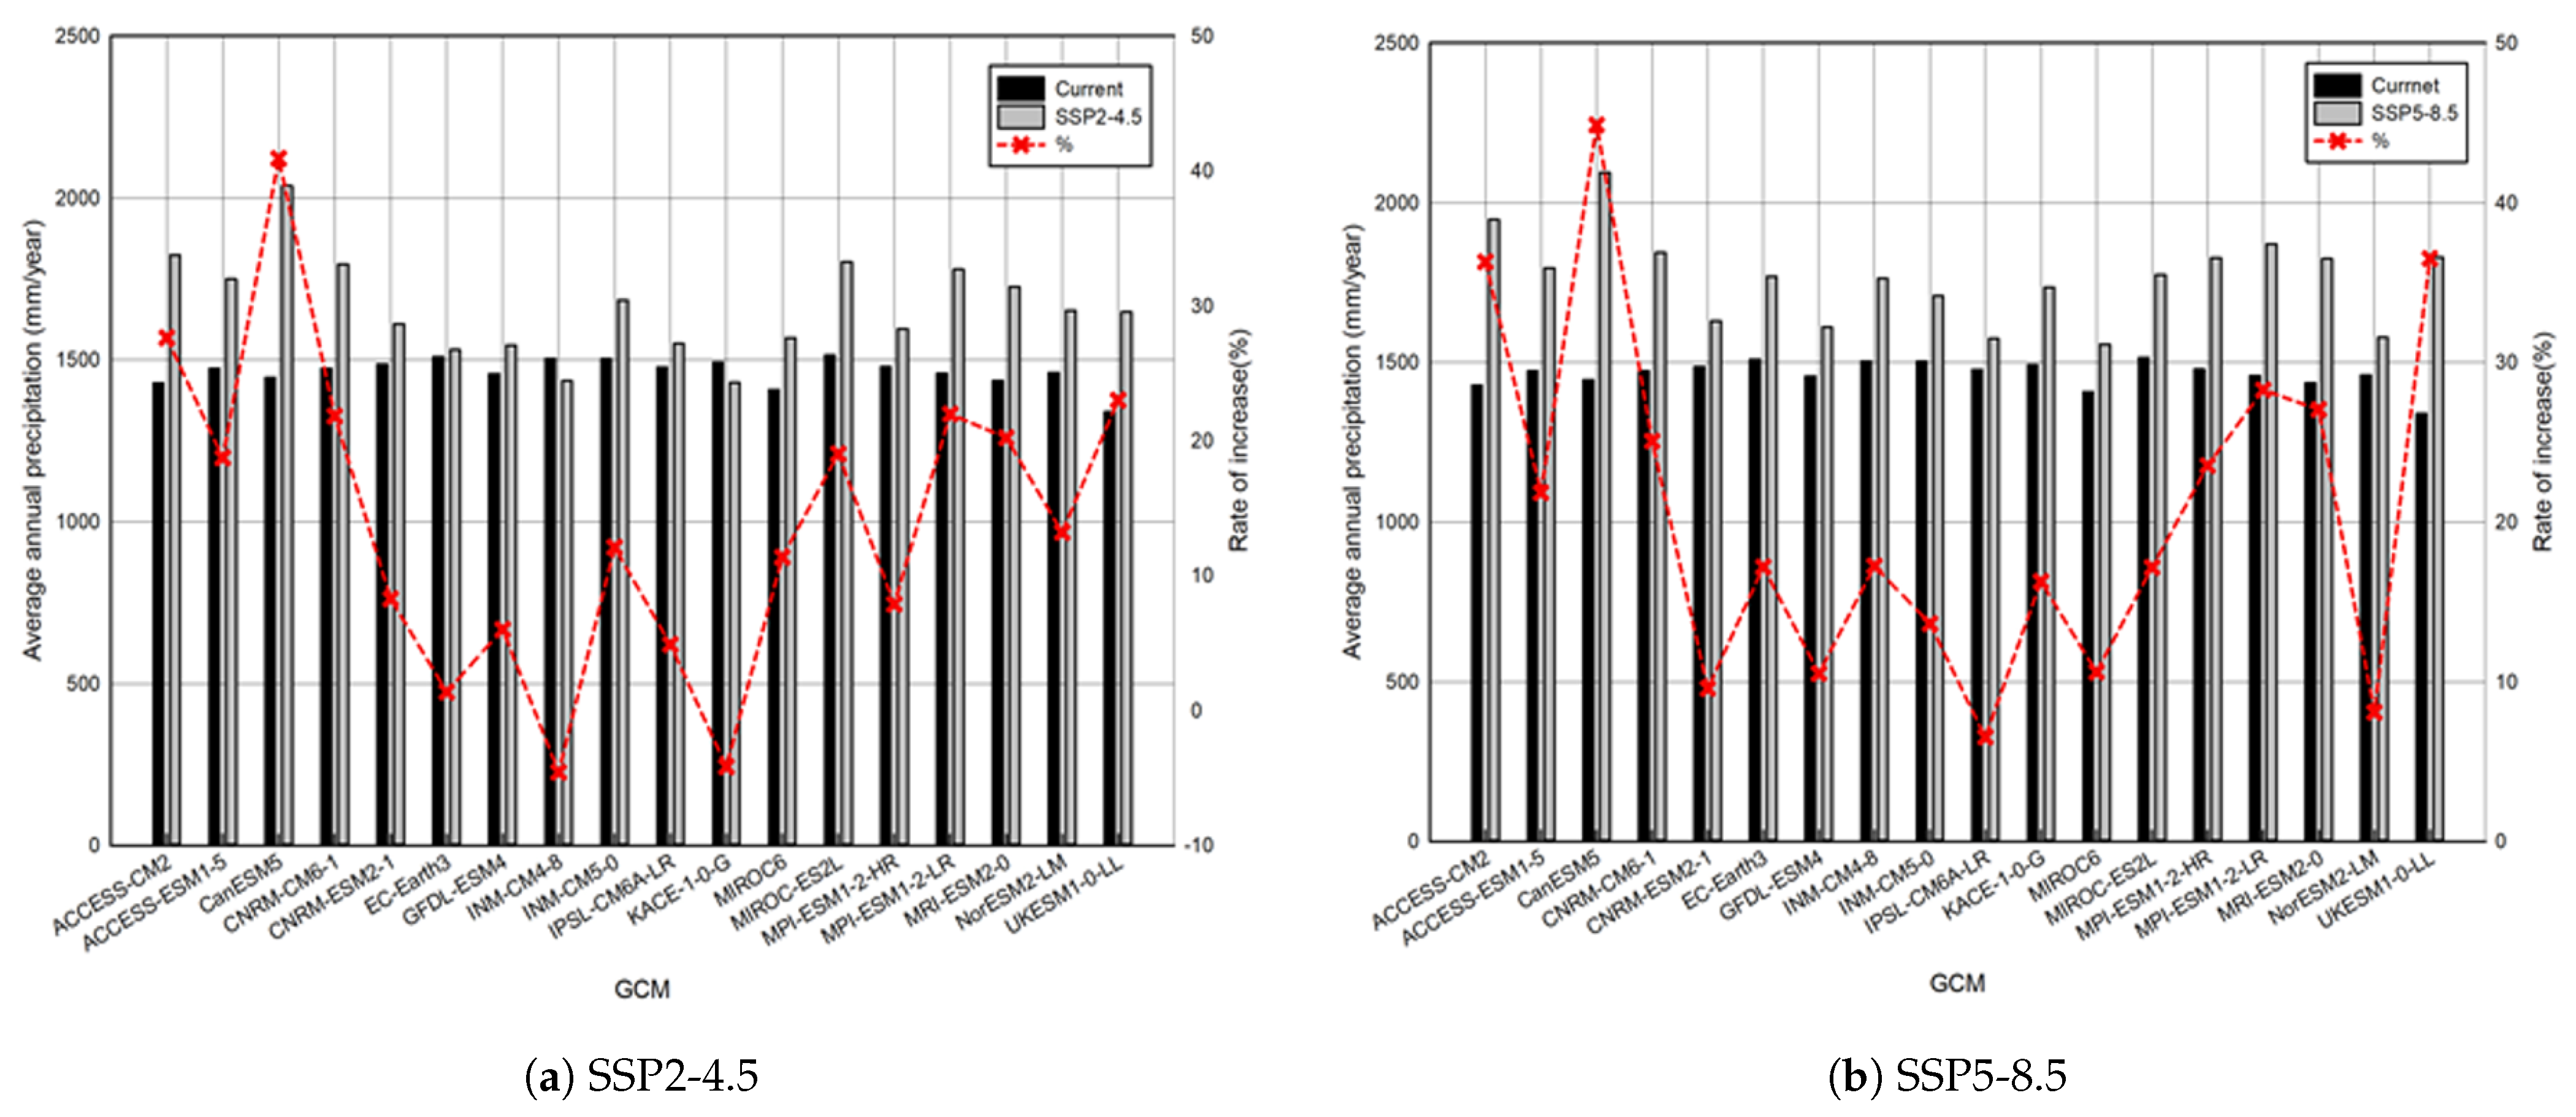
Future precipitation changes in the Seoul region from 2046 to 2075 were projected according to the SSP scenario. In the scope of South Korea’s commitment to attain carbon neutrality by 2050, it is anticipated that significant shifts in climate change mitigation strategies will occur by the year 2050. As a result, a comprehensive assessment of the climate change impact for the period spanning from 2046 to 2075 has been undertaken. The annual average precipitation under the current climate (1981–2005) of the 18 GCMs was 1463.8 mm, with minimum and maximum values of 1339.62 mm and 1514.5 mm, respectively, and the standard deviation was 41.3 mm. The annual average precipitation of the SSP2-4.5 scenario for the future period (2046–2075) was 1664.8 mm, in which the minimum and maximum values were 1429.8 mm and 2037.1 mm, respectively, and the standard deviation was 148.2 mm. Thus, there was a 13.9% increase in precipitation in the SSP2-4.5 scenario based on the future period, as compared with the current period. ACCESS-CM2 showed the highest increase of 27.6%, and INM-CM4-8 exhibited a decrease of 4.6%. Meanwhile, in the SSP5-8.5 scenario, the annual average precipitation was 1762.9 mm, wherein the minimum and maximum values were 1557.3 mm and 2094.1 mm, respectively, and the standard deviation was 135.8 mm. In SSP5-8.5, the average precipitation based on the future period was 20.6% higher than that based on the current period. UKESM1-0-LL showed the largest increase (36.5%), and IPSL-CM6A-LR showed the smallest increase (6.5%) (Figure 4).
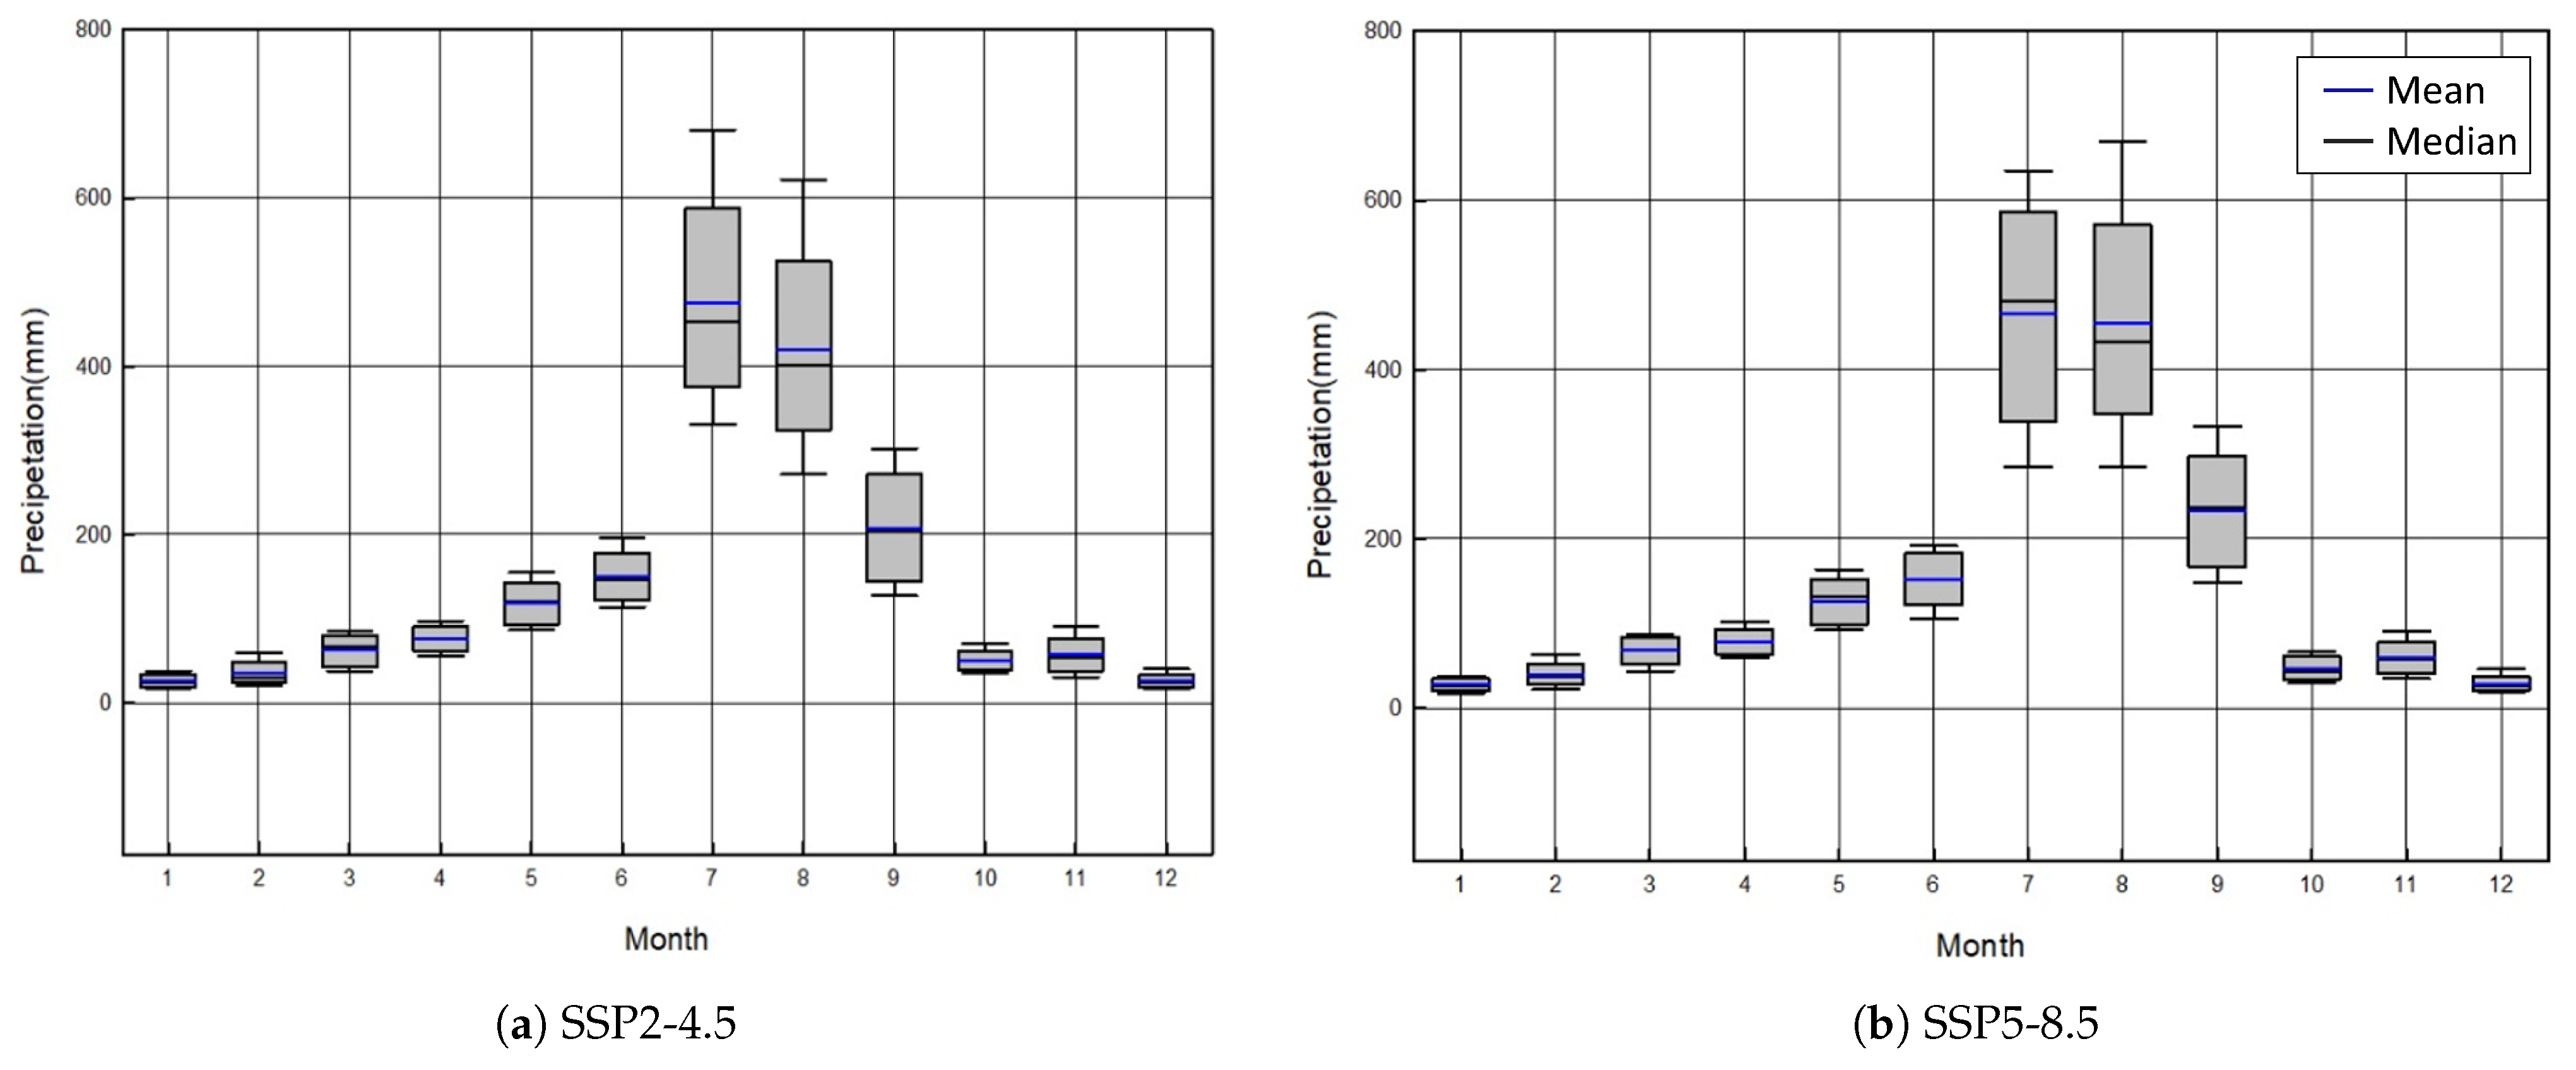
The annual variability of precipitation under future climates has been previously investigated. The inter-model internal variability of the monthly average precipitation is investigated for each GCM according to scenarios SSP2-4.5 and SSP5-8.5 under the future climate scenario. In SSP2-4.5 and SSP5-8.5, the precipitation rates in July and August were high, and inter-model variability was large. In the SSP2-4.5 scenario, the precipitation of CNRM-CM6-1 was 681.5 mm, and that of INM-CM4-8 was 331.9 mm in July; the deviation between these models was 349.6 mm. Meanwhile, in August, CanESM5 and MIROC6 produced precipitation values of 622.3 mm and 271.8 mm, respectively, wherein the deviation was 350.6 mm, which was larger than that of the other months. Regarding the SSP5-8.5 scenario, in July, CNRM-CM6-1 exhibited precipitation of 635.2 mm, and the IPSL-CM6A-LR model projected 285.2 mm of precipitation, wherein the deviation between the models was 350.0 mm. In August, CanESM5 projected 669.6 mm of precipitation, and MIROC6 projected 284.4 mm of precipitation, wherein the deviation between the models was 385.2 mm. The monthly variability shown in Figure 5 is characteristic of the observed precipitation in Korea, as the summer, July to August, is more volatile than the other seasons, and the average precipitation is large.

3.2. Urban Hydrological Cycle Considering LID

The SWMM-LID model incorporates a function for analyzing the hydrological impacts of the LID rainwater-management infrastructure. The United States Environmental Protection Agency (EPA) developed the SWMM model to simulate LID techniques [37], such as bioretention ponds, wetlands, infiltration trenches, vegetated swale permeable pavement, and green roofs.
In this study, we projected changes in the hydrological cycle according to future climate change scenarios by applying the LID techniques of permeable pavement, green roofs, and infiltration trenches, which are considered suitable for urban watersheds by changing their weights (Table 3). The weight application was divided into a total of 293 areas after constructing a basin in which a manhole was the lowest runoff based on the observation map of the target basin and multiplying each area by the weight of the LID techniques, as listed in Table 3. Nine combinations of LID techniques were applied to 18 GCMs.
There is a "Subjective method" and there is a "Statistical method” for weight calculation. In this study, the weight calculation with the subjective method was used. The subjective method is the simplest method for calculating weights, in which the researcher subjectively determines the weights of individual detailed indexes without objective analysis. Subjective methods determine weights based on the preferences or decisions of the decision makers [38]. In this study, the weights used for the analysis are different, ranging from 0, 1/3 to 2/3, in order to make the sum of the weights applied to the three LID techniques equal to 1 for decision making. This methodology was performed to be able to select the best combination among the three LID techniques that produce the lowest runoff at the target basin. In addition, the expressions according to weighting were as follows: P = porous portion, G = green roof, and I = infiltration trench. The numbers after these abbreviations were 0.0, 0.3, and 0.6, which indicated that the LID techniques were applied to 0, 1/3, or 2/3, respectively, of the total applicable area. These expressions were thus denoted as follows: ➀ is P-0.3 G-0.3 I-0.3, ➁ is P-0.6 G-0.3 I-0.0, ➂ is P-0.6 G-0.0 I-0.3, ➃ is P-0.0 G-0.6 I-0.3, ➄ is P-0.0 G-0.3 I-0.6, ➅ is P-0.3 G-0.0 I-0.6, ➆ is P-1.0 G-0.0 I-0.0, ➇ is P-0.0 G-1.0 I-0.0, and ➈ is P-0.0 G-0.0 I-1.0.
Nine LID techniques were applied to eighteen climate change scenarios to predict changes in the hydrological cycle for each SSP scenario. For the future period, when the three LID techniques of permeable pavement, green roof, and infiltration trench were applied to the SSP2-4.5 and SSP5-8.5 scenarios, the following hydrological cycles were projected (Figure 6). The application of the permeable pavement (➆) and infiltration trench ➈ to the entire watershed exhibited an excellent runoff-reduction effect. The best performance for reducing runoff was the combination of ➂ and ➅, which applied 1/3, 2/3 or 2/3, and 1/3 of the permeable pavement and infiltration trench, respectively. Conversely, runoff increased by 1–10% in ➇, wherein a green roof is applied to the entire city center because the ratio of the area to which the green roof can be applied is very low at approximately 2.64%.
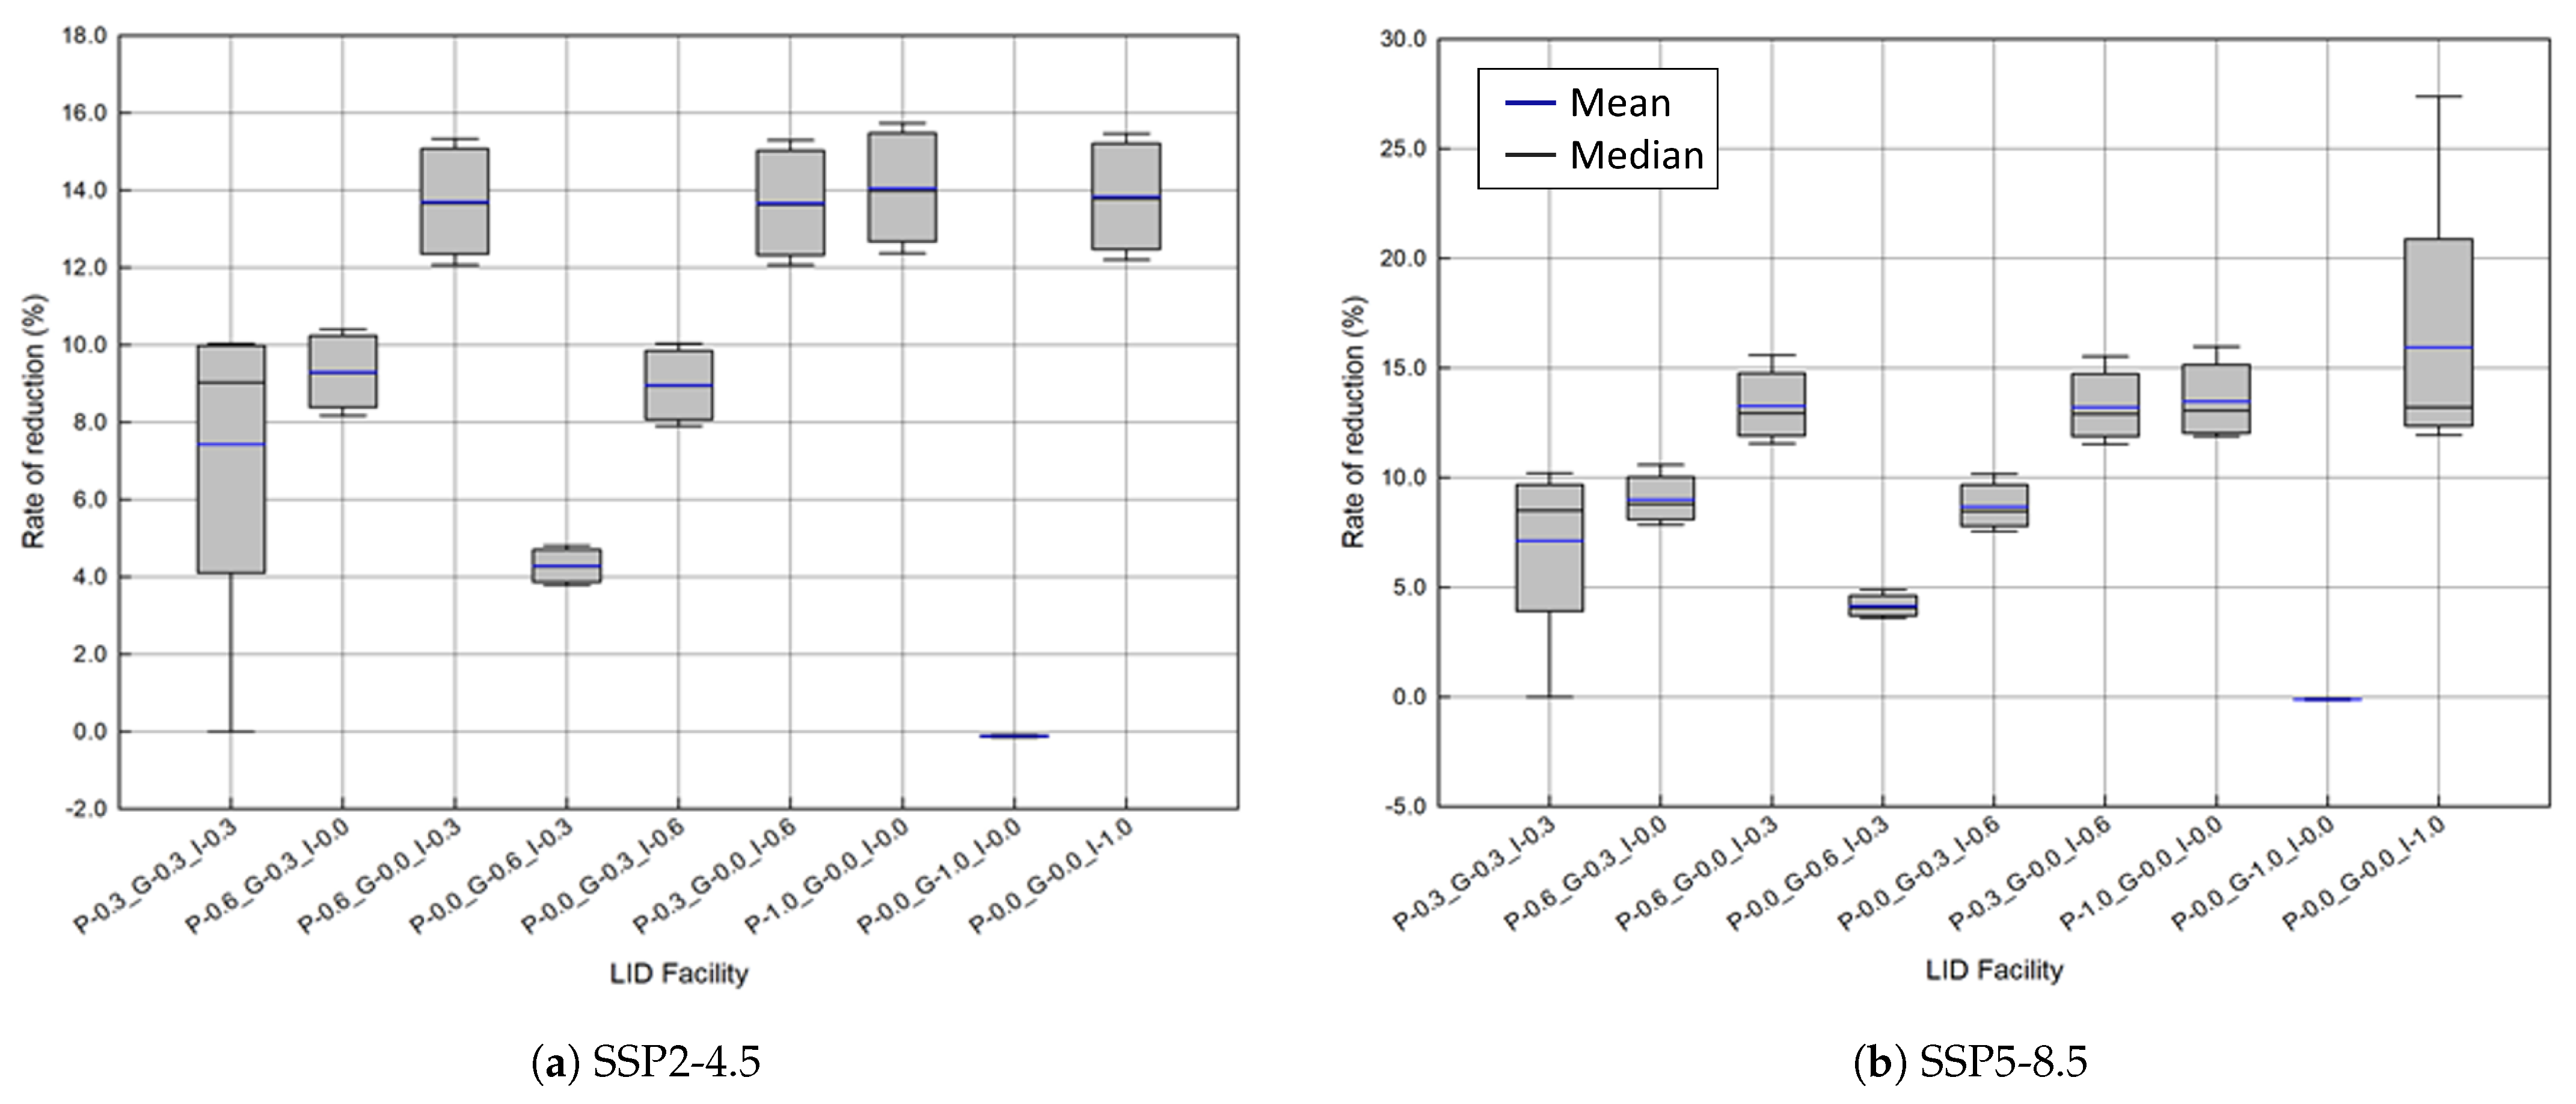
Figure 7 shows the runoff reduction rates before and after the application of LID techniques in the future climate. In addition, the ratio between future runoff without considering LID and that after applying LID to the future runoff was determined. For each GCM, the runoff considering LID, as compared with that not considering LID, decreased by approximately −0.2% to 27.4%, although it varied depending on the GCM and the LID technique applied. Specifically, GFDL-ESM4, IPSL-CM6A-LR, and MIROC6 had the highest runoff-reduction rates in the SSP2-4.5 and SSP 5-8.5 scenarios, although there were some differences depending on the applied LID techniques (Table 4 and Table 5). Overall, the results show that LID techniques effectively reduce runoff. In scenarios based on SSP2-4.5, the models exhibited lower variation in daily precipitation throughout the year compared to those based on SSP5-8.5. As a result, the LID technique demonstrated superior efficacy in reducing runoff under SSP2-4.5 conditions compared to SSP5-8.5. These findings underscore the necessity for the additional implementation of LID techniques in scenarios characterized by more severe greenhouse gas emissions.
Figure 8 shows the average runoff based on the current and future periods. According to the results, permeable pavement and infiltration trenches both exhibit excellent performance in runoff reduction. Therefore, in order to improve the sustainability of urban hydrological circulation through the application of the LID technique, it is necessary to determine the applicability of the technology regarding the conditions based on the advantages and disadvantages of the LID technique on the target location.

4. Discussion

Precipitation in Korea is concentrated in the summer, accounting for approximately 30% of the total annual precipitation. In the future, summer precipitation will increase by 5–10%. In addition, the CMIP5 projected an overall increase in precipitation throughout Korea [13,19]. The precipitation under the previous climate change scenario of the CMIP5 (RCP) increased by 4.8% and 12.3% in RCP 4.5 and RCP8.5, respectively [16]. Moreover, the precipitation under the new climate change scenario of CMIP6 (SSP), which was analyzed in this study, shows increasing rates of 13.9% and 20.6% in SSP2-4.5 and SSP5-8.5, respectively. While previous studies emphasized that RCP8.5 is more uncertain than RCP4.5 [13], in the case of SSPs, the difference in inter-model variability between SSP2-4.5 and SSP5-8.5 was not relatively large, indicating that the uncertainties of SSP2-4.5 and SSP5-8.5 are generally smaller than those of RCP4.5 and RCP8.5. On this basis, the results of Song et al. [19] were in good agreement with those of this study.
Green roofs are superior in the landscape to permeable pavement and infiltration trenches, and by applying a green roof, it is possible to delay roof runoff [39]. However, in our study, the case study area was relatively small, and it is expected that the effect of green roofs will vary depending on the size of the study area. In this study, only three types of LID techniques were investigated. Therefore, when applying LID techniques in the future, an appropriate combination of LID techniques should be proposed considering the advantages and disadvantages of each technique (e.g., in the case of permeable pavement, permeability is excellent, but continuous maintenance is required due to the clogging of pores). Thus, the harmonious performance of multiple techniques can minimize the disadvantages of LID applications. Then, the result of the runoff reduction according to the combination of other LID techniques will be different. In addition, in order to present the direction of Korea’s water management policy to reduce the amount of both precipitation and runoff in urban watersheds, research using a combination of various LID techniques should be conducted.
When implementing Low-Impact Development (LID) techniques, it is crucial to take into consideration the specific characteristics of each technique, including factors such as soil properties, application area, and maintenance requirements. Failing to do so may result in the application of inappropriate LID techniques for the existing natural terrain and soil conditions [40]. Additionally, neglecting to account for the interaction between different LID technologies and opting for simplistic installations can lead to unnecessary expenses. Consequently, it is imperative to incorporate assessments of runoff reduction efficiency, technology interactions, and cost–benefit analyses into the application of LID techniques. Moreover, it is advisable to establish objectives aimed at minimizing hydraulic changes stemming from development activities. To optimize the effectiveness of Low-Impact Development practices, it is equally important to consider the long-term sustainability and adaptability of these techniques in response to changing climatic conditions, ensuring that the implemented solutions continue to perform efficiently in the face of variable weather patterns and do not become obsolete or require excessive modification as environmental conditions evolve.

5. Conclusions

This study projected future urban hydrological cycle changes based on LID techniques in Cheonggye-cheon. According to SSP2-4.5 and SSP5-8.5, the precipitation from 18 GCMs was downscaled to the observation scale. As a result, ensemble averages of annual precipitation in the future were projected to be 1664.8 mm (SSP2-4.5) and 1762.9 mm (SSP5-8.5). Compared with current conditions, precipitation was expected to increase by 13.9% (SSP2-4.5) and 20.6% (SSP5-8.5).
On this basis, an increase in runoff in the urban hydrological cycle is expected because of the non-stationarity of precipitation projected by the climate change scenarios. Therefore, this study projected the changes in urban runoff from introducing combinations of LID techniques under different SSP scenarios. In particular, we considered permeable pavement, green roofs, and infiltration trenches. The application of permeable pavement and infiltration trenches to the watershed had the greatest effect on runoff reduction. Meanwhile, application of a green roof to the entire study area resulted in an insignificant reduction.
Regarding flood concentration time lag and landscape qualities, green roofs can also be effective depending on the area size. In the future, we will focus on the economic benefits and maintenance costs for various types of LID techniques. In addition, we plan to develop an evaluation method that can accurately reflect RCP information and other state-of-the-art scenarios.
According to the climate change scenario, the amount of precipitation increases, and the runoff increases consequently. However, when LID techniques are applied, it can be seen that the increased rate of runoff decreases. This minimizes the impact of urban development and illustrates the function of LID techniques that have been developed to be as similar as possible to the hydrological water cycle before urban development. Therefore, the application of LID techniques is expected to restore natural water circulation throughout the basin.

Author Contributions

Conceptualization, Y.-H.S. and E.H.Y.; analysis and writing, J.H.S. and E.H.Y.; Data collection and figure drawing, E.H.Y. and B.-S.K.; Writing and typesetting, K.-W.S. and Y.-H.S.; Revision and funding acquisition, E.H.Y.; Validation, J.-R.C. All authors have read and agreed to the published version of the manuscript.

Funding

This research was supported by a grant (2022-MOIS61-001) of Development Risk Prediction Technology of Storm and Flood For Climate Change based on Artificial Intelligence funded by Ministry of Interior and Safety (MOIS, Republic of Korea).

Data Availability Statement

Data sharing is not applicable to this article.

Conflicts of Interest

Author Eui-Hyeok Yoon was employed by the company Saman Corp. The remaining authors declare that the research was conducted in the absence of any commercial or financial relationships that could be construed as a potential conflict of interest.

References

  1. Wood, E.F.; Roundy, J.K.; Troy, T.J.; Van Beek, L.; Bierkens, M.F.; Blyth, E.; de Roo, A.; Döll, P.; Ek, M.; Famiglietti, J.; et al. Hyperresolution global land surface modeling: Meeting a grand challenge for monitoring Earth’s terrestrial water. Water Resour. Res. 2011, 47, W05301. [Google Scholar] [CrossRef]
  2. Sillmann, J.; Kharin, V.V.; Zwiers, F.W.; Zhang, X.; Bronaugh, D. Climate extremes indices in the CMIP5 multimodel ensemble: Part 2. Future climate projections. J. Geophys. Res. Atmos. 2013, 118, 2473–2493. [Google Scholar]
  3. Sung, J.H.; Kim, Y.O.; Jeon, J.J. Application of distribution-free nonstationary regional frequency analysis based on L-moments. Theor. Appl. Climatol. 2018, 133, 1219–1233. [Google Scholar]
  4. Kingston, D.G.; Todd, M.C.; Taylor, R.G.; Thompson, J.R.; Arnell, N.W. Uncertainty in the estimation of potential evapotranspiration under climate change. Geophys. Res. Lett. 2009, 36, L20403. [Google Scholar] [CrossRef]
  5. Wilby, R.L.; Dessai, S. Robust adaptation to climate change. Weather 2010, 65, 180–185. [Google Scholar]
  6. Yang, Y.; Zhuang, Q.; Tian, G.; Wei, S. A management and environmental performance evaluation of China’s family farms using an ultimate comprehensive cross-efficiency model (UCCE). Sustainability 2018, 11, 6. [Google Scholar] [CrossRef]
  7. Hajiaghaei-Keshteli, M.; Fathollahi Fard, A.M. Sustainable closed-loop supply chain network design with discount supposition. Neural Comput. Appl. 2019, 31, 5343–5377. [Google Scholar]
  8. Ghadami, N.; Gheibi, M.; Kian, Z.; Faramarz, M.G.; Naghedi, R.; Eftekhari, M.; Fathollahi-Fard, A.M.; Dulebenets, M.A.; Tian, G. Implementation of solar energy in smart cities using an integration of artificial neural network, photovoltaic system and classical Delphi methods. Sustain. Cities Soc. 2021, 74, 103149. [Google Scholar]
  9. Sung, J.H.; Chung, E.S.; Shahid, S. Reliability–Resiliency–Vulnerability approach for drought analysis in South Korea using 28 GCMs. Sustainability 2018, 10, 3043. [Google Scholar] [CrossRef]
  10. Räisänen, J.; Palmer, T. A probability and decision-model analysis of a multimodel ensemble of climate change simulations. J. Clim. 2001, 14, 3212–3226. [Google Scholar] [CrossRef]
  11. Rajagopalan, B.; Lall, U.; Zebiak, S.E. Categorical climate forecasts through regularization and optimal combination of multiple GCM ensembles. Mon. Weather Rev. 2002, 130, 1792–1811. [Google Scholar] [CrossRef]
  12. Raftery, A.E.; Gneiting, T.; Balabdaoui, F.; Polakowski, M. Using Bayesian model averaging to calibrate forecast ensembles. Mon. Weather Rev. 2005, 133, 1155–1174. [Google Scholar] [CrossRef]
  13. Sung, J.H.; Eum, H.I.; Park, J.; Cho, J. Assessment of climate change impacts on extreme precipitation events: Applications of CMIP5 climate projections statistically downscaled over South Korea. Adv. Meteorol. 2018, 2018, 1–12. [Google Scholar] [CrossRef]
  14. Sung, J.H.; Kwon, M.; Jeon, J.J.; Seo, S.B. A projection of extreme precipitation based on a selection of CMIP5 GCMs over North Korea. Sustainability 2019, 11, 1976. [Google Scholar] [CrossRef]
  15. Doblas-Reyes, F.J.; Hagedorn, R.; Palmer, T. The rationale behind the success of multi-model ensembles in seasonal forecasting—II. Calibration and combination. Tellus A Dyn. Meteorol. Oceanogr. 2005, 57, 234–252. [Google Scholar]
  16. Giorgi, F.; Mearns, L.O. Calculation of average, uncertainty range, and reliability of regional climate changes from AOGCM simulations via the “reliability ensemble averaging”(REA) method. J. Clim. 2002, 15, 1141–1158. [Google Scholar] [CrossRef]
  17. O’Neill, B.C.; Tebaldi, C.; Van Vuuren, D.P.; Eyring, V.; Friedlingstein, P.; Hurtt, G.; Knutti, R.; Kriegler, E.; Lamarque, J.F.; Lowe, J.; et al. The scenario model intercomparison project (ScenarioMIP) for CMIP6. Geosci. Model Dev. 2016, 9, 3461–3482. [Google Scholar] [CrossRef]
  18. Xin, X.; Wu, T.; Zhang, J.; Yao, J.; Fang, Y. Comparison of CMIP6 and CMIP5 simulations of precipitation in China and the East Asian summer monsoon. Int. J. Climatol. 2020, 40, 6423–6440. [Google Scholar] [CrossRef]
  19. Song, Y.H.; Nashwan, M.S.; Chung, E.S.; Shahid, S. Advances in CMIP6 INM-CM5 over CMIP5 INM-CM4 for precipitation simulation in South Korea. Atmos. Res. 2021, 247, 105261. [Google Scholar] [CrossRef]
  20. Bao, Z.; Yang, H.; Li, W.; Xu, Y.; Huang, G. A Low-Impact Development–Based Multi-Objective Optimization Model for Regional Water Resource Management under Impacts of Climate Change. Front. Earth Sci. 2020, 8, 527388. [Google Scholar] [CrossRef]
  21. Zahmatkesh, Z.; Burian, S.J.; Karamouz, M.; Tavakol-Davani, H.; Goharian, E. Low-impact development practices to mitigate climate change effects on urban stormwater runoff: Case study of New York City. J. Irrig. Drain. Eng. 2015, 141, 04014043. [Google Scholar] [CrossRef]
  22. Pour, S.H.; Abd Wahab, A.K.; Shahid, S.; Asaduzzaman, M.; Dewan, A. Low impact development techniques to mitigate the impacts of climate-change-induced urban floods: Current trends, issues and challenges. Sustain. Cities Soc. 2020, 62, 102373. [Google Scholar] [CrossRef]
  23. Barbu, I.A.; Ballestero, T.P.; Roseen, R.M. LID-SWM practices as a means of resilience to climate change and its effects on groundwater recharge. In Proceedings of the World Environmental and Water Resources Congress 2009: Great Rivers, Kansas City, MS, USA, 17–21 May 2009; pp. 1–10. [Google Scholar]
  24. Rossman, L.A. Storm Water Management Model user’s Manual, Version 5.0; National Risk Management Research Laboratory, Office of Research and Development, U.S. Environmental Protection Agency: Washington, DC, USA, 2010.
  25. Battiata, J.; Collins, K.; Hirschman, D.; Hoffmann, G. The runoff reduction method. J. Contemp. Water Res. Educ. 2010, 146, 11–21. [Google Scholar] [CrossRef]
  26. Chen, B.; Liu, J.; She, N.; Xu, K. Optimization of Low-Impact Development Facilities in the Beijing CITIC Complex. In Proceedings of the International Low Impact Development Conference 2015: LID: It Works in All Climates and Soils, Houston, TX, USA, 19–21 January 2015; pp. 342–351. [Google Scholar]
  27. O’Neill, B.C.; Kriegler, E.; Ebi, K.L.; Kemp-Benedict, E.; Riahi, K.; Rothman, D.S.; Van Ruijven, B.J.; Van Vuuren, D.P.; Birkmann, J.; Kok, K.; et al. The roads ahead: Narratives for shared socioeconomic pathways describing world futures in the 21st century. Glob. Environ. Chang. 2017, 42, 169–180. [Google Scholar] [CrossRef]
  28. Song, Y.H.; Chung, E.S.; Shiru, M.S. Uncertainty analysis of monthly precipitation in GCMs using multiple bias correction methods under different RCPs. Sustainability 2020, 12, 7508. [Google Scholar] [CrossRef]
  29. Homsi, R.; Shiru, M.S.; Shahid, S.; Ismail, T.; Harun, S.B.; Al-Ansari, N.; Chau, K.W.; Yaseen, Z.M. Precipitation projection using a CMIP5 GCM ensemble model: A regional investigation of Syria. Eng. Appl. Comput. Fluid Mech. 2020, 14, 90–106. [Google Scholar] [CrossRef]
  30. Pierce, D.W.; Cayan, D.R.; Maurer, E.P.; Abatzoglou, J.T.; Hegewisch, K.C. Improved bias correction techniques for hydrological simulations of climate change. J. Hydrometeorol. 2015, 16, 2421–2442. [Google Scholar] [CrossRef]
  31. Maraun, D. Bias correction, quantile mapping, and downscaling: Revisiting the inflation issue. J. Clim. 2013, 26, 2137–2143. [Google Scholar] [CrossRef]
  32. Iqbal, Z.; Shahid, S.; Ahmed, K.; Ismail, T.; Ziarh, G.F.; Chung, E.S.; Wang, X. Evaluation of CMIP6 GCM rainfall in mainland Southeast Asia. Atmos. Res. 2021, 254, 105525. [Google Scholar] [CrossRef]
  33. Supharatid, S.; Nafung, J. Projected drought conditions by CMIP6 multimodel ensemble over Southeast Asia. J. Water Clim. Chang. 2021, 12, 3330–3354. [Google Scholar] [CrossRef]
  34. Zarrin, A.; Dadashi-Roudbari, A. Projection of future extreme precipitation in Iran based on CMIP6 multi-model ensemble. Theor. Appl. Climatol. 2021, 144, 643–660. [Google Scholar] [CrossRef]
  35. Li, S.Y.; Miao, L.J.; Jiang, Z.H.; Wang, G.J.; Gnyawali, K.R.; Zhang, J.; Zhang, H.; Fang, K.; He, Y.; Li, C. Projected drought conditions in Northwest China with CMIP6 models under combined SSPs and RCPs for 2015–2099. Adv. Clim. Chang. Res. 2020, 11, 210–217. [Google Scholar] [CrossRef]
  36. Brient, F.; Roehrig, R.; Voldoire, A. Evaluating marine stratocumulus clouds in the CNRM-CM6-1 model using short-term hindcasts. J. Adv. Model. Earth Syst. 2019, 11, 127–148. [Google Scholar] [CrossRef]
  37. Rossman, L.A.; Huber, W.C. Storm Water Management Model Reference Manual. Volume III—Water Quality; U.S. EPA Office of Research and Development: Washington, DC, USA, 2016.
  38. Chung, E.S.; Abdulai, P.J.; Park, H.; Kim, Y.; Ahn, S.R.; Kim, S.J. Multi-criteria assessment of spatial robust water resource vulnerability using the TOPSIS method coupled with objective and subjective weights in the Han River basin. Sustainability 2016, 9, 29. [Google Scholar] [CrossRef]
  39. Palermo, S.A.; Turco, M.; Principato, F.; Piro, P. Hydrological effectiveness of an extensive green roof in Mediterranean climate. Water 2019, 11, 1378. [Google Scholar] [CrossRef]
  40. Lee, J.H.; Choi, S.; Kim, T.; Ju, Y.; Chae, E. LID (Low Impct Development) Implementation Scheme for Environmental Impact Assessment; Korea Environment Insititute: Seoul, Republic of Korea, 2014. [Google Scholar]
Figure 1. Procedure of this study.
Water 15 04002 g001
Figure 2. Study area: Cheonggye-cheon watershed, Seoul, South Korea.
Water 15 04002 g002
Figure 3. Average monthly precipitation in Seoul.
Water 15 04002 g003
Figure 4. Comparison of the annual average precipitation in the future (SSP2-4.8 & SSP5-8.5) vs. the current one based on GCM.
Water 15 04002 g004
Figure 5. Monthly averaged precipitation simulated using SSP2-4.5 and -8.5 which models.
Water 15 04002 g005
Figure 6. Analysis of runoff using a combination of LID techniques.
Water 15 04002 g006
Figure 7. Rate of reduction with the combination of LID techniques.
Water 15 04002 g007
Figure 8. Average runoff of current and future (SSP2-4.5 & SSP5-8.5) scenario.
Water 15 04002 g008
Table 1. Types of SSP scenarios.
TypeAssumptions
SSP1Sustainability—low mitigation and adaptation challenges
SSP2Middle of the road—intermediate mitigation and adaptation challenges
SSP3Fragmentation/regional rivalry—high mitigation and adaptation challenges
SSP4Inequality—low mitigation and high adaptation challenges
SSP5Conventional/fossil-fueled development—high mitigation and low adaptation challenges
Table 2. List of climate models used in this study.
No.GCMResolution (Degrees)Institution
1ACCESS-CM21.25° × 1.875°Commonwealth Scientific and Industrial Research Organisation
2ACCESS-ESM1-5in collaboration with the Queensland Climate Change Centre of Excellence
3CanESM52.81° × 2.81°Canadian Centre for Climate Modelling and Analysis
4CNRM-CM6-1 [33]1.4° × 1.4°Centre National de Recherches Meteorologiques
5CNRM-ESM2-1 [33]1.4° × 1.4°
6EC-Earth30.35° × 0.35°EC-Earth Consortium
7GFDL-ESM4 [34]0.5° × 0.5°Geophysical Fluid Dynamics Laboratory
8INM-CM4-82° × 1.5°Institute for Numerical Mathematics
9INM-CM5-0
10IPSL-CM6A-LR2.5° × 1.27°Institute Pierre-Simon Laplace
11KACE-1-0-G1.875° × 1.25°National Institute of Meteorological
Sciences (NIMS) and Korea
Meteorological Administration
(KMA)
12MIROC61.4° × 1.4°Japan Agency for Marine-Earth Science and Technology, Atmosphere and Ocean Research Institute and National Institute for Environmental Studies
13MIROC-ES2L [35]2.81° × 2.81°Japan Agency for Marine-Earth Science and Technology
14MPI-ESM1-2-HR0.94° × 0.94°Max Planck Institute for Meteorology (MPI-M)
15MPI-ESM1-2-LR1.875° × 1.86°
16MRI-ESM2-01.125° × 1.125°Meteorological Research Institute
17NorESM2-LM2.5° × 1.89°Norwegian Climate Centre
18UKESM1-0-LL [36]0.5° × 0.5°Met Office Hadley Centre
Table 3. Weighted values of LID facilities for the nine combinations in the SWMM model.
IndexPorous PavementGreen RoofInfiltration TrenchScenario #
Weighted value1/31/31/3
2/31/30
2/301/3
02/31/3
01/32/3
1/302/3
100
010
001
Table 4. Reduction rate of runoff according to the SSP2-4.5 scenario and combination of LID techniques in the future period (unit: %).
GCM
ACCESS-CM28.28.512.53.98.212.512.8−0.212.7
ACCESS-ESM1-50.08.913.04.18.513.013.4−0.113.1
CanESM57.98.212.13.87.912.112.4−0.112.2
CNRM-CM6-18.28.612.63.98.212.613.0−0.112.7
CNRM-ESM2-19.19.413.94.39.113.814.3−0.114.0
EC-Earth310.010.415.34.810.015.315.7−0.115.5
GFDL-ESM49.710.114.84.69.714.815.2−0.114.9
INM-CM4-810.010.415.34.810.015.215.7−0.115.4
INM-CM5-09.09.313.74.38.913.614.0−0.113.8
IPSL-CM6A-LR0.08.913.04.18.513.013.4−0.113.1
KACE-1-0-G7.98.212.13.87.912.112.4−0.112.2
MIROC68.28.612.63.98.212.613.0−0.112.7
MIROC-ES2L9.19.413.94.39.113.814.3−0.114.0
MPI-ESM1-2-HR10.010.415.34.810.015.315.7−0.115.5
MPI-ESM1-2-LR9.710.114.84.69.714.815.2−0.114.9
MRI-ESM2-010.010.415.34.810.015.215.7−0.115.4
NorESM2-LM9.09.313.74.38.913.614.0−0.113.8
UKESM1-0-LL10.010.415.34.810.015.215.7−0.115.4
Table 5. Reduction rate of runoff according to the SSP5-8.5 scenario and the combination of LID techniques in the future period (unit: %).
GCM
ACCESS-CM27.67.911.63.67.611.511.9−0.127.4
ACCESS-ESM1-50.08.612.73.98.312.613.0−0.112.8
CanESM57.78.011.83.77.811.812.1−0.111.9
CNRM-CM6-17.98.212.13.87.912.112.4−0.112.2
CNRM-ESM2-19.39.714.24.49.314.214.6−0.114.4
EC-Earth38.68.913.14.18.613.013.4−0.113.2
GFDL-ESM49.59.814.54.59.514.414.9−0.114.6
INM-CM4-88.48.712.84.08.412.813.1−0.112.9
INM-CM5-08.78.913.24.18.613.112.0−0.113.3
IPSL-CM6A-LR0.08.612.73.98.312.613.0−0.112.8
KACE-1-0-G7.78.011.83.77.811.812.1−0.111.9
MIROC67.98.212.13.87.912.112.4−0.112.2
MIROC-ES2L9.39.714.24.49.314.214.6−0.114.4
MPI-ESM1-2-HR8.68.913.14.18.613.013.4−0.113.2
MPI-ESM1-2-LR9.59.814.54.59.514.414.9−0.114.6
MRI-ESM2-08.48.712.84.08.412.813.1−0.112.9
NorESM2-LM8.78.913.24.18.613.112.0−0.113.3
UKESM1-0-LL10.210.615.64.910.215.516.0−0.115.7
Disclaimer/Publisher’s Note: The statements, opinions and data contained in all publications are solely those of the individual author(s) and contributor(s) and not of MDPI and/or the editor(s). MDPI and/or the editor(s) disclaim responsibility for any injury to people or property resulting from any ideas, methods, instructions or products referred to in the content.