Article

Meanders on the Move: Can AI-Based Solutions Predict Where They Will Be Located?

1
Engineering Department, Cardiff University, Cardiff CF10 3AT, UK
2
Department of Civil, Environmental and Mechanical Engineering, University of Trento, 38122 Trento, Italy
3
Civil and Environmental Faculty, University of Tehran (UT), Tehran 1417613131, Iran
*
Author to whom correspondence should be addressed.
Water 2024, 16(17), 2460; https://doi.org/10.3390/w16172460
Submission received: 19 July 2024 / Revised: 19 August 2024 / Accepted: 27 August 2024 / Published: 29 August 2024

Abstract

:
Meandering rivers are complex geomorphic systems that play an important role in the environment. They provide habitat for a variety of plants and animals, help to filter water, and reduce flooding. However, meandering rivers are also susceptible to changes in flow, sediment transport, and erosion. These changes can be caused by natural factors such as climate change and human activities such as dam construction and agriculture. Studying meandering rivers is important for understanding their dynamics and developing effective management strategies. However, traditional methods such as numerical and analytical modeling for studying meandering rivers are time-consuming and/or expensive. Machine learning algorithms can be used to overcome these challenges and provide a more efficient and comprehensive way to study meandering rivers. In this study, we used machine learning algorithms to study the migration rate of simulated meandering rivers using semi-analytical model to investigate the feasibility of employing this new method. We then used machine learning algorithms such as multi-layer perceptron, eXtreme Gradient Boost, gradient boosting regressor, and decision tree to predict the migration rate. The results show ML algorithms can be used for prediction of migration rate, which in turn can predict the planform position.

1. Introduction

The term “meandering river” refers to the natural process that many lowland single-thread rivers go through as a result of intermittent erosion and accretion of streamwise opposite banks, giving these rivers their characteristically wavy pattern [1,2]. Stated differently, the majority of alluvial rivers tend to meander as they run downslope [3]. Numerous factors, including vegetation, sediment supply, flow conditions, and the geological features of the channel margins, influence the evolution of platforms [4]. As it can be seen in Figure 1, the satellite images of four different meanders (free and confined meandering rivers) show some of the morphological and geological features typical of meandering rivers. Because of the spatial patterns of flow and sediment transport, meander bends shift laterally as a result of increased flow velocity at the banks’ toe, which makes the flow capable of removing the bank material that fails from steep, concave banks and that is further deposited on mild, convex banks further downstream during floods [2,5,6]. This meandering process is accelerated not only by the alteration in flow velocity that removes material from the banks, but also by the presence of secondary helical flow that occurs in the bends (e.g., [7]). The secondary flow is produced by the combination of the transverse pressure gradient (caused by the transverse slope of the water surface), the vertical gradient of the main flow velocity, and the centrifugal force caused by the curvature of the channel. The principal longitudinal flow and its transverse circulation combine to create the helical flow characteristic of meander bends [8]. When a bed lacks cohesion, as typical of alluvial channels, the secondary flow pushes sediment particles inward, creating a transverse bed slope [8] and promoting lateral meander migration through alternate sequences of convex bank advance and opposite concave bank retreat.
Prediction of the lateral migration rate of meandering rivers has been partially achieved through physics-based analytical and numerical approaches [9,10,11,12,13]. On one hand, numerical solutions are heavily time-consuming in the same case study compared to analytical solutions, but they can provide more accurate representation of the system behavior [14]. On the other hand, analytical solutions provide more approximate representation of the meandering processes because of their simplifying assumptions, but they facilitate exploring the behavior of the solution in the parameter space and also understanding the role of the different parameters on the processes [3,5,15,16,17]. Although the current models are effective, they are time consuming and computationally demanding, which makes it necessary to investigate alternative data-driven approaches. Moreover, the continuous global collection of hydrological and river morphology data is an invaluable resource for developing data-science-based methodologies, as well as for validating models. Comprehensive hydrological data (drainage, sediment properties, etc.) is gathered in certain areas in conjunction with remotely sensed imagery, which has 16-day update intervals and worldwide coverage. With the help of this extensive information, it may be possible to pinpoint recurring trends in river morphology, which could lead to more accurate predictions. Furthermore, the intrinsic uncertainty and complexity of natural systems frequently make it difficult to fully parameterize all pertinent aspects in conventional models. However, a more manageable way to include these significant aspects into future predictions of river evolution is through data-driven methodologies.
Only very recently have the growing, promising methods of artificial intelligence (AI hereafter) been considered in the context of geomorphological processes through machine learning (ML hereafter), but little attention has been given so far to its use for meandering river migration [18,19,20,21]. The aim of the present work is to explore the feasibility of using ML methods for the prediction of meander migration rate.
To determine whether employing machine learning (ML) methods is feasible for this purpose, we focus on replicating idealized meandering planform using semi-analytical models (based on the solution proposed by [3] and developed by [15]). It is based on a fully coupled hydrodynamic and morphodynamic model that has been shown to realistically reproduce many commonly observed of meandering bend shapes and their evolutions (complex bends, simple bends, and multiple loops), consistently with observations in alluvial meanders (e.g., [5,22,23]).
This work examines the growing topic of meandering river morphodynamics, where artificial intelligence (AI) models are being applied. This research is driven by two main motivations. First, there is still much to learn about the effectiveness and potential of AI models in this field. Second, the numerical prediction models that are now in use are computationally expensive despite their excellent accuracy. The primary goal of recent AI developments in many engineering disciplines has been to maximize model accuracy [24]. Notably, AI model development and assessment have not yet reached the field of river morphodynamics. This work, which is a trailblazing endeavor in this field, focuses on using AI to infer river centerline motion. Our goal is to determine the relationship between important flow- and planform-dependent factors and centerline migration. These variables include the reach-averaged dimensionless parameters and the spatial series of the channel centerline curvature, which characterize the hypothetical uniform flow in a straight channel with the same hydro-morphological features.

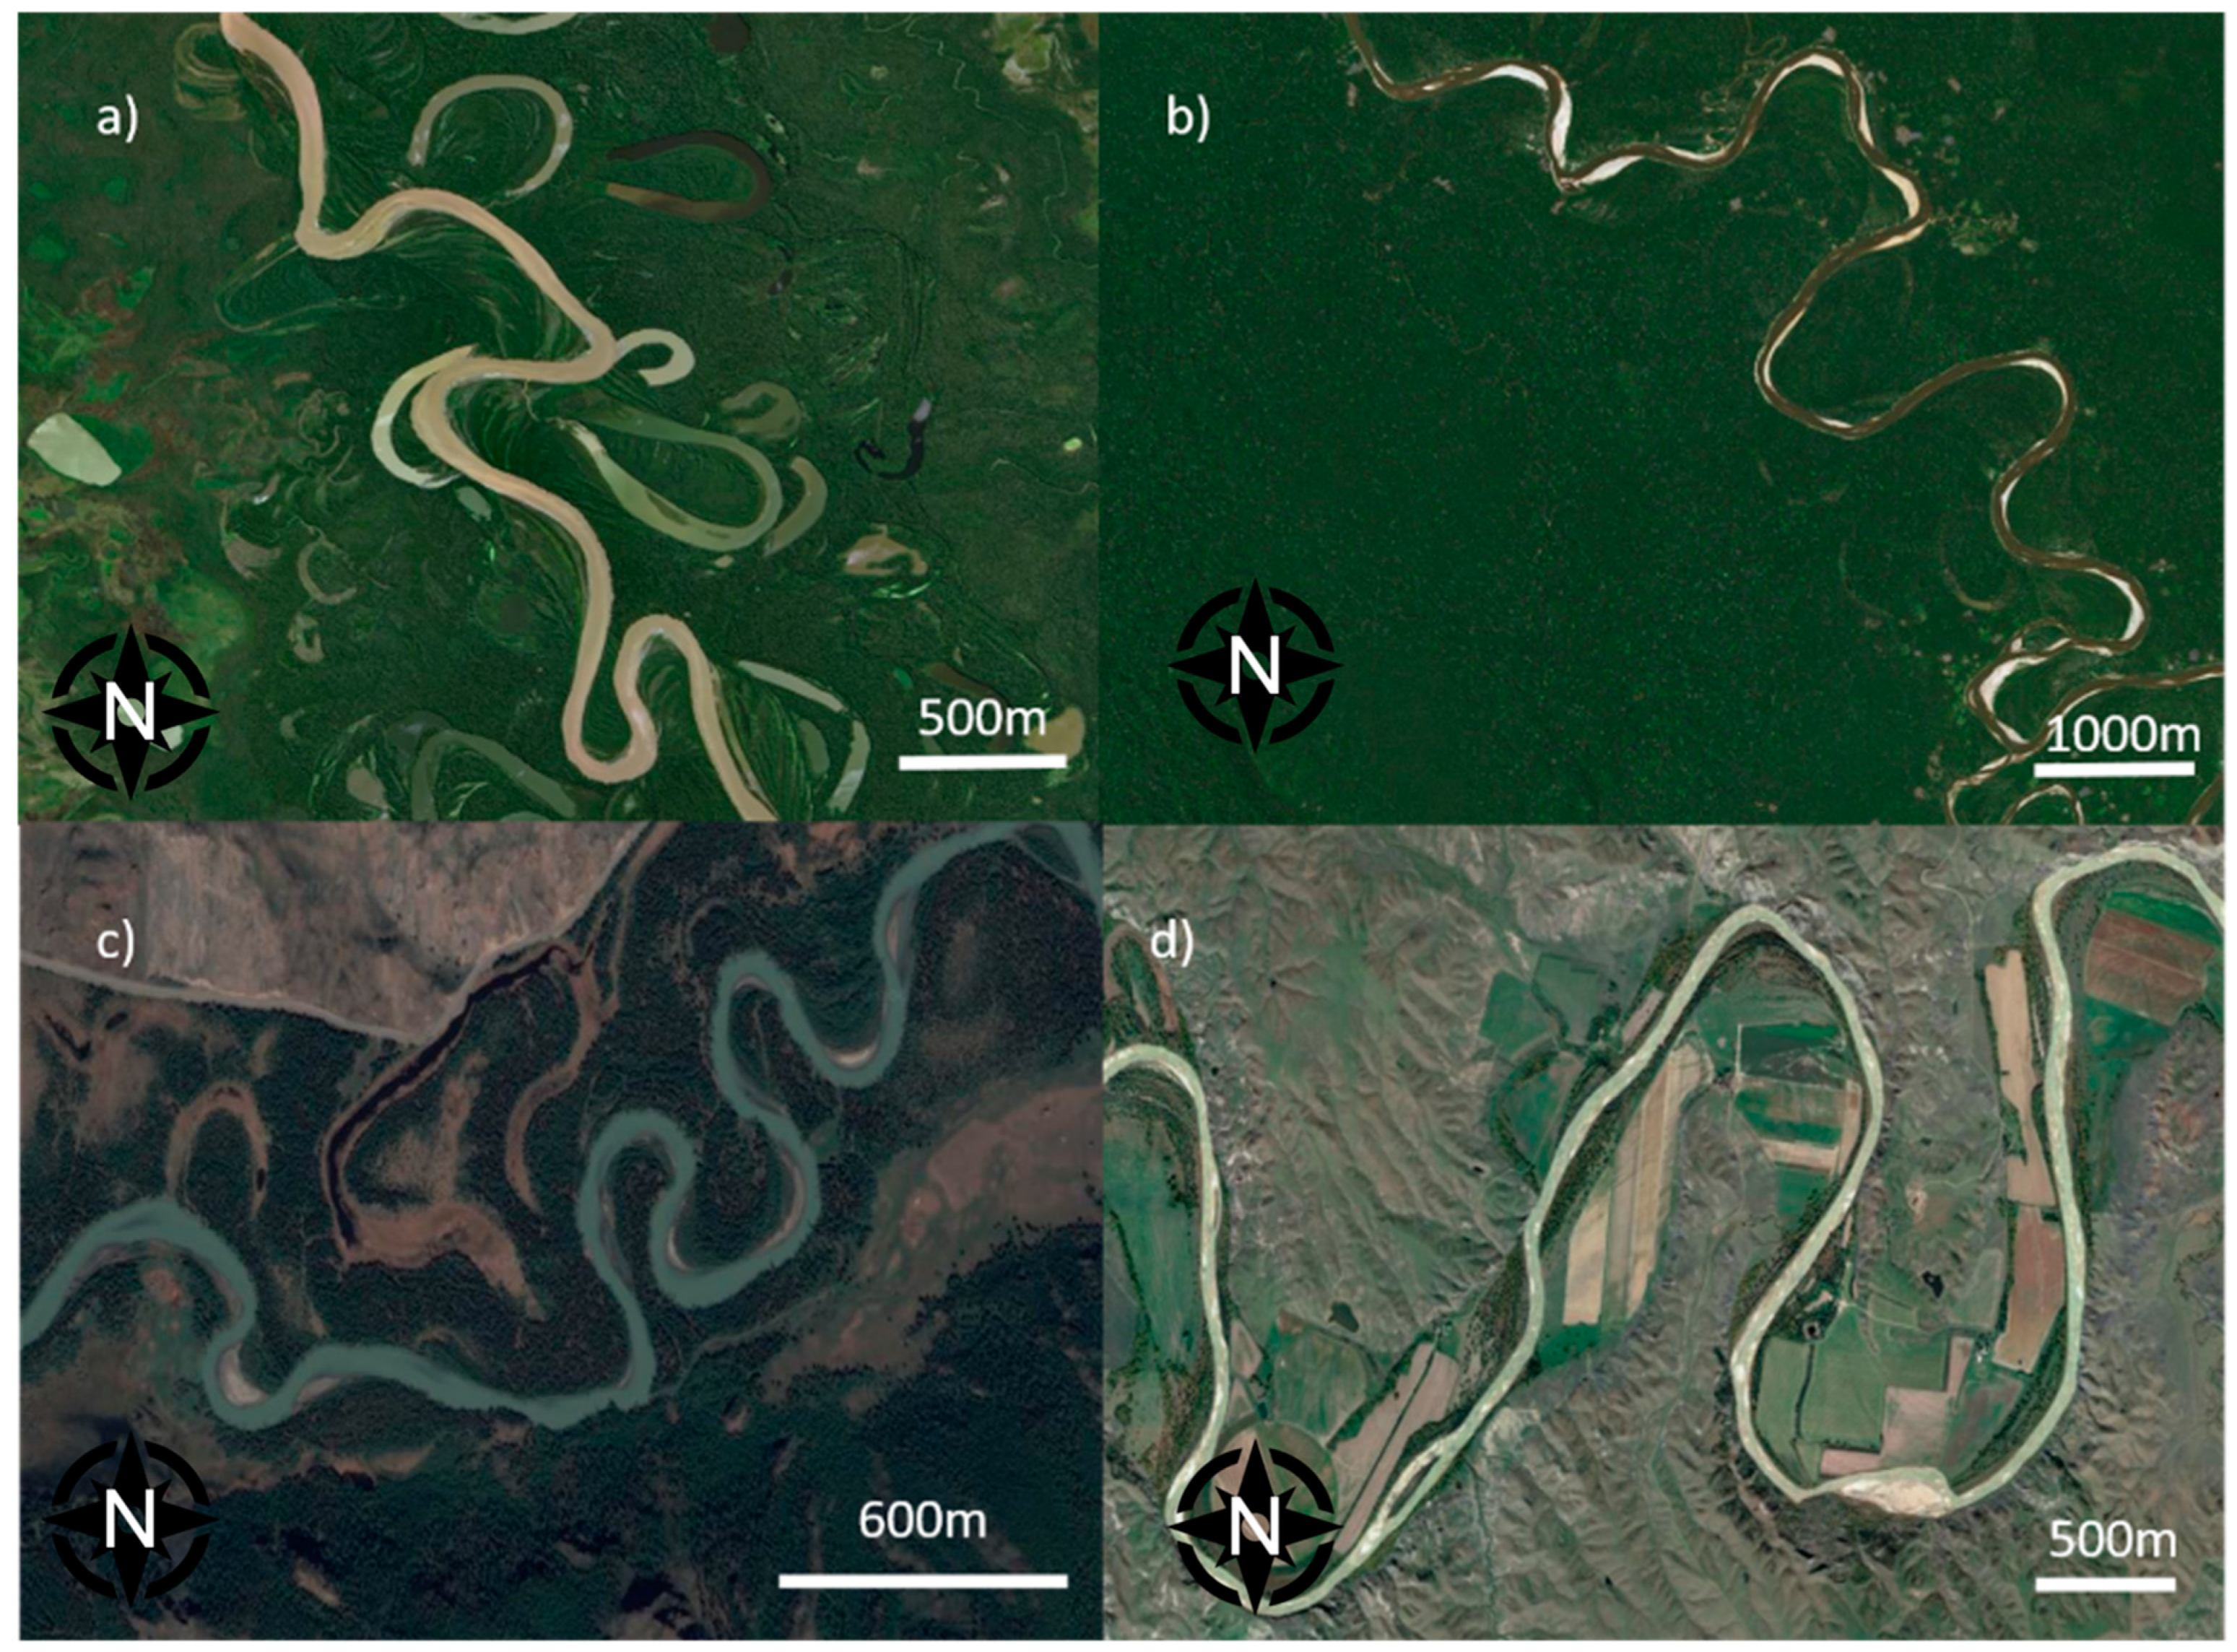
2. Material and Methods

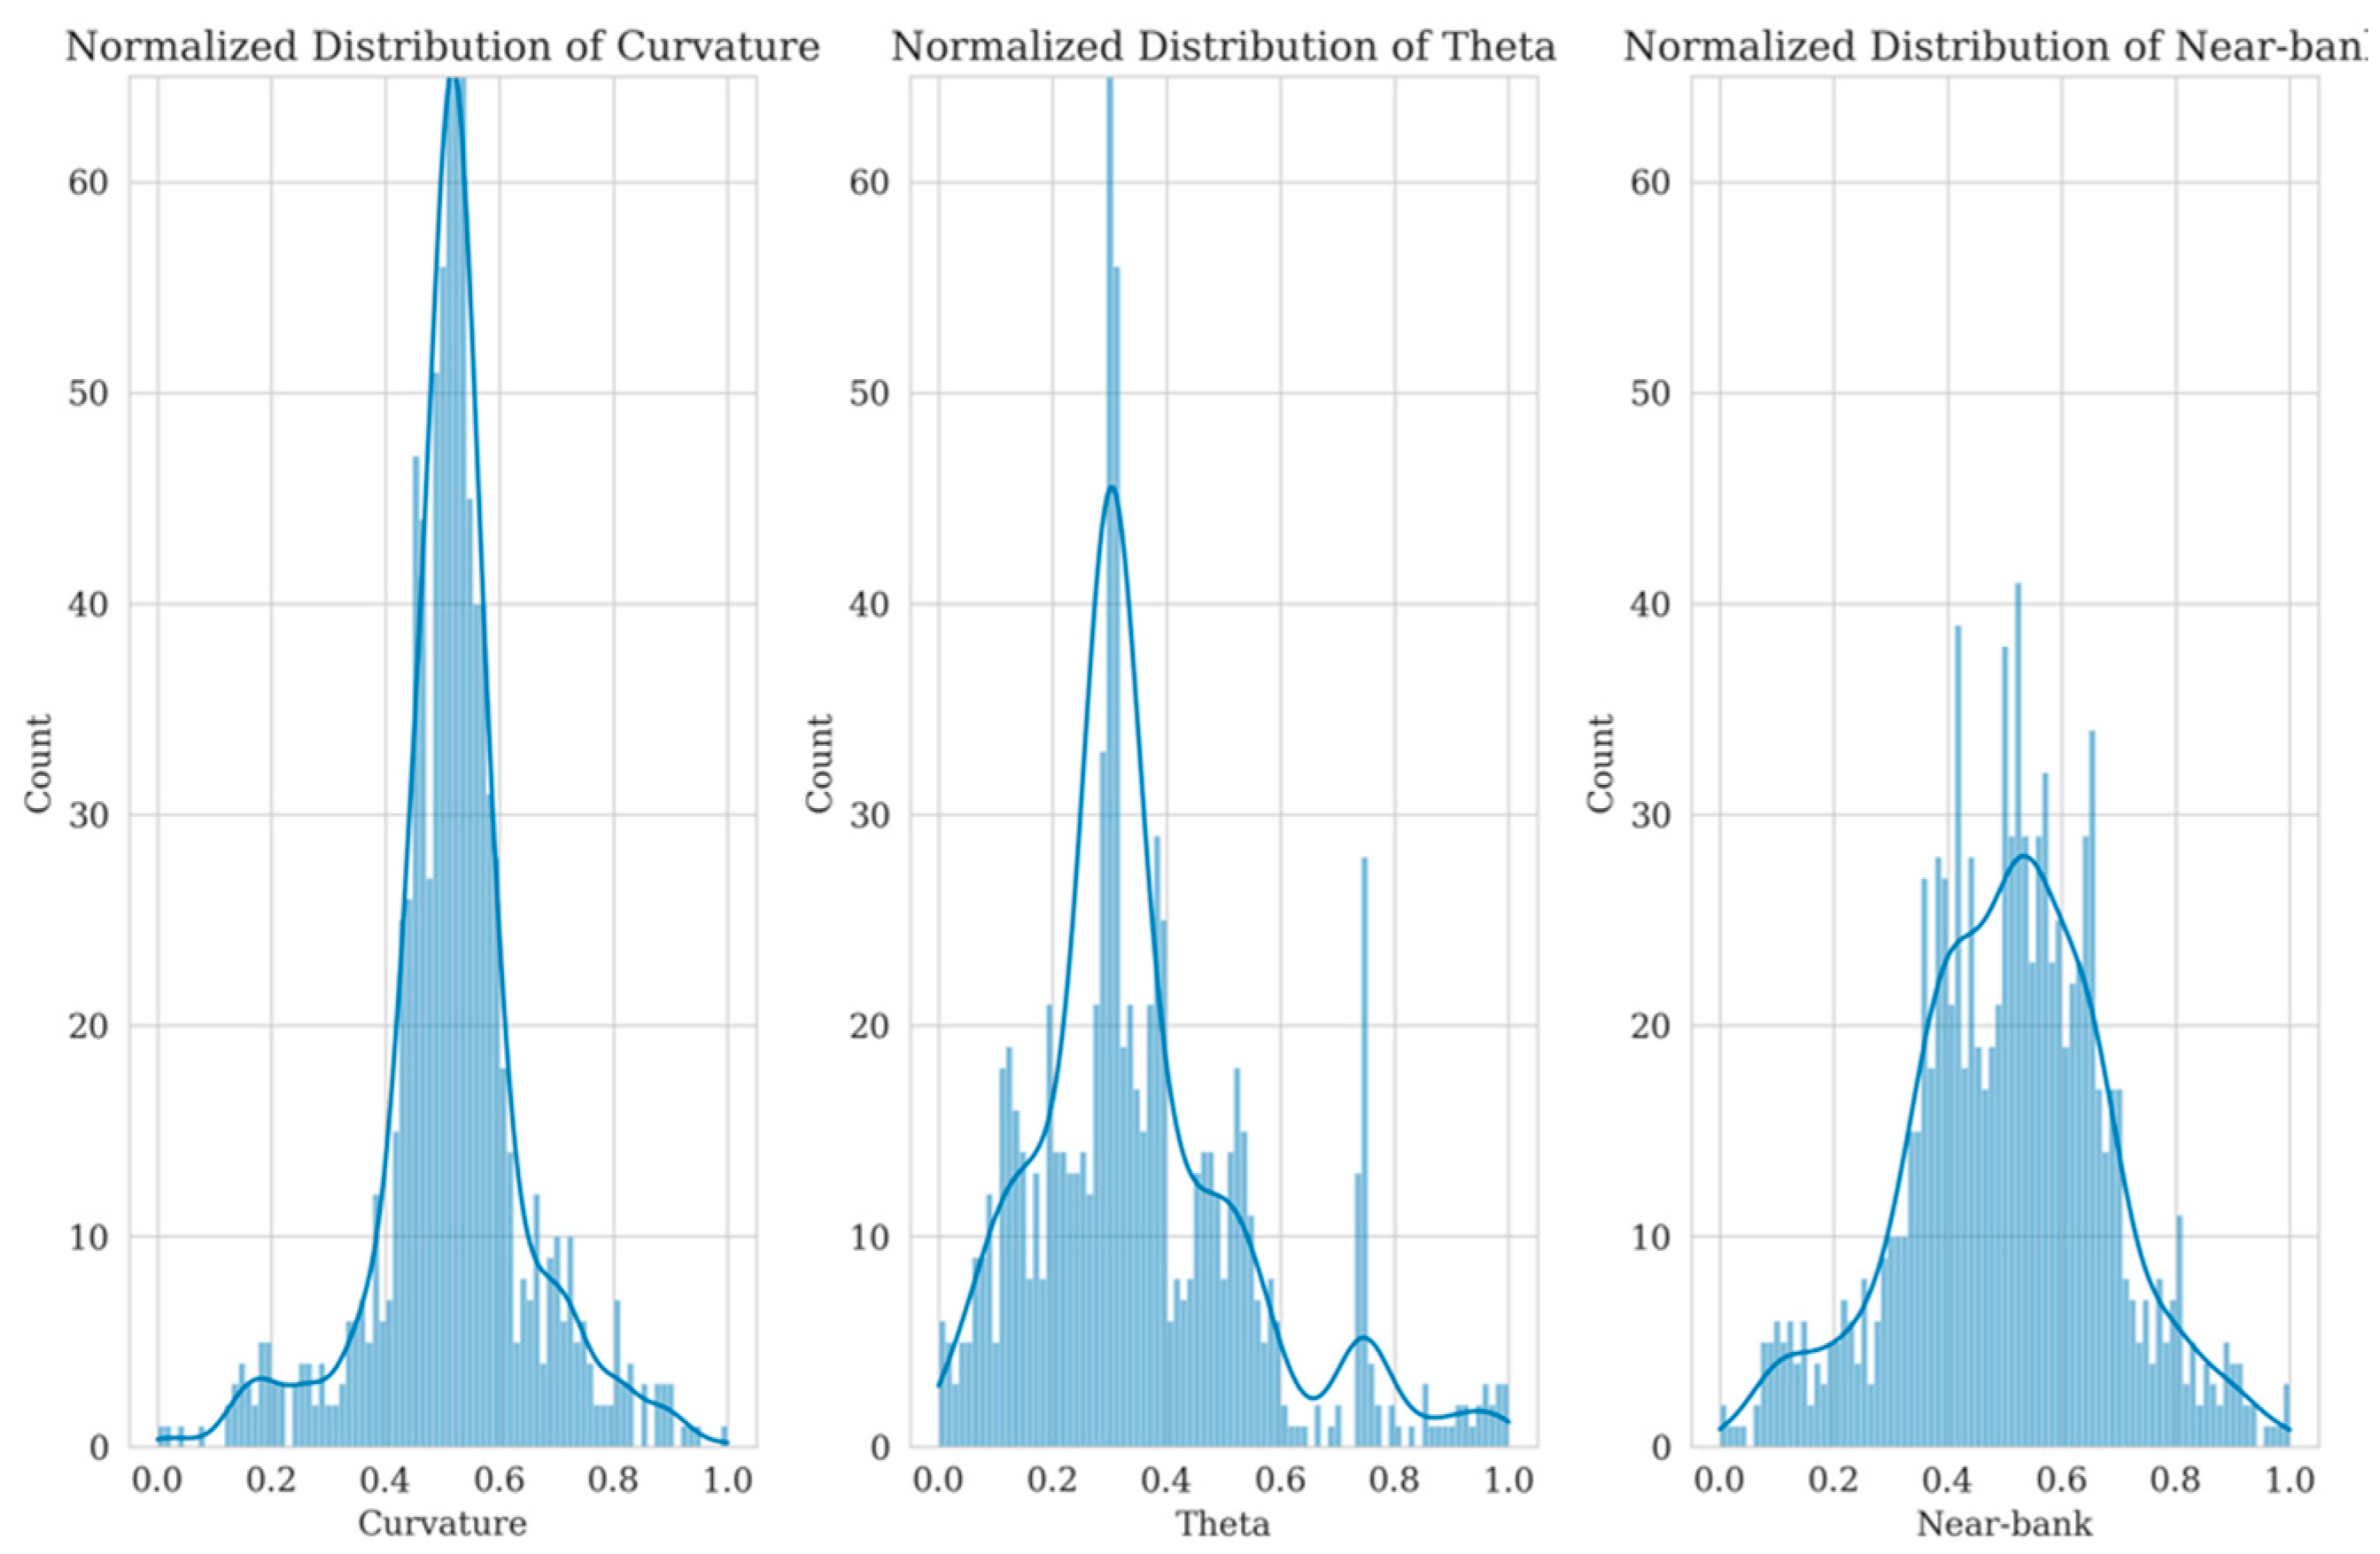
2.1. Planform Evolution Processing

The simulations were conducted using the semi-analytical MCMM model [15], which enables the complete range of morphodynamic regimes (sub- and super-resonant) typical of single-thread meandering rivers to be reproduced. We ran simulations taking into account a laterally unconfined homogeneous floodplain for each combination of the relevant input dimensionless parameters, enabling the meander belt to grow naturally. The input parameters are the dimensionless Shields stress (sediment mobility parameter) and the relative roughness (i.e., the ratio of the median grain size to the uniform flow depth), which were set to typical values of 0.1 and 0.01, respectively (e.g., [25]). The third dimensionless input parameter is the half-width to depth ratio, and it was adjusted within the range of 10–50 to encompass both the super-resonant and sub-resonant regimes.
River meandering patterns are the result of the mutual interaction between water flow, riverbed dynamics, sediment transport and of the interplay between the channel and the nearby floodplain, which can be summarized by the processes of floodplain removal by bank erosion and floodplain formation through bank accretion and further riparian vegetation establishment [26]. Meandering is one of the most complex and highly dynamic processes occurring in sedimentary riverine environments [2,5,27]. The characterization of meandering rivers has been a subject for researchers throughout the past decades in both river engineering and geomorphological investigations (e.g., [1,11]). It is now established that rivers’ hydrodynamics erode sediments in an outer, concave bank, a so-called cut bank, and deposit the eroded sediments on an inner, convex bank, thus creating a so-called point bar, due to the curvature of streamlines that develop in the flow field and that have been shown also theoretically to result from a “bend instability” process [16]. Moreover, the channel curvature forces a secondary helical flow circulation on a cross-sectional plane, which affects the energy that is transferred by the river flow [7]. Cornerstone studies [3,16] could analytically model a meandering river. They were able to establish relationships with the Fourier series to obtain the amount of displacement of the centerline and the speed of its movement. Firstly, the reference system from a Cartesian system of (x*, y*, z*) should change into an orthogonal system of (s*, n*, z*), and the dimensional quantities like the geometry of the channel should be dimensionless.
Researchers in the study [28] illustrated that the planimetric evolution at the generic location “S” along the river axis is expressed by the integro-differential equation, which is solved analytically if the planform is sine-generated, below:
ζ s = θ t θ s 0 s θ s d s
where the lateral migration rate is ζ and should be scaled with some typical speed U 0 (average uniform flow speed). Also, in dimensionless form of the relations, the migration rate equals to:
ζ = E U b
where E is a dimensionless erosion coefficient and U b = U b / U 0 is dimensionless excess near-bank velocity.
The prediction of the lateral meander migration rate in meandering rivers is examined in this work. The method makes use of a semi-analytical model that makes use of later planform data gleaned via simulations. A constant lateral migration coefficient acts as a mediator between the lateral migration rate and the excess near-bank velocity (with respect to the mean cross-sectional velocity) in the model (Figure 2b). The framework for computing the (x, y) coordinates of a generic point on the meander centerline at a future time step (k + 1) using the migration rate (z) and the prior coordinates at time step (k) is shown in Equations (1) and (2). Additionally, the angle between the centerline tangent and a set reference direction (such as the x-axis) is included, which is known as the local meander direction angle (θ). The model predicts the position of the planform in the following time steps by fusing data from the previous time step with the direction and rate of migration. The new centerline position, which is essential to determining the planform placement, is calculated numerically. This is accomplished by multiplying the projected values by the coefficient of lateral migration and then entering the results into Equations (3) and (4).
x i k + 1 = x i k t i k ζ i k + ζ i k 1 2 s i n θ i k
y i k + 1 = y i k t i k ζ i k + ζ i k 1 2 c o s θ i k
The models that have been used for this study are based on different components/pillars. The mathematical framework is based on the combination of existing theories developed by [3,16], i.e., The equations that describe the planform migration in time. As was previously mentioned and shown in the Figure 2, the model employs dimensionless forms of the equations to ensure scalability and applicability to various river systems. The numerical solution is used to discretize the centerline into a series of points, and the migration of these points is calculated using finite differences. In terms of handling cutoffs and floodplain features, this model simulates the natural processes such as neck cutoff, where bends in the river are approaching each other and forming an oxbow lake. Since it is highly important to differentiate between geomorphic units on the floodplain, this model is capable of handle differing oxbow lake scroll bars, each with their own erosion characteristics (for the mathematics behind this, readers are recommended to check [3,15,23].

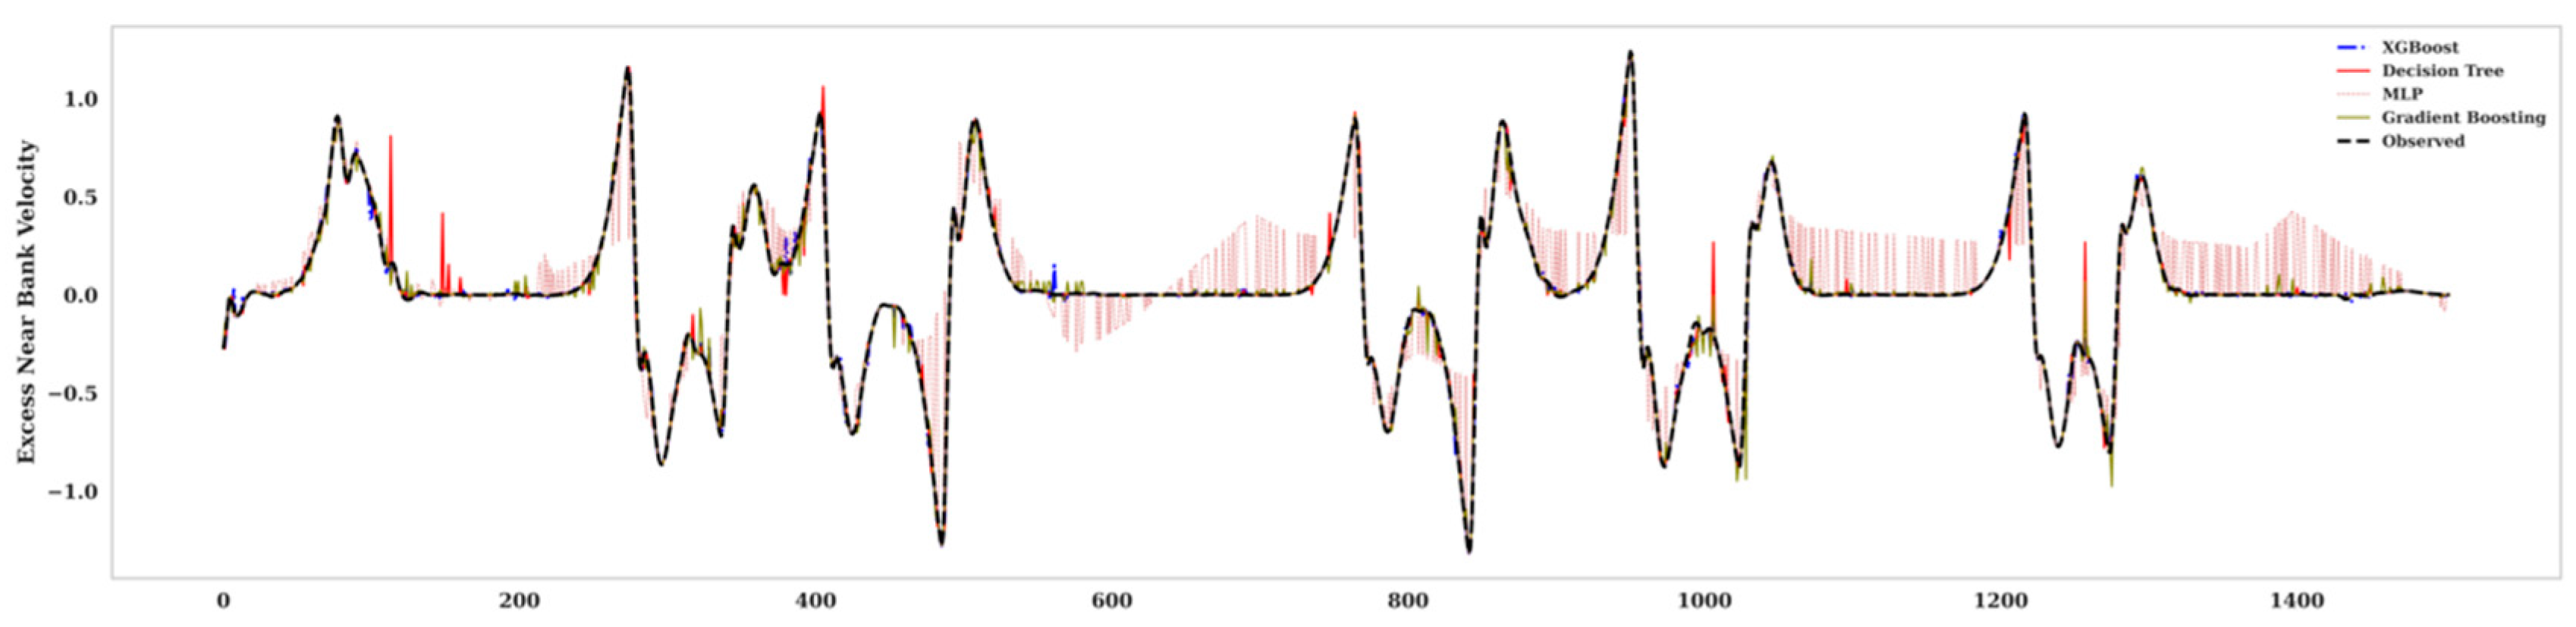
2.2. Artificial Intelligence (AI)

Substantial improvement has recently been made in the use of artificial intelligence (after this AI), machine learning (hereinafter ML), and, more recently, deep learning (hereinafter DL) for the modeling of natural phenomena [29,30]. Concisely speaking, to track the subjects from leaf to root, DL is a subset of ML and ML itself is considered a subclass of AI. Recently, the availability of a large number of multi-temporal datasets coupled with the development in algorithms and the exponential increase in computing power has led to a remarkable surge of interest in the topic of artificial intelligence, from ML [31] to deep learning [20,30,32]. Artificial neural networks (ANNs) are computer techniques that mimic how human brains function [24,33,34]. They do not need to be specifically programmed to adhere to regulations in order to accomplish their tasks [24]. In a nutshell, ANNs are made up of units that communicate information through synapses. These components, which resemble the nervous system, are referred to as “neurons”. In mathematical terms, a neuron functions as a parametrized, nonlinear system that takes in input data from the outside environment and produces an output, like the values of a target variable. An outline for the artificial neural network is shown in Figure 3. The image illustrates the different machine learning models, multi-layer perceptron, eXtreme Gradient Boosting, and decision tree model. The algorithms that have been shown in the Figure 3 illustrate the process for every ML method from loading the data to the model deployment. This study used a variety of ML techniques, including multi-layer perceptron (MLP), eXtreme Gradient Boosting (XGBoost), gradient boosting resgressor (GBR), and decision tree (DT) [20,30,35,36]. To enlighten how schematically input data comes to the model until, it is compared with output data. Figure 3 shows, for example, the decision tree, where every branch is an answer of yes or no and goes to another branch until reaching the result. The artificial neural network architectures that are most commonly used are multi-layer perceptrons (MLPs). Backpropagation techniques are used to iteratively traverse the network with data in order to minimize overfitting and attain maximum accuracy [37,38]. The most common paradigm for network education is supervised learning. Learning in the context of artificial intelligence involves minimizing the difference between the output values that are predicted and the actual values. Finding local minima in this optimization process entails experimenting with different hyperparameter setups, which in turn affects computing cost. eXtreme Gradient Boosting, or XGBoost, is a potent method for regression work. It is particularly good at creating decision tree ensembles in which each tree aims to fix the mistakes of the preceding ones (Figure 3b). By using a step-by-step method, you may create a strong model that can identify intricate correlations in your data [39]. The versatility of XGBoost and its speedy processing of big datasets are its main advantages. It also offers useful features like regularization to avoid overfitting and perceptive tools to determine which aspects have the biggest impact on your forecasts [40,41,42]. GBR, or gradient boosting regressor, uses an ensemble learning methodology that is sequential. Every iteration creates a weak learner, usually a shallow decision tree, by fitting to the loss function’s negative gradient in relation to the current ensemble’s predictions [43,44]. Compared to alternative boosting algorithms, this method has been empirically shown to provide competitive predictive performance with fewer base learners. Unfortunately, due to the sequential nature of tree construction, GBR has several limitations, such as its sensitivity to overfitting and the possibility of performance decrease as a result of this sequential process [43,45]. Decision tree (DT) is another ensemble learning algorithm. In decision tree frameworks, statistical performance indicators like accuracy are given priority during the model selection process [46,47]. All data-driven methods, meanwhile, might not necessarily produce the best model. Although decision trees have a high degree of statistical power, little study has been conducted to improve end-user interpretability. Decision trees frequently yield good statistical validation in environmental applications, but their intricacy makes implementation difficult. In a sense there is a trade-off, where a more interpretable, simpler model with 5 leaves may not be chosen over a statistically superior one with 29 leaves, with the accuracies of 0.958 and 0.959, respectively [48]. Moreover, in order to evaluate the prediction procedure and enlighten the machine learning model in the prediction phase, we have used interpretability model, in this case “SHAP value”. In essence, SHAP values indicate the contribution of each feature to a particular model prediction.
The input data, as has been mentioned earlier, is the output of a semi-analytical model that is designed for the planform evolution developed by [15]. This model is a further development of the analytical solution that was performed by [3]. This model produces planforms in different time steps and the first/initial time steps cannot be used as they have not reached the steady state condition. After employing an ADF test, it turns out that after time step 180 the condition is the steady state. The models are trained with one time step divided into train, test, and validate datasets. Then, the model is used to predict the near-bank velocity in the next time step. The input in this training is X, Y, the intrinsic coordinate system S, theta (angle), curvature, and Excess Near-Bank Velocity.
It is important to ensure that the input and output data are correlated when using machine learning (ML) and to eliminate redundant data from the dataset. Many strategies are used to accomplish this task; in this study, the correlation between the characteristics of the water quality role players—which demonstrates the impact of each input data on the output data—was taken into consideration. This has to do with the fact that various predictor combinations can make a big difference in how well the target is predicted. A “correlation matrix” is a typical way to describe the relative weight of each parameter in the prediction of other parameters of interest.
To guarantee the best performance, the model architecture must be optimized. This means figuring out which hyperparameters have a significant impact on the dataset’s pattern replication, recognition, and learning process [42]. There are several hyperparameter optimization methods available to do this. The most appropriate hyperparameter configuration was found in the current investigation by using Grid Search, and for every model this has been employed; the optimum architecture has been shown in Table 1. Within the architecture development in every ML model, one of the key role players is the activation function. The activation function ensures the knowledge transfer from the input until reaching the output. This knowledge transfer is conducted based on the number of iterations that is set. For example, in the multi-layer perceptron model, there are a couple of activation functions that are performing this knowledge transfer. In this study, for MLP, the optimum activation function based on the grid search was the hyperbolic tangent or “Tanh”. This function transforms the value of an element to the interval between −1 and 1.
f x = T a n h x = 2 1 + e 2 x 1
Also, the training method (optimizing algorithm) for this method, as can be seen, is “lbfgs”, which stands for “Limited memory Broyden Fletcher Goldfrab Shanno”, a quasi-Newton method that approximates the Hessian matrix using past gradient information. In the decision tree method, also the criterion that has been chosen is “friedman_mse”, which is used to measure the impurity of a node and guide the decision tree’s splitting process. It basically mixes two different concepts: (a) minimizing or lessening the MSE, and (b) focusing on the enhancement. This goes beyond simply calculating the MSE, while in every step it tries to reduce the MSE that is achieved in previous steps. This process of training, testing and comparing with the actual data is shown schematically in the Figure 4 as the flowchart or the pipeline.
In order to project the localized migration rate at a given spatiotemporal coordinate ‘s’ along the centerline of a meandering channel, this study used a two-stage methodology. Two artificial, theoretically derived channel centerlines that have been produced using a semi-analytical model were used to train the machine learning models.
A meander dynamics simulator was used to create a large ensemble of simulated centerlines from which the training channel centerlines were chosen. The following non-dimensional control parameters were used in the simulations: r (r) = 0.5, β (aspect ratio) = 10, θ (shields parameter) = 0.1, and ds (relative roughness) = 0.01. In addition, the two channel shapes were selected based on steady state condition, in the sense that the selected planforms are after reaching steady state condition.
Three metrics of Mean Absolute Error (MAE), Root-Mean Square Error (RMSE), and F1 Score (Score) were employed in this study to assess and compare several machine learning models. The formulae for these measures are provided below:
R M S E = 1 n i = 1 n ( H o H p ) i 2
M A E = 1 n i = 1 n ( H o H p ) i
F 1   S c o r e = 2 × P r e c i s i o n × R e c a l l P r e c i s i o n × R e c a l l
where H o is the observed data, H p is the data predicted (or simulated data) by the ML, and n is the total number of observed data (or actual data). As a gauge of a test’s accuracy in machine learning, the F1 Score is the harmonic mean of the precision and recall. The precision is calculated by dividing the number of true positive results by the total number of positive results, including those that were incorrectly identified. The recall is calculated by dividing the number of true positive results by the total number of samples that should have been classified as positive. The more accurate the model, the closer it is to zero for the RMSE and MAE measures and to one for the Score measure.
For every pair of centerlines used in the training process, a 70/30 data split was used; each centerline normally comprised about 1000 data points. Because of this random selection, the 70% training data included points with a variety of attributes that were dispersed along the whole centerline. The second analytical phase involved reserving 30% of the data points from these identical centerlines for model testing. In order to evaluate the model’s competency, the migration rate for a future time step was predicted using just planform data from the previous time step. The model’s generalizability was then verified using an external validation phase. This entailed giving the model a totally new planform that it had never seen before during training and giving it the responsibility of forecasting the migration rate based on historical time step data.

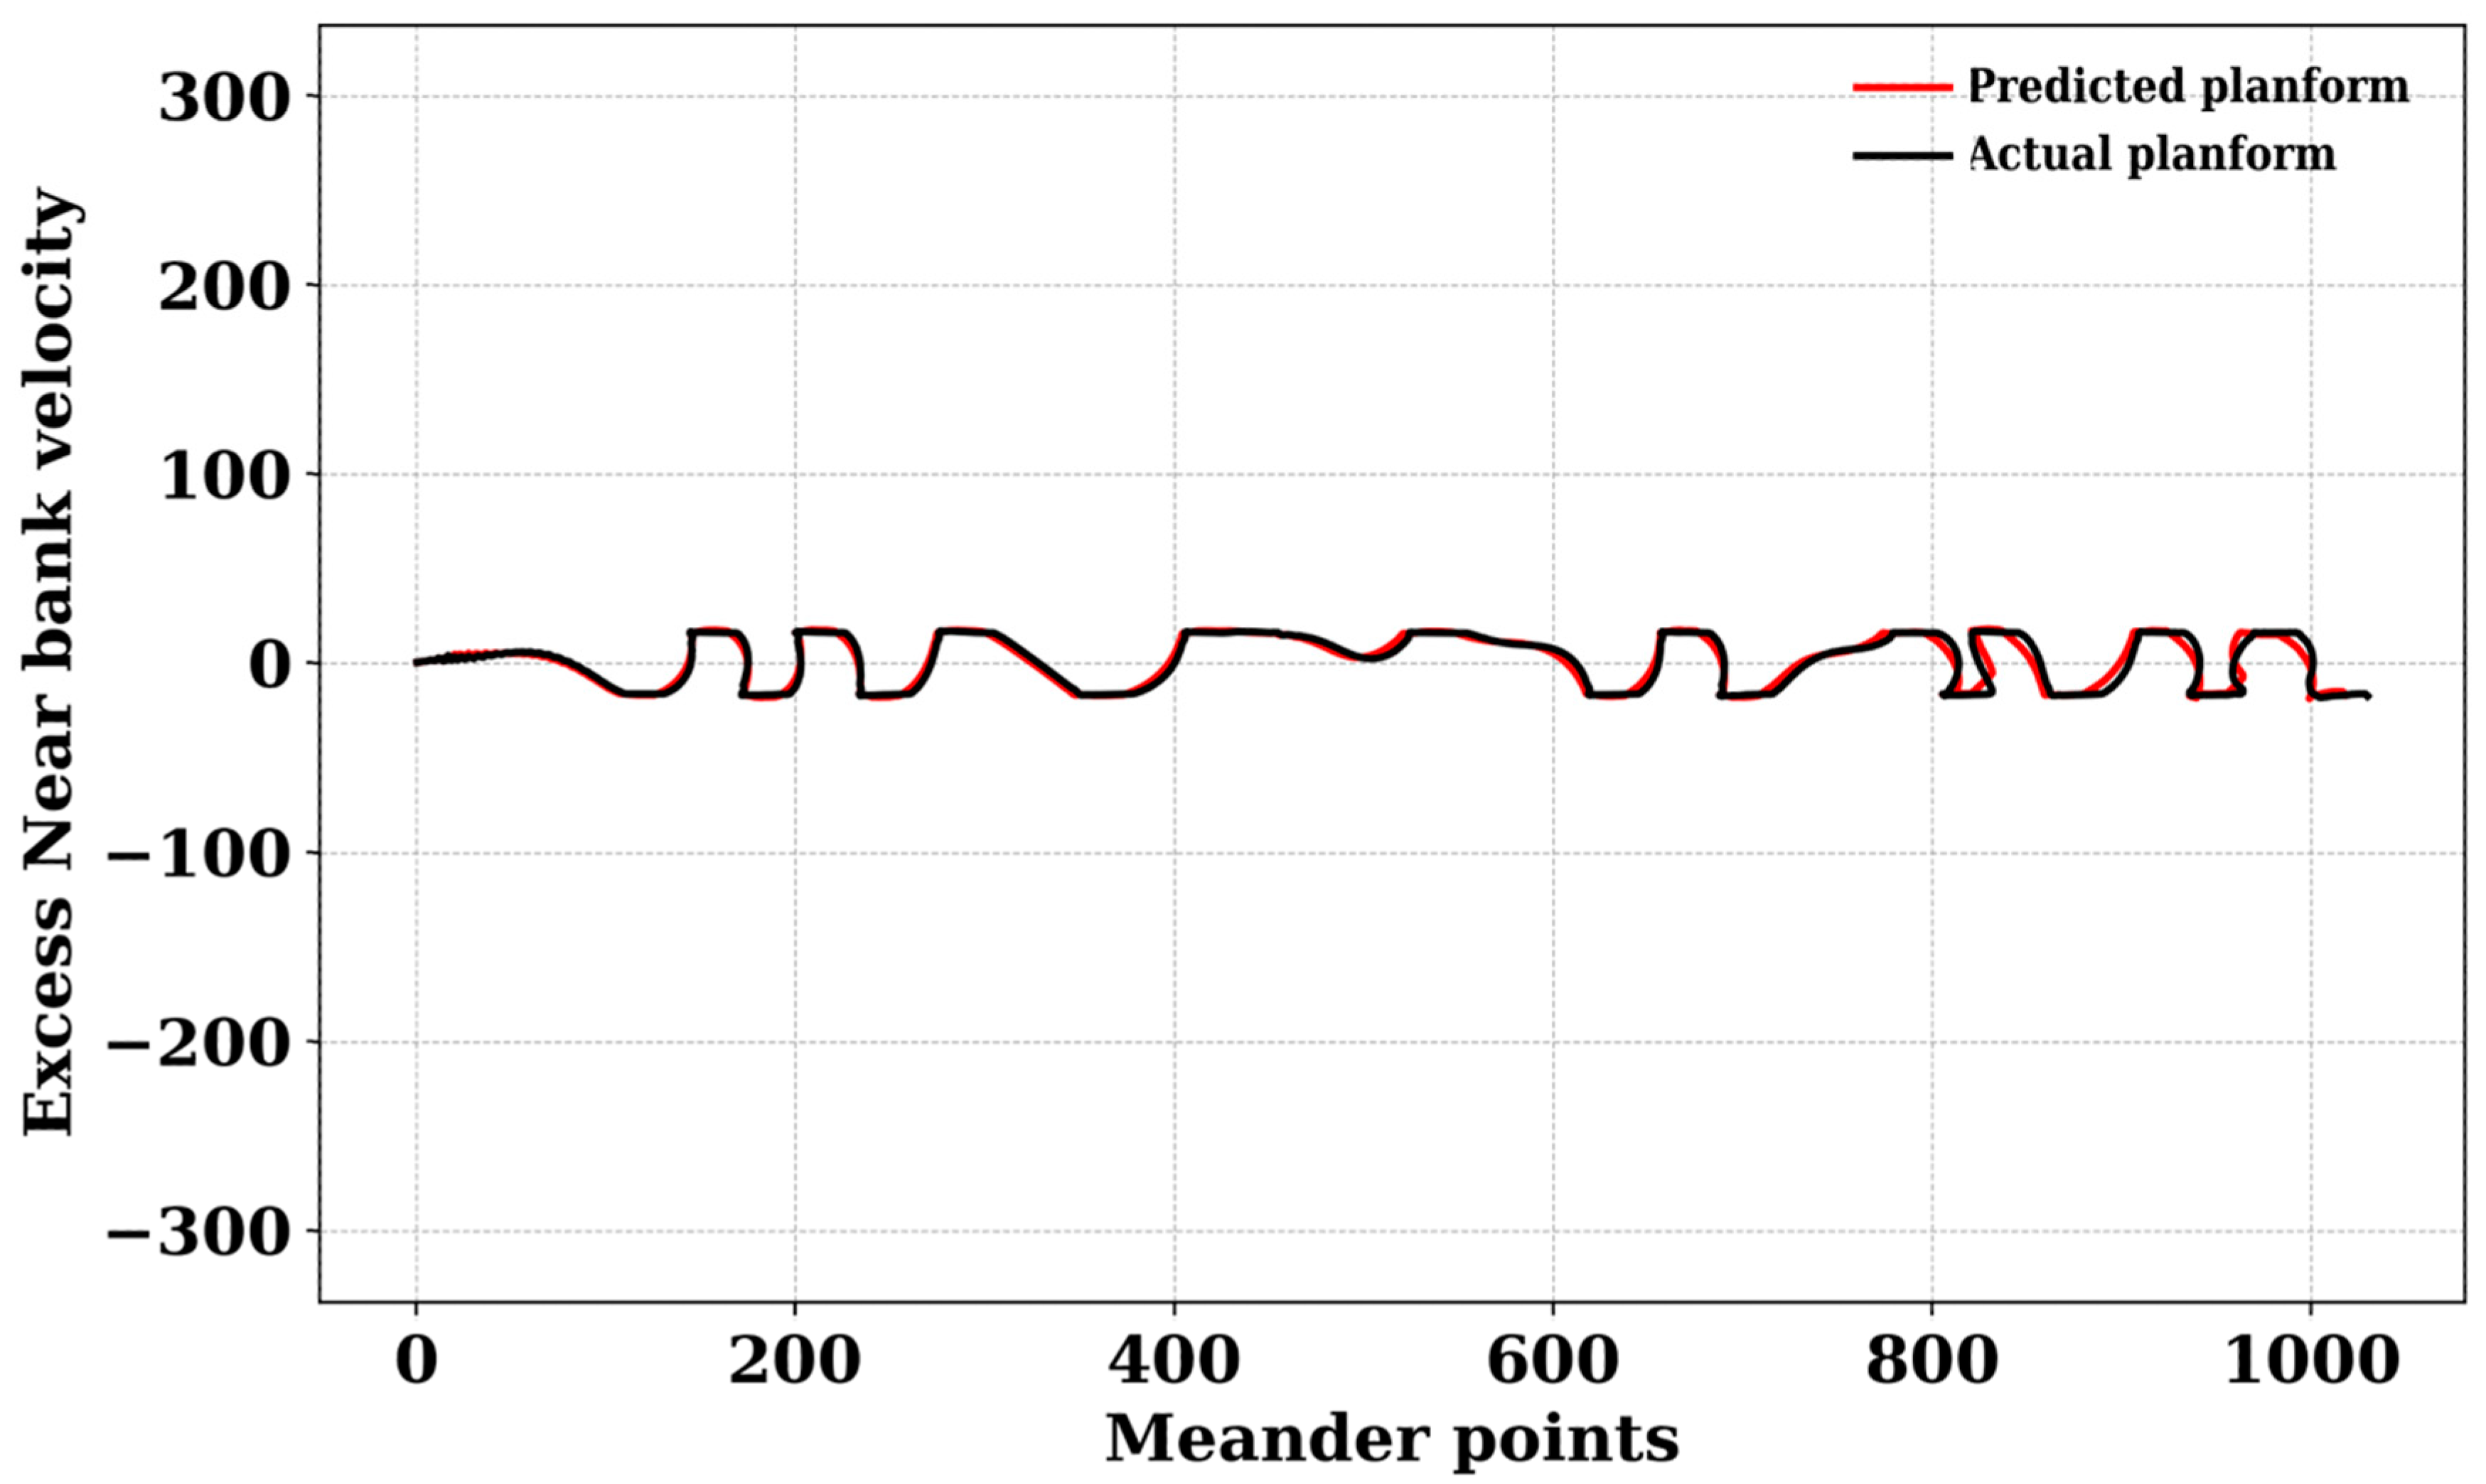
3. Results and Discussion

As has been mentioned earlier, the dataset was divided into different parts, including the train dataset with the portion of 70 percent and 30 percent for validation and testing. Also, after ensuring the model’s results using the split dataset, the external validation was used. The first set of results is related to the divided dataset. The distributions of the three important factors in meander planform evolution have been shown in the Figure 5. All three distributions appear to be unimodal, meaning they have a single peak. The curvature distribution has its peak at around 0.5, while the theta and near-bank distributions have their peaks closer to 0.
The correlation of all investigated components with respect to the target, which is “Near Bank velocity”, as assessed according to the Pearson correlation coefficient method; the results are presented in Figure 6. It shows the Pearson correlation coefficient between six variables: near bank, curvature, X, theta, Y, and S. The color intensity in the heatmap indicates the strength and direction of the correlation. The curvature shows a negative correlation, which means that higher theta values are associated with lower chances of being “Near-bank velocity”.
We train the models using the simulated meander data and assess the models’ performances using several metrics. Table 2 shows the results of the models’ performances. After the regression models were evaluated, it was found that eXtreme Gradient Boosting (XGBoost) produced the best results in terms of performance measures. The clearly lower Mean Absolute Error (MAE), Mean Squared Error (MSE), and Root Mean Squared Error (RMSE) in comparison to the other models serve as proof of this. When taken as a whole, these measures show that the target variable may be predicted with more accuracy in terms of the squared and absolute errors. As a result, XGBoost is the model that is best able to forecast the target values with accuracy. In contrast, out of all the metrics examined, the multi-layer perceptron (MLP) regressor performed the worst. This indicates that it is not a good fit for the current regression task. However, the decision tree regressor showed impressive performance, even if its R-squared (R2) value lagged somewhat behind that of XGBoost. The low MAE, MSE, and RMSE scores and the high R2 value point to a good balance between the model’s ability to fit the data successfully and its correctness.
By replacing the values predicted by the models with the actual one and comparing the outcome with the actual values, analysis of the near-bank velocity trend revealed spatiotemporal fluctuations across various planform points. Figure 7 specifically depicts the predictions of the target variable (velocity) using different machine learning algorithms. This velocity, or migration rate, will be subsequently employed within a numerical scheme to forecast the platform’s position. Visual inspection of Figure 7 suggests a demonstrably superior performance for the eXtreme Gradient Boosting (XGBoost) model compared to the other employed machine learning algorithms.
Figure 8 illustrates the residuals and validation curve for the XGBoost model. The terminology of residuals refers to the difference between the actual target values and the predicted values from the model. The residuals should ideally be dispersed randomly about the horizontal line at zero, indicating that the model’s predictions are free from systematic bias. Some dispersal is to be expected in the absence of a perfect model, but the closer the cluster is to the zero line, the better. Also, the validation curve, demonstrates how a hyperparameter affects the model’s performance (as determined by a scoring metric) on a validation set. You may determine the ideal hyperparameter value for the model with the use of the validation curve. The XGBoost model’s maximum depth for each tree is controlled by the x-axis labeled “max_depth” in the graphic you submitted. Figure 8a,b confirms that how accurate the model is in terms of prediction.
This study explores the intrinsic opacity of prediction models for machine learning (ML), with a focus on platform migration. The conventional methods primarily concentrate on loading data and using models to achieve target prediction; however, they frequently overlook the critical step of determining the feature importance inside the underlying machine learning algorithms. This has the consequence of leaving the reasoning behind the forecasts mysterious, resulting in a “black box” situation. This research goes beyond just making predictions. We hope to shed light on the inner workings of the ML model and clarify the relative contributions of different data qualities (features) to the target prediction by utilizing feature importance analysis. This comprehensive approach not only facilitates successful platform migration but also fosters a deeper understanding of the factors driving the predictive outcomes. The distribution of the SHAP values for curvature and theta, two characteristics employed in an XGBoost machine learning model, are shown in the Figure 9. The number of occurrences (data points) that fall within a given range of SHAP values is shown by the vertical axis, while the horizontal axis represents the SHAP value. The SHAP values for curvature from −0.6 (negative impact) to 0.2 (positive impact). A value of 0 denotes that the feature has no bearing on the forecast. The positive SHAP values on the right side of the distribution imply that the model’s prediction tends to rise with larger curvature values. On the other hand, the left side, which displays negative SHAP values, indicates that the prediction tends to decline with decreasing curvature values. Theta’s SHAP values vary greatly; they might be as low as −0.4 (negative impact) or as high as 15 (positive impact). The positive SHAP values on the righthand side show that, like curvature, greater theta values typically result in higher model predictions. It is interesting to note that the distribution appears to plateau on the right, which could indicate a limit on how much theta can favorably affect the forecast. The left side’s negative SHAP values suggest that while high theta values have a favorable influence on the prediction, lower theta levels might also have a little detrimental effect.
In a strictly geometric framework, this paper investigates the possibilities of using the migration rates predicted by machine learning (ML). Through the integration of these forecasts into Equations (1) and (2), we develop a procedure to convert the output of the model into an accurate channel centerline. The really encouraging outcomes show that this strategy is effective. The calculated centerlines, as shown in Figure 10, show a high level of agreement with the real platform configurations, indicating the applicability of this method.
A visual comparison of the system’s actual centerline and the expected centerline based on the migration rate calculation is shown in Figure 10. There is a great deal of agreement between the two in terms of the general direction of migration. Moreover, the estimated centerline shows the minimum variations in certain localized places and a strong correlation with the observed position. These variations could be explained by localized bank material variability, unanticipated flow disruptions, or the model’s inability to accurately depict extremely complex meander bends. The calculation of the Root Mean Squared Error (RMSE) was performed to measure the model’s performance. The resultant value, which is less than 0.1, indicates that the model’s meander migration predictions are highly accurate. This translates to an accuracy of about 0.9, meaning that the centerline positions that were predicted and those that were observed closely match. As demonstrated by the effective conversion of forecasts into numerical representations of the actual planform using accepted numerical formulas, this high accuracy is especially encouraging for constrained meanders. The model’s ability to accurately forecast the centerline migration for limited meanders provides a solid framework for future improvements. On the other hand, we can expand its scope to include free-meandering rivers as well, in order to obtain a fully comprehensive picture of river behavior. Due to their less restricted character, these dynamic systems offer a valuable challenge that will enable the model to reach its maximum potential.

4. Conclusions

This work investigated the traditionally difficult task of anticipating planform evolution in meandering rivers using machine earning (ML) techniques. The adopted strategy effectively used machine learning’s predictive power as a useful tool to measure meander migration rates. Although more analytical, empirical, and environmental research is still necessary to identify unanticipated environmental consequences, the computationally demanding and time-consuming nature of these studies emphasizes the promise of AI-driven methods, such as planform prediction, for accurate and insightful river dynamics prediction. As a result, this technology has the potential to assist successful river management plans. Our results offer initial support for the notion that ML integration can be highly advantageous for the field of meandering river research, which has not historically applied state-of-the-art techniques. This opens the door for more advancements in the industry by taking this useful tool into account.

Author Contributions

Conceptualization, H.A.; Methodology, H.A.; Validation, H.A.; Formal analysis, H.A.; Writing—original draft, H.A.; Writing—review & editing, R.S.; Visualization, H.A.; Supervision, F.M., G.Z. and M.T. All authors have read and agreed to the published version of the manuscript.

Funding

This research received no external funding.

Data Availability Statement

The datasets generated during and/or analyzed during the current study are available from the corresponding author on reasonable request.

Acknowledgments

The authors appreciate the anonymous reviewers’ comments.

Conflicts of Interest

The authors declare that they have no known competing financial interests or personal relationships that could have appeared to influence the work reported in this paper.

References

  1. Leopold, L.B.; Langbein, W.B. River Meanders. Sci. Am. 1966, 214, 60–70. [Google Scholar] [CrossRef]
  2. Seminara, G. Meanders. J. Fluid Mech. 2006, 554, 271–297. [Google Scholar] [CrossRef]
  3. Zolezzi, G.; Seminara, G. Downstream and upstream influence in river meandering. Part 1. General theory and application to overdeepening. J. Fluid Mech. 2001, 438, 183–211. [Google Scholar] [CrossRef]
  4. Motta, D.; Abad, J.D.; Langendoen, E.J.; García, M.H. The effects of floodplain soil heterogeneity on meander planform shape. Water Resour. Res. 2012, 48, 1–17. [Google Scholar] [CrossRef]
  5. Lanzoni, S.; Seminara, G. On the nature of meander instability. J. Geophys. Res. 2006, 111, F04006. [Google Scholar] [CrossRef]
  6. Schwendel, A.C.; Nicholas, A.P.; Aalto, R.E.; Sambrook Smith, G.H.; Buckley, S. Interaction between meander dynamics and floodplain heterogeneity in a large tropical sand-bed river: The Rio Beni, Bolivian Amazon. Earth Surf. Process. Landf. 2015, 40, 2026–2040. [Google Scholar] [CrossRef]
  7. Rozowski, I.L. Flow of Water in Bends of Open Channels; Academy of Sciences of the Ukrainian SSR: Kyiv, Ukraine, 1957. [Google Scholar]
  8. Thorne, C.R.; Hey, R.D. Direct measurements of secondary currents at a river inflexion point. Nature 1979, 280, 226–228. [Google Scholar] [CrossRef]
  9. Bolla Pittaluga, M.; Nobile, G.; Seminara, G. A nonlinear model for river meandering. Water Resour. Res. 2009, 45. [Google Scholar] [CrossRef]
  10. Duan, J.G.; Julien, P.Y. Numerical simulation of the inception of channel meandering. Earth Surf. Process. Landf. 2005, 30, 1093–1110. [Google Scholar] [CrossRef]
  11. Leopold, L.B.; Wolman, M.G. River Channel Patterns, Braided, Meandering and Straight; Schumm, S.A., Ed.; US Geological Survey: Reston, VA, USA, 1957; Volume 282-B.
  12. Sun, T.; Meakin, P.; Jøssang, T.; Schwarz, K. A simulation model for meandering rivers. Water Resour. Res. 1996, 32, 2937–2954. [Google Scholar] [CrossRef]
  13. Zolezzi, G.; Luchi, R.; Tubino, M. Morphodynamic regime of gravel bed, single-thread meandering rivers. J. Geophys. Res. 2009, 114, 1. [Google Scholar] [CrossRef]
  14. Johannesson, H.; Parker, G. Theory of River Meanders; University of Minnesota: Minneapolis, MN, USA, 1988; Available online: http://purl.umn.edu/114112 (accessed on 18 July 2024).
  15. Bogoni, M.; Putti, M.; Lanzoni, S. Modeling meander morphodynamics over self-formed heterogeneous floodplains. Water Resour. Res. 2017, 53, 5137–5157. [Google Scholar] [CrossRef]
  16. Ikeda, S.; Parker, G.; Sawai, K. Bend theory of river meanders. Part 1. Linear development. J. Fluid Mech. 1981, 112, 363–377. [Google Scholar] [CrossRef]
  17. Parker, G. On the cause and characteristic scales of meandering and braiding in rivers. J. Fluid Mech. 1976, 76, 457. [Google Scholar] [CrossRef]
  18. Bouaziz, M.; Medhioub, E.; Csaplovisc, E. A machine learning model for drought tracking and forecasting using remote precipitation data and a standardized precipitation index from arid regions. J. Arid Environ. 2021, 189, 104478. [Google Scholar] [CrossRef]
  19. Grbčić, L.; Družeta, S.; Mauša, G.; Lipić, T.; Lušić, D.V.; Alvir, M.; Lučin, I.; Sikirica, A.; Davidović, D.; Travaš, V.; et al. Coastal water quality prediction based on machine learning with feature interpretation and spatio-temporal analysis. Environ. Model. Softw. 2022, 155, 105458. [Google Scholar] [CrossRef]
  20. Tahmasebi, P.; Kamrava, S.; Bai, T.; Sahimi, M. Machine learning in geo- and environmental sciences: From small to large scale. Adv. Water Resour. 2020, 142, 103619. [Google Scholar] [CrossRef]
  21. Wang, Y.; Chen, J.; Cai, H.; Yu, Q.; Zhou, Z. Predicting water turbidity in a macro-tidal coastal bay using machine learning approaches. Estuar. Coast. Shelf Sci. 2021, 252, 107276. [Google Scholar] [CrossRef]
  22. Camporeale, C.; Perona, P.; Porporato, A.; Ridolfi, L. Hierarchy of models for meandering rivers and related morphodynamic processes. Rev. Geophys. 2007, 45. [Google Scholar] [CrossRef]
  23. Frascati, A.; Lanzoni, S. Morphodynamic regime and long-term evolution of meandering rivers. J. Geophys. Res. 2009, 114, 1–9. [Google Scholar] [CrossRef]
  24. Parsaie, A.; Haghiabi, A.H.; Moradinejad, A. Prediction of Scour Depth below River Pipeline using Support Vector Machine. KSCE J. Civ. Eng. 2019, 23, 2503–2513. [Google Scholar] [CrossRef]
  25. Seminara, G.; Tubino, M. Free–forced interactions in developing meanders and suppression of free bars. J. Fluid Mech. 1990, 214, 131–159. [Google Scholar]
  26. Van de Lageweg, W.I.; Van Dijk, W.M.; Hoendervoogt, R.; Kleinhans, M.G. Effects of riparian vegetation on experimental channel dynamics. Riverflow 2010, 2, 1331–1338. [Google Scholar]
  27. Monegaglia, F.; Zolezzi, G.; Gunerlap, I.; Henshaw, A.J.; Tubino, M. Automated extraction of meandering river morphodynamics from multitemporal remotely sensed data. Environ. Model. Softw. 2018, 105, 171–186. [Google Scholar] [CrossRef]
  28. Seminara, G.; Zolezzi, G.; Tubino, M.; Zardi, D. Downstream and upstream influence in river meandering. Part 2. Planimetric development. J. Fluid Mech. 2001, 438, 213–230. [Google Scholar] [CrossRef]
  29. Mohammed, H.; Longva, A.; Seidu, R. Predictive analysis of microbial water quality using machine-learning algorithms. Environ. Res. Eng. Manag. 2018, 74, 7–20. [Google Scholar] [CrossRef]
  30. Zhong, S.; Zhang, K.; Bagheri, M.; Burken, J.G.; Gu, A.; Li, B.; Ma, X.; Marrone, B.L.; Ren, Z.J.; Schrier, J.; et al. Machine Learning: New Ideas and Tools in Environmental Science and Engineering. Environ. Sci. Technol. 2021, 55, 12741–12754. [Google Scholar] [CrossRef]
  31. Schmidt, L.; Heße, F.; Attinger, S.; Kumar, R. Challenges in Applying Machine Learning Models for Hydrological Inference: A Case Study for Flooding Events Across Germany. Water Resour. Res. 2020, 56, e2019WR025924. [Google Scholar] [CrossRef]
  32. Lamba, A.; Cassey, P.; Segaran, R.R.; Koh, P.L. Deep learning for environmental conservation. Curr. Biol. 2019, 29, 977–982. [Google Scholar] [CrossRef]
  33. Goodwin, M.; Halvorsen, K.T.; Jiao, L.; Knausgård, K.M.; Martin, A.H.; Moyano, M.; Oomen, R.A.; Rasmussen, J.H.; Sørdalen, T.K.; Thorbjørnsen, S.H. Unlocking the potential of deep learning for marine ecology: Overview, applications, and outlook. ICES J. Mar. Sci. 2022, 79, 319–336. [Google Scholar] [CrossRef]
  34. Mitchell, T.M. Machine Learning and Data Mining. Commun. ACM 1999, 42, 30–36. [Google Scholar] [CrossRef]
  35. Malde, K.; Handegard, N.O.; Eikvil, L.; Salberg, A.B. Machine intelligence and the data-driven future of marine science. ICES J. Mar. Sci. 2020, 77, 1274–1285. [Google Scholar] [CrossRef]
  36. Rubbens, P.; Brodie, S.; Cordier, T.; Destro Barcellos, D.; Devos, P.; Fernandes-Salvador, J.A.; Fincham, J.I.; Gomes, A.; Handegard, N.O.; Howell, K.; et al. Machine learning in marine ecology: An overview of techniques and applications. ICES J. Mar. Sci. 2023, 80, 1829–1853. [Google Scholar] [CrossRef]
  37. Casanovas-Massana, A.; Gómez-Doñate, M.; Sánchez, D.; Belanche-Muñoz, L.A.; Muniesa, M.; Blanch, A.R. Predicting fecal sources in waters with diverse pollution loads using general and molecular host-specific indicators and applying machine learning methods. J. Environ. Manag. 2015, 151, 317–325. [Google Scholar] [CrossRef] [PubMed]
  38. Chianese, E.; Camastra, F.; Ciaramella, A.; Landi, T.C.; Staiano, A.; Riccio, A. Spatio-temporal learning in predicting ambient particulate matter concentration by multi-layer perceptron. Ecol. Inform. 2019, 49, 54–61. [Google Scholar] [CrossRef]
  39. Bentéjac, C.; Csörgő, A.; Martínez-Muñoz, G. A comparative analysis of gradient boosting algorithms. Artif. Intell. Rev. 2021, 54, 1937–1967. [Google Scholar] [CrossRef]
  40. Chen, T.; Guestrin, C. XGBoost: A Scalable Tree Boosting System. In Proceedings of the 22nd ACM Sigkdd International Conference on Knowledge Discovery and Data Mining, San Francisco, CA, USA, 13–17 August 2016. [Google Scholar] [CrossRef]
  41. Joshi, A.; Pradhan, B.; Chakraborty, S.; Behera, M.D. Winter wheat yield prediction in the conterminous United States using solar-induced chlorophyll fluorescence data and XGBoost and random forest algorithm. Ecol. Inform. 2023, 77, 102194. [Google Scholar] [CrossRef]
  42. Shakeri, R.; Amini, H.; Fakheri, F.; Ketabchi, H. Assessment of drought conditions and prediction by machine learning algorithms using Standardized Precipitation Index and Standardized Water-Level Index (case study: Yazd province, Iran). Environ. Sci. Pollut. Res. 2023, 30, 101744–101760. [Google Scholar] [CrossRef]
  43. Lyashevska, O.; Harma, C.; Minto, C.; Clarke, M.; Brophy, D. Long-term trends in herring growth primarily linked to temperature by gradient boosting regression trees. Ecol. Inform. 2020, 60, 101154. [Google Scholar] [CrossRef]
  44. Persson, C.; Bacher, P.; Shiga, T.; Madsen, H. Multi-site solar power forecasting using gradient boosted regression trees. Sol. Energy 2017, 150, 423–436. [Google Scholar] [CrossRef]
  45. Otchere, D.A.; Ganat, T.O.A.; Ojero, J.O.; Tackie-Otoo, B.N.; Taki, M.Y. Application of gradient boosting regression model for the evaluation of feature selection techniques in improving reservoir characterisation predictions. J. Pet. Sci. Eng. 2022, 208, 109244. [Google Scholar] [CrossRef]
  46. Bennett, N.D.; Croke, B.F.W.; Guariso, G.; Guillaume, J.H.A.; Hamilton, S.H.; Jakeman, A.J.; Marsili-Libelli, S.; Newham, L.T.H.; Norton, J.P.; Perrin, C.; et al. Characterising performance of environmental models. Environ. Model. Softw. 2013, 40, 1–20. [Google Scholar] [CrossRef]
  47. Everaert, G.; Bennetsen, E.; Goethals, P.L.M. An applicability index for reliable and applicable decision trees in water quality modelling. Ecol. Inform. 2016, 32, 1–6. [Google Scholar] [CrossRef]
  48. Oseibryson, K. Post-pruning in regression tree induction: An integrated approach. Expert Syst. Appl. 2008, 34, 1481–1490. [Google Scholar] [CrossRef]
Figure 1. Examples of fluvial meandering pattern. (a) Rio Mamore, wandering in alluvial fans in Bolivia, (b) Rio Santa maria evolving in a flat valley in Brazil, (c) Reka Chuya, constrained moderately in confinement in Altai republic, Russia, and (d) White river developing in a confined valley in south Dakota, US. Source: Bing.com/maps.
Water 16 02460 g001
Figure 2. In the numerical and analytical solutions there are: (a) a reference system and notations for a river planform and the cross section and (b) a schematic migration of a point on the channel axis because of displacement from the last timestep centerline position and new timestep centerline position. Through this system of notation and planform migration, it is possible to calculate the migration. In the plot (b), the dashed line shows the last position of the bend, the solid blue line illustrates the current position of the bend. Also, in the plot (a), the asterisk shows dimensionless parameters.
Water 16 02460 g002
Figure 3. General scheme for (a) multi-layer perceptron model including the layers and how they are connected. The number of hidden layers can vary depending on the optimum architecture. (b) An overview on the XGBoost algorithm and Gradient Boosting Algorithm, which are ensemble learning models and (c) how the decision tree algorithm tries to find the best prediction in regression/classification problems using sub samples. The colors in the plot (c) are hypothetical but basically it tries to show that in the decision based models, there are differences between answers that makes the branches and the whole tree and final result comes based on the comparison between the prediction and the actual data.
Water 16 02460 g003
Figure 4. The general pipeline/flowchart for the data analysis that is performed in this study. In other words, the journey from loading the input data to deploying the model in every machine learning algorithm.
Water 16 02460 g004
Figure 5. An illustration of the normalized distribution of “Theta”, “Curvature”, and “Near Bank velocity”.
Water 16 02460 g005
Figure 6. Heatmap matrix visualizing the correlation between different variables on near-bank velocity based on the Pearson correlation coefficient.
Water 16 02460 g006
Figure 7. The overall trend of excess near-bank velocity together with 4 different non-linear ML algorithms. Different colors and different markers represent different machine learning models. This figure shows the actual and predicted values of near-bank velocity that are used in the numerical Equations (1) and (2) to predict the planform. The predicted values of near-bank velocity through the ML models have been replaced with the actual values and, with the remaining actual values, this has been plotted.
Water 16 02460 g007
Figure 8. (a)The residuals for both the train and test datasets using XGBoost model. This plot shows the residuals between the predicted value and the actual value and the result shows good accuracy between prediction and real values (b) Shows the max depth for XGBoost with respect to the score of the model for both train and test. In the plot (b), the shadows represent the confidence intervals.
Water 16 02460 g008
Figure 9. (a,b)Theta and curvature’s distribution of SHAP values, two variables used in an XGBoost machine learning model. The horizontal axis shows the SHAP value, while the vertical axis shows the number of occurrences (data points). This plot tries to open the ML model black box to show how the prediction of the target which is Excess near-bank velocity is influenced by curvature and how the curvature and inflection angle is characterized by curvature within this prediction.
Water 16 02460 g009
Figure 10. Comparison between predicted planform and actual planform in a confined meander reach. The black line represents the actual planform that was the output of the semi-analytical solution, and the red line corresponds a planform that is plotted using the predicted values of excess near-bank velocity. The accuracy between the actual and predicted planforms is reporting the feasibility of using the model for planform migration prediction.
Water 16 02460 g010
Table 1. Comparison of different supervised\architectures including MLP, XGBoost, gradient boosting regressor (GBR), and decision tree (DT).
MLP
Activation functionAlphaHidden layer sizeSolver
Tanh0.000510lbfgs
XGBoost
Learning rateMax depthObjectiveSub sampleCol sampleMin child weight
0.2UniformAuto402Minkowsiki
Gradient Boosting Regressor (GBR)
Min sample splitMin sample leafMax variableLearning rateNumber of estimatorsSub sample
6UniformAuto0.1150Minkowski
Decision Tree
CriterionMax depthSplitterccp_alpha
Friedman_mse5Best0.1
Table 2. The performances of different models based on the RMSE, R2, MAE, and MSE.
MetriceXtreme Gradient BoostingMLP RegressorGradient Boosting RegressorDecision Tree Regressor
MAE0.02640.20420.04240.0343
MSE0.00230.06470.00540.0064
RMSE0.04750.25450.07330.0802
R20.91970.41710.95160.9021
Disclaimer/Publisher’s Note: The statements, opinions and data contained in all publications are solely those of the individual author(s) and contributor(s) and not of MDPI and/or the editor(s). MDPI and/or the editor(s) disclaim responsibility for any injury to people or property resulting from any ideas, methods, instructions or products referred to in the content.

