A Web-Based Tool to Interpolate Nitrogen Loading Using a Genetic Algorithm

Abstract
:1. Introduction
2. Materials and Methods
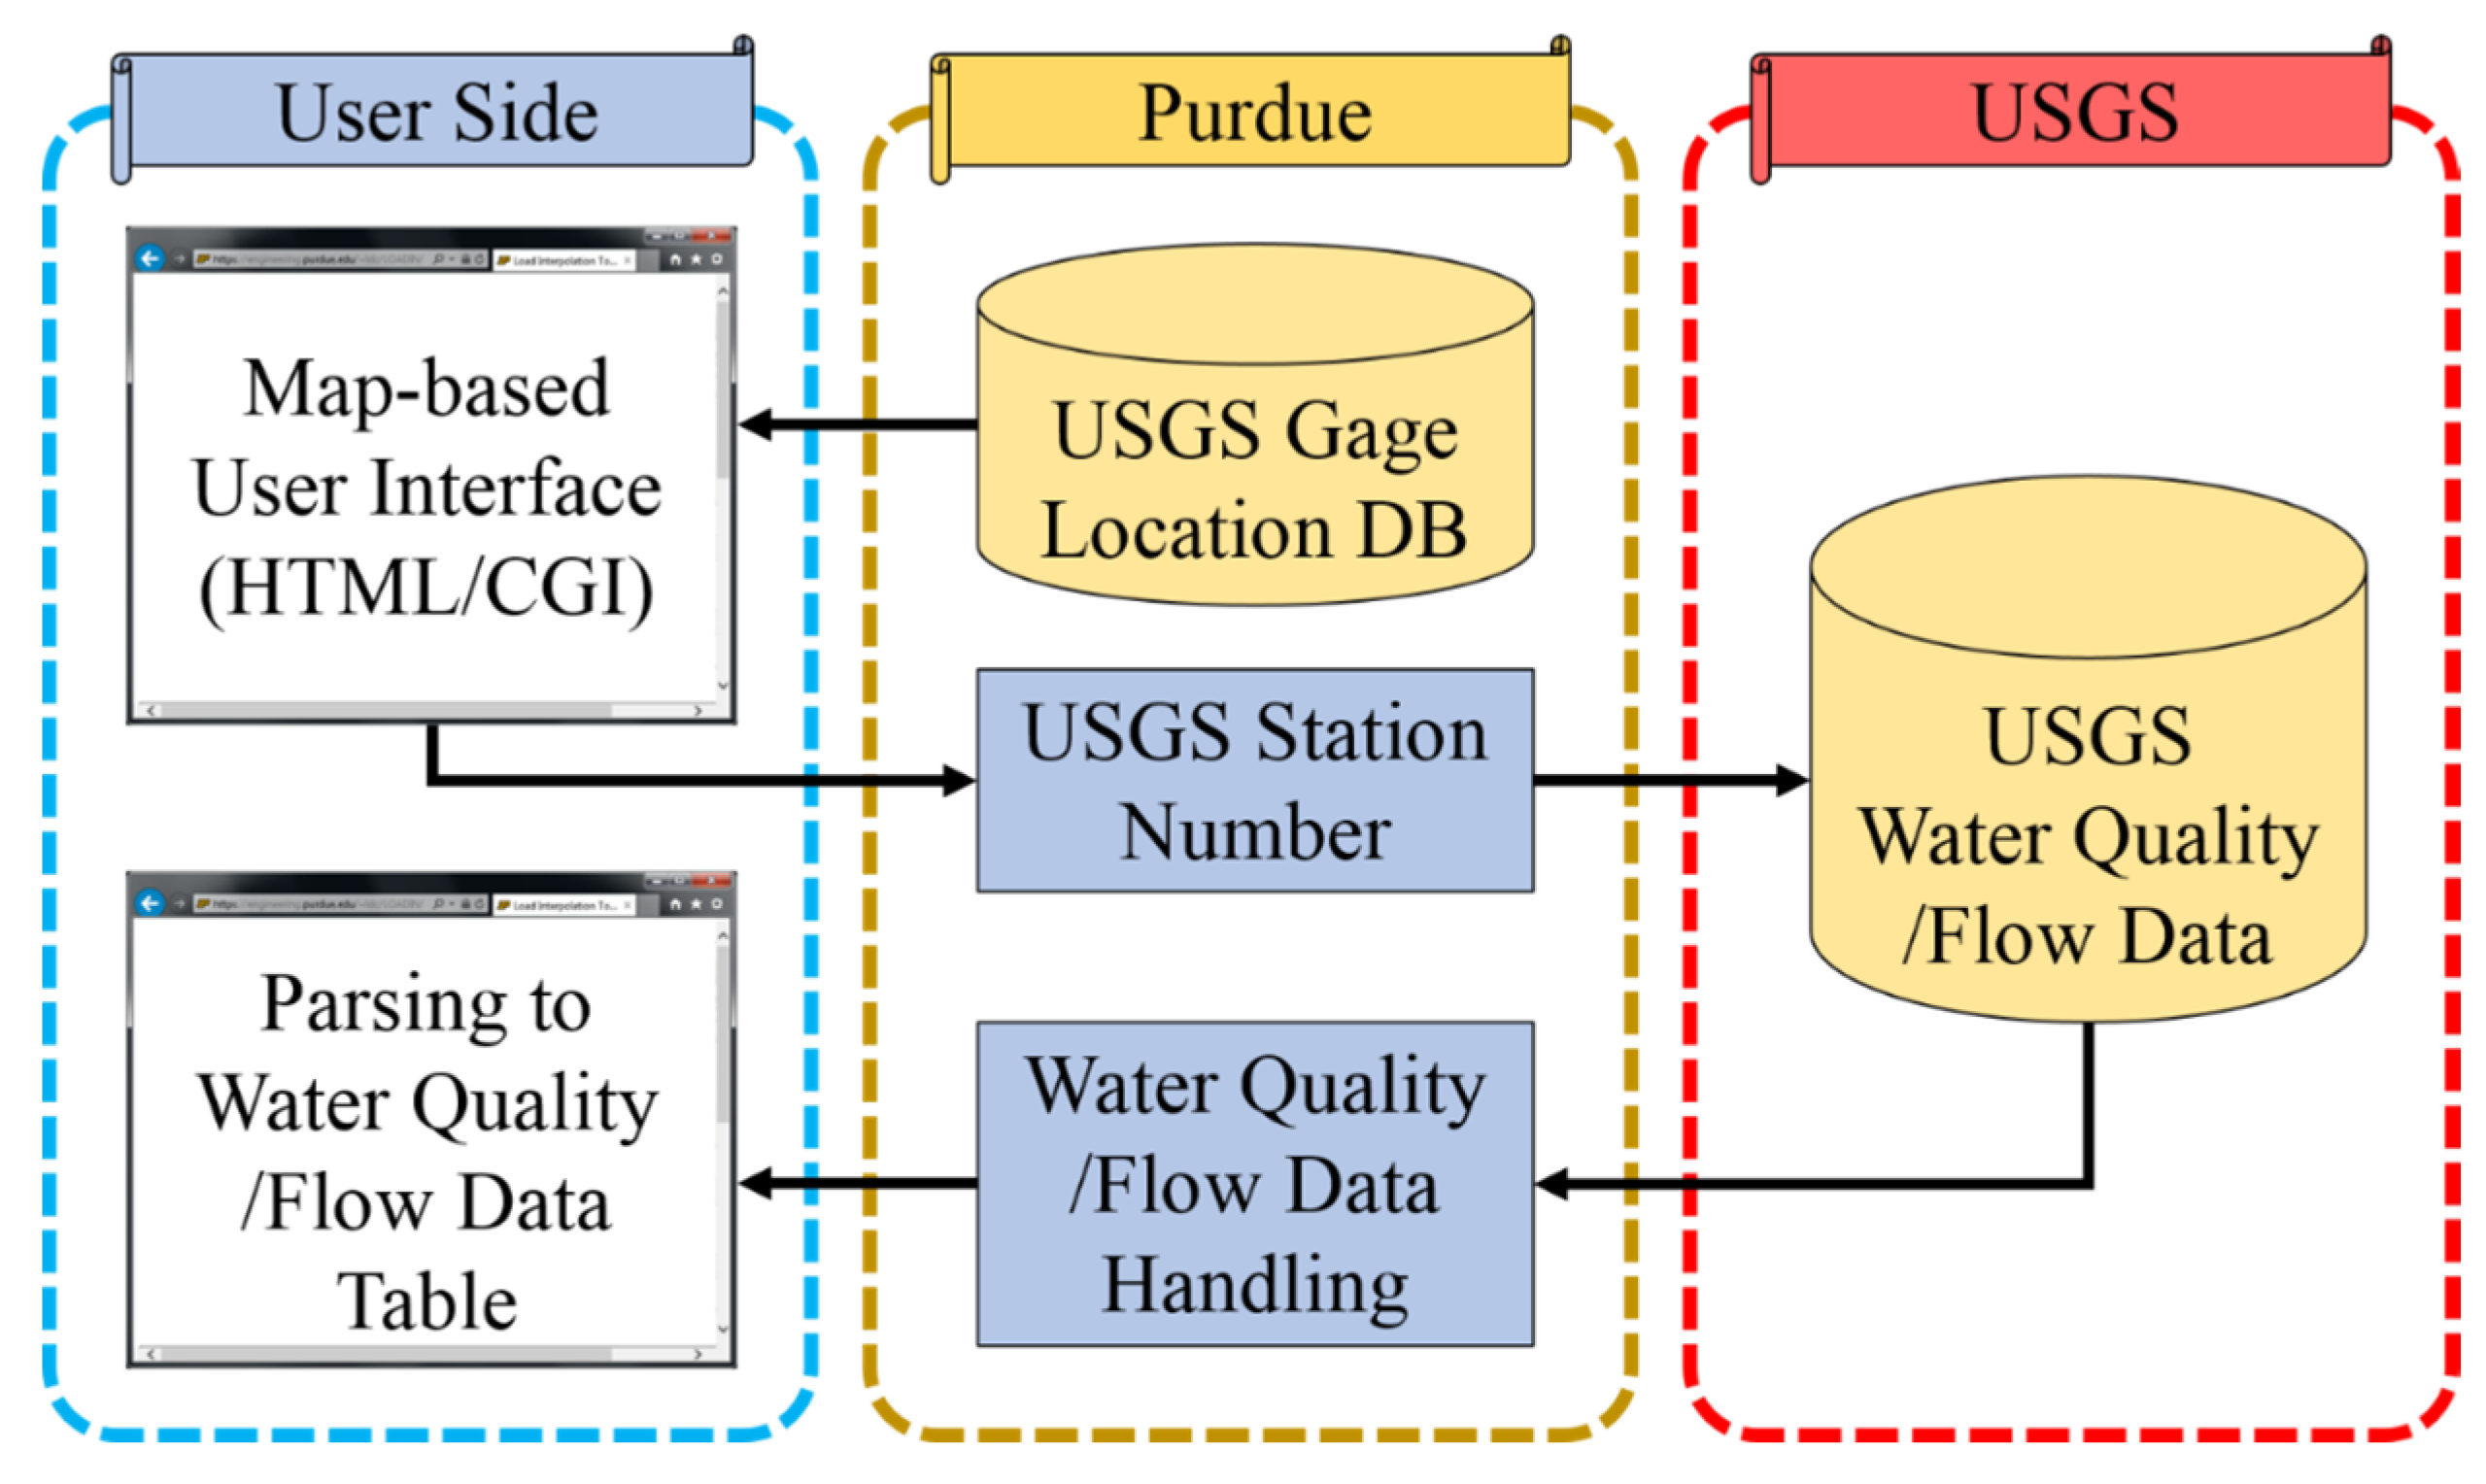
2.1. Web Interface Development


2.2. Regression Model to Estimate Loads
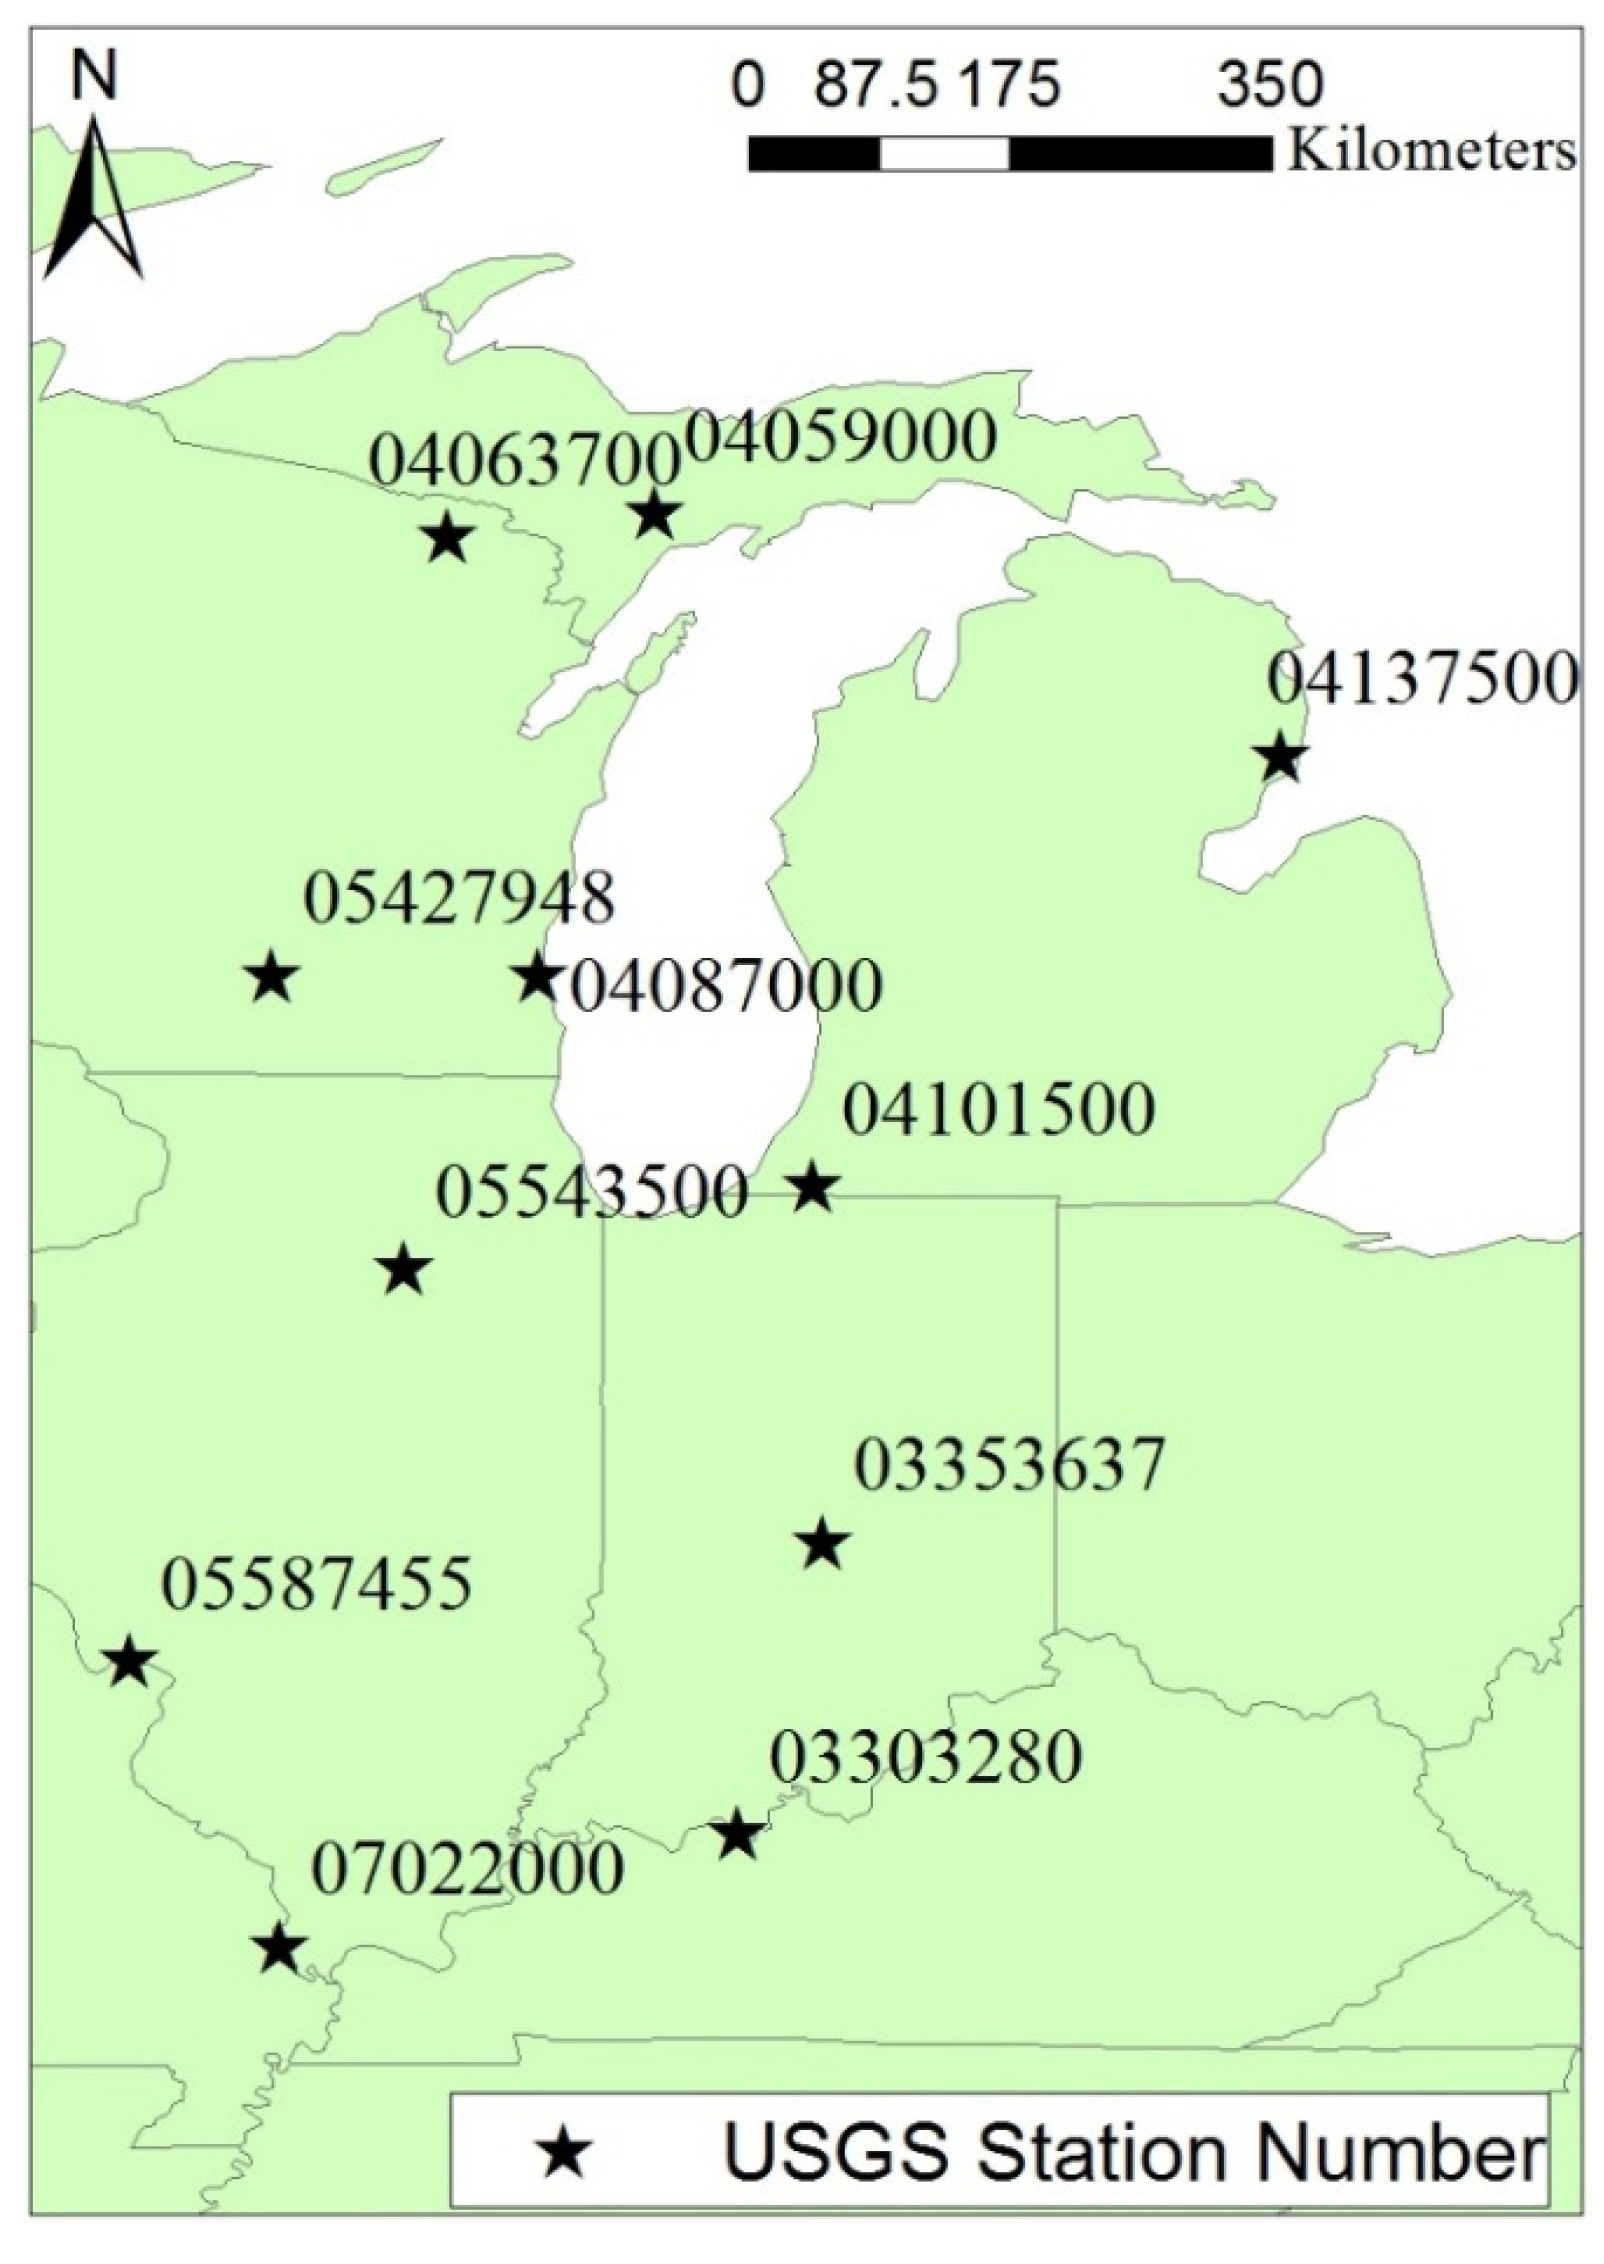
3. Application of LOADIN


| Station number | USGS station name | Drainage area (km2) | Data period | Streamflow (m3/s) | |||
|---|---|---|---|---|---|---|---|
| Min. | Max. | Mean | Standard deviation | ||||
| 03353637 | Little Buck Creek near Indianapolis, IN | 44 | 17/05/1990–07/09/2004 | 0.01 | 39.36 | 0.60 | 1.54 |
| 05427948 | Pheasant Branch at Middleton, WI | 47 | 26/05/2009–17/06/2014 | 0.02 | 7.96 | 0.21 | 0.42 |
| 04063700 | Popple river near Fence, WI | 360 | 24/10/1979–10/06/2014 | 0.28 | 42.48 | 2.87 | 3.19 |
| 04087000 | Milwaukee river at Milwaukee, WI | 1803 | 18/09/1979–21/09/2009 | 0.23 | 254.00 | 15.06 | 17.77 |
| 04059000 | Escanaba river at Cornell, MI | 2253 | 26/09/1979–08/09/1994 | 4.25 | 294.50 | 22.65 | 22.95 |
| 04137500 | Au Sable river near Au Sable, MI | 4504 | 15/03/2011–09/09/2013 | 20.98 | 125.16 | 37.42 | 13.55 |
| 04101500 | St. Joseph river at Niles, MI | 9495 | 09/03/2011–16/06/2014 | 22.37 | 399.27 | 107.29 | 63.56 |
| 05543500 | Illinois river at Marseilles, IL | 21,391 | 25/09/1979–09/07/1998 | 58.62 | 2537.20 | 320.30 | 252.33 |
| 03303280 | Ohio river at Cannelton dam at Cannelton, IN | 251,229 | 17/01/1996–13/08/2013 | 72.21 | 20813.00 | 3997.84 | 3500.26 |
| 05587455 | Mississippi river below Grafton, IL | 443,665 | 16/10/1997–11/09/2013 | 379.45 | 12799.28 | 3665.40 | 2507.87 |
| 07022000 | Mississippi River at Thebes, IL | 1,847,180 | 26/07/1977–19/05/2014 | 1463.99 | 27694.03 | 6772.44 | 4200.45 |
| Station number | Number of data (Nitrogen/Streamflow) | Mean intervals of Nitrogen Data (days) | NSE | R2 |
|---|---|---|---|---|
| 03353637 | 231/5228 | 23 | 0.83 | 0.84 |
| 05427948 | 218/1850 | 8 | 0.45 | 0.51 |
| 04063700 | 215/12,597 | 59 | 0.52 | 0.58 |
| 04087000 | 253/10,963 | 43 | 0.84 | 0.84 |
| 04059000 | 98/5462 | 56 | 0.89 | 0.90 |
| 04137500 | 102/911 | 9 | 0.60 | 0.64 |
| 04101500 | 63/1193 | 19 | 0.91 | 0.91 |
| 05543500 | 154/6863 | 45 | 0.85 | 0.86 |
| 03303280 | 233/6421 | 28 | 0.88 | 0.88 |
| 05587455 | 210/5810 | 28 | 0.87 | 0.87 |
| 07022000 | 413/13,505 | 33 | 0.79 | 0.79 |

| Station Number | Percentage of nitrogen data collected (%) | |||||||||||
|---|---|---|---|---|---|---|---|---|---|---|---|---|
| Jan. | Feb. | Mar. | Apr. | May | Jun. | Jul. | Aug. | Sep. | Oct. | Nov. | Dec. | |
| 03353637 | 6 | 4 | 6 | 6 | 15 | 16 | 14 | 14 | 7 | 3 | 4 | 5 |
| 05427948 | 6 | 9 | 20 | 14 | 14 | 12 | 4 | 3 | 4 | 3 | 5 | 6 |
| 04063700 | 6 | 7 | 8 | 10 | 8 | 11 | 6 | 12 | 9 | 7 | 10 | 8 |
| 04087000 | 5 | 6 | 9 | 8 | 11 | 13 | 11 | 9 | 9 | 7 | 7 | 6 |
| 04059000 | 12 | 3 | 10 | 9 | 8 | 10 | 7 | 7 | 11 | 6 | 10 | 5 |
| 04137500 | 8 | 2 | 15 | 19 | 8 | 7 | 4 | 3 | 4 | 11 | 6 | 15 |
| 04101500 | 8 | 8 | 8 | 19 | 6 | 6 | 6 | 5 | 3 | 3 | 6 | 21 |
| 05543500 | 6 | 8 | 8 | 9 | 11 | 6 | 8 | 13 | 7 | 6 | 10 | 7 |
| 03303280 | 11 | 9 | 12 | 12 | 12 | 13 | 4 | 8 | 3 | 2 | 6 | 7 |
| 05587455 | 6 | 8 | 10 | 10 | 9 | 11 | 8 | 8 | 7 | 8 | 8 | 7 |
| 07022000 | 5 | 6 | 10 | 12 | 14 | 11 | 11 | 8 | 7 | 7 | 4 | 5 |
4. Conclusions
Author Contributions
Conflicts of Interest
References
- Coulter, C.B.; Kolka, R.K.; Thompson, J.A. Water quality in agricultural, urban, and mixed land use watershed. J. Am. Water Resour. Assoc. 2004, 40, 1593–1601. [Google Scholar]
- McMahon, G.; Harned, D.A. Effect of environmental setting on sediment, nitrogen, and phosphorus concentration in Albemarle-Pamlico Drainage Basin, North Carolina and Virginia, USA. Environ. Manag. 1998, 22, 887–903. [Google Scholar]
- Carey, R.O.; Migliaccio, K.W.; Brown, M.T. Nutrient discharges to Biscayne Bay, Florida: Trends, loads, and a pollutant index. Sci. Total Environ. 2011, 409, 530–539. [Google Scholar]
- Park, Y.S.; Engel, B.A.; Shin, Y.; Choi, J.; Kim, N.W.; Kim, S.J.; Kong, D.S.; Lim, K.J. Development of Web GIS-based VFSMOD System with three modules for effective vegetative filter strip design. Water 2013, 5, 1194–1210. [Google Scholar]
- Schelske, C.L.; Havens, K.E. The importance of considering biological processes when setting total maximum daily loads (TMDL) for phosphorus in shallow lakes and reservoirs. Environ. Pollut. 2001, 113, 1–9. [Google Scholar]
- Park, Y.S. Development and Enhancement of Web-Based Tools to Develop Total Maximum Daily Load. Ph.D. Thesis, Purdue University, West Lafayette, IN, USA, 18 May 2014; pp. 10–45. [Google Scholar]
- Engel, B.A.; Lim, K.J.; Hunter, J.; Chaubey, I.; Quansah, J.E.; Theller, L.; Park, Y.S. Web-Based LDC Tool User’s Guide; Purdue University: West Lafayette, IN, USA, 2014. [Google Scholar]
- Robertson, D.M. Influence of different temporal sampling strategies on estimating total phosphorus and suspended sediment concentration and transport in small streams. J. Am. Water Resour. Assoc. 2003, 39, 1281–1308. [Google Scholar]
- Horowitz, A.J. An evaluation of sediment rating curves for estimating suspended sediment concentrations for subsequent flux calculations. Hydrol. Proc. 2003, 17, 3387–3409. [Google Scholar]
- Robertson, D.M.; Roerish, E.E. Influence of various water quality sampling strategies on load estimates for small streams. Water Resour. Res. 1999, 35, 3747–3759. [Google Scholar]
- Harmel, R.D.; King, K.W.; Haggard, B.E.; Wren, D.G.; Sheridan, J.M. Practical guidance for discharge and water quality data collection on small watershed. Trans. Am. Soc. Agric. Eng. 2006, 49, 937–948. [Google Scholar]
- Gilroy, E.J.; Hirsch, R.M.; Cohn, T.A. Mean square error of regression-based constituent transport estimates. Water Resour. Res. 1990, 26, 2069–2077. [Google Scholar]
- Cohn, T.A.; DeLong, L.L.; Gilroy, E.J.; Hirsh, R.M.; Wells, D.K. Estimating constituent loads. Water Resour. Res. 1989, 25, 937–942. [Google Scholar]
- Cohn, T.A.; Caulder, D.L.; Gilroy, E.J.; Zynjuk, L.D.; Summers, R.M. The validity of a simple statistical model for estimating fluvial constituent loads: An empirical study involving nutrient loads entering Chesapeake Bay. Water Resour. Res. 1992, 28, 2353–2363. [Google Scholar]
- Runkel, R.L.; Crawford, C.G.; Cohn, T.A. Load Estimator (LOADEST): A Fortran Program for Estimating Constituent Loads in Streams and Rivers; U.S. Geological Survey Techniques and Methods: Reston, VA, USA, 2004. [Google Scholar]
- Maret, T.R.; MacCoy, D.E.; Carlisle, D.M. Long-term water quality and biological responses to multiple best management practices in Rock Creek, Idaho. J. Am. Water Resour. Assoc. 2008, 44, 1248–1269. [Google Scholar]
- Duan, S.; Kaushal, S.S.; Groffman, P.M.; Band, L.E.; Belt, K.T. Phosphorus export across an urban to rural gradient in the Chesapeake Bay watershed. J. Geophys. Res. 2012, 117. [Google Scholar] [CrossRef]
- Brigham, M.E.; Wentz, D.A.; Aiken, G.R.; Krabbenhoft, D.P. Mercury cycling in stream ecosystems. 1. Water column chemistry and transport. Environ. Sci. Technol. 2009, 43, 2720–2725. [Google Scholar]
- Dornblaser, M.M.; Striegl, R.G. Suspended sediment and carbonate transport in the Yukon River basin, Alska: Flouxes and potential future responses to climate change. Water Resour. Res. 2009, 45. [Google Scholar] [CrossRef]
- Oh, J.; Sankarasubramanian, A. Interannual hydroclimatic variability and its influence on winter nutrients variability over the southeast United States. Hydrol. Earth Syst. Sci. Discuss. 2011, 8, 10935–10971. [Google Scholar]
- Park, Y.S.; Engel, B.A.; Harbor, J. A web-based model to estimate the impact of best management practices. Water 2014, 6, 455–471. [Google Scholar]
- Park, Y.S.; Engel, B.A. Use of pollutant load regression models with various sampling frequencies for annual load estimation. Water 2014, 6, 1685–1697. [Google Scholar]
- Web-based Load Interpolation Tool. Available online: https://engineering.purdue.edu/~ldc/LOADIN (accessed on 21 July 2014).
- USGS Water-Quality Data for the Nation. Available online: http://waterdata.usgs.gov/nwis/qw (accessed on 23 March 2013).
- Park, Y.S. Development and enhancement of web-based tools to develop Total Maximum Daily Load. Ph.D. Thesis, Purdue University: West Lafayette, IN, USA, 2014; 10–70. [Google Scholar]
- Holland, J.H. Adaptation in Natural and Artificial Systems; University of Michigan Press: Ann Arbor, MI, USA, 1975. [Google Scholar]
- Park, Y.S.; Kim, J.; Kim, N.W.; Kim, S.J.; Jeon, J.H.; Engel, B.A.; Jang, W.S.; Lim, K.J. Development of new R, C, and SDR modules for the SATEEC GIS system. Comput. Geosci. 2010, 36, 726–734. [Google Scholar]
- Lim, K.J.; Park, Y.S.; Kim, J.; Shin, Y.C.; Kim, N.W.; Kim, S.J.; Jeon, J.H.; Engel, B.A. Development of genetic algorithm-based optimization module in WHAT system for hydrolograph analysis and model application. Comput. Geosci. 2010, 36, 936–944. [Google Scholar]
- Moriasi, D.N.; Arnold, J.G.; Van Liew, M.W.; Bingner, R.L.; Harmel, R.D.; Veith, T.L. Model evaluation guidelines for systematic quantification of accuracy in watershed simulations. Trans. Am. Soc. Agric. Eng. 2007, 50, 885–900. [Google Scholar]
© 2014 by the authors; licensee MDPI, Basel, Switzerland. This article is an open access article distributed under the terms and conditions of the Creative Commons Attribution license (http://creativecommons.org/licenses/by/3.0/).
Share and Cite
Park, Y.S.; Engel, B.A. A Web-Based Tool to Interpolate Nitrogen Loading Using a Genetic Algorithm. Water 2014, 6, 2770-2781. https://doi.org/10.3390/w6092770
Park YS, Engel BA. A Web-Based Tool to Interpolate Nitrogen Loading Using a Genetic Algorithm. Water. 2014; 6(9):2770-2781. https://doi.org/10.3390/w6092770
Chicago/Turabian StylePark, Youn Shik, and Bernie A. Engel. 2014. "A Web-Based Tool to Interpolate Nitrogen Loading Using a Genetic Algorithm" Water 6, no. 9: 2770-2781. https://doi.org/10.3390/w6092770