1. Introduction
Urban pluvial flooding is expected to become more frequent as a result of urbanisation and the envisaged effects of climate changes [
1]. This type of flooding can happen virtually anywhere and has the potential to cause significant damage and disruption in highly urbanised areas, where the density of buildings, critical infrastructure and population is usually high. The European Directive 2007/60/EC [
2] on the assessment and management of flood risks requires Member States to assess the risk of flooding. To fulfil this requirement, flood hazard maps are used to classify the likelihood of flooding and quantify its consequences.
Spatially-uniform design storms, associated to a given return period usually estimated based upon point rainfall records, have been traditionally used in the design, planning and evaluation of drainage systems, including evaluation of urban pluvial flood hazard. Although the use of such design storms is handy, the uniformly-distributed design storm concept neglects the impact of the spatial variability of rainfall fields, which has shown to have a significant impact on the hydrological response of urban catchments [
3,
4,
5,
6,
7,
8,
9,
10]. In addition, climate change may lead to more extreme rainfall events that usually have a high variability across both, temporal and spatial scales [
11].
Hence, the use of uniform design storms may lead to substantial over- or underestimation of hazard which can have significant financial implications. Moreover, in most frequent studies the return period of the flood is assumed to be equal to that of the rainfall event [
12,
13]. However, the flood event frequency might be different from the frequency of the associated rainfall event. One of the main aims of a stormwater drainage system is to store and transport runoff in such a way that the likelihood of urban pluvial flooding is minimised. Therefore, the return period of a given flood event is generally lower than that of the rainfall event which generates the flooding. It should be noted that this assumption is only valid when the drainage system is well designed (e.g., no sewer bottlenecks) and in a good operational state (e.g., unobstructed sewer inlets) and a good structural condition (e.g., no collapsed sewer pipes).
Several studies have been published on flood risk quantification using a combination of flow/frequency, stage/damage and damage/frequency curves [
14,
15,
16]. Ahmad and Simonovic [
17] proposed a new approach to urban flood risk assessment, using fuzzy set theory to assess the spatial and temporal variability of urban flood damage, and Sun
et al. [
18] proposed a general framework for a risk-based storm sewer network design that takes future risk into account. A detailed review on flood impact assessment in urban areas presented by Hammond
et al. [
11] and Nuswantoro
et al. [
19] indicated the importance of using a probabilistic approach for deriving flood inundation maps at a regional scale.
With the purpose of contributing towards a better estimation of flood hazard and risk in urban areas, this paper presents a methodology to stochastically assess urban pluvial flood hazard, based upon a stochastic spatial-temporal rainfall generator developed by McRobie
et al. [
20]. The proposed approach was tested in a small urban catchment (~9 km
2) in north-east London (UK) with a history of pluvial flooding. In the next section the pilot location used to demonstrate the proposed methodology is presented. Then, the rainfall generator used to produce an ensemble of spatially and temporally variable design storms is described. Afterwards, results are presented and discussed. Lastly, the main conclusions of the present study are outlined and future work is discussed.
2. Pilot Location: The Cranbrook Catchment
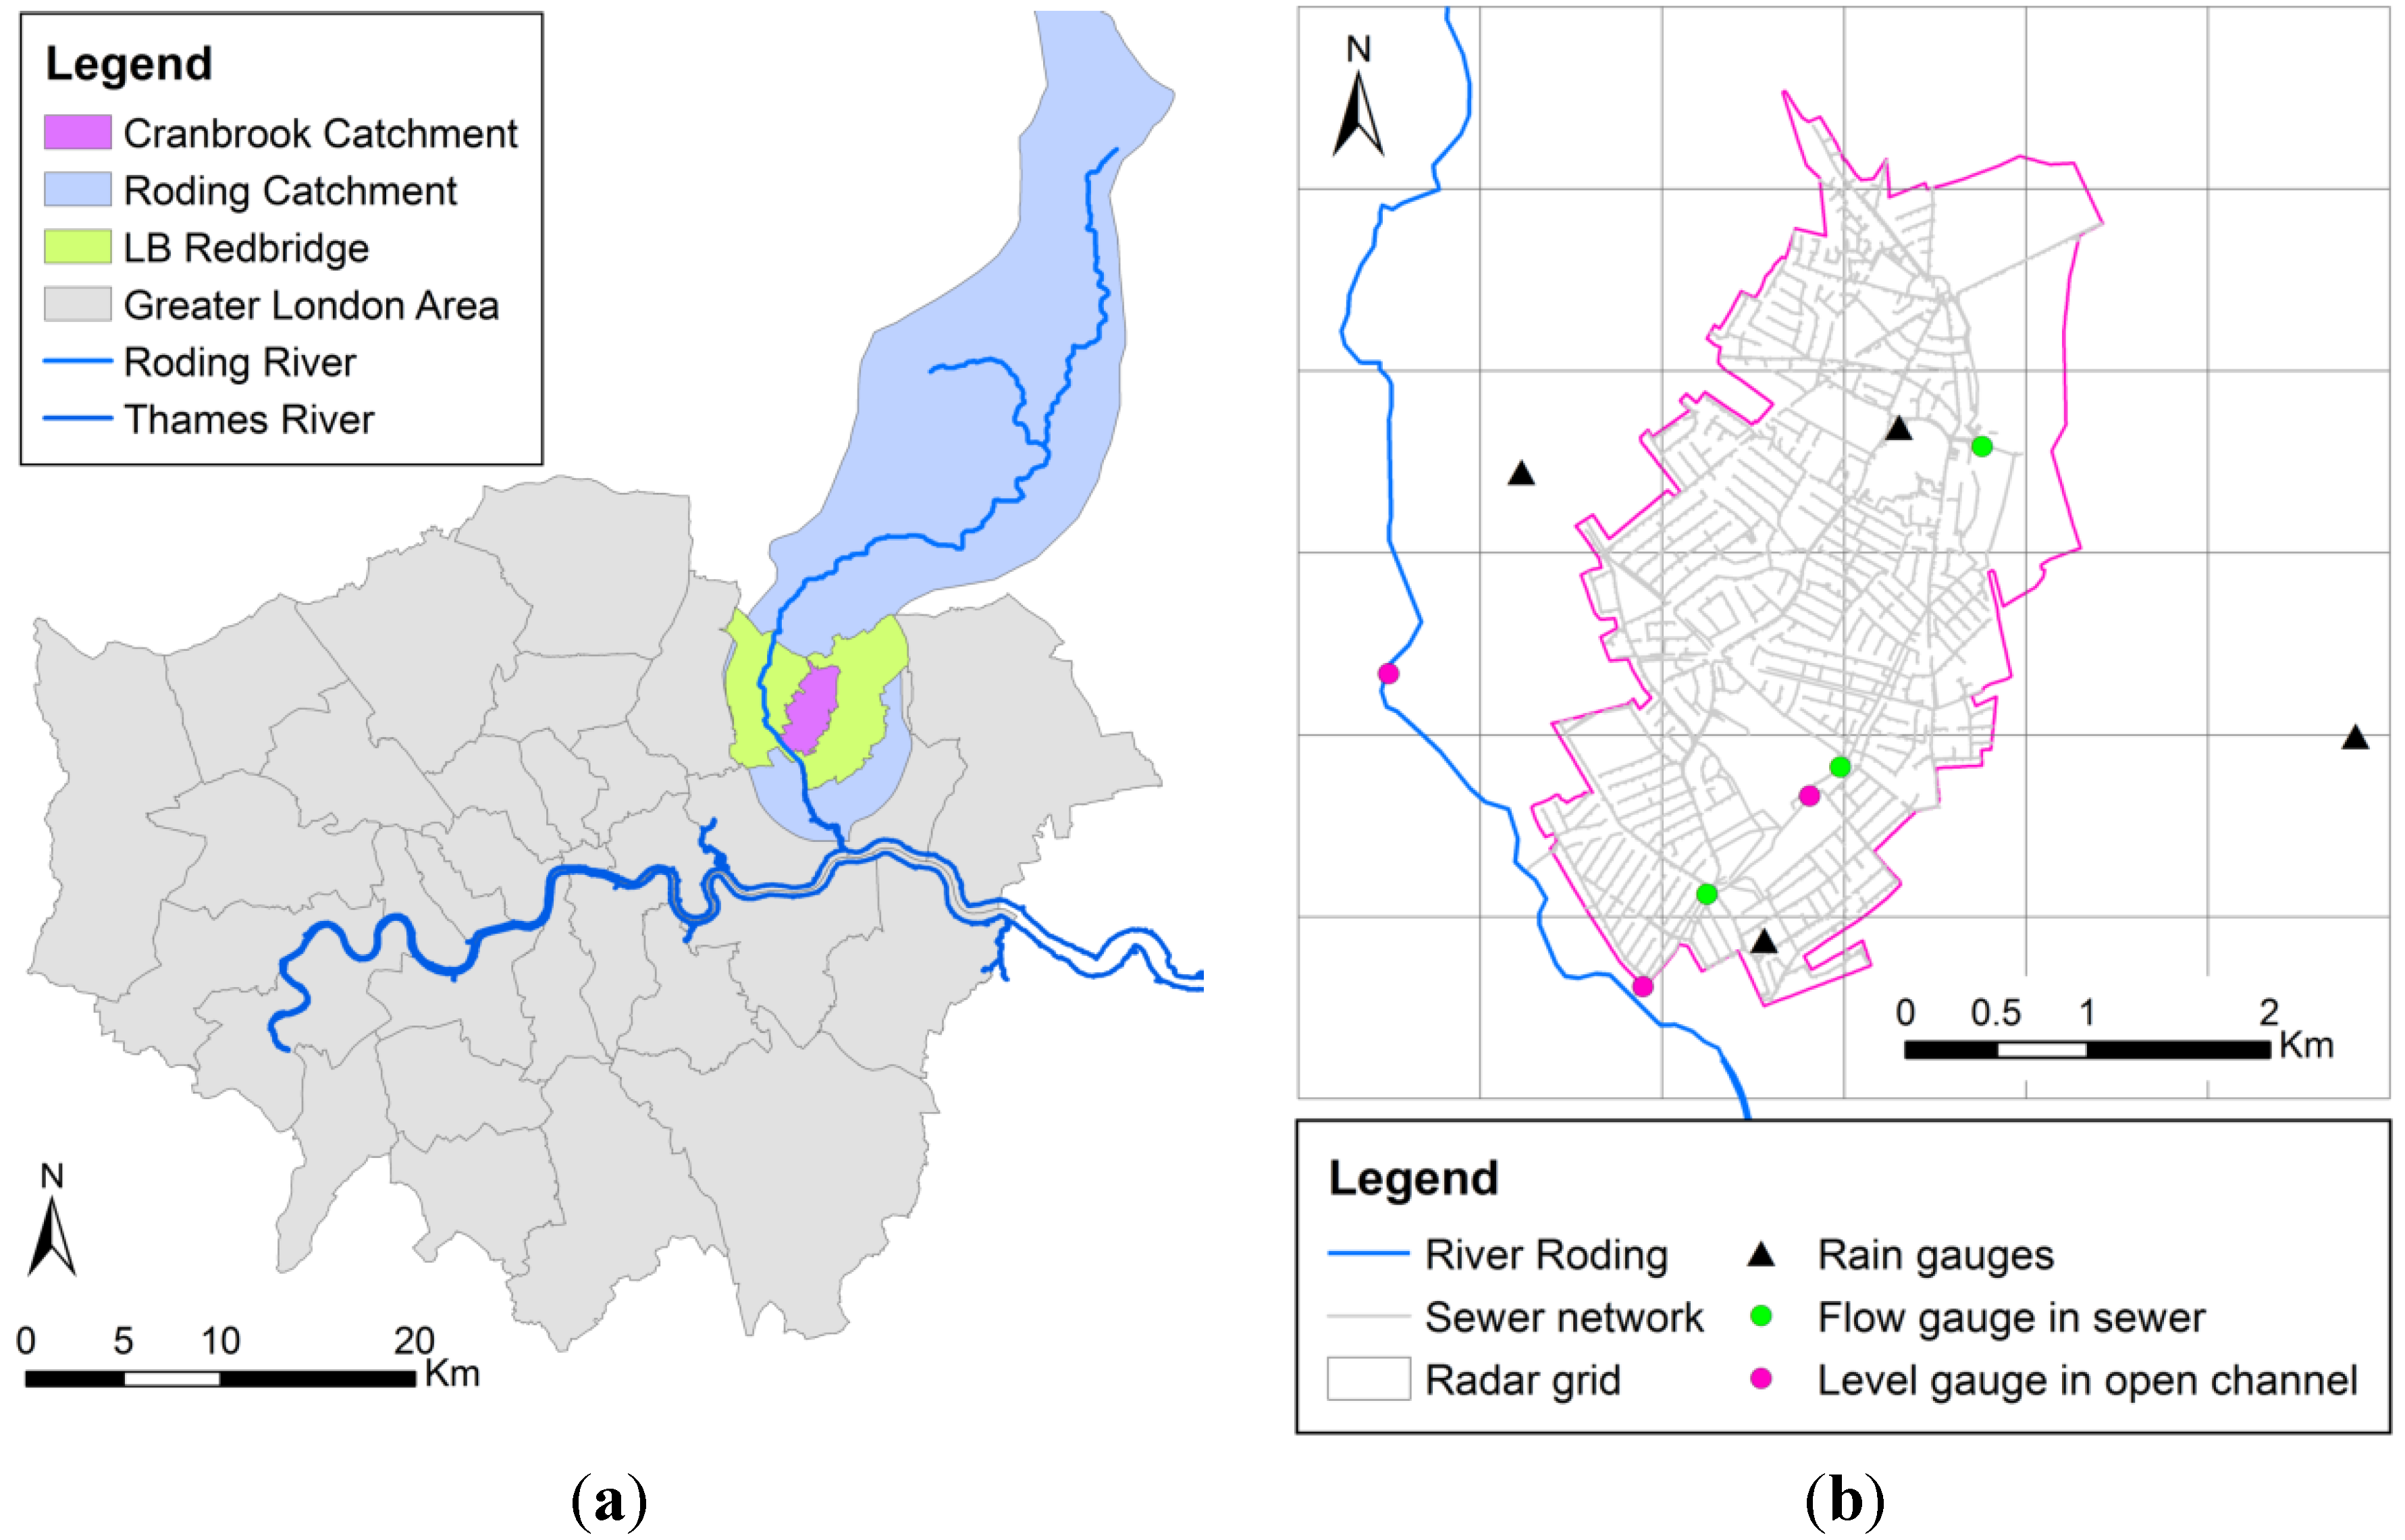
The Cranbrook catchment is located within the London Borough of Redbridge (north-east part of Greater London, UK,
Figure 1) and has experienced several pluvial, fluvial and coincidental flooding in the past. It has a drainage area of approximately 9 km
2 and is predominantly urban, with a combination of residential and commercial areas, plus two off-line lakes, a couple of parks and playing fields. It has a population of approximately 41,000 inhabitants (population density ~4500 persons per km
2).
Figure 1.
Cranbrook catchment: (a) general location; (b) sensor location, sewer network and radar grid over the catchment.
Figure 1.
Cranbrook catchment: (a) general location; (b) sensor location, sewer network and radar grid over the catchment.
The main water course (the Cran Brook) is about 5.75 km long, of which 5.69 km are culverted and have become part of the stormwater drainage system, which is mainly separate. The stormwater drainage system of this catchment discharges into the River Roding, which is a tributary of the River Thames.
3. Spatial-Temporal Stochastic Rainfall Generator
A stochastic rainfall generator for urban-scale applications was used in this paper to generate design storms with spatial and temporal variations. This generator was developed by McRobie
et al. [
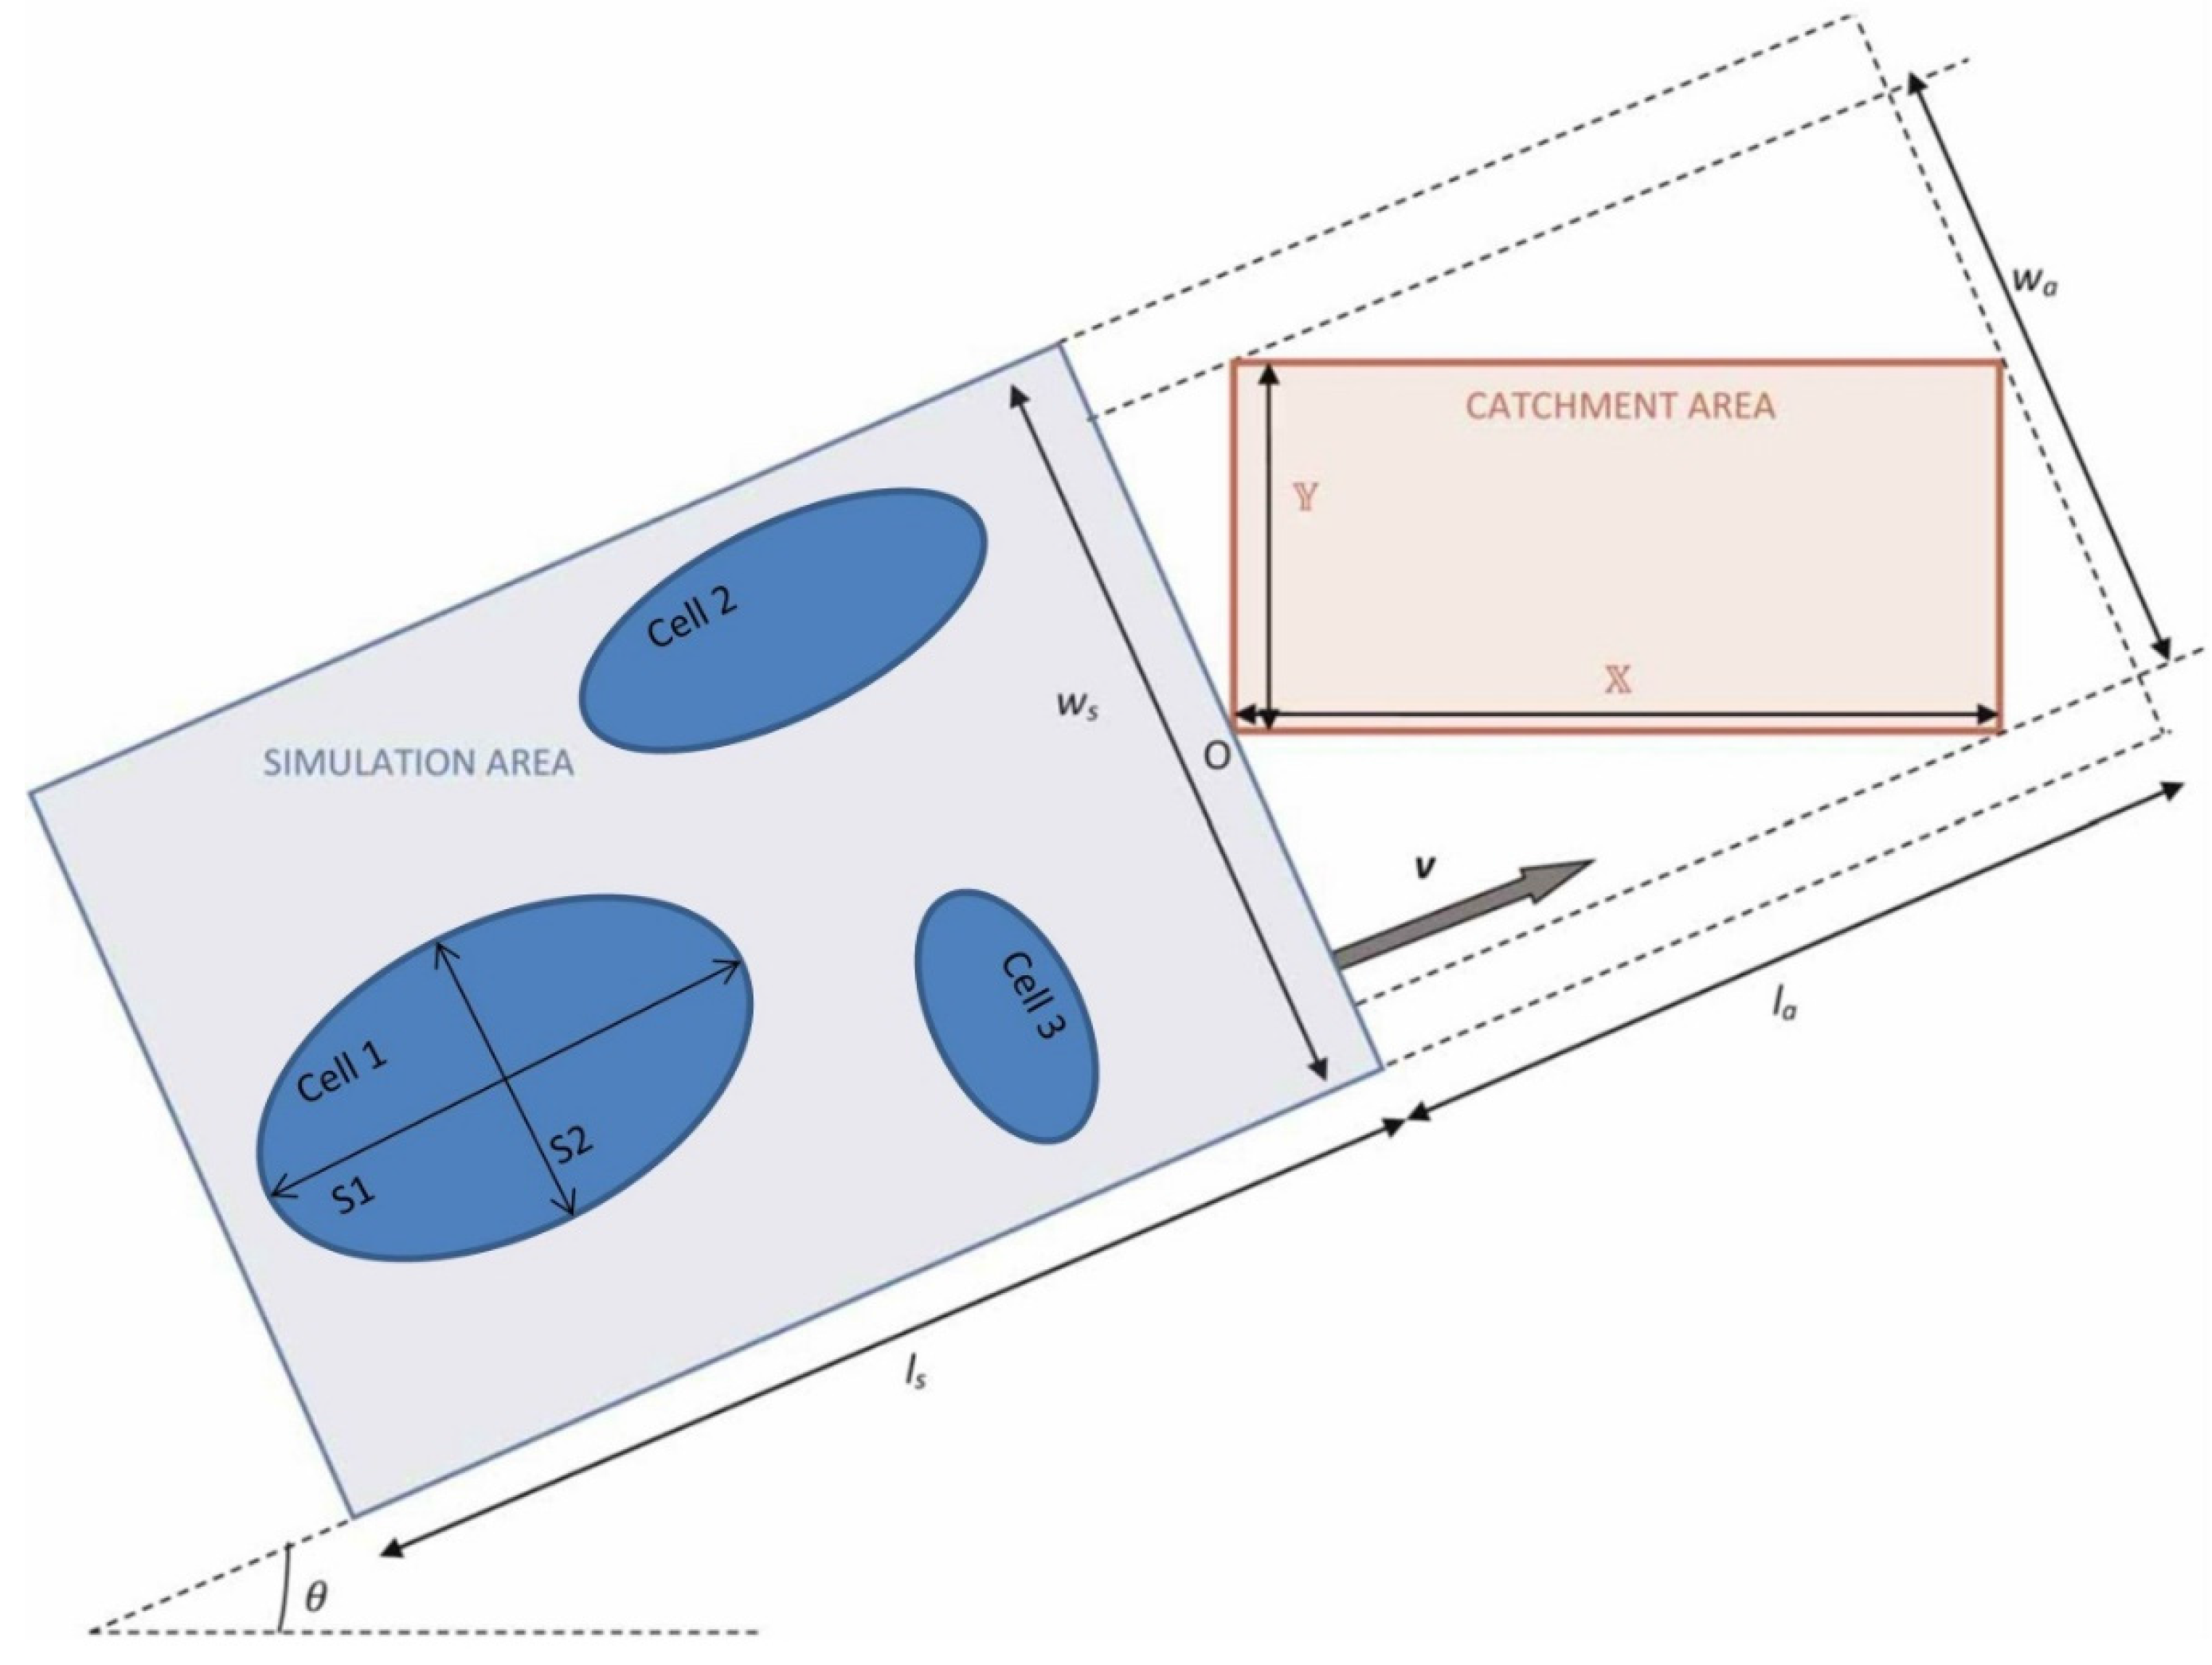
20], where storms were modelled as a Poisson clustering process and the structure of storm cells was approximated using a bivariate Gaussian model. The storm cell features represented in the model include maximum intensity (
rmax) and spread in the direction of and perpendicular to the storm motion (
s1 and
s2 in
Figure 2). This generator is an extension of the technique proposed by Willems [
21]. While Willems’ [
21] generator’s parameters were calibrated based upon historical point rainfall records from a dense network of rain gauges, the parameters of the generator used in this paper (
i.e., McRobie
et al. [
20]) were calibrated using radar rainfall records from 45 historical storm events which reportedly led to flooding in the Greater London area during the period 2000–2011. The statistical models employed and estimated parameters are summarised in
Table 1. It is expected that more realistic spatial features of storm cells can be identified using radar images, as opposed to using rain gauge records.
Figure 2.
Schematic representation of storm movement across the catchment (adapted from
Figure 1 in McRobie
et al. [
20]).
Figure 2.
Schematic representation of storm movement across the catchment (adapted from
Figure 1 in McRobie
et al. [
20]).
Table 1.
Summary of parameter set and the fitted distributions thereof.
Table 1.
Summary of parameter set and the fitted distributions thereof.
| Parameter Set | Fitted Distribution | Distribution Parameters |
|---|
| Storm Duration (d) | Gamma | a (-) = 2.44, b (h) = 17.92 |
| Number of Cells Per Square Kilometre (λ) | Normal | μ (km−2) = 0.0099, σ (km−2) = 0.0032 |
| Velocity Magnitude (v) | Log Normal | μ (km/h) = 78.30, σ (km/h) = 23.64 |
| Velocity Direction (θ) | Log Normal | μ (rads) = 0.51, σ (rads) = 1.16 |
| Cell Spread in Direction of Motion (s1) | Log Normal | μ = 0.700, σ = 1.260 |
| Cell Spread in Direction Perpendicular to Motion (s2) | Log Normal | μ = 0.704, σ = 1.201 |
| Maximum Intensity in Cell (rmax) | Generalised Pareto | k = 0.586, σ = 1.040, θ = 5.0 mm |
With the employed rainfall generator during a storm realisation, several storm cells are initially generated (
i.e., sampled from the probability distributions described above) within the simulation area (see
Figure 2). The overall storm simulation area then moves across the catchment at constant speed (
v) and direction (θ). The number of cells to be generated within the simulation area is determined based upon the sampled cell density per km
2 (λ) and the simulation area. The dimensions of the simulation area (
i.e.,
ws and
ls in
Figure 2) are estimated based upon the sampled storm duration (
d), the sampled storm speed (
v) and the dimension of the catchment area (
i.e.,
wa and
la in
Figure 2). For a detailed formulation of the generator, the reader can refer to McRobie
et al. [
20].
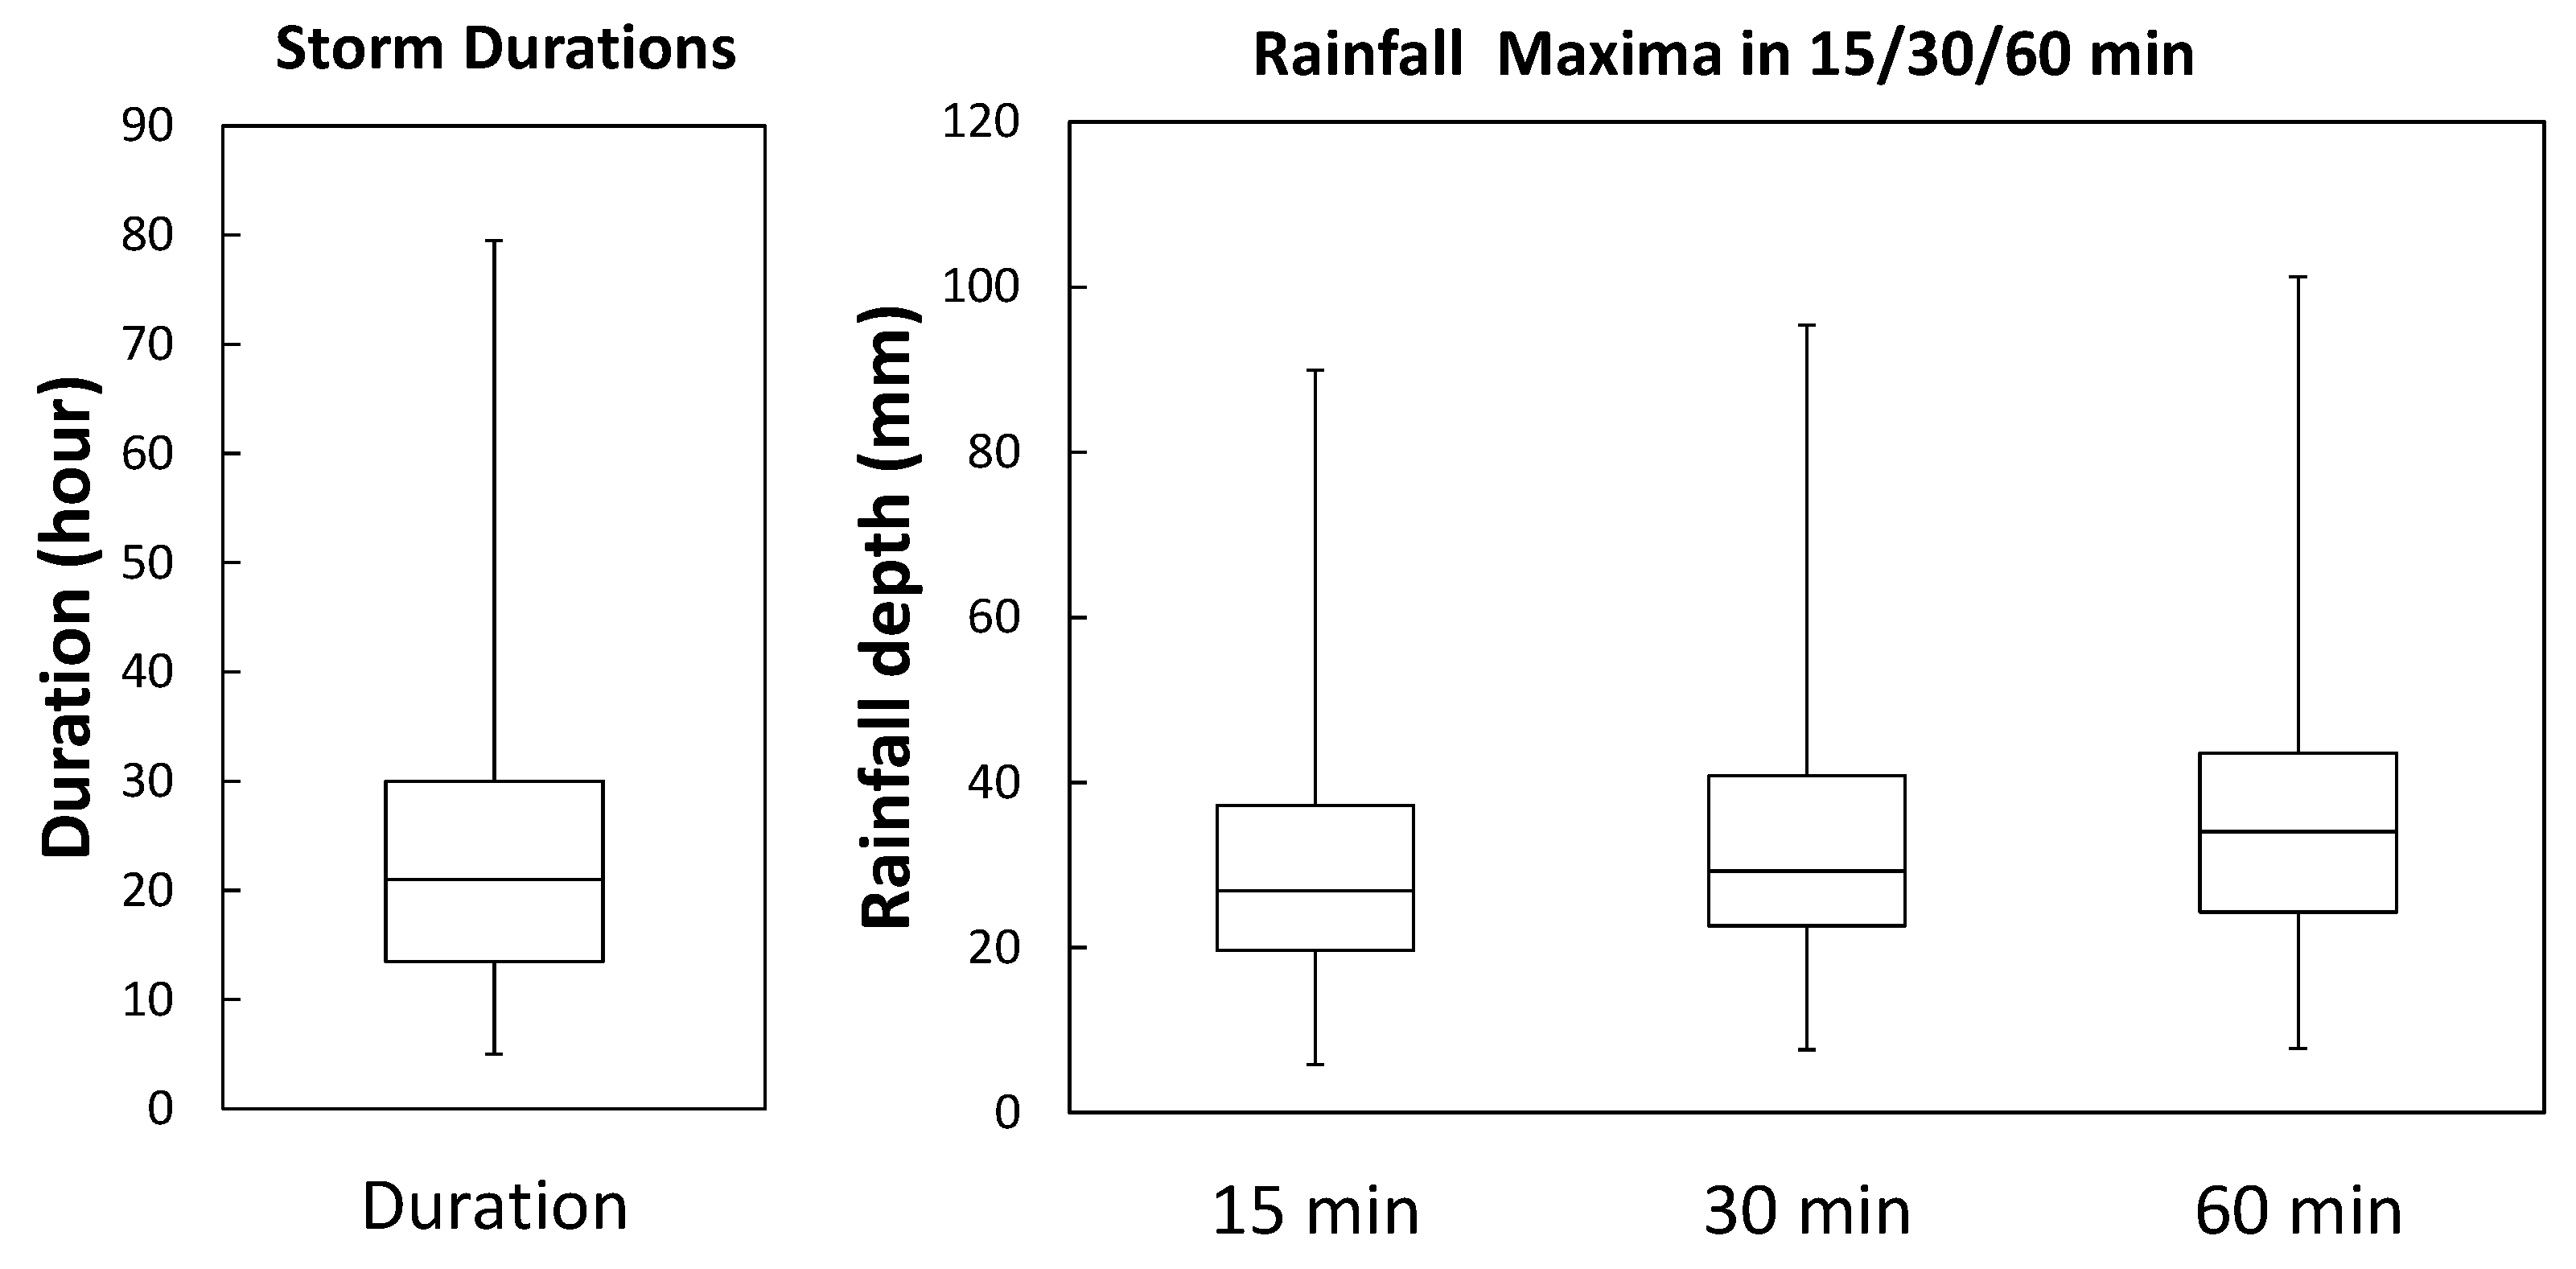
The aforementioned spatial-temporal rainfall generator was used to sample over 450 design storm realisations, with a spatial resolution of 1 km and temporal resolution of 5 min, with the top 45 realisations (
Figure 3) being selected according to the ranking of 60-min duration rainfall maxima. The selected realisations were then used as input for hydraulic modelling. Each rainfall realisation shows a different spatial pattern (different location of rainfall cells in the simulation area; different number of rainfall cells and different speed and direction,
Figure 2). The distributions of the selected storm durations and the rainfall maxima (in mm, at one radar pixel) in 15-, 30- and 60-min durations are summarised in
Figure 3.
Figure 3.
Boxplots of selected storms’ features: (left) storm duration in hours; and (right) rainfall maxima (at one radar pixel) in 15-, 30- and 60-min time durations.
Figure 3.
Boxplots of selected storms’ features: (left) storm duration in hours; and (right) rainfall maxima (at one radar pixel) in 15-, 30- and 60-min time durations.
To further highlight the impact of rainfall spatial variability as well as the importance of using ensembles of storms instead of a single design storm, a spatially-uniform storm event was also generated and used as input for hydraulic modelling. Such storm was generated by averaging in space all pixel values, from the selected 45 storm realisations, at each time step. This approach leads to smoothing of local extremes (including highs and lows), but ensures preservation of the total rainfall volume falling into, thus facilitating comparison of results.
4. Hydraulic Model
A 1D/2D dual-drainage, physically-based model of the Cranbrook catchment was set up in InfoWorks CS 14.0. The data source used includes network and operational data for the 1D sewer model and the 2D overland surface model was created based on an available Digital Terrain Model (DTM—a LiDAR with 1 m horizontal resolution). Buildings polygons and land use data were used to characterise the model and define the surface mesh (e.g., mesh resolution, break lines, voids and boundaries).
Rainfall is applied to the model through 1765 subcatchments with areas ranging from 30 m
2 to 115,400 m
2 (subcatchment median size is 3700 m
2), slopes varying between 0.0 m/m and 0.28 m/m (average of 0.05 m/m). Runoff volumes are estimated with the NewUK model and runoff routing at subcatchments is conducted using the Wallingford model. The hydraulic model uses the dynamic wave model to solve the flow equations for the 1D sewer network and for the 2D overland surface. The 1D network consists of 1825 conduits and 1776 nodes. The conduits have a total length of 98.1 km, an average slope of 1% and most of pipes are made of concrete with circular cross sections, with diameters ranging from 100 to 1950 mm. Typical roughness coefficients were adopted for each material type. The nodes are divided in 1760 manholes, 13 storage units and three outfalls. The 2D model of the overland surface is based on an irregular mesh with 292,944 elements with areas up to 100 m
2 (average area of 25 m
2). The model was verified in 2011 using rainfall and water level data from a local monitoring system operated by the authors of the paper since 2010 [
22,
23].
5. Stochastic Flood Hazard Mapping
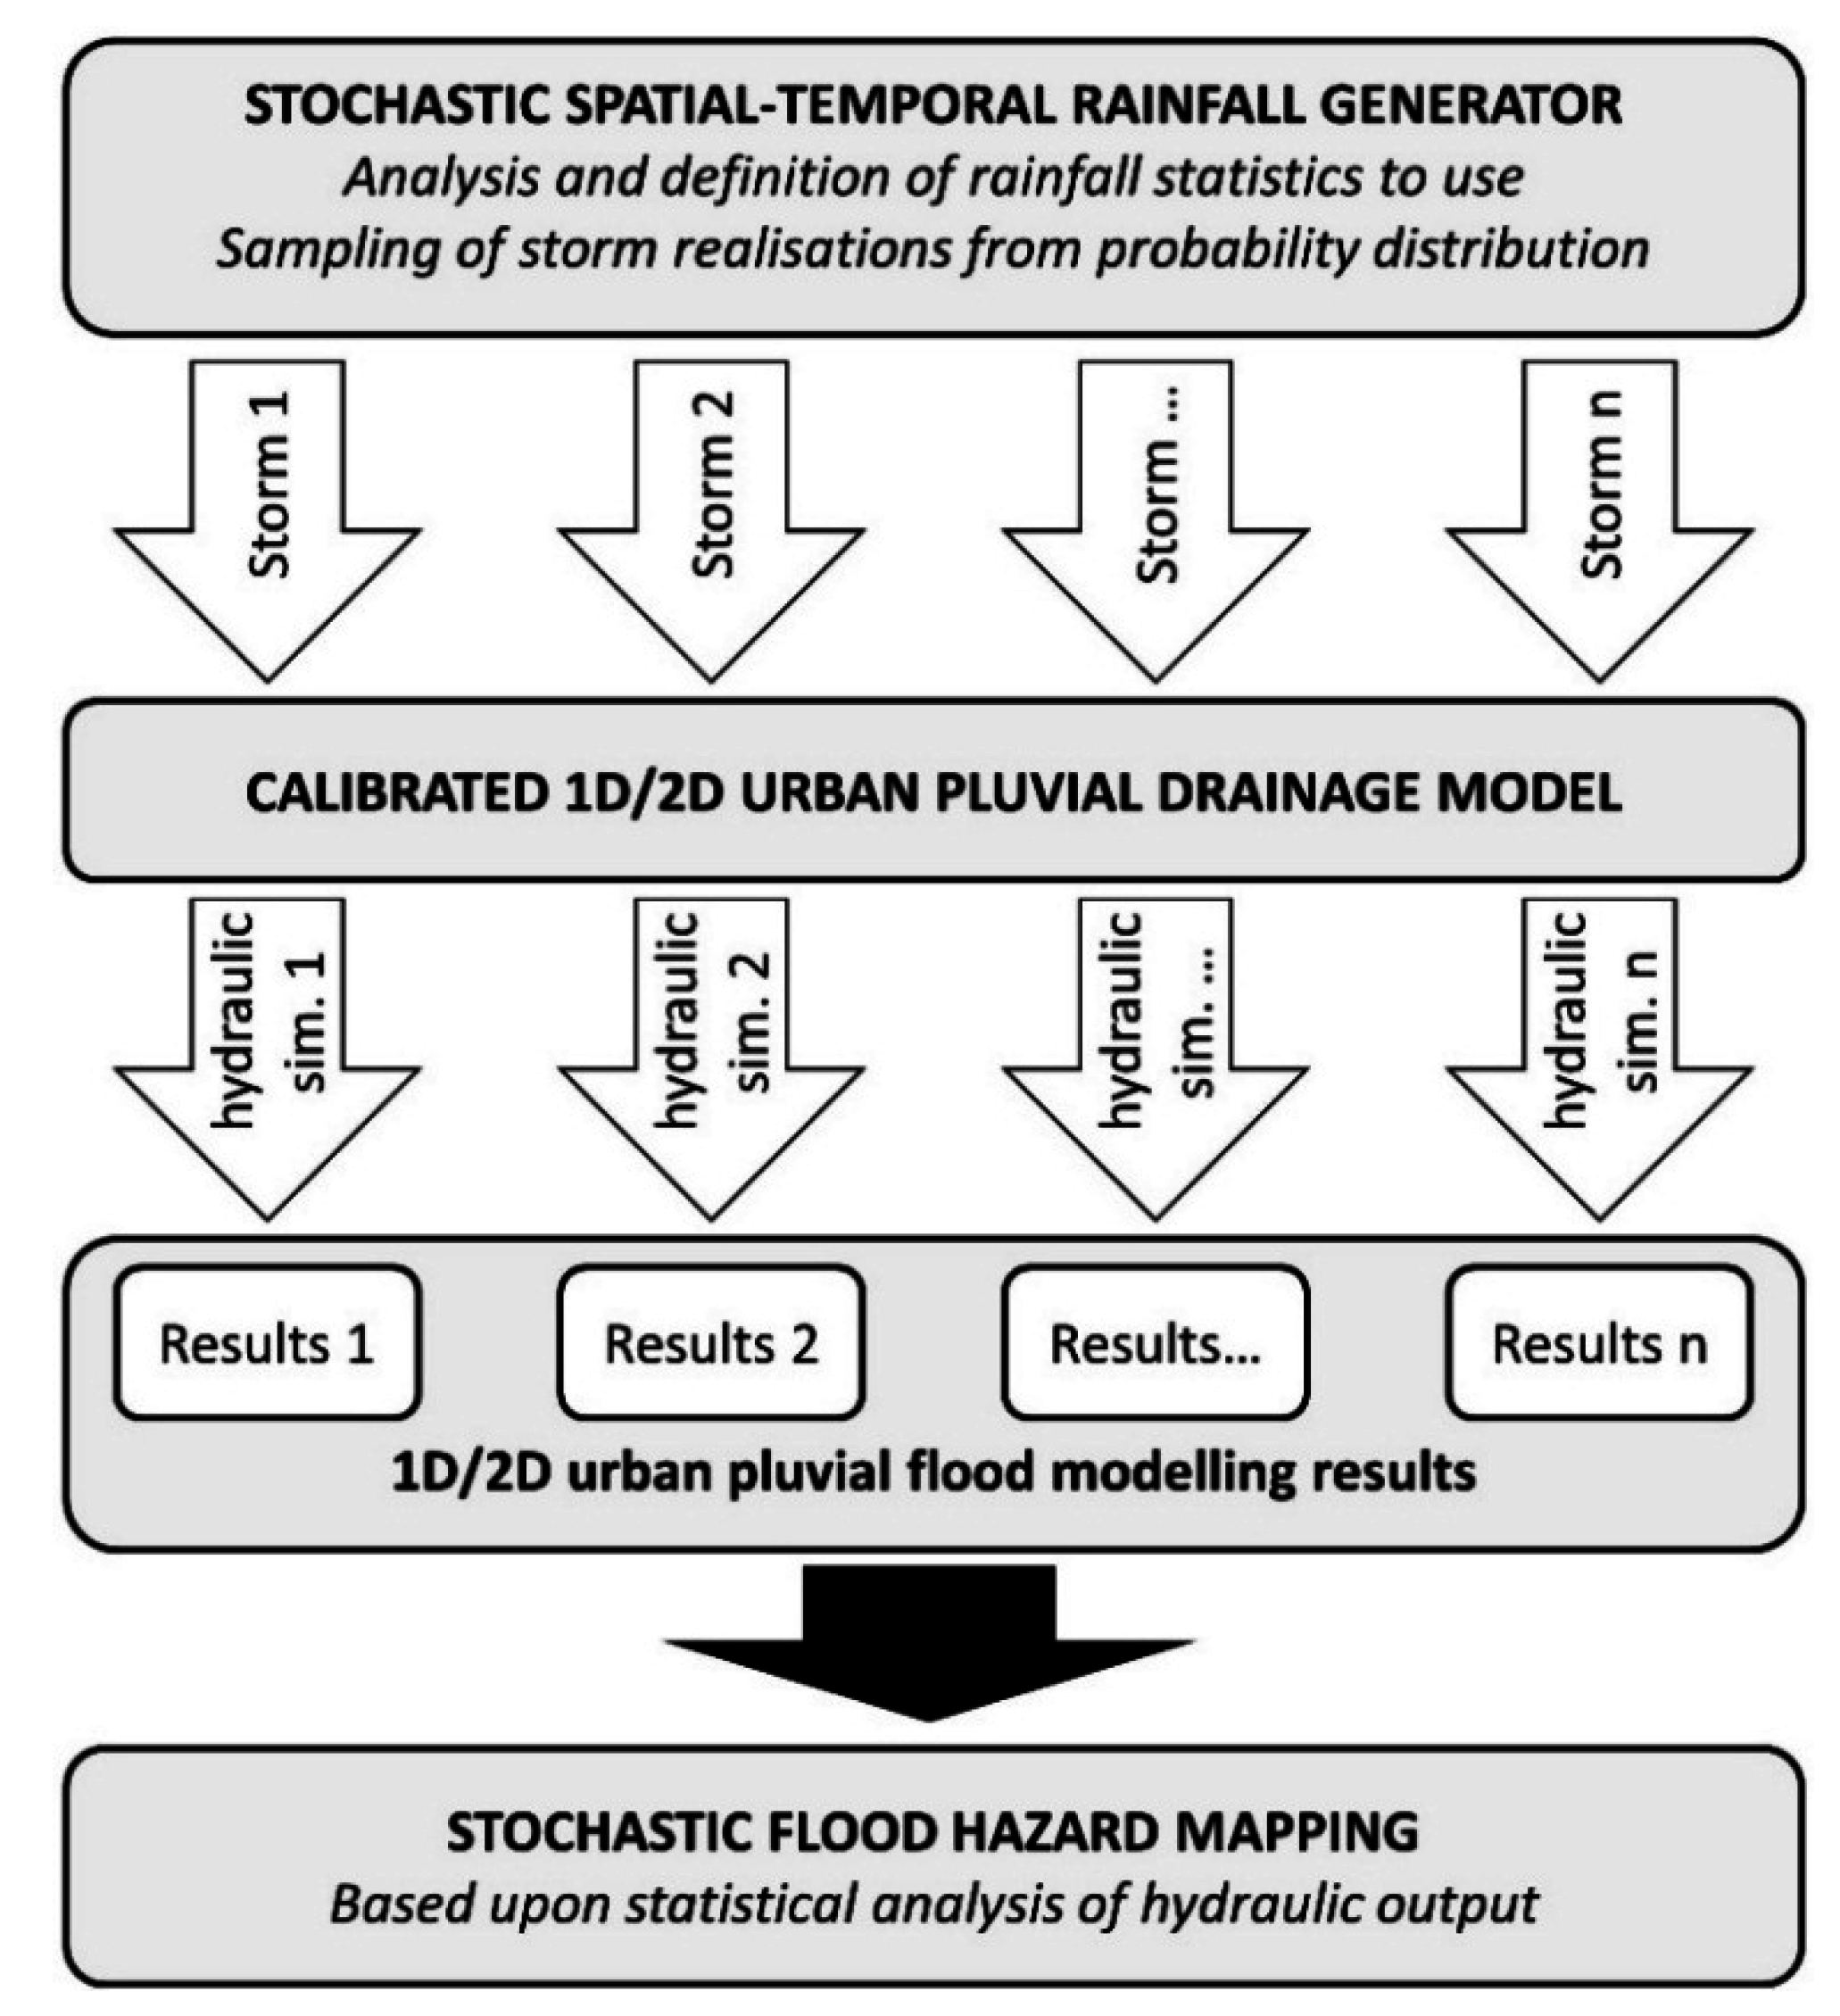
In the proposed methodology, the spatially and temporally varying rainfall events sampled from the rainfall generator are fed into the urban pluvial flood model of the area under consideration. The resulting hydraulic outputs are statistically analysed to estimate the likelihood of a given location being flooded (
i.e., probabilistic flood hazard) (
Figure 4).
Figure 4.
General approach for generation of stochastic urban pluvial flood hazard maps based upon a stochastic spatial temporal rainfall generator.
Figure 4.
General approach for generation of stochastic urban pluvial flood hazard maps based upon a stochastic spatial temporal rainfall generator.
To demonstrate the proposed approach, a total of 45 hydraulic simulations were carried out, each using a storm event generated with the rainfall generator. Moreover, for the sake of comparison, a spatially-uniform storm (see description in
Section 3) was also used as input for hydraulic simulation. Apart from the different rainfall inputs, no other changes were made to the hydraulic model in each of the simulations.
The hydraulic results were filtered out based upon a water depth threshold; in this case, only surface elements with water depth greater than 0.1 m were considered as flooded locations.
Taking into account the results of the 45 hydraulic simulations, the least and most extreme rainfall events correspond to storms (rainfall realisations) number 7 and 27, respectively.
Table 2 presents maximum, minimum and average flooded area values for the 45 storm realisations, as well as flooded area values for the single spatially-uniform storm event.
As can be seen from
Table 2, there is a large variation in flood extent for the different storm events under consideration (notice difference between maximum and minimum flood extent values). This variation is due to different rainfall characteristics, including variable spatial and temporal distribution of storm cells. The flood extent of the uniform rainfall event is close to the minimum flood extent area obtained for the stochastic storm events; this can be explained by the smoothing of rainfall peaks caused by spatial averaging of rainfall rate values.
Table 2.
Statistics of flood extents associated to the storm events under consideration.
Table 2.
Statistics of flood extents associated to the storm events under consideration.
| Flood Extent (m2) | Uniform Rainfall |
|---|
| Stochastic Realisations (45 Storm Events) |
|---|
| Minimum | Maximum | Average |
|---|
| 53,464 | 1,088,000 | 381,072 | 77,187 |
Figure 5a shows the maximum flood extent, corresponding to stochastic storm event number 27. In
Figure 5b details of flood extents for three storm events are provided, including the maximum and minimum flood extents associated to the stochastic storm realisations, as well as the flood extent associated to the spatially-uniform storm. As can be seen in
Figure 5b, the uniform rainfall event and storm 7 cause flooding in a significantly smaller area when compared with that flooded by Storm 27. The least extreme event (Storm 7) caused a flood that, in this area, is similar to that caused by the uniform average rainfall event,
Figure 5b (middle and bottom).
The ultimate goal of the stochastic analysis presented in this paper is to generate stochastic flood maps,
i.e., to represent the catchment locations where flood is more likely to occur. This is achieved by calculating the number of times a given area is flooded (an area is the polygon of the surface mesh used in the 2D overland flow modelling). The results of this analysis are presented in
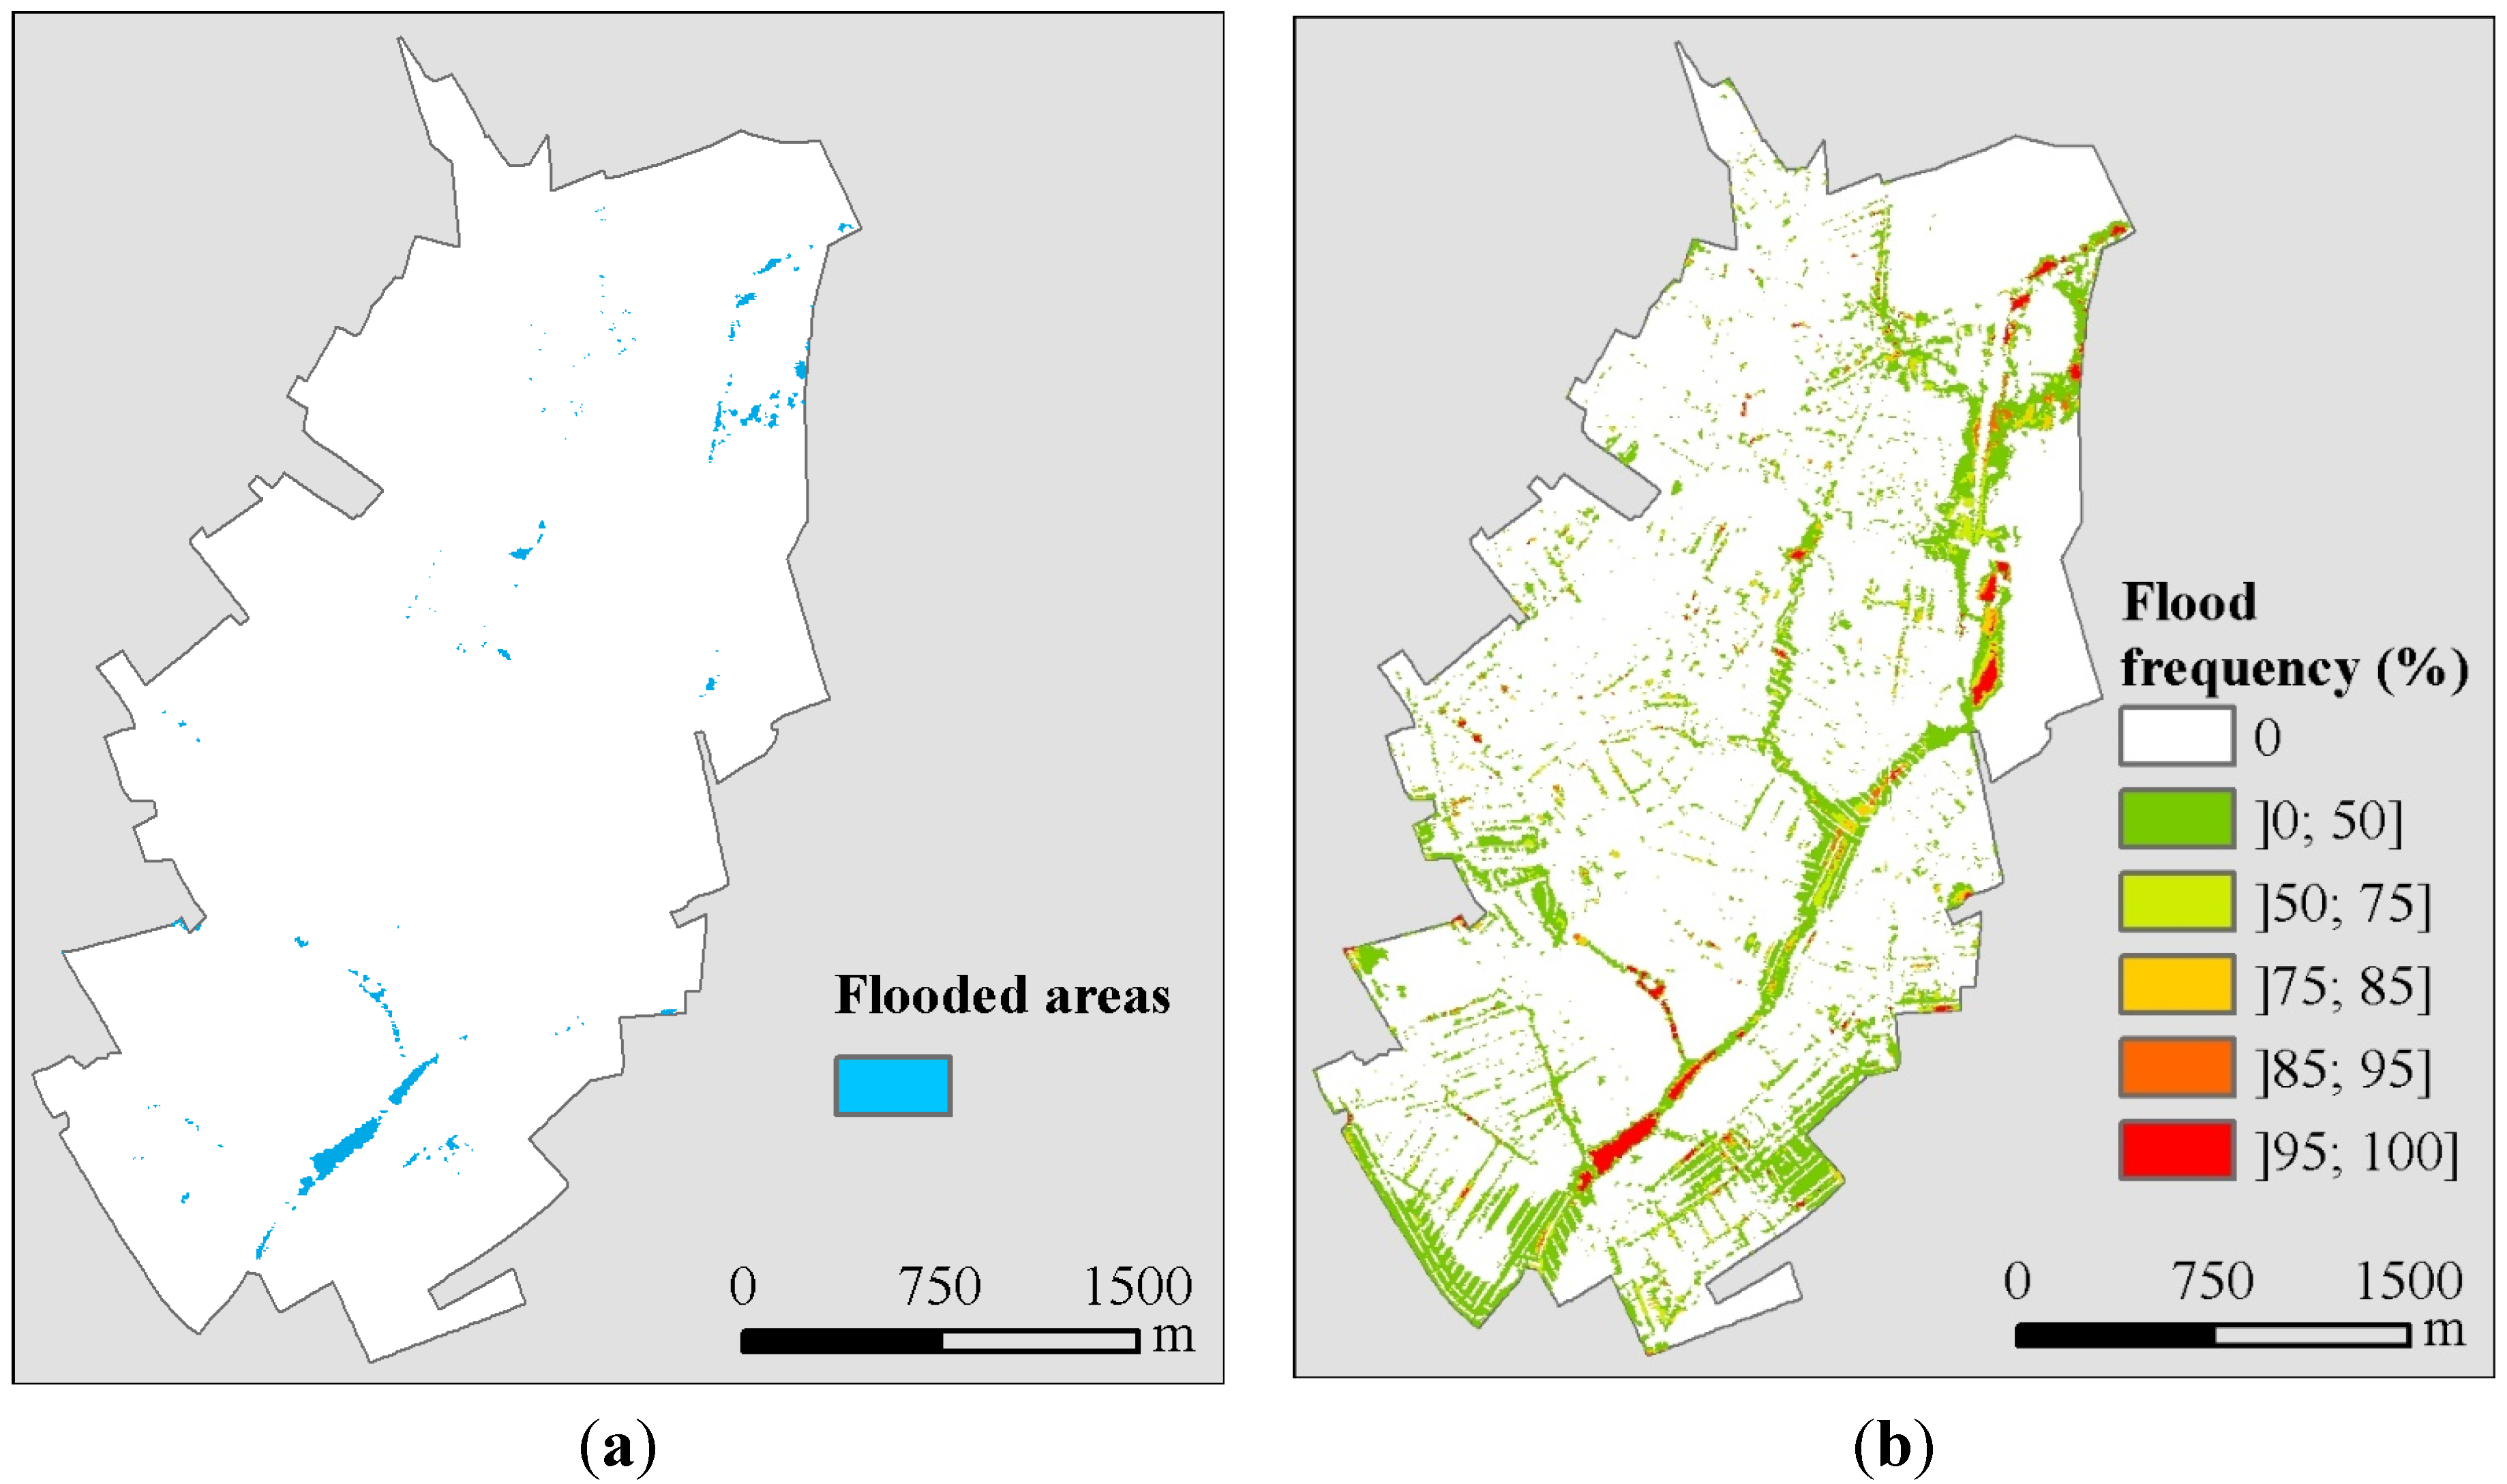
Figure 6. This figure shows that some locations got flooded with every rainfall event considered in this study. In contrast, other locations were flooded only a few times. With regards to the flood extent associated to the uniform rainfall event, it can be seen that it generally matches with the high flood frequency areas identified from the stochastic analysis. However, it fails to identify other areas which may only flood under more localised storm conditions and which should be considered by flood risk managers. This highlights the importance of taking the spatial and temporal variability of the rainfall event into account when assessing urban pluvial flood hazard. Rainfall inputs, including design storms, encompass large uncertainties which hinder decision making. The stochastic approach proposed herein constitutes an alternative for dealing with these uncertainties and allows a more comprehensive assessment of flood hazard in a given area. This can help decision makers in the implementation of actions in areas where flooding is more likely to occur, thus reducing flood risk in those areas.
Figure 5.
Simulated flood extent for three storm event realisations: storm event 27, which led to the maximum flood extent; storm event 7, which led to the minimum flood extent, and spatially-uniform storm event used for comparison. (a) Maximum flood extent (Storm 27); (b) detail of flood extents for three storm events (Storm 27, uniform rainfall and Storm 7, from top to bottom).
Figure 6.
Modelled flood maps based on average uniform rainfall and on spatial-temporal stochastic rainfall. (a) Uniform rainfall flood map; (b) stochastic flood map.
Figure 6.
Modelled flood maps based on average uniform rainfall and on spatial-temporal stochastic rainfall. (a) Uniform rainfall flood map; (b) stochastic flood map.
6. Conclusions and Outlook
Traditionally, the return period of a flood event is associated to that of the storm event. This is however insufficient because different rainfall events with the same return period can generate flooding of different magnitudes (water depth and flood extent) and thus of different return periods. A new methodology to generate urban pluvial flood hazard maps stochastically has been presented in this paper. First, a stochastic rainfall generator for urban-scale applications was employed to generate design storms with spatial and temporal variation. Each design storm was applied to a 1D/2D drainage hydraulic model to generate flood maps. Flood hazard maps were produced based upon all the resulting hydraulic outputs (i.e., water depth and flood extent).
The use of a stochastic spatial-temporal rainfall generator has enabled the generation of relatively realistic storms that vary in space and time. In turn, this has enabled a stochastic assessment of pluvial flood hazard in an urban catchment. The resulting probabilistic flood hazard map shows that some locations got flooded in almost all of the events under considerations, whereas other locations were only flooded a few times. This highlights the important role that rainfall spatial-temporal variability plays in the catchment response and the need to consider it when evaluating flood risk. Moreover, the probabilistic map provides a more comprehensive assessment of flood hazard, as compared to the flood hazard maps obtained by using single spatially-uniform design storms. Thus, the probabilistic flood hazard maps can enable better informed decisions which can result in improved flood risk management.
The proposed methodology leads to a significantly different mind-set from the current definition of design storms, where the spatial distribution is assumed to be uniform. Furthermore, this new concept creates an open question about the use of the return period to characterise spatial and temporal variable storms; this is worth further investigating. It is worth mentioning that the framework presented in this paper can be applied in other areas and with different rainfall generators and hydraulic models.
The authors suggest that future studies should involve a larger number of rainfall realisations, with the respective hydraulic simulations being conducted. Aside from the flood depth and extent, other parameters may also be included, such as velocity and velocity/water depth ratio.
The methodology presented in this paper is being further developed to generate stochastic flood risk maps, which incorporate potential consequences.
Acknowledgments
The authors would like to thank Innovyze for providing the InfoWorks software. The second and third authors would like to acknowledge the support of the European Union’s Interreg IVB NWE Programme to the RainGain project. The third author would like to acknowledge the support of the the Research Foundation–Flanders (FWO) and the PLURISK project for the Belgian Science Policy Office. The fourth author acknowledges the financial support from the Fundação para a Ciência e Tecnologia—Ministério para a Ciência, Tecnologia e Ensino Superior, Portugal [SFRH/BD/88532/2012]. The authors also thank Thames Water and MWH (Global) for providing historical radar data.
Author Contributions
Nuno Eduardo Simões, João Paulo Leitão, Susana Ochoa, Lipen Wang and Alfeu Sá Marques had the original idea for the study. Lipen Wang and Christian Onof generated and analysed rainfall data. Nuno Eduardo Simões, Susana, João Paulo Leitão and Rui Pina build the hydraulic model and processed the hydraulic results. All authors analysed and discussed the results. The paper was written with contribution from all authors. All authors read and approved the final manuscript.
Conflicts of Interest
The authors declare no conflict of interest.
References
- Overview of Climate Change Effects Which May Impact the Urban Water Cycle. Available online: http://www.prepared-fp7.eu/viewer/file.aspx?FileInfoID=439 (accessed on 24 June 2015).
- European Parliament & Council. Directive 2007/60/EC of the European Parliament and of the Council of 23 October 2007 on the assessment and management of flood risks. Off. J. Eur. Union 2007, 2007, 27–34. [Google Scholar]
- Aronica, G.; Cannarozzo, M. Studying the hydrological response of urban catchments using a semi-distributed linear non-linear model. J. Hydrol. 2000, 238, 35–43. [Google Scholar] [CrossRef]
- Berne, A.; Delrieu, G.; Creutin, J.-D.; Obled, C. Temporal and spatial resolution of rainfall measurements required for urban hydrology. J. Hydrol. 2004, 299, 166–179. [Google Scholar] [CrossRef]
- Gires, A.; Giangola-Murzyn, A.; Abbes, J.-B.; Tchiguirinskaia, I.; Schertzer, D.; Lovejoy, S. Impacts of small scale rainfall variability in urban areas: A case study with 1D and 1D/2D hydrological models in a multifractal framework. Urban Water J. 2014, 2014. [Google Scholar] [CrossRef]
- Gires, A.; Onof, C.; Maksimovic, C.; Schertzer, D.; Tchiguirinskaia, I.; Simoes, N. Quantifying the impact of small scale unmeasured rainfall variability on urban runoff through multifractal downscaling: A case study. J. Hydrol. 2012, 442–443, 117–128. [Google Scholar] [CrossRef]
- Leitão, J.P.; Djordjević, S.; Prodanović, D.; Maksimović, Č. Spatially distributed rainfall for surface runoff calculations in urban catchments. In Proceedings of the 8th International Workshop on Precipitation in Urban Areas, St. Moritz, Switzerland, 10–13 December 2009.
- Schellart, A.N.A.; Shepherd, W.J.; Saul, A.J. Influence of rainfall estimation error and spatial variability on sewer flow prediction at a small urban scale. Adv. Water Resour. 2012, 45, 65–75. [Google Scholar] [CrossRef]
- Segond, M.L.; Neokleous, N.; Makropoulos, C.; Onof, C.; Maksimović, Č. Simulation and spatio-temporal disaggregation of multi-site rainfall data for urban drainage applications. Hydrol. Sci. J. 2007, 52, 917–935. [Google Scholar] [CrossRef]
- Ochoa-Rodriguez, S.; Wang, L.-P.; Gires, A.; Pina, R.D.; Reinoso-Rondinel, R.; Bruni, G.; Ichiba, A.; Gaitan, S.; Cristiano, E.; Assel, J.V.; et al. Impact of Spatial and Temporal Resolution of Rainfall Inputs on Urban Hydrodynamic Modelling Outputs: A Multi-Catchment Investigation. J. Hydrol. in press. [CrossRef]
- Hammond, M.J.; Chen, A.S.; Djordjević, S.; Butler, D.; Mark, O. Urban flood impact assessment: A state-of-the-art review. Urban Water J. 2013, 12, 14–29. [Google Scholar] [CrossRef]
- Gilles, D.; Young, N.; Schroeder, H.; Piotrowski, J.; Chang, Y.-J. Inundation Mapping Initiatives of the Iowa Flood Center: Statewide Coverage and Detailed Urban Flooding Analysis. Water 2012, 4, 85–106. [Google Scholar] [CrossRef]
- Olsen, A.S.; Zhou, Q.; Linde, J.J.; Arnbjerg-Nielsen, K. Comparing Methods of Calculating Expected Annual Damage in Urban Pluvial Flood Risk Assessments. Water 2015, 7, 255–270. [Google Scholar] [CrossRef] [Green Version]
- Bowering, E.A.; Peck, A.M.; Simonovic, S.P. A flood risk assessment to municipal infrastructure due to changing climate part I: Methodology. Urban Water J. 2014, 11, 20–30. [Google Scholar] [CrossRef]
- Leitão, J.P.; do Céu Almeida, M.; Simões, N.E.; Martins, A. Methodology for qualitative urban flooding risk assessment. Water Sci. Technol. 2013, 68, 829–838. [Google Scholar] [CrossRef] [PubMed]
- Nascimento, N.; Machado, M.L.; Baptista, M.; de Paula E Silva, A. The assessment of damage caused by floods in the Brazilian context. Urban Water J. 2007, 4, 195–210. [Google Scholar] [CrossRef]
- Ahmad, S.S.; Simonovic, S.P. Spatial and temporal analysis of urban flood risk assessment. Urban Water J. 2013, 10, 26–49. [Google Scholar] [CrossRef]
- Sun, S.; Djordjević, S.; Khu, S.-T. A general framework for flood risk-based storm sewer network design. Urban Water J. 2011, 8, 13–27. [Google Scholar] [CrossRef]
- Nuswantoro, R.; Diermanse, F.; Molkenthin, F. Probabilistic flood hazard maps for Jakarta derived from a stochastic rain-storm generator. J. Flood Risk Manag. 2014, 2014. [Google Scholar] [CrossRef]
- McRobie, F.H.; Wang, L.-P.; Onof, C.; Kenney, S. A spatial-temporal rainfall generator for urban drainage design. Water Sci. Technol. 2013, 68, 240–249. [Google Scholar] [CrossRef] [PubMed]
- Willems, P. A spatial rainfall generator for small spatial scales. J. Hydrol. 2001, 252, 126–144. [Google Scholar] [CrossRef]
- Simoes, N.E. Urban Pluvial Flood Forecasting. Ph.D. Thesis, Imperial College London, London, UK, 2012. [Google Scholar]
- Wang, L.-P.; Ochoa-Rodríguez, S.; Simões, N.E.; Onof, C.; Maksimović, Č. Radar-Raingauge data combination techniques: A revision and analysis of their suitability for urban hydrology. Water Sci. Technol. 2013, 68. [Google Scholar] [CrossRef] [PubMed]
© 2015 by the authors; licensee MDPI, Basel, Switzerland. This article is an open access article distributed under the terms and conditions of the Creative Commons Attribution license (http://creativecommons.org/licenses/by/4.0/).


 ,
, 


