1. Introduction
Numerous studies have shown that climate change significantly affects the hydrologic cycle and alters runoff regimes and water availability in different regions across the Globe [
1,
2,
3,
4,
5]. In its fifth assessment report [
6], the Intergovernmental Panel on Climate Change (IPCC) affirms that human development activities have caused large increases in greenhouse gases concentration in the atmosphere since 1850, mostly from burning fossil fuels and deforestation. These elevated concentrations cause temperature to rise on a global scale. The global increases in temperature appear to directly and significantly alter the hydrologic cycle through changing evapotranspiration (ET) and accumulation and melting of snow and ice [
6]. In addition, climate change, as indicated by changes of atmospheric circulation, also significantly modifies precipitation patterns, intensities, and amounts at global scales [
7,
8]. It could consequently disturb the balance of temporal and spatial distribution of water resources and cause large scale floods or long-term droughts. At the regional scale, climate change causes changes in discharge of rivers and streams that potentially reduce or increase the needed water availability for human activities [
9,
10].
Future climate changes associated with specific emission scenarios can be projected using Global Climate Models (GCMs). GCMs’ output data can be used regionally, after disaggregation, to force hydrological models to simulate projected runoff and river discharge. An approach that is broadly used in many previous studies is to generate a baseline simulation based on observed meteorological data in the past and use the baseline meteorological data to force a hydrologic model to generate baseline hydrologic conditions [
3,
4,
8,
11,
12,
13,
14]. The evaluation of future changes in river discharge is based on the comparison of projected results with the baseline and their differences. This method may eliminate or substantially reduce the internal bias or error of the models. A study by Wu
et al. [
14] indicated that projected climate change will have great impacts on snow dominant streams, leading to lower summer streamflows and warmer summer stream temperature with smaller effects on transient and rain dominant regimes in the northwestern region of the United States. Hamlet [
15] studied the projected impacts of climate change on seasonal rainfall in the Pacific Northwest region of North America and performed hydrologic simulations to support water resources management, flood control, hydropower development and other water related environmental services in the region. Thodsen [
16] combined climate model generated precipitation and potential evapotranspiration and a hydrologic model to study the impact of climate change on six major Danish catchments and reported potential future increases in the 100-year and 1000-year precipitation leading to increases in discharge that are approximately twice as much.
River discharge in central Vietnam is highly fluctuating. A report of the Institute of Strategy and Policy On Natural Resources and Environment of Vietnam (ISPONRE) supported by the United Nations Environment Programme (UNEP) identified Vietnam as one of the most adversely effected countries by climate change during the last 50 years [
17]. Recent studies on future global water availability and major continental rivers’ future discharges also projected considerable increases in runoff in South East Asia region, and Vietnam in particular, in the twenty-first century [
13,
18,
19]. Such projected increases in runoff vary from 10%–20% to 40%–50% among different studies depending on which GCMs and emission scenarios were selected for simulation. Weiland
et al. [
13] and Nohara
et al. [
19] analyzed seasonal water availability in Vietnam and neighboring countries and both studies reported that peak river discharges typically occurred in the summer and fall with river discharges significantly lower in the winter and spring. In the twenty-first century, Nohara
et al. [
19] projected an increase in discharge mostly in the summer and fall for the period from 2006 to 2100 and Weiland
et al. [
13] confirmed these conclusions. However, the projection of river discharge from these studies is limited for only IPCC Special Report on Emissions Scenarios (IPCC-SRES) scenario A1B and was not based on hydrologic modeling.
The rainy season in Central Vietnam spans the summer and fall which are characterized by heavy precipitation and flood events [
20]. The region has minimal precipitation from December to April and precipitation increases significantly from May to November with high intensity and density precipitation events in July and August. Seasonal precipitation, especially in the summer and fall, has increased in the second half of the twentieth century and grown more obviously in the beginning of the twenty-first century [
21]. This most likely has increased runoff and annual discharges of rivers in the region; however, it has not been analyzed and demonstrated in any previous study.
On the other hand, flood control policy of the local governments requires quantitative evaluation of river flow changes in the past as well as in the future. In fact, water resources related policies and laws have been recently established by the government of Vietnam as well as local governments in response to water resources degradation and negative impacts of global climate change on water resources. One of the latest decisions approved by the Prime Minister of Vietnam in September, 2013 regarding the national strategy for sustainably exploitation and usage of natural resources until 2020 with the vision to 2030 states that it is necessary to practice water saving nationwide and focus on solving the water shortage problem during the dry season in the major river basins [
22]. Due to the fact that water resources are unevenly distributed both spatially and temporally, especially in central Vietnam where precipitation could range from 400 to 4000 mm/year among different places and about 70%–85% annual total water budget occur in the rainy season [
23], it is suggested that reservoirs and dams be efficiently operated to store water in the rainy months and supply in the dry months. Dam and reservoir development is also an option due to the fact that Vietnam is facing seasonal water shortage and cannot ensure water safety (at the standard of 4000 m
3/person/year) because about 63% of the national water budget comes from outside the country and might not be used for domestic supply [
23].
The Huong River basin itself had three major dam projects built on its three main tributaries: Binh Dien dam on the Bo tributary, Huong Dien dam on the Huu Trach tributary and Ta Trach dam on the Ta Trach tributary. These dams are currently playing an important role in flood control besides generating hydro-power for the area. Both Binh Dien dam and Huong Dien dam are currently operating at their maximum flood control capacities, 180 million m
3 and 400 million m
3 respectively; while Ta Trach dam is designed with about 400 million m
3 capacity for flood control purposes [
24,
25]. Flood control within the Huong River basin could be improved to reduce the damage caused by floods if flow is forecasted ahead of time. Ngo & Nguyen [
24] suggested that doubling the flood control capacities of Binh Dien and Huong Dien dam would reduce the inundation time with water level above three meters downstream of the Huong River during an extreme flood event to only three hours, instead of several days under the current capacities. In many years before 2010 when the hydroelectric dams had not been built, the Huong River’s water was under serious salinization far from the coast into mainland reaches [
26].
With all the issues mentioned above, this study aims to answer three major questions: How has river discharge in Central Vietnam changed in the past 60 years? How will seasonal total discharges vary in the 21st century because of climate change under the consideration of different IPCC-SRES scenarios? And what are the differences among projections produced by different GCMs? The study is focused on one mid-size river basin, the Huong River basin. Future climate data used in this study are based on three IPCC-SRES scenarios: A2, A1B and B1 [
27]. The choice of the GCMs that simulate the scenarios strongly affects the projected changes of meteorological parameters [
2]. In this study, three GCMs including ECHAM5-OM (Germany), HadCM3 (UK) and GFDL-CM2.1 (USA) are selected to simulate future daily meteorological data which serve as input to the hydrological model SWAT. River discharge simulations of SWAT are performed separately for each input dataset produced by a pair of GCM and IPCC-SRES. This will create nine different projections of river discharge.
3. Results and Discussion
3.1. Calibration and Validation of River Discharge Simulations
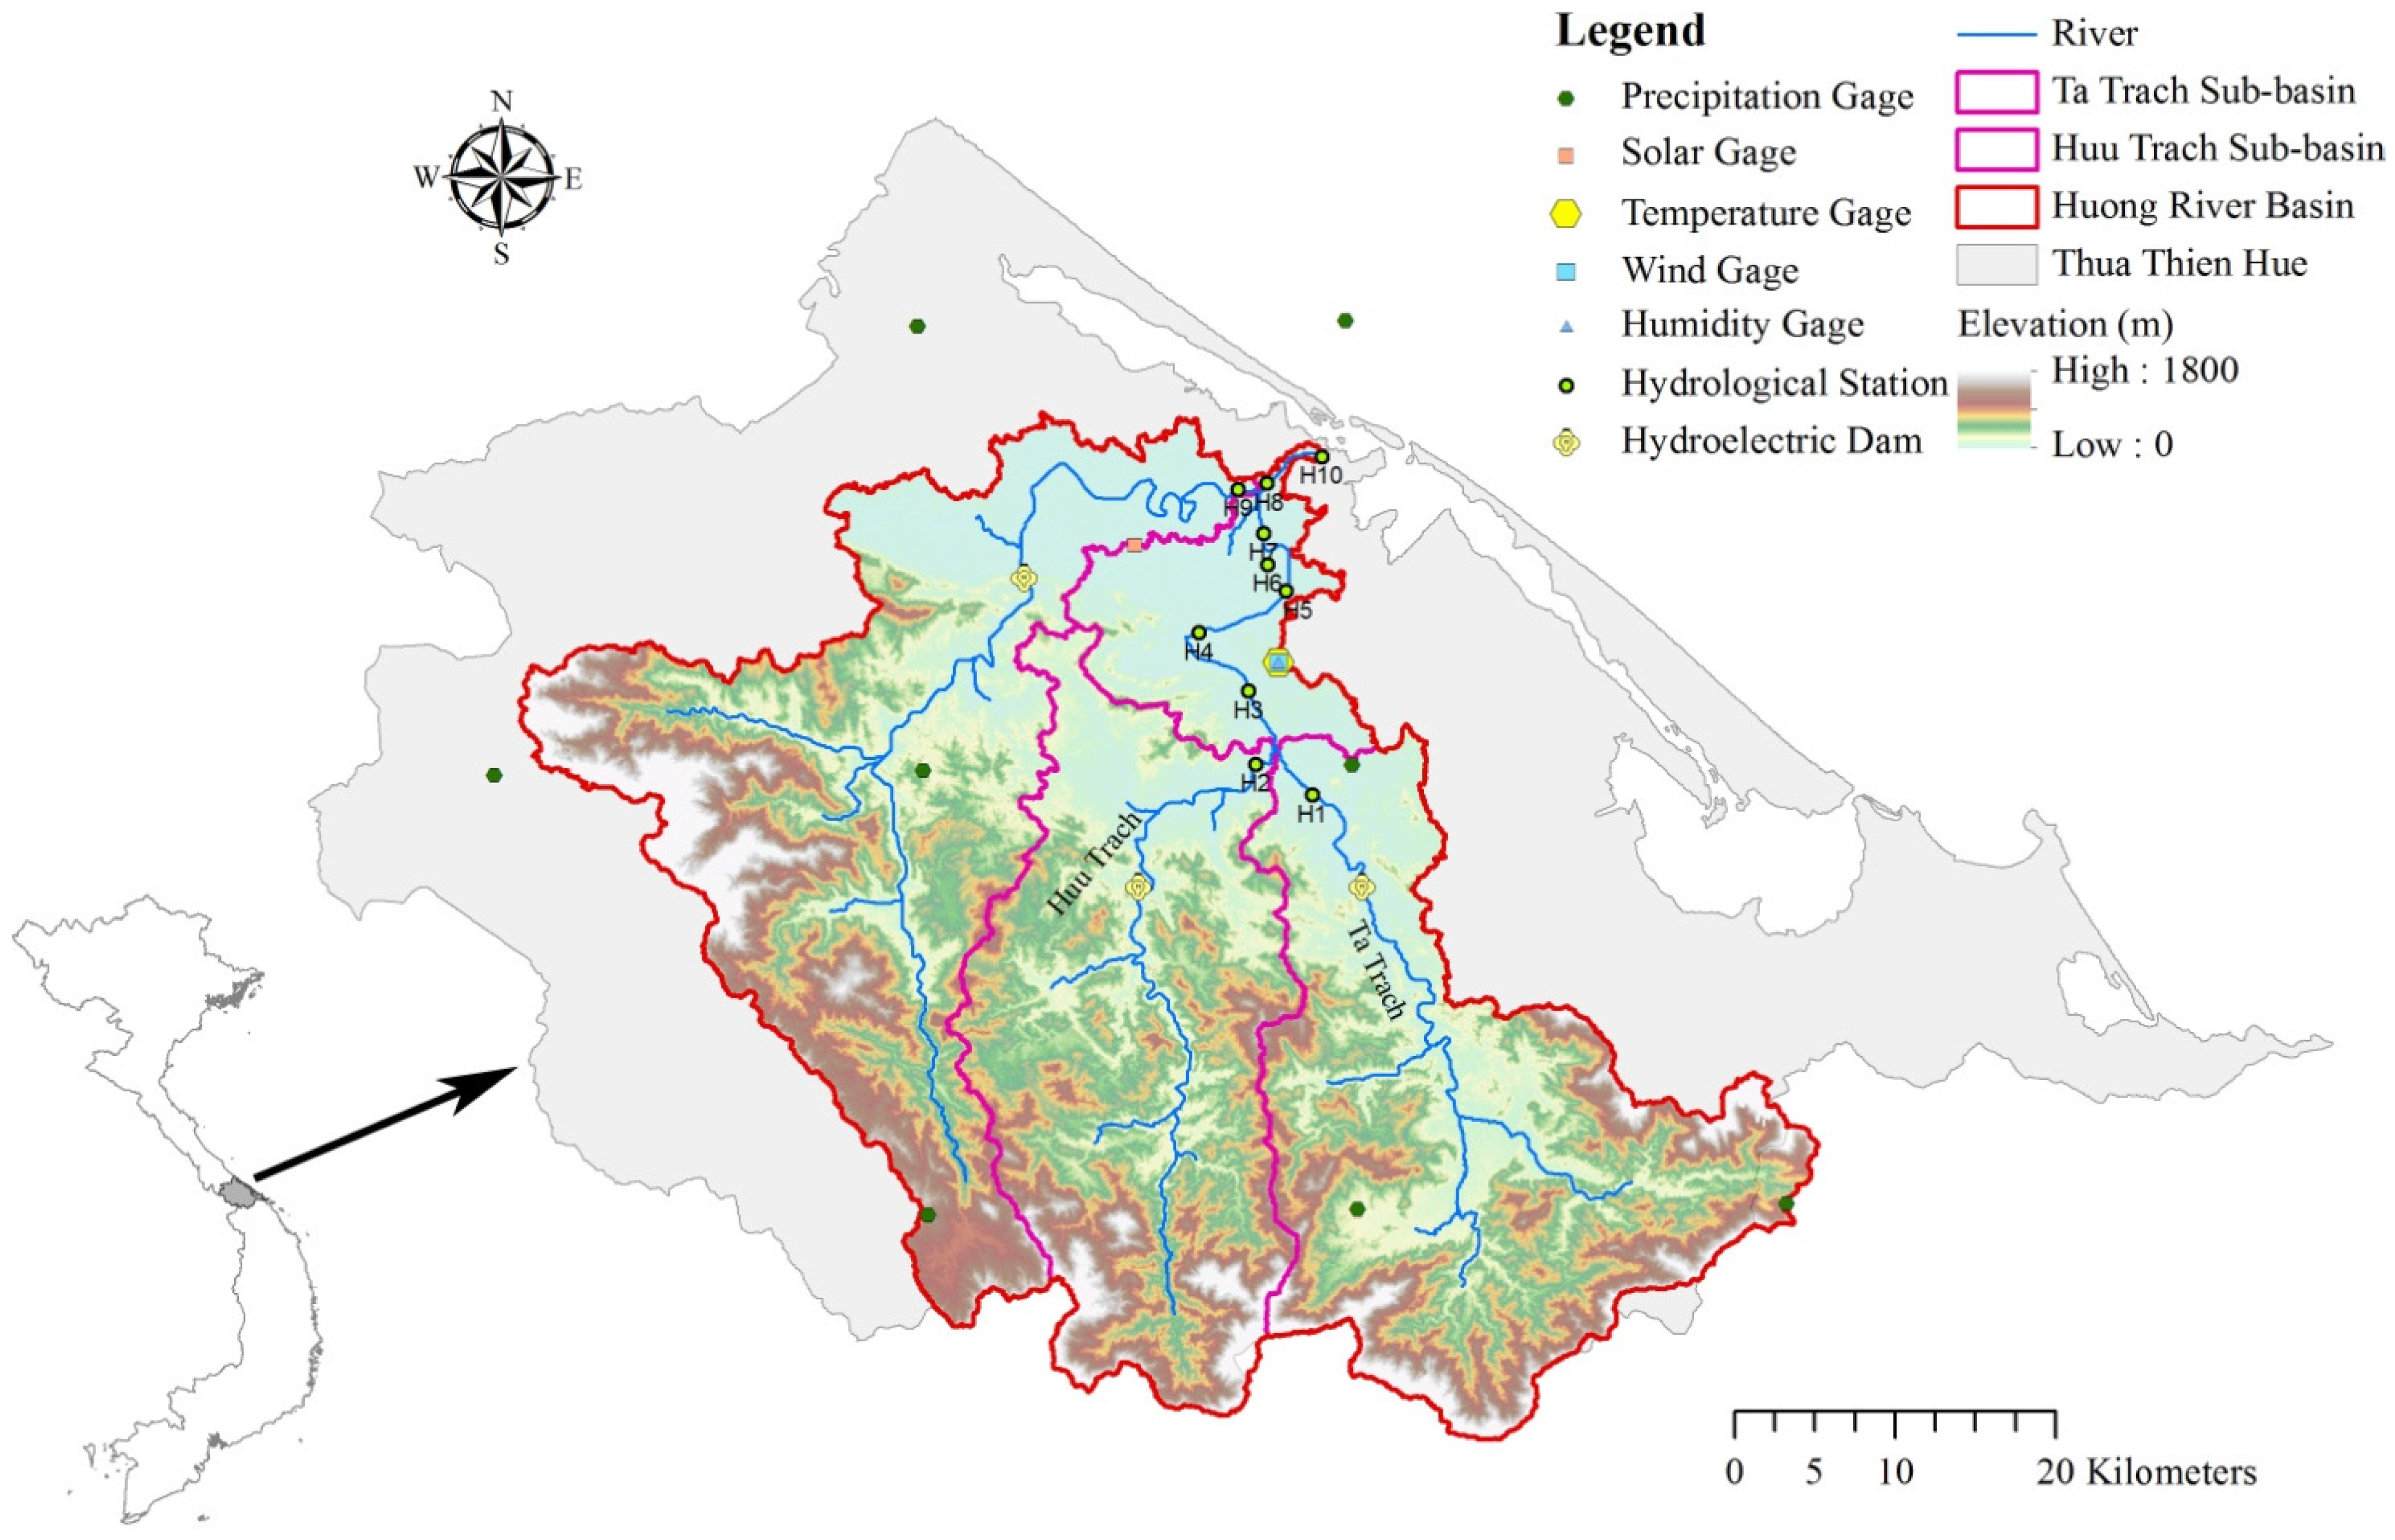
SWAT calibration was performed over the catchment of Ta Trach tributary (site H1) for the period of 2007–2010, where the hydroelectric dam has no impact. The calibrated model parameters for the Ta Trach sub-basin were used to validate the model over the Huu Trach sub-basin at site H2 and the Huong River basin at site H10 (
Figure 1). The processes for SWAT model setup, simulation, calibration and validation for this region are described in detail in Le
et al. [
28].
The ArcSWAT for ArcGIS 10 interface of SWAT 2009 is used in this study to set up the model. Calibration was performed manually with ArcSWAT by adjusting the value of one model parameter at a time to attain better agreement between simulated and observed values. Veith
et al. [
35] reported that CH_N2 (Manning’s N value for stream channels), CN2 (SCS curve number), SOL_K (soil hydraulic conductivity) and SOL_AWC (available water capacity of the soil) were the most significant SWAT model parameters that affect discharge simulation outputs. They also noted that the effects of ALPHA_BF (base flow alpha factor), ESCO (soil evaporation compensation factor) and GW_REVAP (groundwater “revap” coefficient) on model simulation could be considerable.
The model performance was evaluated through two standard performance measures: the Nash-Sutcliffe Efficiency (NSE) and the Pearson product–moment correlation coefficient (r). The NSE describes the predictive capability of the model and takes values that are smaller than or equal to one. Larger values of NSE that are closer to one indicate the model’s ability to reproduce observed data. Pearson’s r is a popular statistical measure that is used here to evaluate the degree of linear correlation between the simulated and observed variable. These measures are defined as follow:
where
and
are the observed and simulated discharge at day
t, respectively.
and
are the average observed and simulated discharge, respectively. N is the total number of observation/simulation days.
The discharge calibration process started with the adjustment of CH_N2 parameter. The NSE and r were calculated for every simulation and the value of adjusted model parameter that generated higher NSE and r than previous simulation was saved. The calibration process is continued by adjusting CN2, SOL_K, SOL_AWC, ALPHA_BF, ESCO and GW_REVAP, respectively, following the same procedure. The calibration process demonstrated that Huong River discharge was most sensitive to CH_N2 (Manning’s N value for stream channels), CN2 (SCS curve number), and SOL_K (soil hydraulic conductivity). It was moderately sensitive to SOL_AWC (available water capacity of the soil) and ALPHA_BF (base flow alpha factor) and has low sensitivity to changes in ESCO (soil evaporation compensation factor) and GW_REVAP (groundwater “revap” coefficient).
Table 1 lists the values of the calibrated model parameters for discharge simulations. The values represent the calibrated parameters of the Huong River basin such as channel roughness, and hydraulic conductivity of soils that fall within their acceptable ranges in previous SWAT studies. The SCS curve number (CN) values, which are a function of land use, soil permeability, and antecedent soil moisture range between a lowest value of 42 to a highest of 97. The lower CN values are associated with the areas where forests dominate and sandy soils while the higher CN values apply to urban areas and wetlands. The hydraulic conductivity of each soil group slightly changed from their initial values after calibration. Dystric Gleysols at wetland areas had the lowest calibrated hydraulic conductivity of 0.318 mm/h, Luvic Arenosols with mostly sand at the coastal areas had the highest calibrated hydraulic conductivity of 690.0 mm/h.
Table 1.
Model parameters used to calibrate discharge at H1.
Table 1.
Model parameters used to calibrate discharge at H1.
| Calibrated Model Parameters | Calibrated Values |
|---|
| Parameters | Definitions (Unit) |
|---|
| CH_N2 | Manning’s N value for stream channels | 0.035 |
| CN2 | SCS curve number | 42–97 |
| SOL_K | Soil hydraulic conductivity (mm/h) | 0.318–690.0 |
| SOL_AWC | Available water capacity of the soil (mm/mm) | 0.075–0.315 |
| ALPHA_BF | Base flow alpha factor (days) | 0.25 |
| GW_REVAP | Groundwater “revap” coefficient | 0.02 |
| ESCO | Soil evaporation compensation factor | 1.0 |
The calibrated discharge of the Ta Trach sub-basin (H1) for the 2007–2010 period is shown in
Figure 2. Due to the frequency of observed discharge, the comparison of simulated and observed discharge had to be performed at a daily time scale but with just one observed value for each month. The discharge hydrographs are shown in logarithmic scale because of the large differences between high and low flows (more than two orders of magnitudes). As can be seen from
Figure 2, simulated discharge follows the fluctuations of observed discharge. The base flows during the dry seasons are relatively well simulated. However, the peak flows in the rainy seasons of 2007 and 2008 are slightly underestimated while overestimated in 2009 and 2010. Comparison of simulated and observed data points results in a Nash-Sutcliffe efficiency of 0.88 and a Pearson correlation coefficient of 0.94 (
Table 2). In fact, errors in rainfall input and discharge measurement affect discharge simulation and calibration. APHRODITE rainfall products suffer from its very coarse resolution and cannot adequately capture the spatial and temporal distributions of extreme rainfall events. Discharge measurements were performed manually from a boat and have high potential of errors and bias. Nonetheless, the results are satisfactory based on model evaluation guidelines as well as compared to published SWAT simulations of daily discharge [
36,
37,
38]. The calibration results were also improved compared to the previous study Le
et al. [
28] despite the same model parameters being used during calibration. This improvement is caused by the usage of input precipitation products. The higher accuracy of precipitation estimates brought by rain gage-based APHRODITE products than satellite-based TRMM products [
39] used in Le
et al. [
28] contributed to better Nash-Sutcliffe efficiency and Pearson correlation coefficient of discharge calibration.
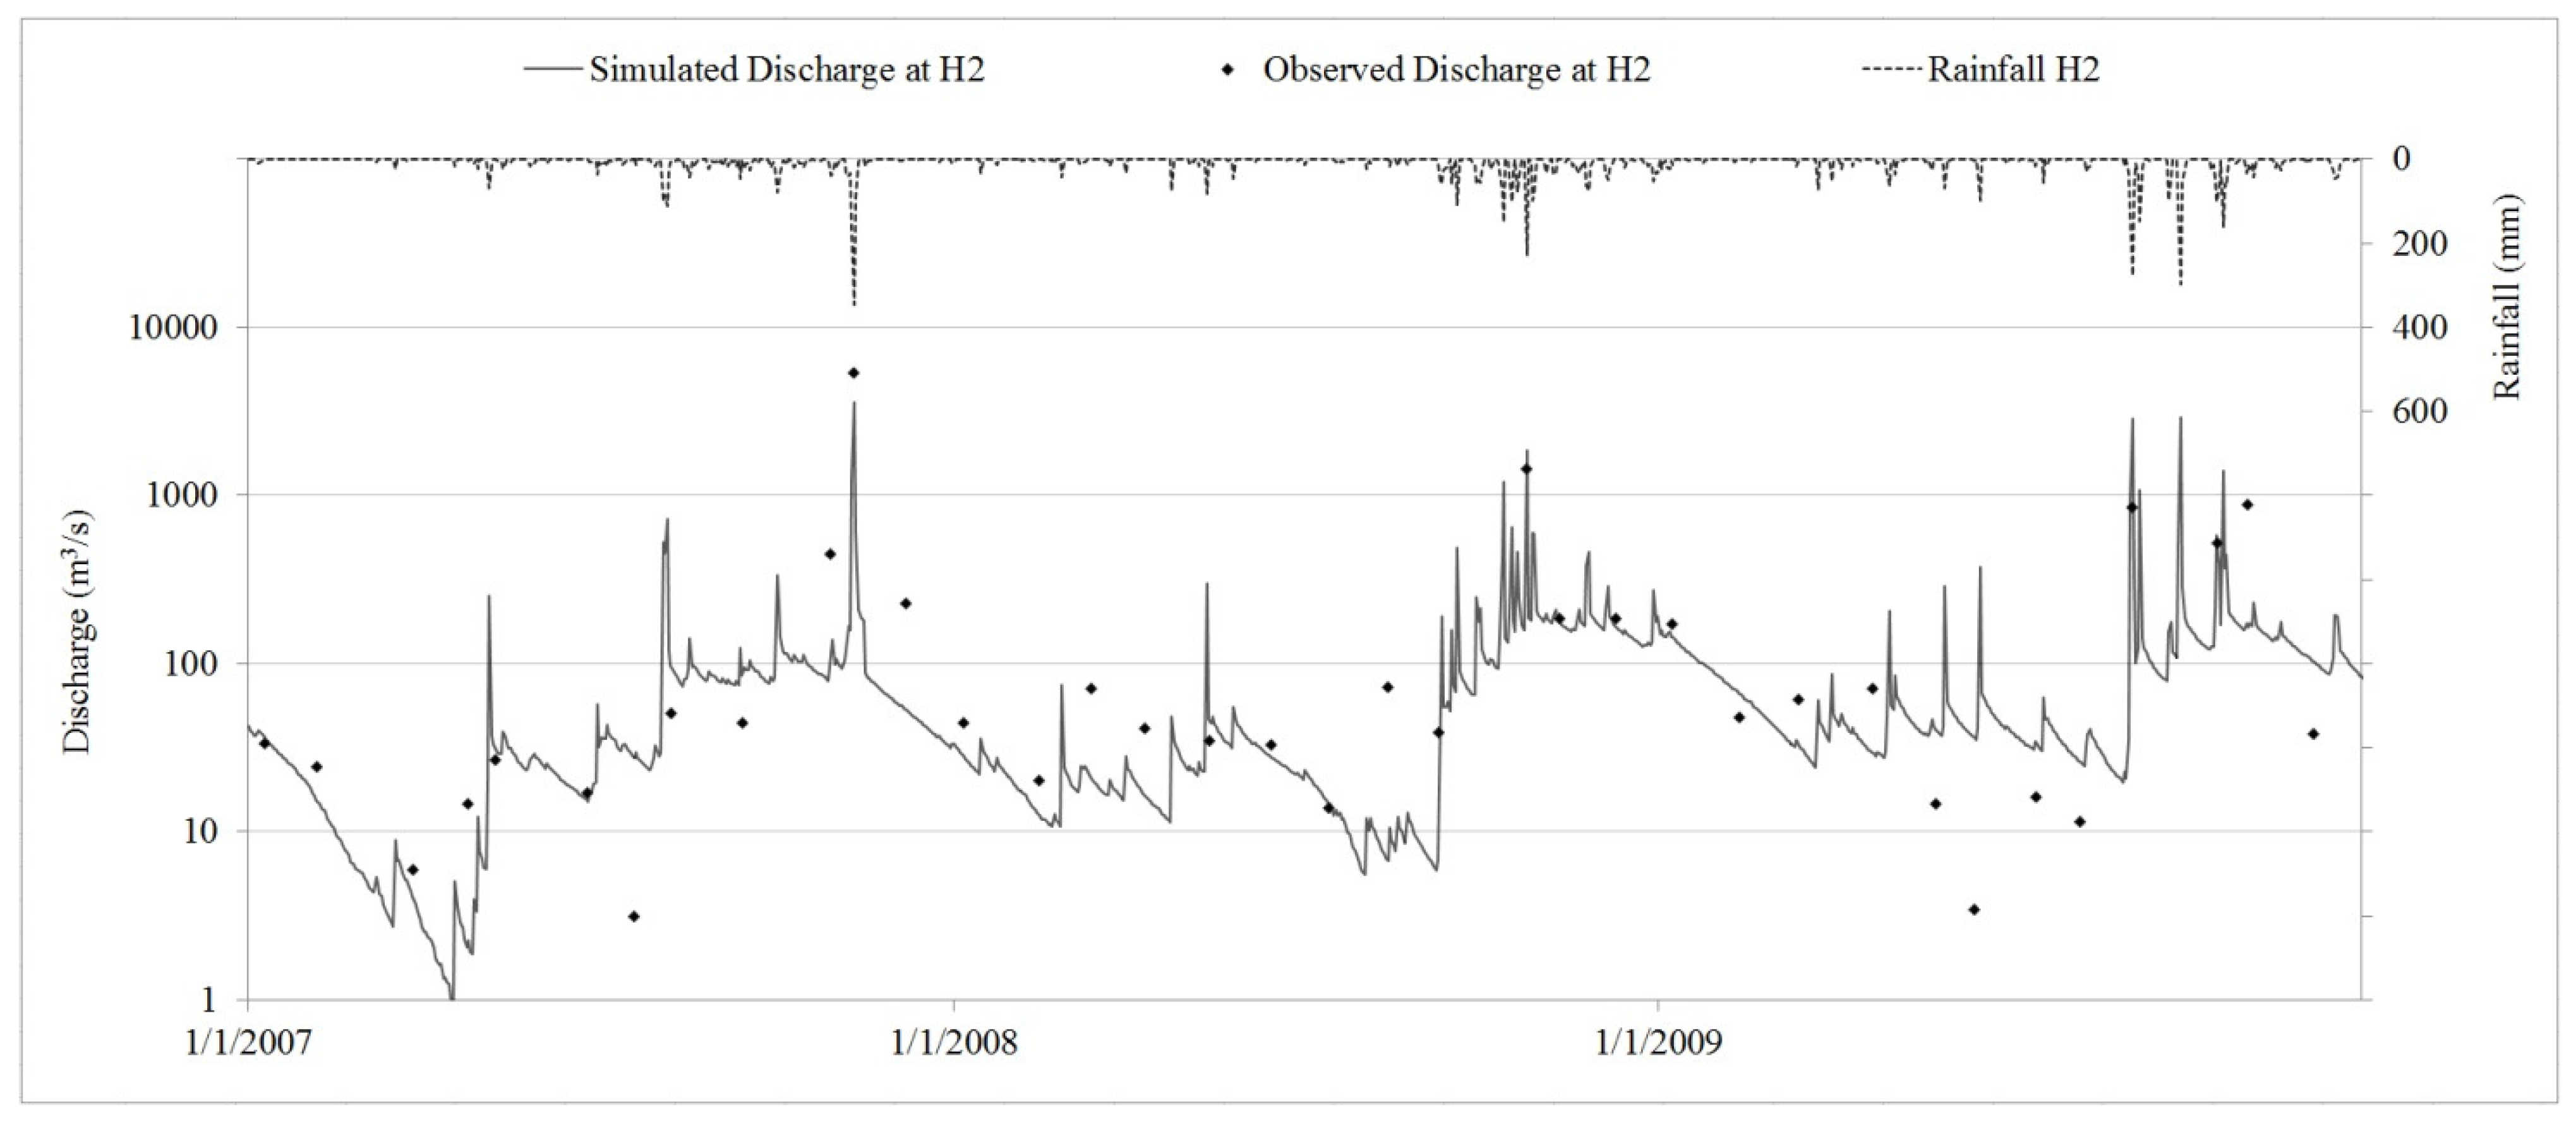
SWAT was validated over the Huu Trach sub-basin (H2) and the Huong River basin (H10). Discharge simulation at H2 (
Figure 3) during the rainy season of 2007 has the same problem of underestimation observed at H1. Examining the APHRODITE precipitation for this period shows that it agrees with the simulated discharge pattern and does not match discharge observations. This indicates that the apparent underestimation is most probably a result of errors in either precipitation estimates or observed flow and is not caused by SWAT model errors. In general, observed discharges of the Huu Trach sub-basin (H2) and Huong River (H10) basin are reasonably estimated by SWAT. The fluctuations of simulated discharge match observed ones except for the deviation in 2007 rainy season at H2 (
Figure 3 and
Figure 4). Simulated and observed discharge comparisons at H2 and H10 from January 2007 to December 2009 have Nash-Sutcliffe efficiencies of 0.72 and 0.73 and Pearson correlation coefficients of 0.85 and 0.91, respectively (
Table 2).
Figure 2.
Discharge calibration at H1.
Figure 2.
Discharge calibration at H1.
Table 2.
Performance evaluation statistics of discharge simulation.
Table 2.
Performance evaluation statistics of discharge simulation.
| Station | Discharge Simulation |
|---|
| NSE (≤1) | r (0–1) |
|---|
| H1 (Calibration) | 0.88 | 0.94 |
| H2 (Validation) | 0.72 | 0.85 |
| H10 (Validation) | 0.73 | 0.91 |
Figure 3.
Discharge validation at H2.
Figure 3.
Discharge validation at H2.
Figure 4.
Discharge validation at H10.
Figure 4.
Discharge validation at H10.
3.2. Historical and Future Climate Data
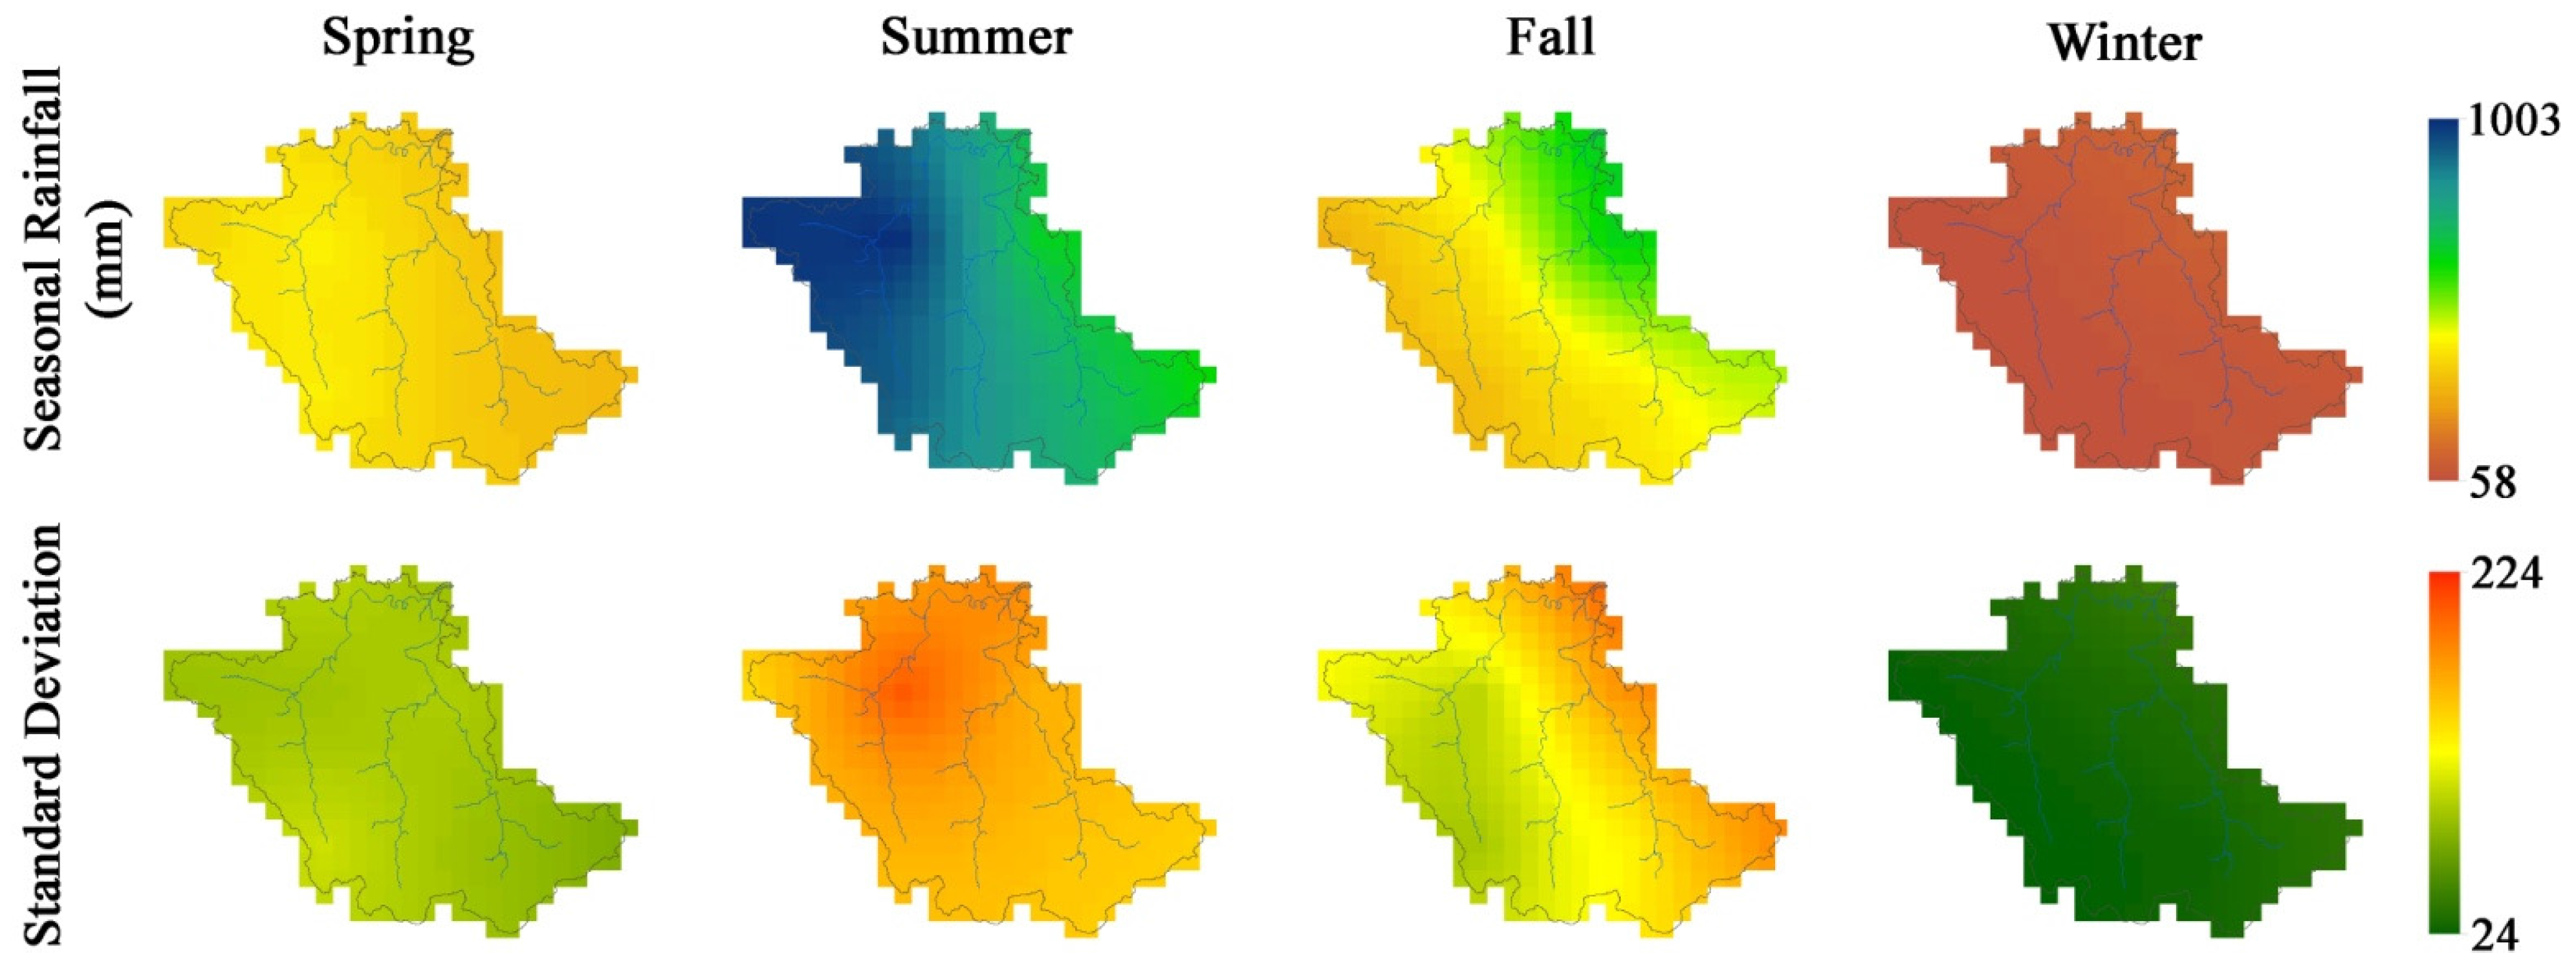
Figure 5 illustrates the total seasonal precipitation and its standard deviation in the Huong River basin. Spatial distribution of the seasonal precipitation during the 1951–2012 period shows highest precipitation during the summer season: precipitation in excess of 1000 mm over the mountainous area of the basin with lower precipitation of about 800–950 mm in the delta area. The spatial pattern of fall precipitation is different, higher values of around 550–600 mm over the delta area with lower values of 450–500 mm in the mountain region. Precipitation in the spring is average, about 400–450 mm, and is relatively homogeneous over the basin. Winter is known as the driest season with low precipitation, below 100 mm, falling uniformly over the whole basin.
Figure 5.
Seasonal precipitation distribution and their standard deviation.
Figure 5.
Seasonal precipitation distribution and their standard deviation.
Maximum daily temperature in the summer is always above 35 °C and usually around 37–39 °C; it reaches above 40 °C on rare occasions. In the winter, maximum daily temperature is usually around 13–15 °C but can reach 17–18 °C during warmer years. Summer minimum daily temperature fluctuates between 27 and 30 °C; in warmer summers the minimum daily temperature reaches above 32 °C. The minimum daily temperature fluctuates between 12 and 13 °C in the in some years fell below 10 °C. Humidity within the Huong River basin area is always very high at 95%–100% during the rainy season. Humidity significantly decreases when temperature increases in the summer to about 45%–60%.
Historical meteorological data are input into LARS-WG to reproduce the baseline of the 1961–1990 period. Reproduced data were compared with observed data to evaluate the performance of the model. The main purpose of this step is to identify internal bias and errors of the model before simulating the future climate projections.
Figure 6 illustrates the average daily precipitation graph of each month based on observed and LARS-WG-simulated values. The Nash-Sutcliffe efficiency and Pearson correlation coefficient of these two sets of data are 0.997 and 0.999 respectively; which indicates that baseline values are very well reproduced and that internal model bias and error are minimal. Calculated differences in daily precipitation are lower than 0.5 mm.
Figure 6.
Average daily precipitation in 12 months from observed data (solid line–left scale) and baseline data (dotted line–left scale). The dashed line represents the differences between the two datasets (right scale).
Figure 6.
Average daily precipitation in 12 months from observed data (solid line–left scale) and baseline data (dotted line–left scale). The dashed line represents the differences between the two datasets (right scale).
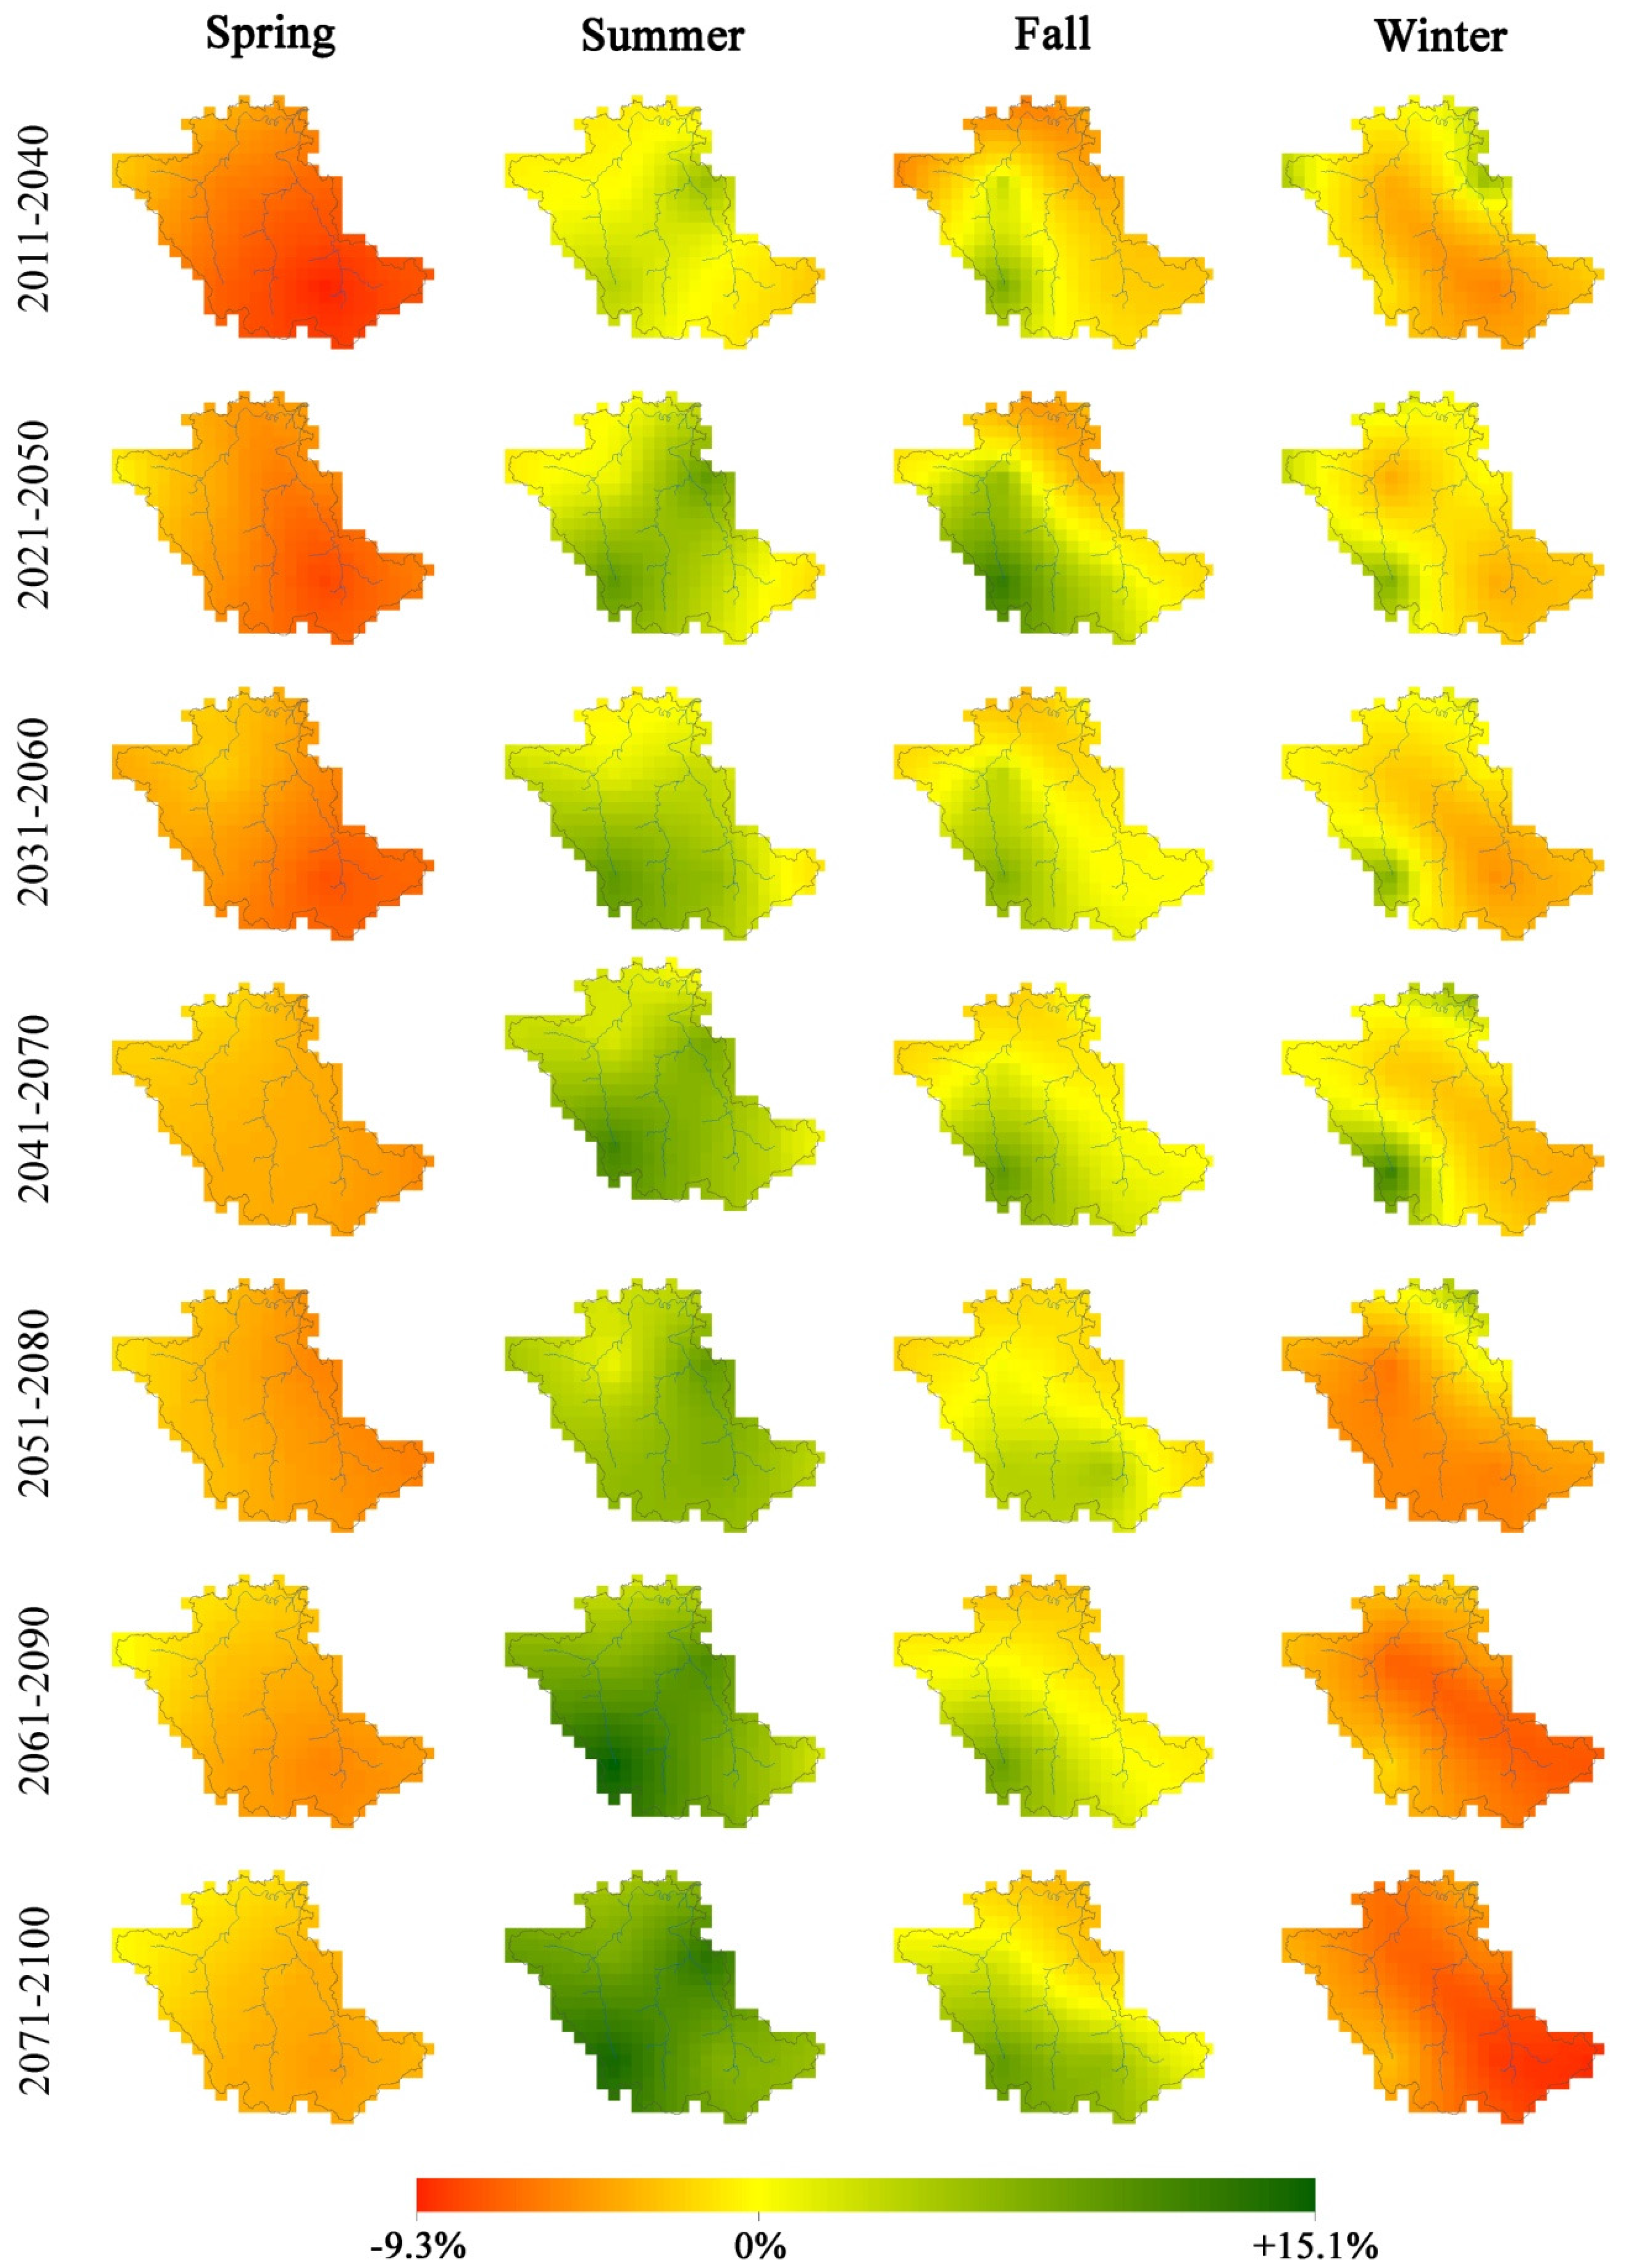
The spatial distribution of the changes in seasonal precipitation projected by the GCMs for the 2011–2040, 2021–2050, 2031–2060, 2041–2070, 2051–2080, 2061–2090 and 2071–2100 periods are shown in
Figure 7. On average, the GCMs’ output data show an increase in precipitation from the present to the 2011–2040 period followed by a slight decrease until the second half of the century then a gradual increase until the end of the century. The spring season is projected to witness the most change in precipitation, a decrease of about 9% in the southern mountainous region during the 2011–2040 period. Summer and fall will stay as the wettest seasons. A considerable drop in precipitation is also projected for the winter season with the highest drop of about 8.5% in the 2071–2100 period in the south of the basin. In general, the GCMs project an increase in maximum and minimum temperature for all three IPCC-SRES scenarios in the twenty-first century. This will raise the amount of ET within the basin and reduce the total runoff that can reach the Huong River.
Figure 7.
Change in seasonal precipitation in the 2011–2040, 2021–2050, 2031–2060, 2041–2070, 2051–2080, 2061–2090 and 2071–2100 periods compared to the baseline.
Figure 7.
Change in seasonal precipitation in the 2011–2040, 2021–2050, 2031–2060, 2041–2070, 2051–2080, 2061–2090 and 2071–2100 periods compared to the baseline.
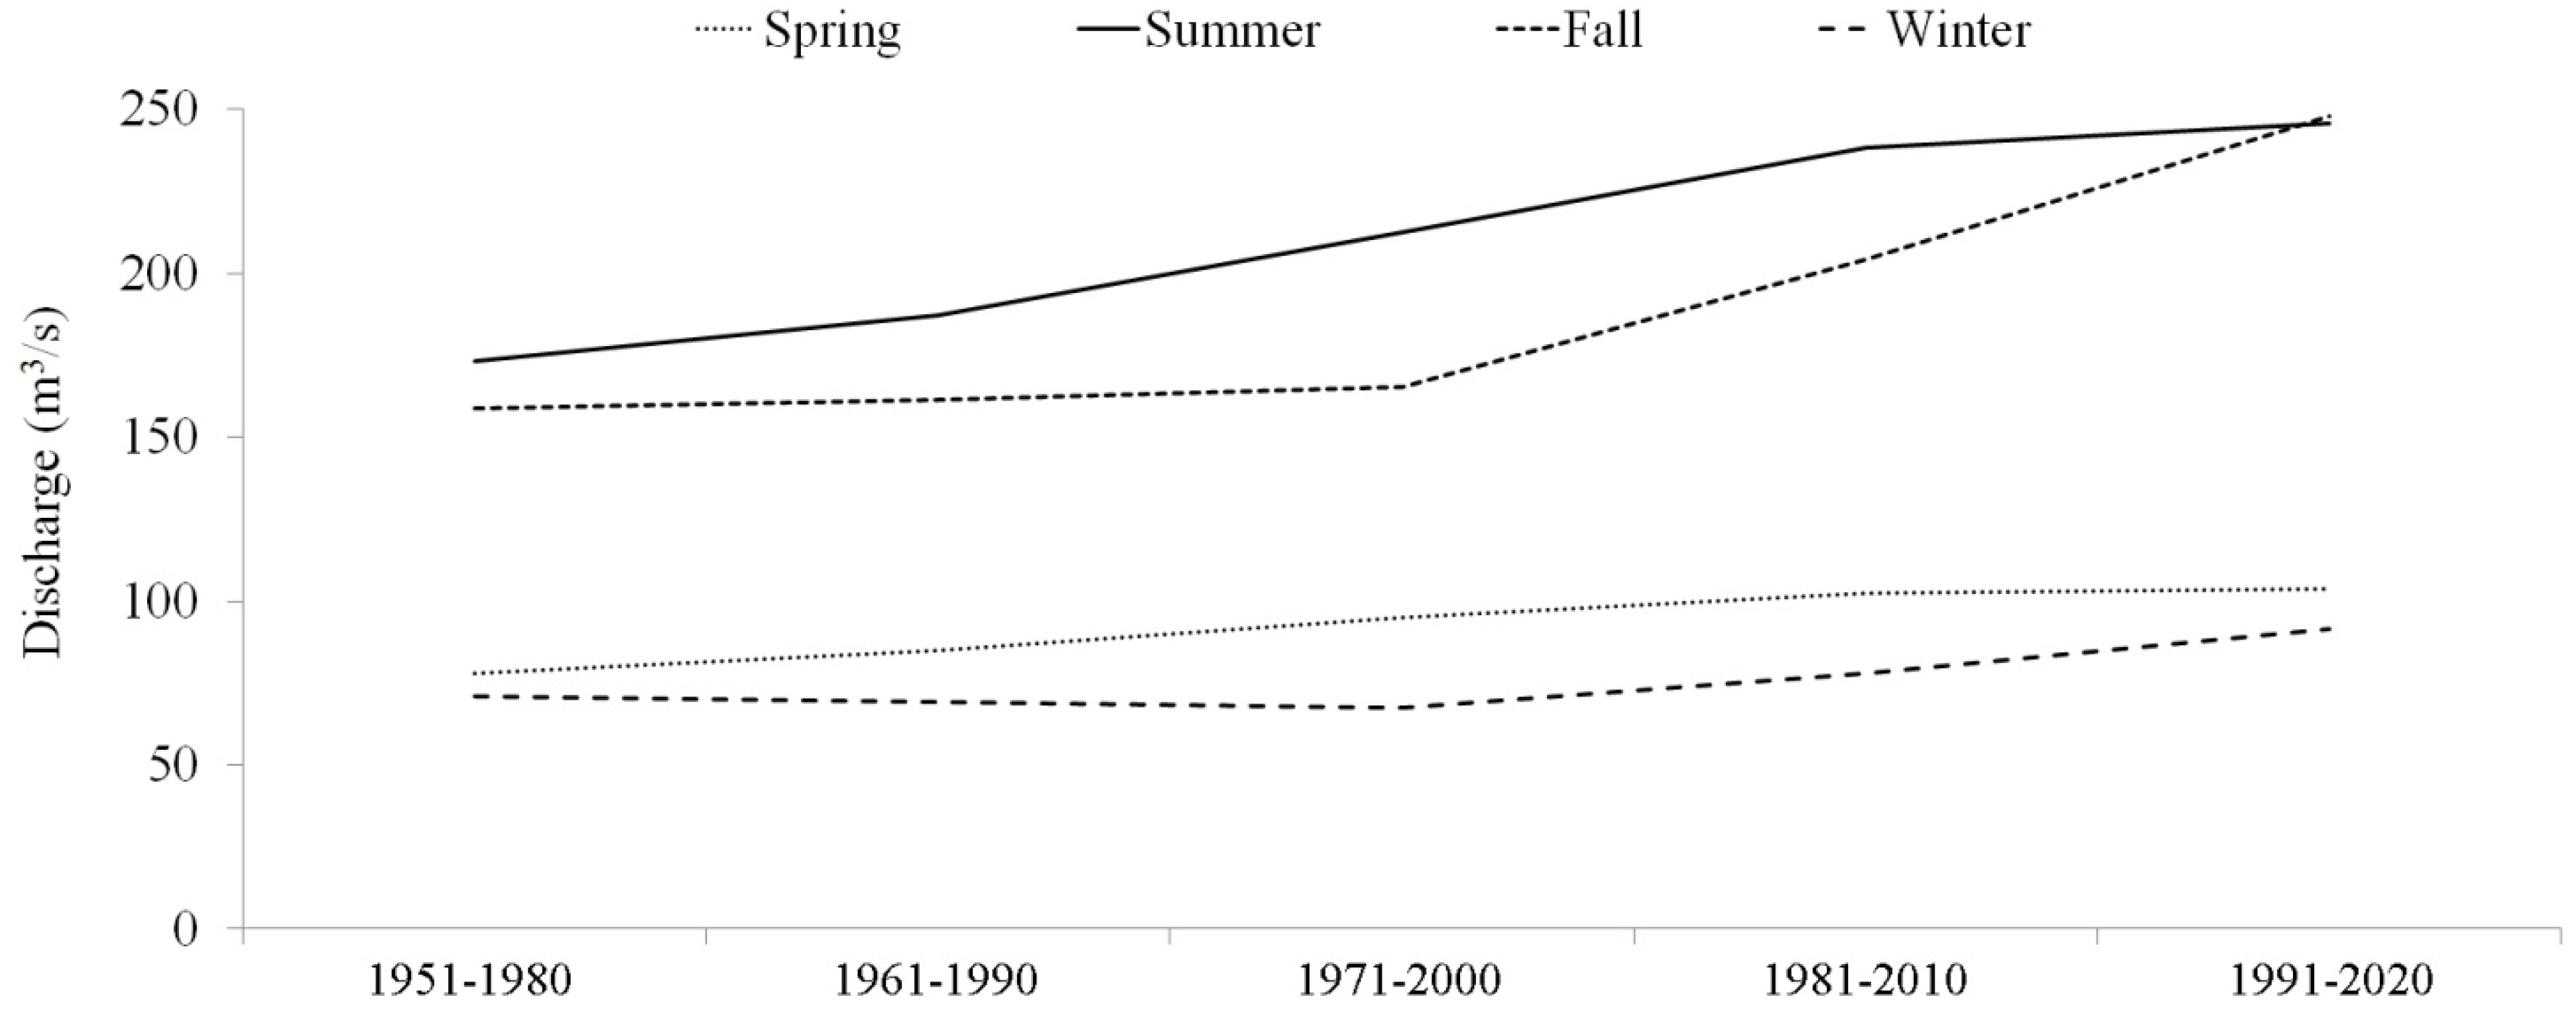
3.3. Changes in River Discharge during 1951–2012 Period
Model simulations of the Huong River discharge for the 1951–2012 period (and observations) show an increase in annual discharge. On average, the increase in annual discharge is relatively small until the end of the 20th century; however, extreme peak flows occurred more often during the last decade. Daily peak flows that exceed 2000 m
3/s occurred only few times during 1951–2007 period (in 1974, 2000 and 2005); however peak flows of over 2000 m
3/s have occurred in every rainy season from 2008 through 2012. Since 2000, the Huong River discharge in the rainy season increased considerably, especially from September to November, but decreased during the dry season. These changes are in response to the unusual extreme precipitation events that were observed in the first decade of the twenty-first century. Seasonal river discharge has also risen during the 1951–2012 period in general (
Figure 8). Decadal average discharge indicates an increase of seasonal discharge in the fall from 1971–2000 period to 1991–2020 period. Summer discharge also increased during this period. The increase in spring and winter discharge was much more modest.
Figure 8.
Average seasonal discharge from 1951 to 1980 period to 1991–2020 period.
Figure 8.
Average seasonal discharge from 1951 to 1980 period to 1991–2020 period.
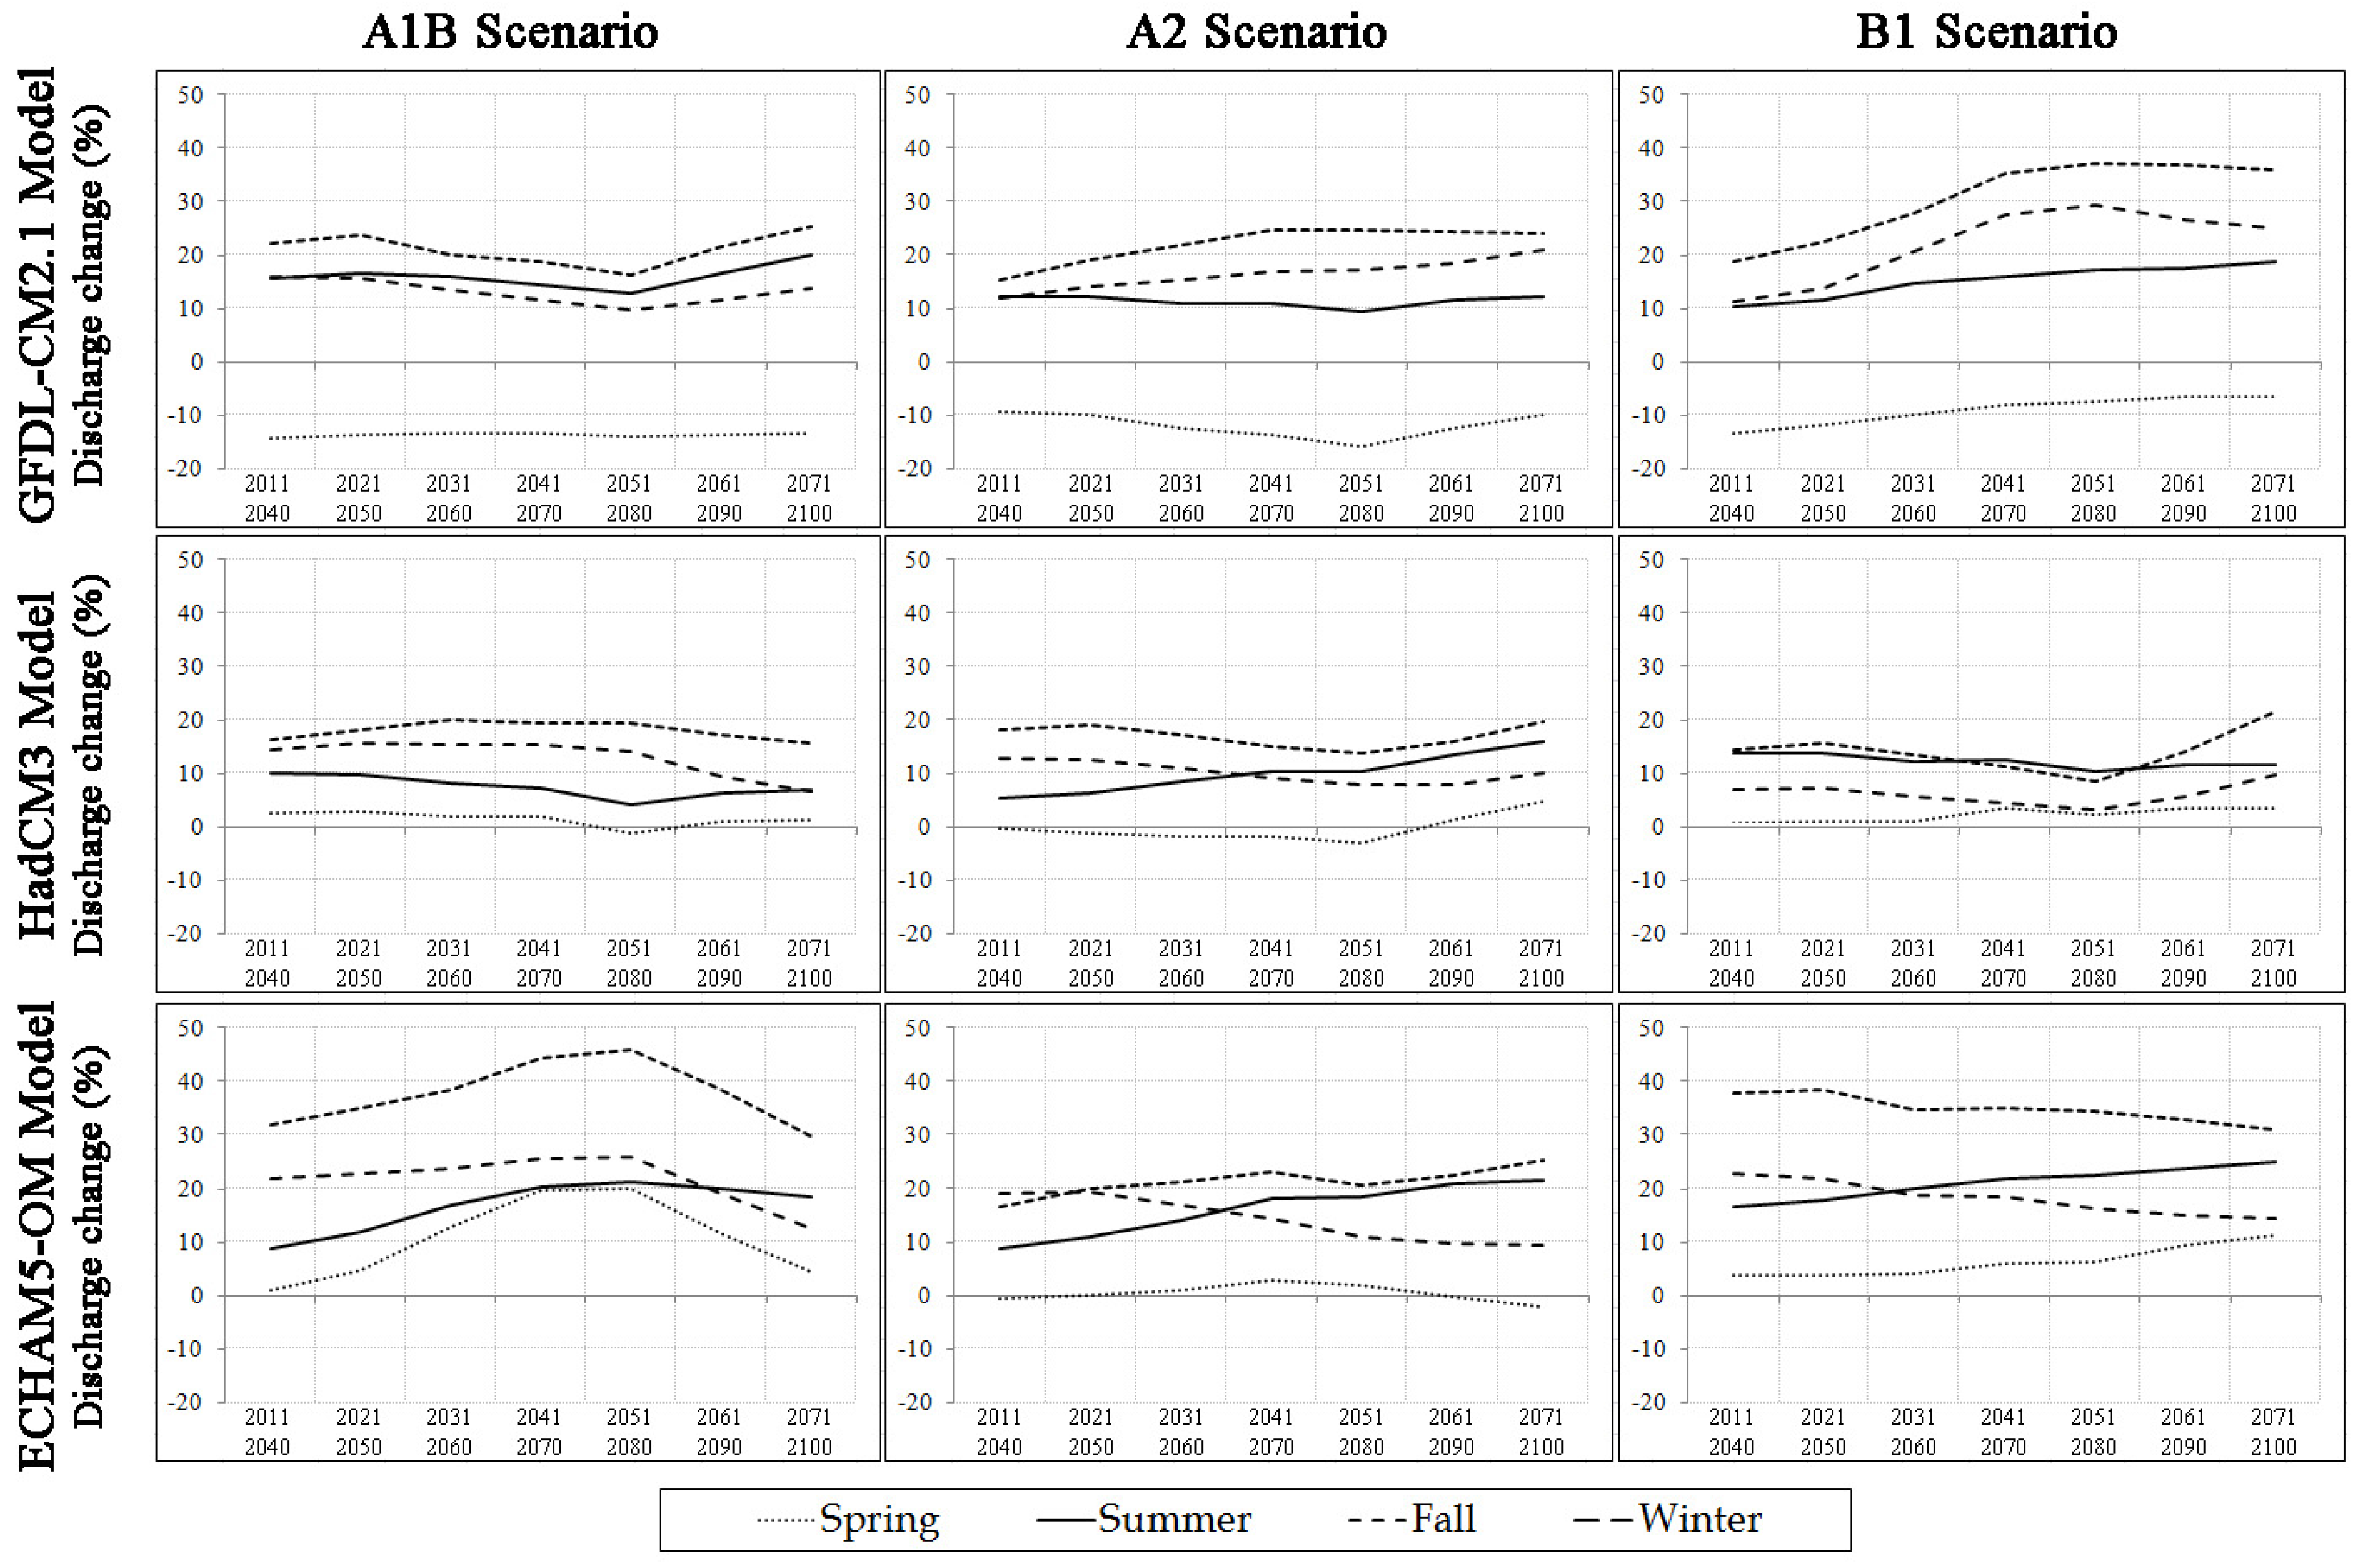
3.4. Impact of Climate Change on River Discharge
The potential impacts of global and local climate change on water resources of the region were estimated by running the SWAT model driven by projected meteorological variables. Like other tropical rivers, the Huong River’s water budget is primarily contributed mainly by direct rainfall; for that reason, any change in precipitation would alter the amount of discharge directly. Future discharge of the Huong River was simulated by forcing SWAT model with GCM outputs. Results are presented for the three preset emission scenarios for seven 30-year periods (
Figure 9). Each projected discharge result is corresponding to a combination of one GCM and one emission scenario. The authors are not aware of any major land use changes in the Huong River basin and have no information on projected land use changes in the region. For these reasons, the existing land use patterns are used in the SWAT simulations. In general, the Huong River discharge is projected to continue its increase for the rest of the 21st century. Modeled ET calculations by SWAT agree with the effect of average temperature rise, especially in the winters of the 2071–2100 period and springs of the 2011–2040 period. The warming of local climate in the future that is simulated by the GCMs causes a decrease of river discharge for some periods even though precipitation is projected to increase.
In the scenario of high emission A2, there are similarities between ECHAM5-OM and HadCM3 projections. Summer is the season with the most amount of discharge, followed by fall. Spring and winter continue to have much lower discharge and river discharge is slightly higher in the spring than in the winter. The Huong River discharge is projected to increase in the summer and the fall for the rest of this century. However, HadCM3 model projects a drop in fall discharge from the 2031–2060 period until the 2051–2080 period and then a gradual increase to the level of the 2011–2040 period. Slight decreases in seasonal discharge in the winter and the spring are also projected by ECHAM5-OM and HadCM3 models. On the contrary, GFDL-CM2.1 model projects a small decrease in discharge in the summer, especially from the 2011–2040 period to the 2051–2080 period. This model also projects winter discharge of the Huong River will increase and become higher than the spring discharge which was rarely observed in the past. The increase of fall discharge in A2 scenario is once more reinforced by GFDL-CM2.1 model.
Figure 9.
Projected change in total seasonal discharge in the rest of the twenty-first century produced by different GCMs in different IPCC-SRES scenarios.
Figure 9.
Projected change in total seasonal discharge in the rest of the twenty-first century produced by different GCMs in different IPCC-SRES scenarios.
Projections in the scenario of medium emission A1B show disagreements among the three climate models. Both HadCM3 and GFDL-CM2.1 models project a continuous decrease of river discharge until the 2051–2080 period and then an increase until the end of the 21st century. The ECHAM5-OM model projects that it will increase until the 2051–2080 period and then decrease for the rest of the century. HadCM3 and GFDL-CM2.1 models have similar projections for spring discharge. GFDL-CM2.1 once more projects a winter discharge that stays higher than spring discharge while HadCM3 and ECHAM5-OM models still produce normal winter discharge values that are lower than those of the spring. The Huong River discharge in the fall tends to decrease slightly in the middle of the century and increase at the end of the century as for GFDL-CM2.1 model results. HadCM3 model projects this discharge will be rather stable except a small increase in the 2051–2080 period. ECHAM5-OM model projects similar scenarios of discharge change for the four seasons at varied levels. This model shows that in any season of the year, river discharge will keep increasing until the 2051–2080 period and then decreases until the end of the century. Seasonal discharge in the fall will sometimes become higher than summer discharge, especially in the 2011–2040, 2021–2050 and 2041–2070 periods.
Discharge projections under low emission scenario B1 also show disagreements among the three climate models, especially in the summer and the fall seasons. The GFDL-CM2.1 model projects the river discharge to increase significantly in the fall from the 2011–2040 period to the 2041–2070 period and will maintain that level to the end of the century. Summer discharge is also projected to increase in the twenty-first century. The generated winter discharge values in B1 scenario from this model are higher than the spring values and the gap between these two lines seems to widen over time. The HadCM3 model has an opposite projection that summer discharge will decrease through the twenty-first century and fall discharge will decrease similarly just until the 2051–2080 period and will climb up afterwards. Both HadCM3 and ECHAM5-OM models project minimal change in winter and spring discharge within the whole twenty-first century. However, ECHAM5-OM model projects summer discharge to increase and fall discharge to decrease.
The disagreement among three GCMs’ projections is caused by different numerical equations used in the GCMs. However, all three GCMs agree that the Huong River discharge in the spring will not change significantly in the twenty-first century under any emission scenario. Winter discharge is also projected to undergo quantitatively insignificant changes, except the divergence between GFDL-CM2.1 model and the other two models due to model performance. Summer and fall discharge will vary with different possibilities of increasing and decreasing and those variations are significant.
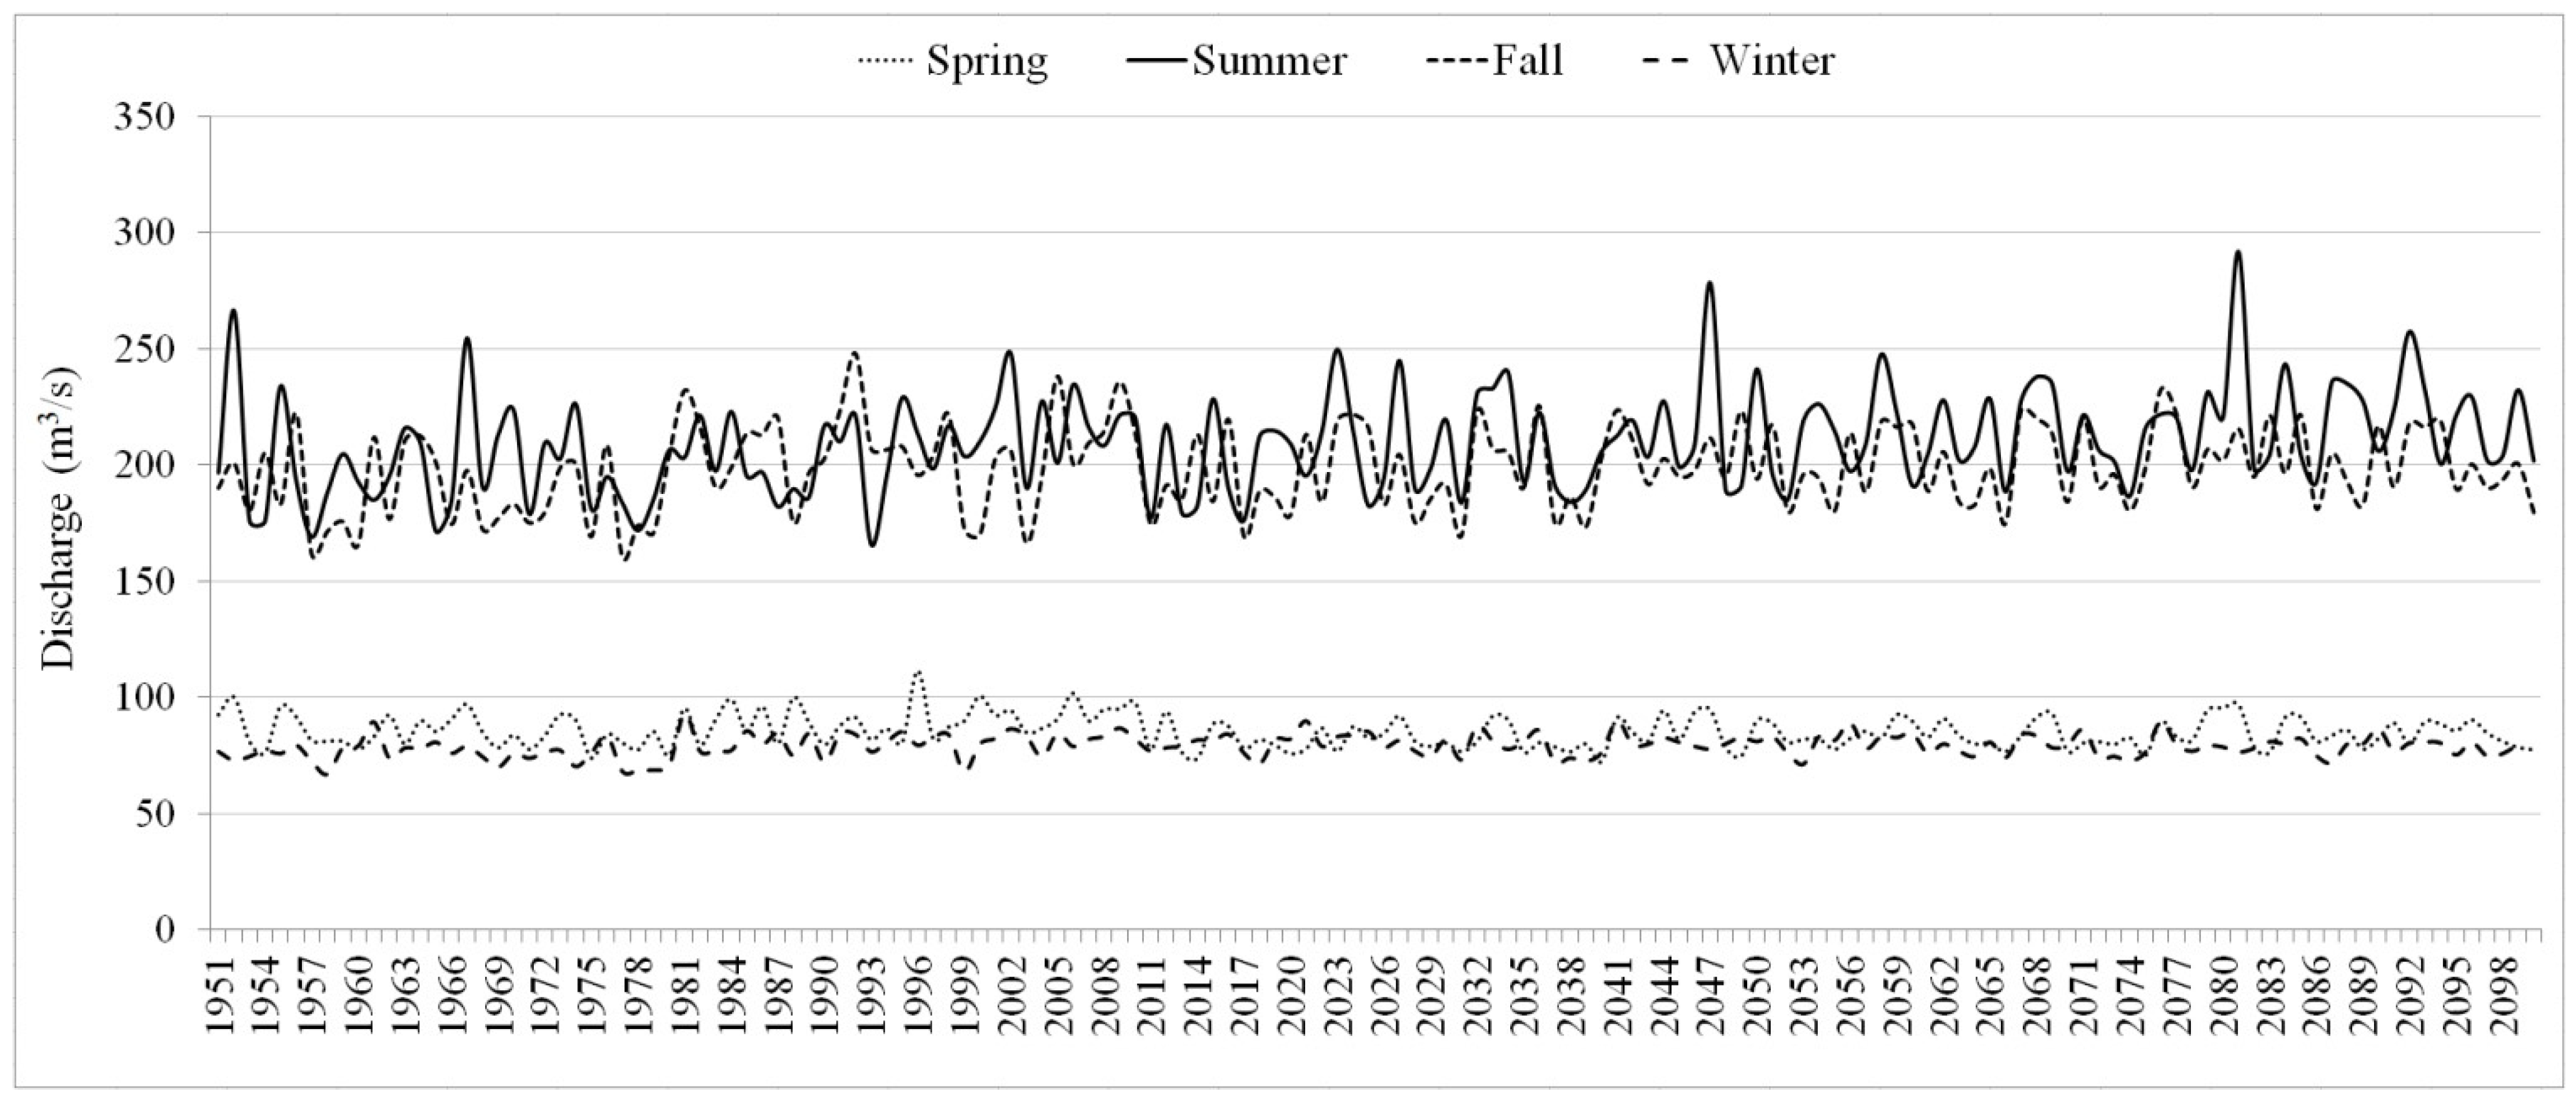
Figure 10 provides details on annual projection of seasonal discharge of the Huong River. Previous studies generated projections for South East Asia indicate an increase in runoff from 10%–20% to 40%–50% in the 21st century depending on different GCMs and emission scenarios (e.g., [
13,
19]). This also agrees with the projections that we obtained in this study.
Figure 10.
Historical and projected seasonal discharge from 1951 to 2100 (average of all GCMs and IPCC-SRES scenarios).
Figure 10.
Historical and projected seasonal discharge from 1951 to 2100 (average of all GCMs and IPCC-SRES scenarios).
4. Summary and Conclusions
This paper used the stochastic weather generator LARS-WG and the hydrologic model SWAT to study projected future water availability in the Huong River basin in Central Vietnam. Future meteorological parameters are projected by three popular GCMs, ECHAM5-OM, HadCM3 and GFDL-CM2.1, for three IPCC-SRES scenarios A2, A1B and B1. Future projections of climate and discharge data were compared to baseline period from 1951 to 2012. The main source of the precipitation data for the baseline period was the gage-based APHRODITE precipitation product, which is complemented by observation in the later years. Other historical meteorological data were based on in-situ measurements and satellite observations. LARS-WG and SWAT were first calibrated and validated over the study area. LARS-WG was used to simulate meteorological conditions during the historical period and its results compared very well against observations. SWAT model was also calibrated and validated over the Huong River basin against monthly observed discharge data. Results of SWAT model calibration and validation were adequate with a Nash-Sutcliff efficiency coefficient of 0.88 and a correlation coefficient of 0.94.
Over the historical period, the Huong River discharge has been increasing since the 1951–1980 period. In particular, the fall discharge has increased significantly since the 1971–2000 period while the summer discharge has increased most between the 1970’s and 1981–2010 period. According to models’ projections for seasonal Huong River discharge in the twenty-first century, this increase in the summer and fall will continue with A2 and B1 emission scenarios modeled by the three GCMs. Changes in winter and spring discharge appear insignificant. In most of the cases, it is projected to slightly decrease during the 21st century. However, detailed analyses indicate differences in possible changes of seasonal river discharge in the future among different GCMs and climate scenarios. Although precipitation is the most important agent in changing in discharge, the projection of the Huong River discharge is not always proportional to the projected change in precipitation under the same IPCC-SRES scenario and using the same GCM. An obvious explanation is that ET will rise significantly due to the increase of temperature and that reduces the total amount of runoff.
The intent of this paper is to generate data that may aid decision makers in making decisions that will ensure sustainability of water resources in the region. The Huong River is witnessing intense on-going water resources management activities, the details of which are not completely available to the authors, e.g., dam construction and operation policies. Thus, simulations of future discharge do not include the impacts of management and flow regulation. Nonetheless, the study presents results that may help guide water resources planning and management in the region by quantitatively providing potential changes in river flow in the 21st century.


