1. Introduction
China is the biggest developing country in the world, and its rapid economic development has resulted in a large number of significant water quality issues such as eutrophication of lakes and reservoirs, deterioration of river water, and groundwater pollution [
1,
2]. To resolve these environmental issues, the Chinese government gradually resorted to mathematical models to provide a scientific basis for quantitative environmental management rather than exclusively depending on empirical qualitative analyses [
3]. Currently, numerous watershed models with various capabilities are widely used in hydrological research and environmental resource management around the world [
4,
5]. These are powerful tools that enable us to understand the natural processes, as well as to find solutions for problems, while assessing the environmental conditions on a the watershed scale [
6]. However, typically, there is a trade-off between model complexity, input data availability, and prediction ability in a certain application objective [
7]. Butts et al. developed a hydrological modeling framework that allows for the application of different model structures by providing varying levels of model complexity. The authors reported that an increase of model complexity did not increase model performance for a number of investigated cases. Accordingly, different models with different complexities had to be selected for an exploration of the applicability of watershed models.
SWAT is a semi-distributed and physical-based hydrological model, which has evolved from multiple previous models over more than 30 years [
8,
9]. Considerable applications in a wide range of regions and environmental conditions have indicated SWAT to be an effective and acceptable tool both for scientific research and policy making [
10]. It has been extensively implemented throughout the world, e.g., in America [
11], Africa [
12], and Australia [
13]. In China, it has been used in the Chaohe basin in the north of China [
14], the Heihe basin in the west of China [
15], and the Three Gorges Reservoir Region in the south of China [
16]. The primary categories to which SWAT has been applied include hydrologic assessments [
17,
18], pollutant assessments [
19], and climate change impacts [
20,
21]. The GWLF is a simpler, continuous process-based model, which has been used in America [
22], Ireland [
23], and China [
24] for various purposes. The Ministry of Environmental Protection of China has endorsed the GWLF as an alternative model to promote water quality and to meet environmental quality standards [
25]. Both models were used to support the development of Total Maximum Daily Loads (TMDLs) [
26]. Due to their wide applicability, acceptance by the authorities, as well as their different complexities, SWAT and GWLF were selected and compared in China for regions where monitoring networks are incomplete compared to developed countries.
There have been many studies that compared watershed models. Li et al. [
27] compared the conceptual, lumped Water and Snow balance MODeling system (WASMOD) model to SWAT for the Yingluoxia watershed and found that MASMOD provided the same, or even better results than SWAT for the simulated hydrograph. Parajuli et al. [
28] employed both the Annualized AGricultural Non-Point Source (AnnAGNPS) and SWAT in south-central Kansas and their study indicated SWAT as the most appropriate model for this particular watershed. Wilcox et al. [
29] simulated the runoff on six uncalibrated catchments using both a simple model and a complex model. Although their results demonstrated that more complex catchment models yield more accurate results, the superiority of complex models is not immutable for all watersheds. These studies show that different models lead to different performance in different applications. A model comparison without considering the regional differences is easily one-sided. Niraula et al. [
30] applied the SWAT and GWLF models in east central Alabama to identify critical source areas (CSAs) of sediment and nutrients. Both models performed well for streamflow; however, SWAT slightly outperformed GWLF for sediment, total nitrogen (TN), and total phosphorus (TP). The purpose of their study was to assess whether different model choice would lead to a variance in the locations of CSAs and the authors did not conduct a comprehensive comparison between the simulation results of SWAT and GWLF. Moreover, the authors conducted the models on one site only, suggesting limited implications. Therefore, the objective of this study was to conduct a comprehensive comparison between SWAT and GWLF and to evaluate their applicability in two catchments with different climate, landuse, and soil type for monthly stream flow, sediment, and total nitrogen in the data scarce China.
2. Materials and Methods
2.1. Study Sites
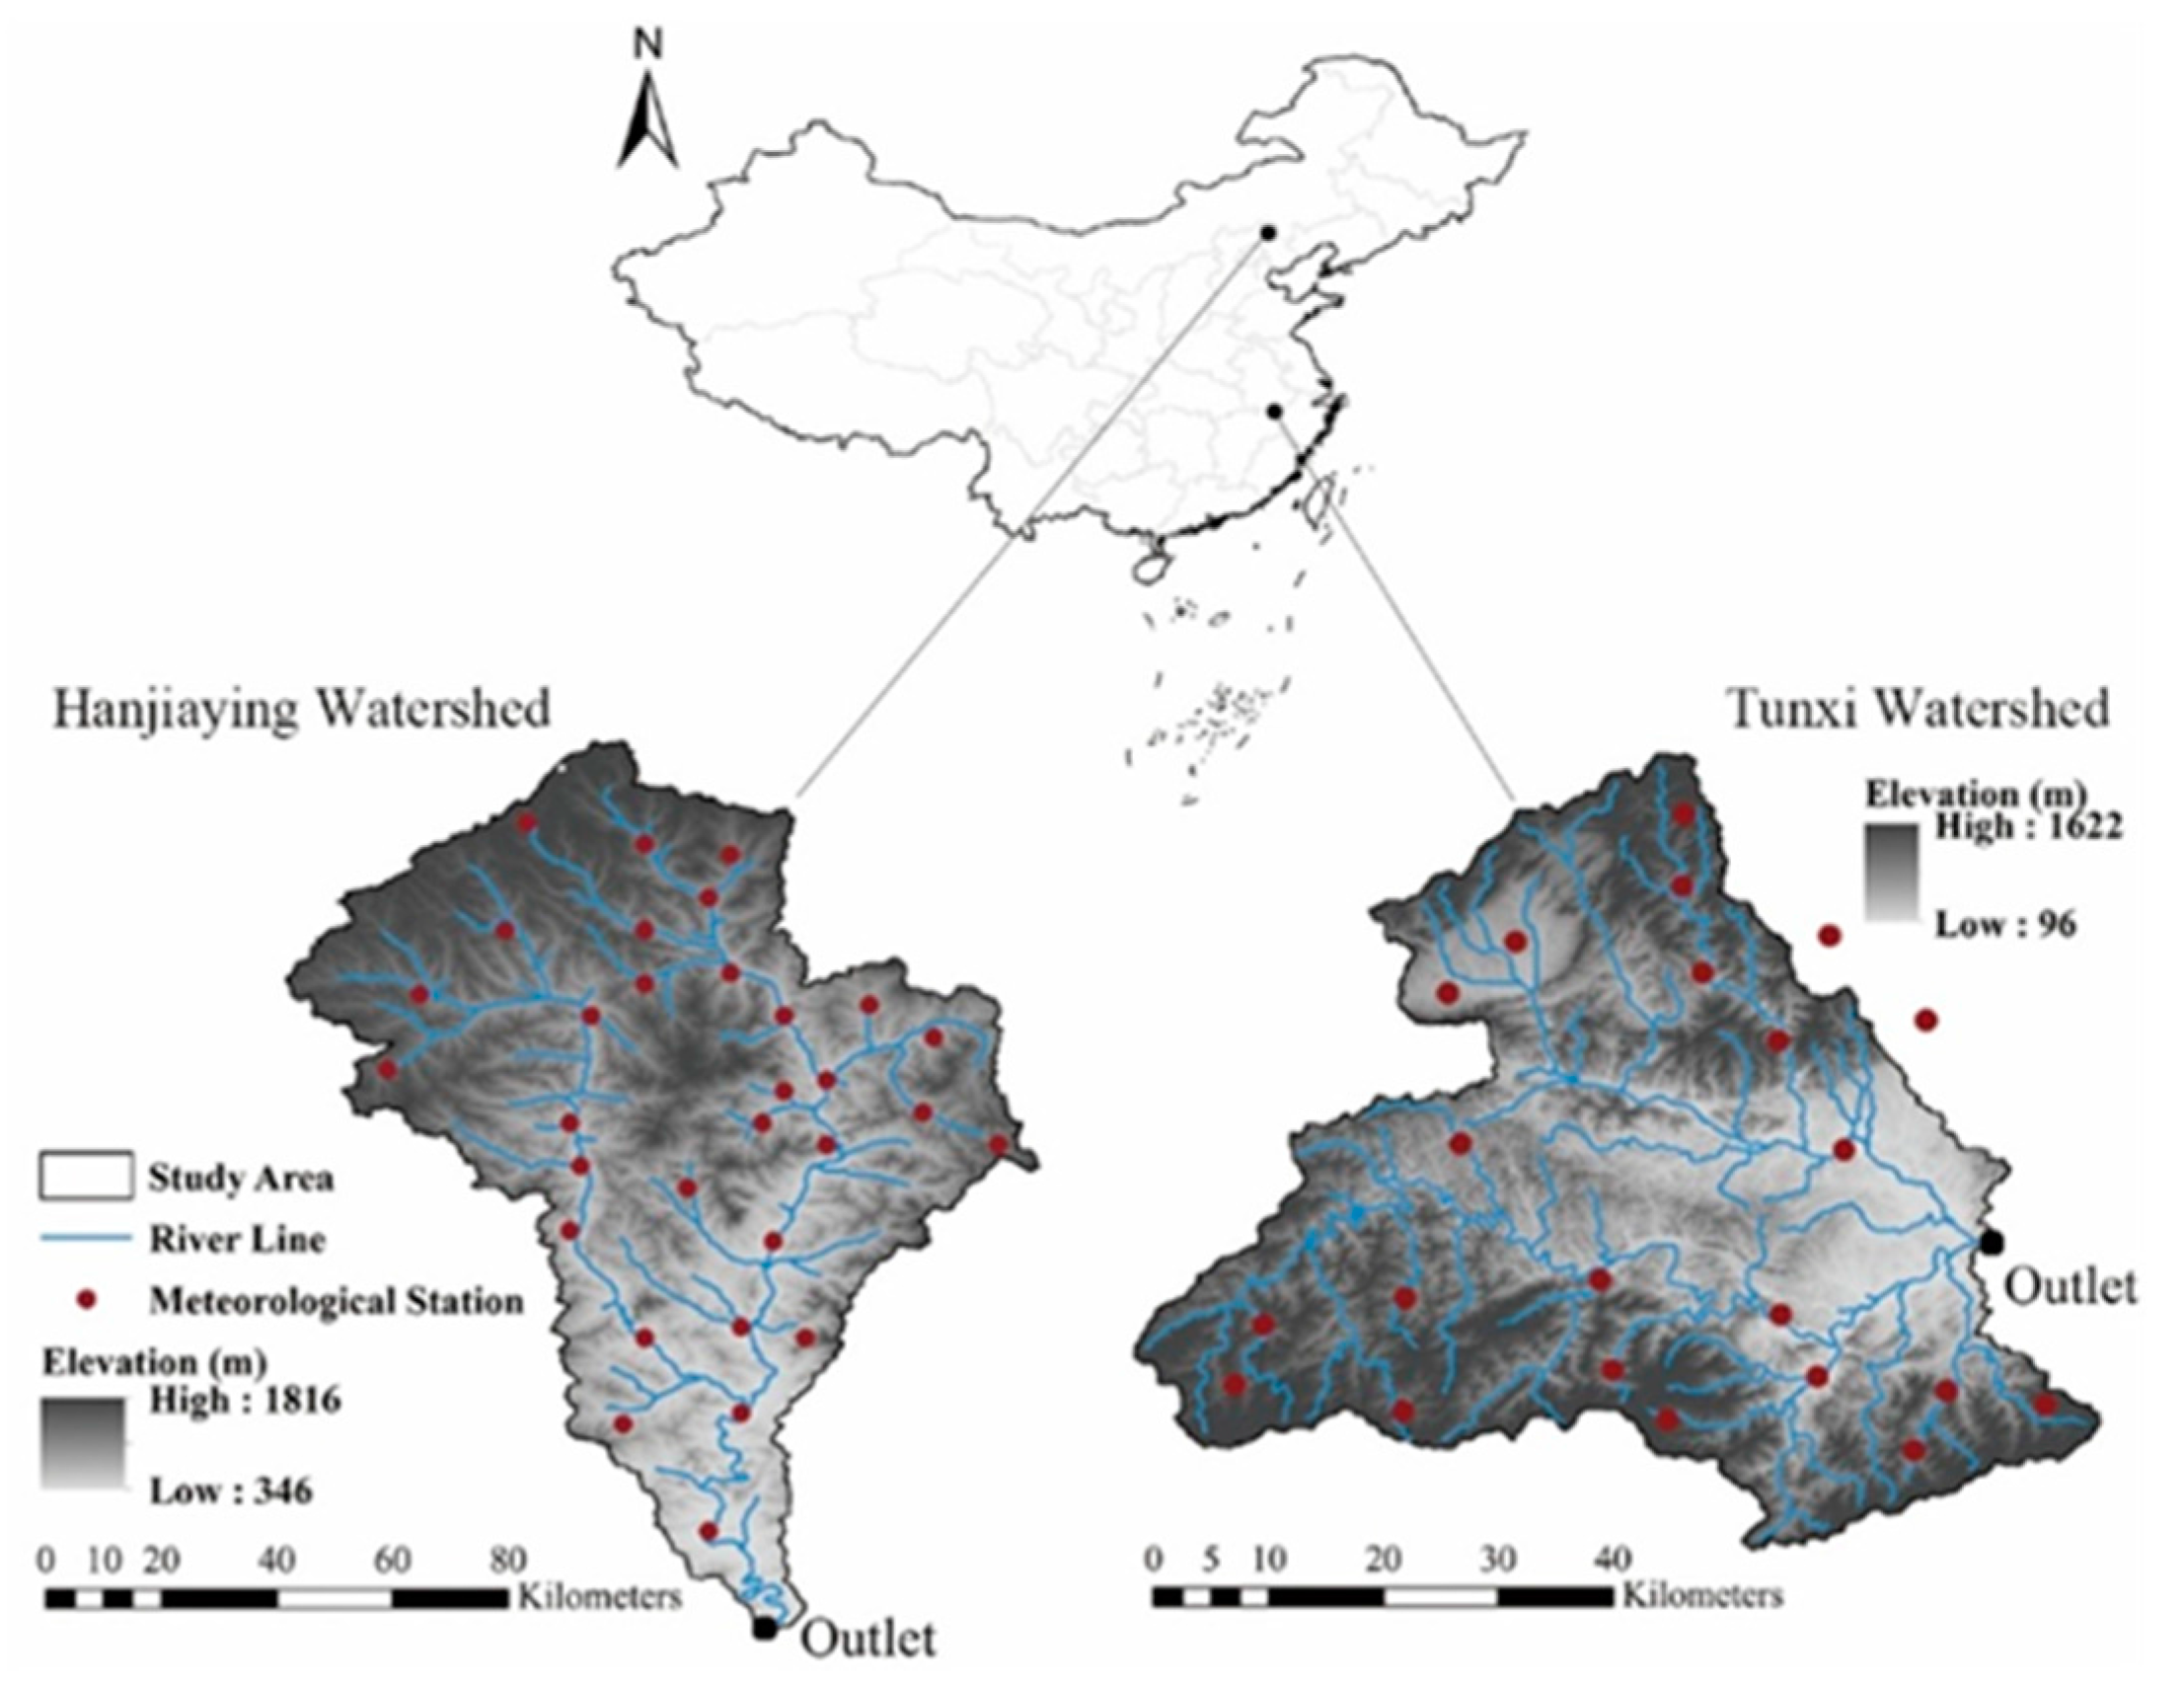
The study sites were chosen based on data availability and differences in climate, landuse and soil types (
Figure 1). The Tunxi catchment is located in Anhui Province, which was selected to represent the humid south of China. It covers an area of approximately 2674 km
2 with forest covering 74%, agriculture area 15.8%, urban 4.6% and others. Red soil (55%), paddy soil (13%), and purple soil (9.8%) are the predominant soil types. The basin had a subtropical humid monsoon climate with a mean annual temperature of 15.5 °C and a mean annual precipitation of 1752 mm during the period from 1993 to 2013. The daily temperature was always above 0 °C. The 6736 km
2 of the Hanjiaying basin were selected as a representation of the semi-arid north of China. It is one of the largest subbasins of the Luan River watershed and located in Hebei Province, which is situated in the north of the Qinling Mountains-Huaihe River line. Forest (49%) and agricultural land (25%) are the major land uses within the basin. Brown soil (65%), and cinnamon soil (22%) are predominant in this watershed. The basin plays an important role for ecological servicing and water supply to the region. The climate is dominated by a temperate continental monsoon climate with a mean annual temperature of 5.62 °C and a mean annual precipitation of 446 mm from 1993 to 2013. Monthly mean temperatures range below 0 °C during the period from November to March and above 10 °C during the summer months (June–August).
Due to significant differences in meteorological conditions, these two sites are typical representatives of the semi-arid north and the humid south of China, respectively (
Figure 2).
2.2. Watershed Models
SWAT is a distributed-parameter model, which was primarily designed by the Agricultural Research Service (ARS) of the United States Department of Agriculture (USDA) to assess the effect of land management practices on water, sediment, and agricultural chemical yields in large complex watersheds over extended periods of time [
31]. GWLF is a combined distributed/lumped parameter model, which is based on a combination of simple runoff, sediment, and groundwater relationships and empirical chemical parameters [
32]. Both SWAT and GWLF models are continuous, pollutant-loading models that operate with a daily time step.
Table 1 lists the major processes and related methods considered by SWAT and GWLF models. SWAT and GWLF differ greatly in the way in which they delineate the watershed. Based on the topological structure of river networks, SWAT first discretized the watershed into a number of subbasins, subsequently dividing each subbasin into hydrologic response units (HRUs) according to the unique land use, soil, and slope combinations [
31]. In SWAT, each physical and chemical process is modeled at HRU scale within the subbasin and then routed along the river network toward the outlet of the watershed. However, the conception of subbasin does not exist in GWLF; therefore, it can only identify surface loading from different land covers and the results of each area are simply added into the watershed summation. In some sense, the model is distributed but lacks a spatial conception as well as a channel route component. For sub-surface modeling however, it is considered a lumped parameter model because it used uniform parameters for the entire watershed, ignoring the spatial variability of physical and chemical processes [
33]. The differences in emphasis on simplifying the real environment lead to the diverse properties of various watershed models.
The hydrological process is the most important component in any watershed model as the drive force during the whole simulation. Both models simulate the hydrological component based on the water balance equation for the shallow aquifer. The SWAT model provides two methods to estimate surface runoff: the modified SCS-curve number and the Green-Ampt infiltration method. In this study, both models used different versions of SCS-CN to estimate the surface runoff volume, considering the remaining amount for infiltration [
34]. The GWLF describes groundwater with the linear reservoir model, while SWAT uses empirical relationships. In addition, SWAT can calculate the lateral flow in the unsaturated zone.
In GWLF, erosion is simulated via the Universal Soil Loss Equation (USLE), which predicts the average erosion, using a function of rainfall energy [
44]. Then, a sediment delivery ratio and transport capacities are applied to determine monthly sediment yield for each source area [
33]. In contrast, SWAT uses a modified version of the Universal Soil Loss Equation (MUSLE), which introduces a runoff factor displacing energy factor to daily estimate erosion and sediment yield. A delivery ratio is not required and sediment yields of single storms can be calculated [
42,
43].
Both models are also quite different in the way they estimate nutrient loads. The GWLF simply calculates nutrient loads by multiplying N and P concentration coefficients with the runoff volume or sediment yield at a monthly scale. It uses denitrification loss fractions to calculate the denitrification amount. With the daily time step, SWAT models nutrient cycles via different pools to simulate their mineralization, decomposition, and immobilization between inorganic and organic forms within the soil. Then, the amount of mineral and organic nutrients transported in both land phase and routing phase is calculated.
In addition to these basic components, SWAT has the additional powerful ability to simulate crop growth, management, as well as the amount of pesticide, bacteria, algae, dissolved oxygen, carbonaceous biological oxygen demand (CBOD), and their routing in the channel or reservoir.
2.3. Model Inputs
Table 2 summarizes the data used for the model setup in this study. To avoid different results based on variations of model input data, we kept the input data of GWLF consistent with SWAT. The SWAT (Version 2012) and the ReNuMa (Regional Nutrient Management) (Version 2.2.2) modeling platform of GWLF (Version 2) were used. Thirty-meter resolution DEMs were used to determine the watershed and sub-watershed boundaries in SWAT and GWLF identified runoff source areas based on the same delineation. At both sites, land use data were used to obtain major cover classification information and SWAT needs extra spatial datasets. Soil datasets were only used in SWAT to partition the watershed into HRUs along with landuse and slope datasets. In SWAT, a combination of these three datasets divided the Tunxi watersheds into 40 subbasins and 307 HRUs, while it divided Hanjiaying into 33 subbasins and 258 HRUs. In GWLF, there were nine major landuse classes in Tunxi and seven in Hanjiaying. Meteorological data of each subbasin were obtained from the weather station nearest to its centroid for SWAT, while average climatic data were used for GWLF. Agriculture management information of the Tunxi watershed was referenced to [
46] and obtained from the local government in Hanjiaying. Furthermore, population data were also required for the GWLF.
2.4. Model Calibration, Validation, and Evaluation
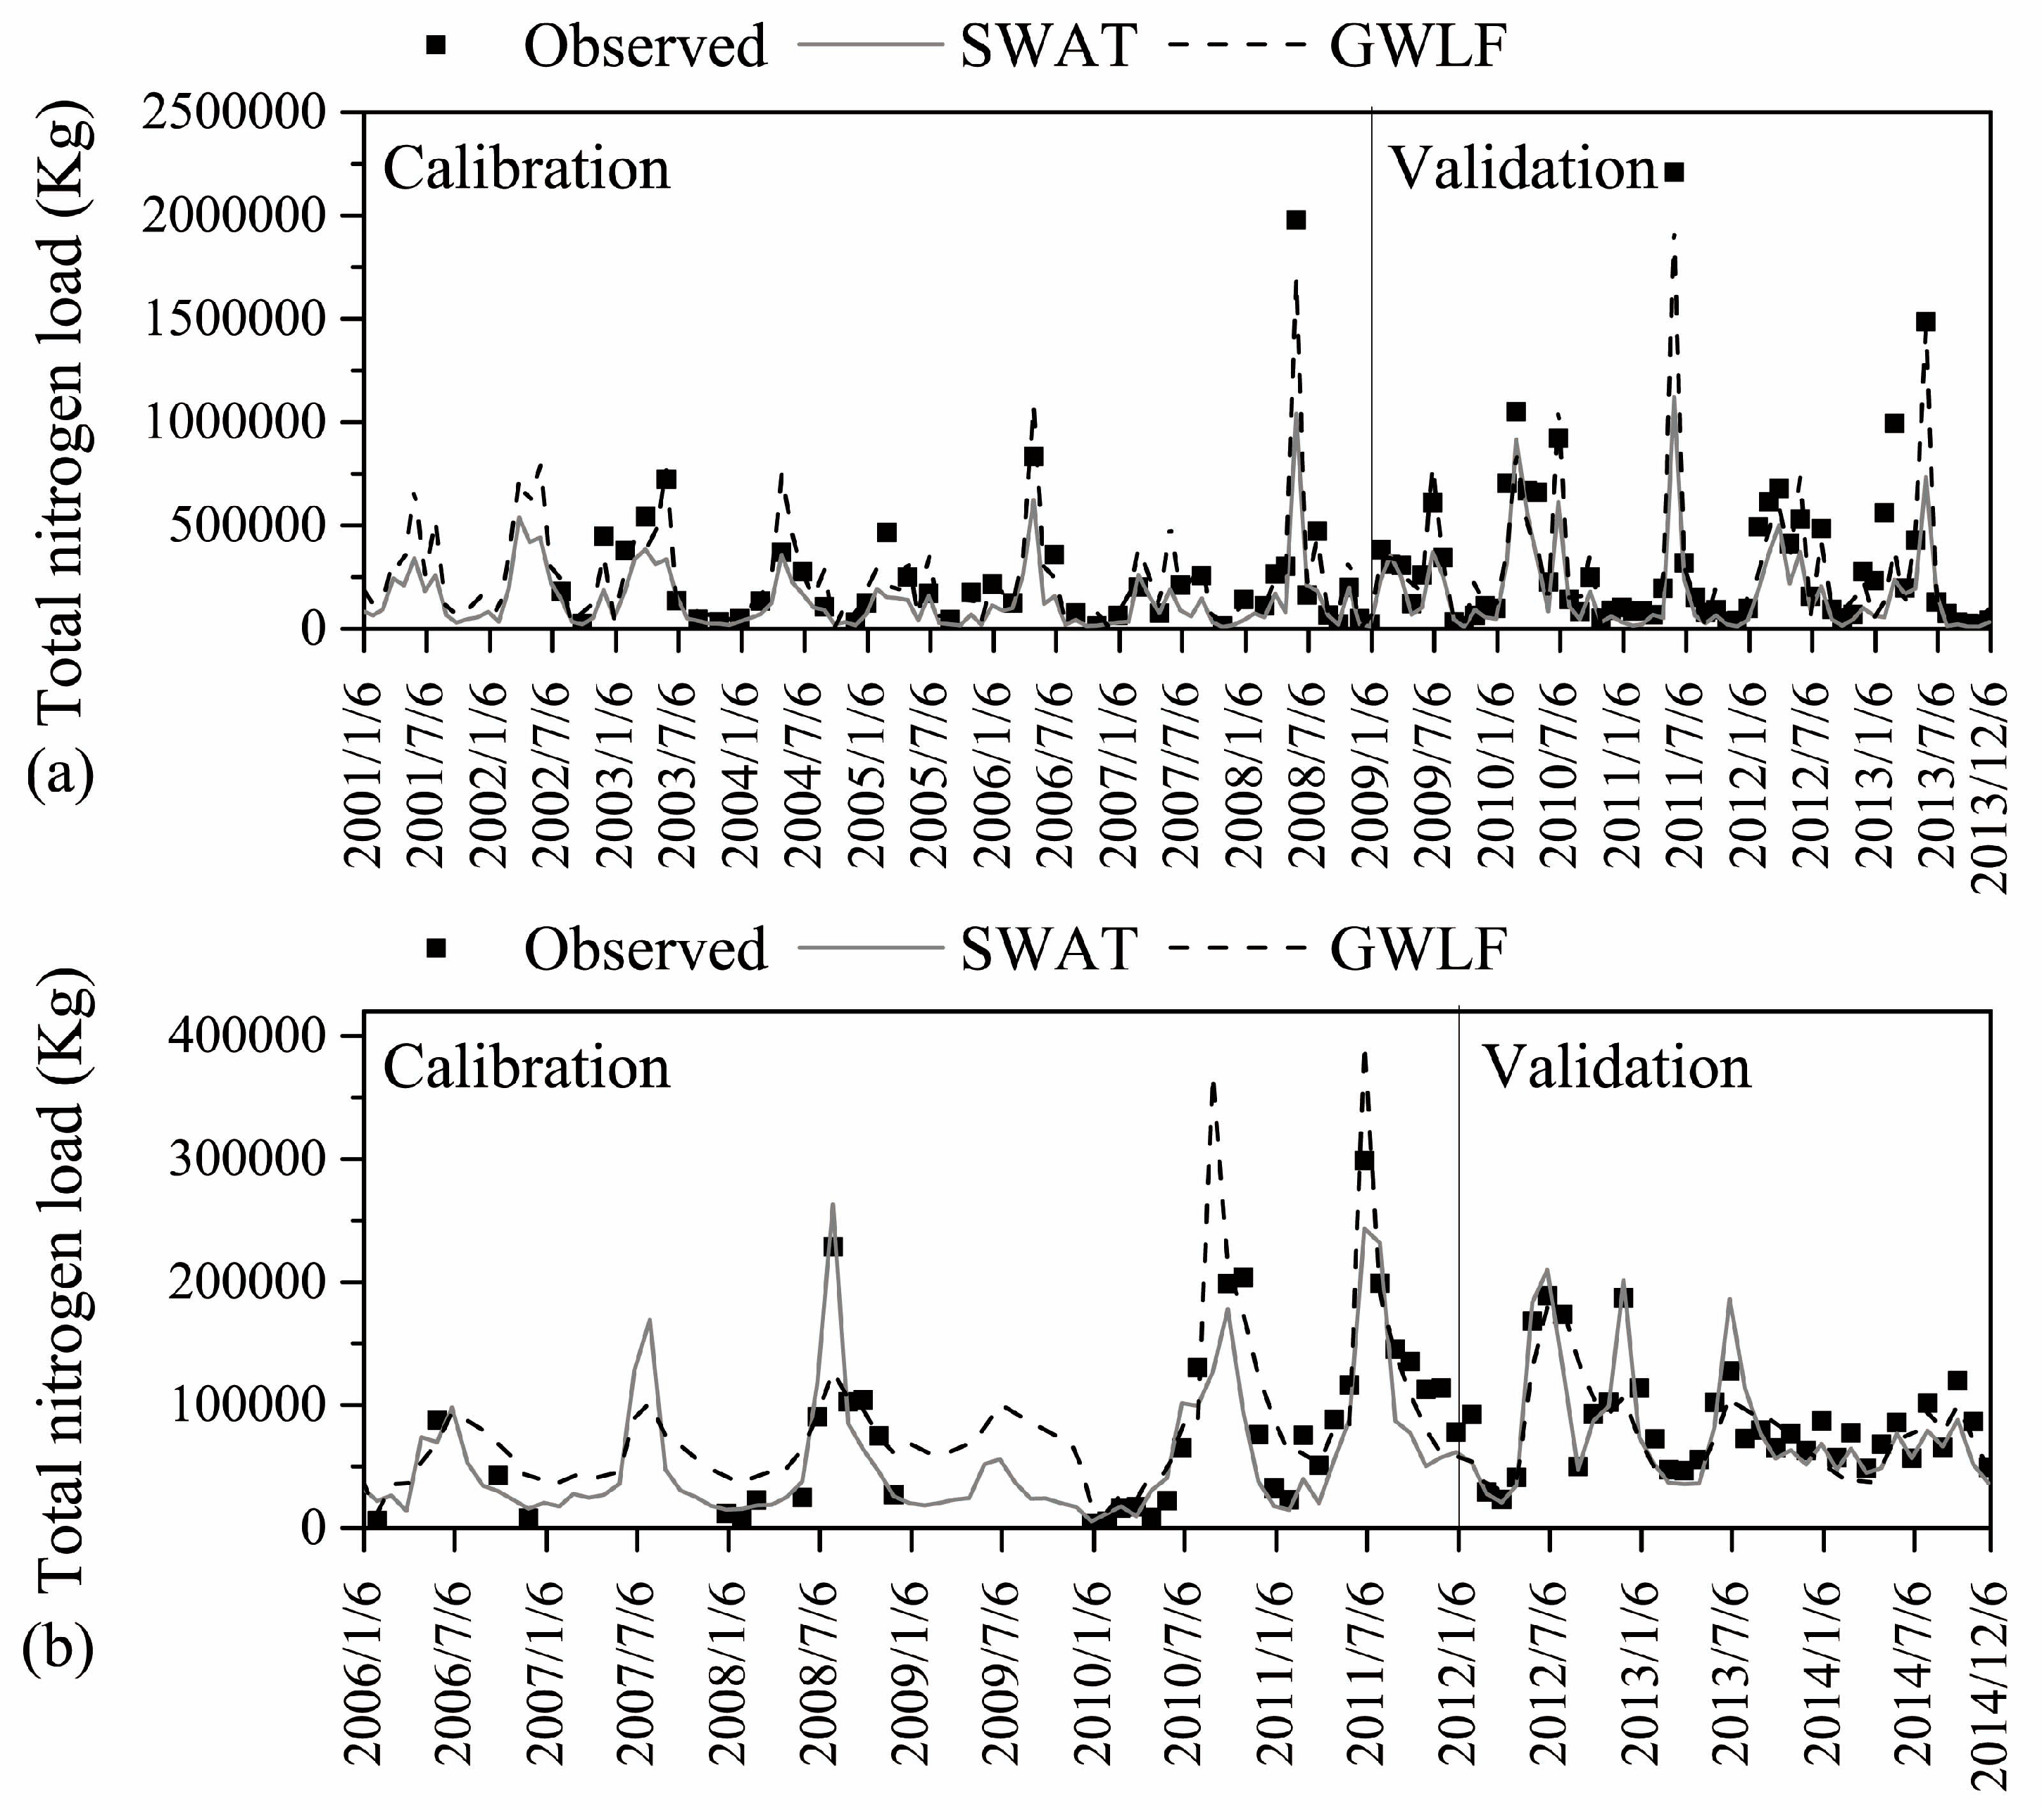
In the Tunxi watershed, the period from 2001 to 2008 was chosen for model calibration, and the data in 2000 were used as “warm up” to define appropriate initial conditions, and the latest five years from 2009 to 2013 were used for model validation of streamflow and total-nitrogen, while the sediment was validated from 2009 to 2011. For the Hanjiaying watershed, the periods of 2006–2011 and 2012–2014 were selected as the calibration and validation periods, respectively for flow, sediment, and total-nitrogen, while 2005 was used as the warm-up period. The simulation of SWAT and GWLF was conducted with a monthly time step and followed the calibration sequence: flow, sediment, and nitrogen.
Although multiple sets of parameters can obtain optimal fitting with the measured data, we only selected one of them as representation to facilitate comparison of both models.
Table 3 and
Table 4 show the parameters that were chosen and defined in this study. In SWAT, a sensitivity analysis was conducted prior to model calibration and more than 20 major parameters were selected in Tunxi and Hanjiaying. Calibration was manually and automatically conducted via SUFI-2 uncertainty analysis through the SWAT-CUP program [
47]. The SCS curve number (CN2) was the most critical parameter for both stations, which is directly related to the runoff yield. As the value of CN decreased, overland flow reduced, but infiltration potential increased. The base flow recession constant, αALPHA_BF, is a direct index of groundwater flow response to recharge from the vadose zone [
48]. Values vary from 0.1–0.3 for land with slow response to recharge to 0.9–1.0 for land with rapid response. The SLSOIL was the key parameter, which we chose to adjust the lateral flow yield. By default, it is equal to the value of the average slope length of the subbasin (SLSUBBSN), which tends to result in a high lateral flow ratio. Therefore, we appropriately reduced its value for both sites. In Hanjiaying, two additional parameters were considered due to their influence on the snowmaking process. SMTMP defines the base temperature above which snowmelt is allowed. SNOCOVMX is the threshold depth of snow above which the basin would be completely (100%) covered with snow. The soil property parameter SOL_K was also included because the soil categories in the Hanjiaying basin are relatively coarse. Parameters related to groundwater balance and channel routing were also taken into account. Seven parameters were chosen to calibrate the sediment simulation with respect to erosion, maximal sediment amount, and routing in the channel. For nitrogen, four parameters about nitrite and one parameter about organic nitrogen were considered. Furthermore, we distributed several parameters depending on landuse, soil texture, and slope. When the calibration of one variable was completed, we retained an unchanged parameter range and began calibration of the next variable, unless results were not satisfactory [
47].
For the GWLF, parameters related to watershed specific characteristics such as runoff source areas and populations were identified via GIS data analysis. Transport and nutrient parameters could be estimated using default coefficients according to [
49]. In this study, we used them as initial values and manually calibrated them. A total of 11 parameters were selected for calibration. The meaning of each parameter is listed in detail in
Table 3 and
Table 4. After model calibration, the values of input parameters remained unchanged during the validation process.
The model performance for fitting measured constituent data was qualitatively evaluated via time series plots and quantitatively evaluated via four widely used statistics in watershed model evaluation (
Table 5).
The coefficient of determination (R
2) indicates the degree of linear relationship between simulated and observed data. A R
2 value close to one indicates a better performance. However, it is very sensitive to extremely high values. The Nash–Sutcliffe efficiency (NSE) is one of the most commonly used criteria [
50]. This is a normalized statistic, which can be used to determine the goodness of fit. The NSE ranges from
to 1, with 1 indicating a perfect match. The squared difference in equation becomes the limitation of the NSE for overestimating higher values and neglecting lower values [
51]. Percent bias (PBIAS) is an error index, generally used to measure the deviation of the constituent of data. It calculates the average tendency of the simulated data to be either larger or smaller than their observed counterparts with zero indicating the optimal value [
52]. The RMSE (root mean square error)-observations standard deviation ratio (RSR) combines the feature of an error index RMSE and a normalization factor so that it can be applied to various constituents [
53]. RSR ranges from the optimal value of 0 to infinity and the smaller the RSR, the better the simulation results will be. Model performance was judged based on statistics performance ratings as previously recommended [
28,
53].
4. Conclusions
In this study, we conducted a comparison between two watershed models with different complexities and construction in two discrete sites that represent the semi-arid north and the humid south of China. According to the quantitative statistics and graphical techniques, both the SWAT and the GWLF model were capable of simulating monthly flow, sediment, and total nitrogen with adequate accuracy. They performed similarly well in terms of streamflow and sediment. Furthermore, GWLF outperformed SWAT in the Tunxi watershed, while it had opposite performance in Hanjiaying for nitrogen simulation. The main conclusions of our study are listed below.
- The performances of both models in arid areas were not as good as the performances in humid areas, indicating that climatic conditions could greatly affect the applicability of a given model.
- Due to the same adopted surface runoff calculation method (SCS CN), results of both models in monthly streamflow were quite similar, even though the complexity of the model structures was quite different.
- In contrast to GWLF, SWAT performed more dependable and robust in sediment and total nitrogen and could reproduce the fluctuations of the observed data more accurately due to its spatial property and more detailed description of reality.
- GWLF could provide similar or even better results and much closer average values to measured data than SWAT in some cases.
- Due to its simpler structure, GWLF requires fewer data to set up, less time to run, and is easier to be used than SWAT. However, it is not suitable for application in large catchments and cannot reflect spatial variations due to the absence of channel route and spatial topological relationship of land uses. Furthermore, GWLF is more dependent on the calibration process than SWAT.
Overall, the user friendly GWLF is more suitable for a basic analysis to support environmental management in data-deficient areas such as China, where the basic data required by SWAT are not always available or credible. Furthermore, SWAT has an advantage in areas where measured data are scarce and is more suitable for projects that require high accuracy.


